Article

Potato Leaf Chlorophyll Content Estimation through Radiative Transfer Modeling and Active Learning

1
College of Geomatics, Xi’an University of Science and Technology, Xi’an 710054, China
2
Information Technology Research Center, Beijing Academy of Agriculture and Forestry Sciences, Beijing 100094, China
*
Author to whom correspondence should be addressed.
Agronomy 2023, 13(12), 3071; https://doi.org/10.3390/agronomy13123071
Submission received: 21 October 2023 / Revised: 6 December 2023 / Accepted: 13 December 2023 / Published: 15 December 2023
(This article belongs to the Special Issue Remote Sensing in Smart Agriculture)

Abstract

:
Leaf chlorophyll content (LCC) significantly correlates with crop growth conditions, nitrogen content, yield, etc. It is a crucial indicator for elucidating the senescence process of plants and can reflect their growth and nutrition status. This study was carried out based on a potato nitrogen and potassium fertilizer gradient experiment in the year 2022 at Keshan Farm, Qiqihar Branch of Heilongjiang Agricultural Reclamation Bureau. Leaf hyperspectral and leaf chlorophyll content data were collected at the potato tuber formation, tuber growth, and starch accumulation periods. The PROSPECT-4 radiative transfer model was employed to construct a look-up table (LUT) as a simulated data set. This was accomplished by simulating potato leaves’ spectral reflectance and chlorophyll content. Then, the active learning (AL) technique was used to select the most enlightening training samples from the LUT based on the measured potato data. The Gaussian process regression (GPR) algorithm was finally employed to construct the inversion models for the chlorophyll content of potato leaves for both the whole and single growth periods based on the training samples selected by the AL method and the ground measured data of the potatoes. The R2 values of model validation accuracy for the potato whole plantation period and three single growth periods are 0.742, 0.683, 0.828, and 0.533, respectively with RMSE values of 4.207, 4.364, 2.301, and 3.791 µg/cm2. Compared with the LCC inversion accuracy through LUT with a cost function, the validation accuracies of the GPR_PROSPECT-AL hybrid model were improved by 0.119, 0.200, 0.328, and 0.255, and the RMSE were reduced by 3.763, 2.759, 0.118, and 5.058 µg/cm2, respectively. The study results indicate that the hybrid method combined with the radiative transfer model and active learning can effectively select informative training samples from a data pool and improve the accuracy of potato LCC estimation, which provides a valid tool for accurately monitoring crop growth and growth health.

1. Introduction

Leaf chlorophyll content (LCC) is an essential indicator for characterizing crop growth. At the same time, timely and accurate estimation of vegetation growth parameters is vital for global climate change studies, integrated monitoring of land use change, and estimation of total ecological resources [1,2]. The rapid, non-destructive, and accurate monitoring of chlorophyll content using high-spectral reflectance characteristics has become a crucial area of research for assessing crop growth status [3]. Currently, crop physiological and chemical parameters are obtained from empirical, chemical, and remote sensing [4]. Among them, the empirical method mainly relies on the subjective consciousness of researchers, which could be more conducive to the accurate acquisition of agronomic parameters. The chemical method is destructive, inefficient, and has a heavy workload. The remote sensing technique relies on analyzing spectral absorption, reflectance, and other crop growth characteristics to estimate crop physicochemical parameters. This method offers a non-destructive, quick, large-scale, and cost-effective means of estimating these parameters [5]. Hyperspectral remote sensing has emerged as a significant technological advancement in human earth observation since the 20th century. It enables monitoring and identification of surface materials by employing spectral response and multiple spectral processing techniques. Scholars have extensively investigated the application of hyperspectral remote sensing in vegetation studies, encompassing the estimation of nitrogen content [6], leaf area index [7], biomass [8], and water content [9]. Due to the advantages of good operability and efficiency, numerous scholars have utilized spectral reflectance data to estimate leaf and canopy scale LCC [10,11].
Inversion modeling is critical to effectively quantifying crop parameters. Several methods have been developed to estimate plant LCC from multi-scale spectral reflectance. Traditional methods typically rely on empirical relationships between crop parameters and sensitive spectral features, such as spectral bands and vegetation indices (VI), based on simple linear, polynomial, exponential, or logarithmic models. Delegido et al. predicted the chlorophyll content of nine crops, including garlic, alfalfa, and onion, with an R2 of 0.91 by using the NAOC Proba/CHRIS hyperspectral data [12]. Additionally, machine learning (ML) methods use a wider range of spectral features to deal with complex regression problems. Wang et al. employed random forest (RF) techniques to identify specific wavelengths in the spectrum that are sensitive to chlorophyll content in rice canopy leaves. Then, they developed a partial least squares regression model to estimate the chlorophyll content of maize leaves [13]. Ban et al. established an estimation model of LCC based on rice chlorophyll content using partial least squares regression (PLSR), support vector regression (SVR), and artificial neural network (ANN) methods [14]. Such methods are relatively simple and easy to use, but the empirical relationship between the two is susceptible to external factors (e.g., sensor, vegetation type, and background reflectance) [15]. However, the use of the radiation transfer model (RTM) is one of the various techniques for the quantitative inversion of vegetation physicochemical characteristics that has gained increasing attention. It follows specific physical laws, quantitatively describes the relationship between canopy structural parameters and canopy spectral reflectance, and is unaffected by vegetation. Currently, the main inversion methods based on RTM are (1) parametric inversion [16], (2) nonparametric inversion [17], (3) inversion based on physical methods such as look-up table (LUT) [18], and (4) hybrid methods [19]. Among them, the hybrid method uses RTM-generated data to train a machine-learning model to express the relationship between the two. It combines the simplicity of empirical statistical methods with the versatility of physical models. It provides more accurate and faster inversion of the biophysical and chemical parameters of reference crops than other methods [20]. Xu et al. coupled RTM with the Bayesian network model (BNM) for rice canopy chlorophyll content and leaf area index inversion [21]. Pascual-Venteo et al. compared two spectral dimension reduction strategies, namely GPR-20PCA and GPR-20BR. They found that the inversion results using the PCA strategy were slightly superior to band ordering with all variables. This suggests that the GPR-20PCA model exhibits higher fidelity [22]. Zhu et al. demonstrated that the hybrid model, in combination with Gaussian process regression (GPR) and the physical model, can accurately retrieve the canopy water content of crops, thus confirming that the approach is suitable for estimating canopy water content [23]. Antonucci et al. demonstrated that the combination of the PROSAIL model and the ML Suna method can better estimate biophysical traits [24]. The above approaches demonstrate that integrating MLRAs (Machine Learning Regression Analysis) with RTMs can yield successful inversion models for estimating biophysical and chemical parameters in crops.
The problem with RTM is that, particularly when LUTs are applied, the simulation data readily scales up to large samples with various variable selections. All input variables are systematically combined, and simulation data created in this manner can be redundant because slight variable changes can result in very similar spectra. Typically, there are three types of sample reduction or “downsizing” methods: random sampling (RS), active learning (AL), and progressive sampling (PS). RS is the simplest way to reduce the dataset, but in RS, there is neither an attempt to present the final training dataset as informative as the entire data pool nor a search for the smallest possible sample [25]. PS employs the concept of learning curves [26]. It endeavors to add training samples until the model’s accuracy stabilizes incrementally. For instance, if the sample growth is too rapid, the training dataset might become overlarge, surpassing the actual requirement. Conversely, excessive computational demands could arise for convergence testing [25]. Among these three categories, AL is an efficient technique designed to improve the accuracy and performance of the model by selecting the training dataset through intelligent sampling [27]. It obtains better accuracy and performance with the least amount of training data.
Recently, active learning has been increasingly applied to computer vision classification tasks. For many machine learning tasks, such as image classification, object tracking, image segmentation, and change detection, etc., labeling samples means very heavy workloads and high costs. Liu et al. introduced different selector types in active deep learning and summarized three essential factors for selector design [28]. Gular et al. evaluated and trained five widely used deep learning models, namely AlexNet, VGG16, InceptionV3, MobileNetV3, and EfficientNet, based on the sunflower disease image dataset. The results show that the deep learning models used are effective for sunflower disease classification and demonstrate the potential of deep learning for early disease detection and classification [29]. Gular used artificial intelligence methods and transfer learning to categorize different types of fruit data. The results show that the AI approach achieves better results in classification and that transfer learning plays an important role in achieving better results [30]. Dhiman et al. used machine learning, deep learning, and statistical techniques for disease prediction, detection, and classification of citrus fruits. The effectiveness and classification accuracy of these methods were further explored [31]. In addition, this study used the AL method to screen the samples to further improve model performance. Verrelst et al. suggested that AL offers RTM training data for building inverse models [32]. Wan et al. demonstrated that the AL method can improve the accuracy of chlorophyll content inversion based on canopy and UAV data [33]. Guo et al. constructed a hybrid model consisting of the PROSAIL model and GPR algorithm and at the same time, introduced the AL strategy to invert the chlorophyll content of maize leaves and canopies, and the results showed that the AL strategy could improve the accuracy of maize chlorophyll inversion [34]. Wocher et al. suggested integrating the RTM with ML algorithms and enhancing the training set by incorporating AL techniques. As a consequence, there was an enhancement in the accuracy of the model [35].
Nevertheless, a significant portion of this research included using ground datasets in the AL-tuning processes or discovered that developed models had limited applicability when applied to independent datasets from other times or locations. The objective of the current study is to evaluate the quantification of potato LCC inversion models for different potato growth periods. In this work, experimental ground measured data for potatoes at different growth periods were used as labeled samples to select a model training sample from the LUT dataset produced by the PROSPECT-4 model using six AL algorithms. The potato LCC was then estimated using the hybrid method, which integrates RTM, GPR, and AL and the LUT inversion method, which relies on a cost function (CF). The objectives of this study are (1) to evaluate the performance of six different AL algorithms in model training data selection and (2) to evaluate the hybrid and LUT-CF methods in terms of potato LCC inversion. The information supplied will be helpful for developing a hybrid model for potato LCC and improve the understanding of the effectiveness of AL approaches in training sample selection. The information supplied by this study will be valuable for developing a hybrid model for potato LCC and enhancing comprehension of the efficacy of AL techniques in the selection of training samples. This method may be used in future research to monitor other biophysical parameters for the purpose of guiding the growth and nutrition management of potatoes and other crops.

2. Materials and Methods

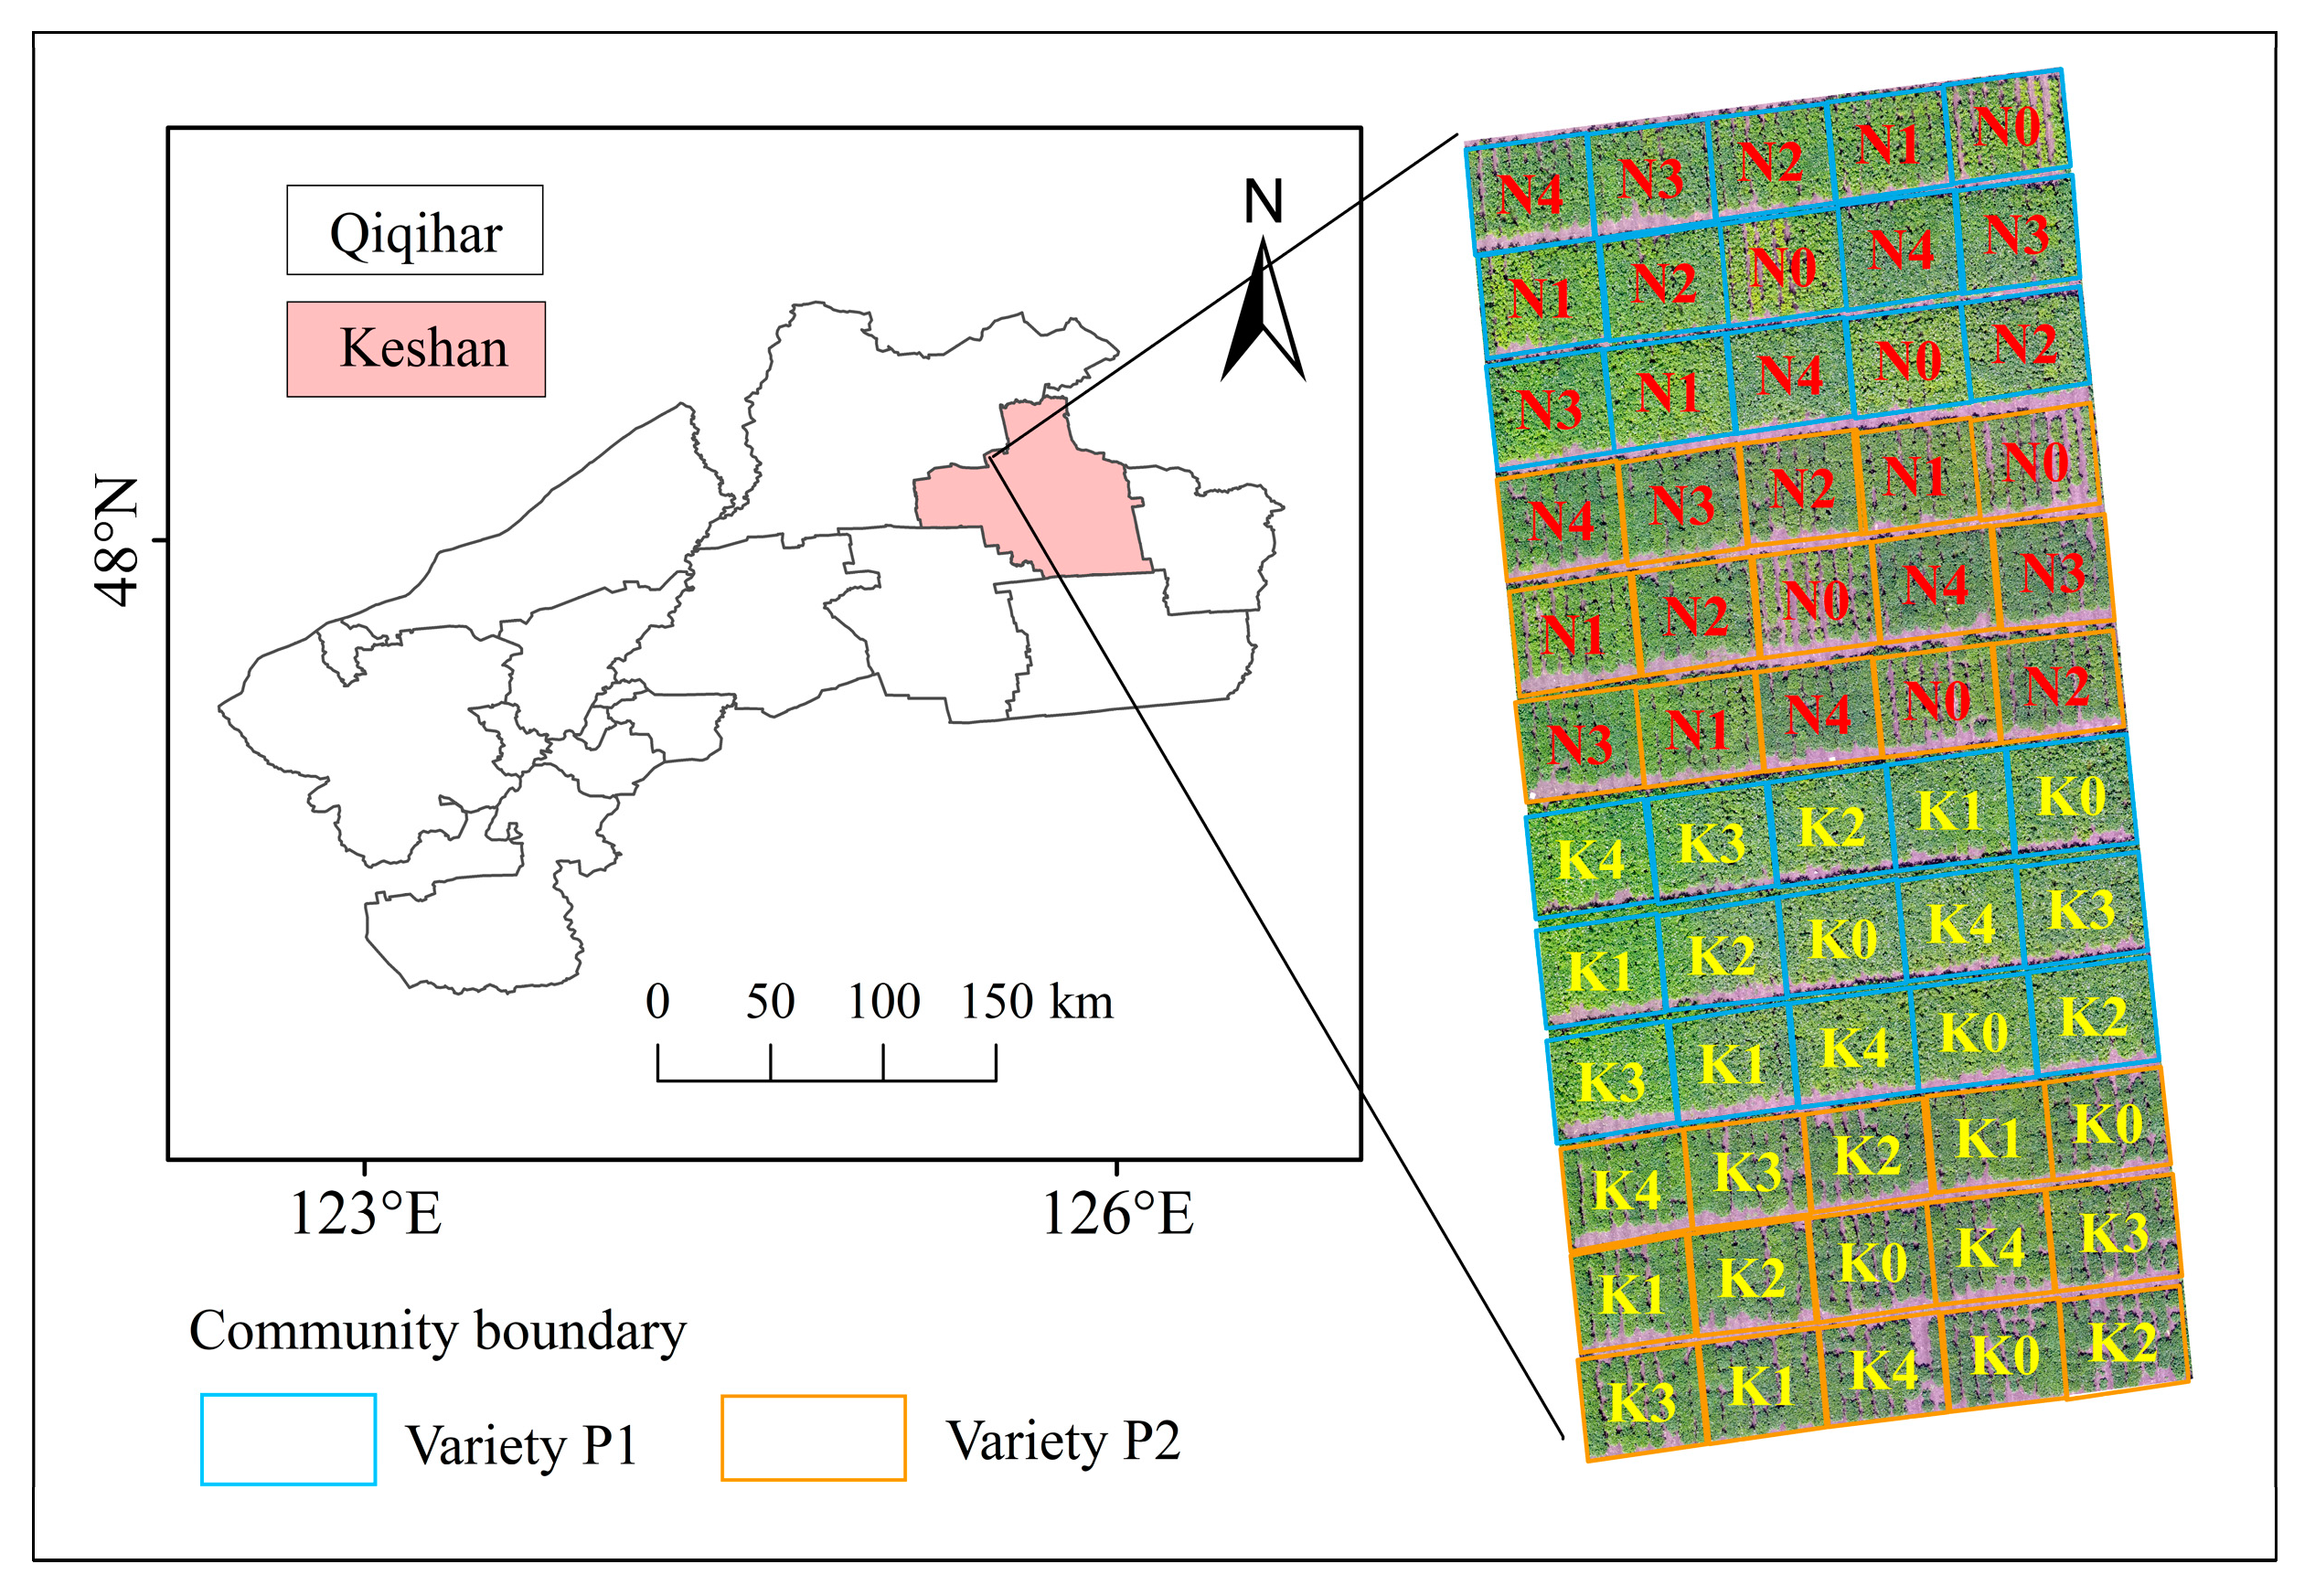
2.1. Experimental Design

The experiment was carried out in the Science Park of Keshan Farm (E 125°07′40″–E 125°37′30″, N 48°11′15″–N 48°24′07″) of Qiqihar Branch of Heilongjiang State Administration of Land Reclamation in 2022. Keshan Farm is located in northeastern China, specifically at the western foot of the Xiaoxinganling Mountains and the northeastern Songnen plain, and has hilly terrain and fertile soil. The average annual temperature was 1.3 °C but has been 2.1 °C in the past ten years. The extreme maximum temperature is 36.5 °C, the minimum temperature is −37.6 °C, and the annual precipitation is about 502.5 mm. It is an important potato planting area in China.
Potatoes were sown on 13 May 2022 with a 90 cm width of ridge. The experiment consisted of two varieties, Kenshu 1 (P1) and Nei-9 (P2), with different nitrogen and potassium fertilizer gradients. Each potato management plot is five meters long and eight rows wide, and the plot area is 36 m2. Potato mid-tillage cultivation was conducted on 25 May. The base fertilizer was applied at the same time as the potato sowing on 13 May 2022, and the top dressing was applied on 2 June 2022. The distribution of the experimental plot is as follows (Figure 1).
In this study, five gradient nitrogen fertilizer treatments, 0, 60, 150, 200, and 250 kg N/ha, were set for N0, N1, N2, N3, and N4 with 3 replicates and 30 plots. Nitrogen fertilizer was applied at a 7:3 base fertilizer and topdressing ratio during the potato sowing and budding periods. Phosphorus and potassium fertilizers were applied as base fertilizers in one go. Additionally, five gradient potassium fertilizer treatments of 0, 60, 150, 200, and 250 kg K2O/ha were set, namely K0, K1, K2, K3, and K4, with three replicates and 30 plots. Potassium fertilizer was also applied at a 7:3 base fertilizer and topdressing ratio during the potato sowing and budding periods. Nitrogen and potassium fertilizers were both applied as base fertilizers in one go.

2.2. Data Acquisition

In this study, the PROSPECT-4 model was employed to construct a look-up table (LUT) and generate 2000 simulation training sets. Data collection for the experiment was conducted throughout three distinct periods of potato tuber development: the potato tuber formation period (TFP) on 21 July 2022, the tuber growth period (TGP) on 8 August 2022, and the starch accumulation period (SAP) on 28 August 2022. The spectral reflectance and leaf chlorophyll content (LCC) data of potato leaves were collected simultaneously.

2.2.1. Spectral Measurement of Potato Leaves

The spectra of potato leaves were determined using a (Analytical Spectral Devices) Fieldspec FR2500 (Inc., Boulder, CO, USA) field spectrum radiation spectrometer and a leaf clip probe. The ASD spectrometer had a range of 350–2500 nanometers, with a spectral resolution of 1.4 nanometers between 350 and 1000 nanometers and 2 nanometers between 1000 and 2500 nanometers. Three robust plants’ leaves were chosen for analysis in the experimental field. For spectral analysis, the initial spreading leaves of three potato plants were picked. The average value of 10 random measurements (with veins omitted during testing) was used to determine the reflectance of a particular leaf.

2.2.2. Determination of Leaf Chlorophyll Content

After spectral measurement, the leaves were cut in the field with scissors and sent to the laboratory for chlorophyll determination. In each experiment, samples N1 through N30 were collected on the first day, while samples K1 through K30 were collected on the second day. Then, a hole punch with a diameter of 1 cm was used to punch the leaves. The weight of the samples was recorded. Then, the sample piece was cut and mixed. The sample weighed about 0.2 g and was put into a graduated test tube containing 80 mL of 95% ethanol, then placed in the dark and shaken once a day. Until the leaves turned white (3–7 days), the absorbance values of ethanol solution at visible light at 440 nm, 649 nm, and 665 nm were measured by the spectrophotometer (The leaves of N1–N30 started to turn white on the fourth day of testing, and K1–K30 started to turn white on the fifth day of testing). The content of chlorophyll (a + b) (Chl(a + b), µg/cm2) was calculated according to Lichtenthaler’s method [36,37]. It was calculated using Equations (1) and (2):
Chl ( a + b ) ( mg / g ) =   Cab   × V / 1000 / m
Chl ( a + b ) ( µ g / cm 2 ) = ( Cab × V ) / S
where Cab is the total concentration of chlorophyll a and chlorophyll b in mg/L, V is the volume of 95% ethanol solution in ml, m is the fresh weight of the leaf in g, and S is the standard leaf area in cm2.

2.3. Data Analysis Flow and Methods

Figure 2 illustrates the flow of data analysis employed in this study. The research methods involved are described in detail as follows.
The PROSPECT-4 model was used in this study to produce a look-up table (LUT) dataset based on previous knowledge and the measured data obtained from the potato experiment conducted in 2022. Subsequently, two approaches were used to inverse the LCC in potato. The hybrid method involves the integration of three methodologies: radiative transfer model (RTM), active learning (AL), and Gaussian process regression (GPR). Another technique that was used is the LUT inversion approach, which relies on a cost function (CF). Then, a comparative analysis of the accuracy between the LUT CF technique and the hybrid approach was performed using the experimental measured data. In this study, a total of 2000 simulated datasets were generated for the data pool using the PROSPECT-4 model, which was generated based on MATLAB2018b (MathWorks, Inc., Natick, MA, USA) and the automatic radiative transfer model (ARTMO v.3.30). The AL algorithmic program and GPR algorithm were also performed using MATLAB and ARTMO.

2.3.1. PROSPECT-4 Model and LUT Generation

The present study employed PROSPECT-4 to simulate the spectral reflectance of potato leaves for the LUT training data. PROSPECT is a leaf optical model replicating the directional hemisphere reflectance and transmittance in the solar spectral range of 400–2500 nm for various green monocotyledonous and dicotyledonous plant species and aged leaves. Four input parameters comprise the model: leaf structure (N), matter content (Cm), chlorophyll content (Cab), and equivalent water thickness (Cw) [38,39,40]. In order to maintain the independence of PROSPECT-4 input parameters, the probability density function employed a uniform distribution to guide the selection of parameter values. This study involved the integration of measured parameter values from the potato experiment and the utilization of relevant literature to establish the thresholds for each parameter. Based on the empirical data obtained from the test conducted in 2022, the Latin hypercube sampling technique was employed for spectrum simulation. This method involved selecting two measured sample values to replace a single step in the process. Table 1 presents the thresholds for input parameters of the PROSPECT-4 model.
A global sensitivity analysis (GSA) was performed in this investigation to evaluate the sensitivity of the input parameters of the PROSPECT-4 model. The primary objective was to assess how much each input variable contributes to the unconditional variance of the model outputs [41]. This research investigated the complete range of input variables utilizing GSA for the PROSPECT-4 model’s input parameters, which aimed to ascertain the critical variables and ranges necessary for the inversion of chlorophyll content in leaves via leaf hyperspectral data.

2.3.2. Active Learning

Active learning (AL) algorithms [19] integrate new samples based on uncertainty or diversity criteria to improve the accuracy of a model in observed regression problems [42]. The selected criterion algorithms can rank samples according to the uncertainty of a sample or its diversity [15]. It mainly includes six basic algorithms: variance-based pool of regressors (PAL) [43], entropy query by bagging (EQB) [44], residual regression AL (RSAL) [45], Euclidean distance-based diversity (EBD) [43], and angle-based (ABD) [46] and cluster-based diversity (CBD) [47]. A detailed description of the various algorithms is given in Table 2. It has been shown in the literature that it improves the inversion accuracy and mitigates some of the discomforts in hybrid inversion methods [48].
This study employs the PROSPECT-4 model to generate a total of 2000 simulated datasets for the data pool. Since it is impracticable to obtain a regression model using every sample in the data pool, an ordinary and straightforward method to reduce its size is to randomly select a subset of samples from the data pool. As all samples are treated equally, this approach does not inherently facilitate the selection process (redundant and noisy samples are included). AL methods require selecting a limited training set from the unlabeled data pool according to labeled data—the measured spectrum reflectance and variable pairings in this case—under effective query strategies or selection criteria [49,50]. The selected samples are labeled and added to the training set until it becomes optimal [32]. The selection criteria is crucial not only for enhancing comprehension of the efficacy of the AL techniques in selecting training samples but also for their potential contribution to the hybrid model for potato LCC.

2.3.3. Gaussian Process Regression

The Gaussian process (GP) is a set of finite random variables that all obey the joint Gaussian distribution [51]. The GP is essentially a multivariate Gaussian distribution [52], and its properties are completely determined by the mean and covariance functions. The GP can be expressed as [53] (Equation (3)):
f ( x ) ~ GP ( m ( x ) , k ( x , x ) )
where f ( x ) is the mean function and covariance function process of the gaussian distribution function, and m ( x ) = E [ f ( x ) ] ,   k ( x ,   x   ) = E [ ( f ( x ) m ( x ) ) (   f   ( x ) m (   x   ) ) ] .
The GPR was proposed by Rasmussen and Williams [53] in 2005 as a probabilistic method to train a GPR model to find a single function of all training data by fitting the mean and covariance functions. The common models of GPR are (Equation (4)) as follows:
y = f ( x ) + ε  
where y is the observed value, and ε is Gaussian noise that follows an independent distribution, ε ~ N ( 0 , σ 2 ) .

2.4. LCC Modelling and Accuracy Assessment

2.4.1. LCC Inversion Based on LUT and Cost Function

LUT inversion is primarily a direct comparison of LUT spectra with remote sensing observations via cost function(CF), also referred to as a distance, value function, metric, or scatter metric in some cases, and is part of most inversion methods [54,55]. The CF is used to produce a value for one or more biophysical parameters by minimizing the summed difference between the simulated spectral reflectance and the measured spectral reflectance at all wavelengths [56]. In this research, it selected five CFs, namely root mean square error (RMSE) [57,58], contrast function (K(x)) [18], minimum contrast estimation (MCS) [59], Laplace distribution (LD), and normal distribution-LSE [60], and it used them to analyze simulated spectral reflectance and measured spectral reflectance data. The objective was to use the LUT approach on the corresponding LCC values to determine the optimal fit of the simulated spectra to the measured reflectance spectra.

2.4.2. Hybrid Modeling Approach

This study also used a hybrid modeling approach (HM) [61] to construct a potato LCC estimation model. This approach generally combines machine learning (ML) algorithms with physical methods (such as RTM). In this study, the simulation LUT dataset generated by the RTM PROSPECT-4 model was used as the data pool, and the training samples were then screening by AL. Six different AL algorithms (EBD, CBD, ABD, PAL, RSAL, and EQB) were used to select the optimal modeling samples, and the LCC inversion model for potato leaves during the whole plantation period and tuber formation period, tuber growth period, and starch accumulation period were then constructed via GPR algorithms [51,52,53]. In this work, the hybrid model is called GPR_PROSPECT-AL, and the model was also applied to different growth periods of the potatoes.

2.4.3. Model Accuracy Assessment

The accuracy and stability of the model were verified by the actual sample data measured in the field. The coefficient of determination (R2) and the RMSE were used as the indicators to evaluate model accuracy. The formulae for the relevant indicators are as follows (Equations (5) and (6)):
R 2 = 1 SSE / SST
RMSE = 1 n i = 1 n ( si fi ) 2
where SSE is the residual sum of squares of the samples, and SST is the sum of squares of the deviations. In Equation (5), n is the number of samples, and fi and si are the measured and predicted values, respectively.

3. Results and Analysis

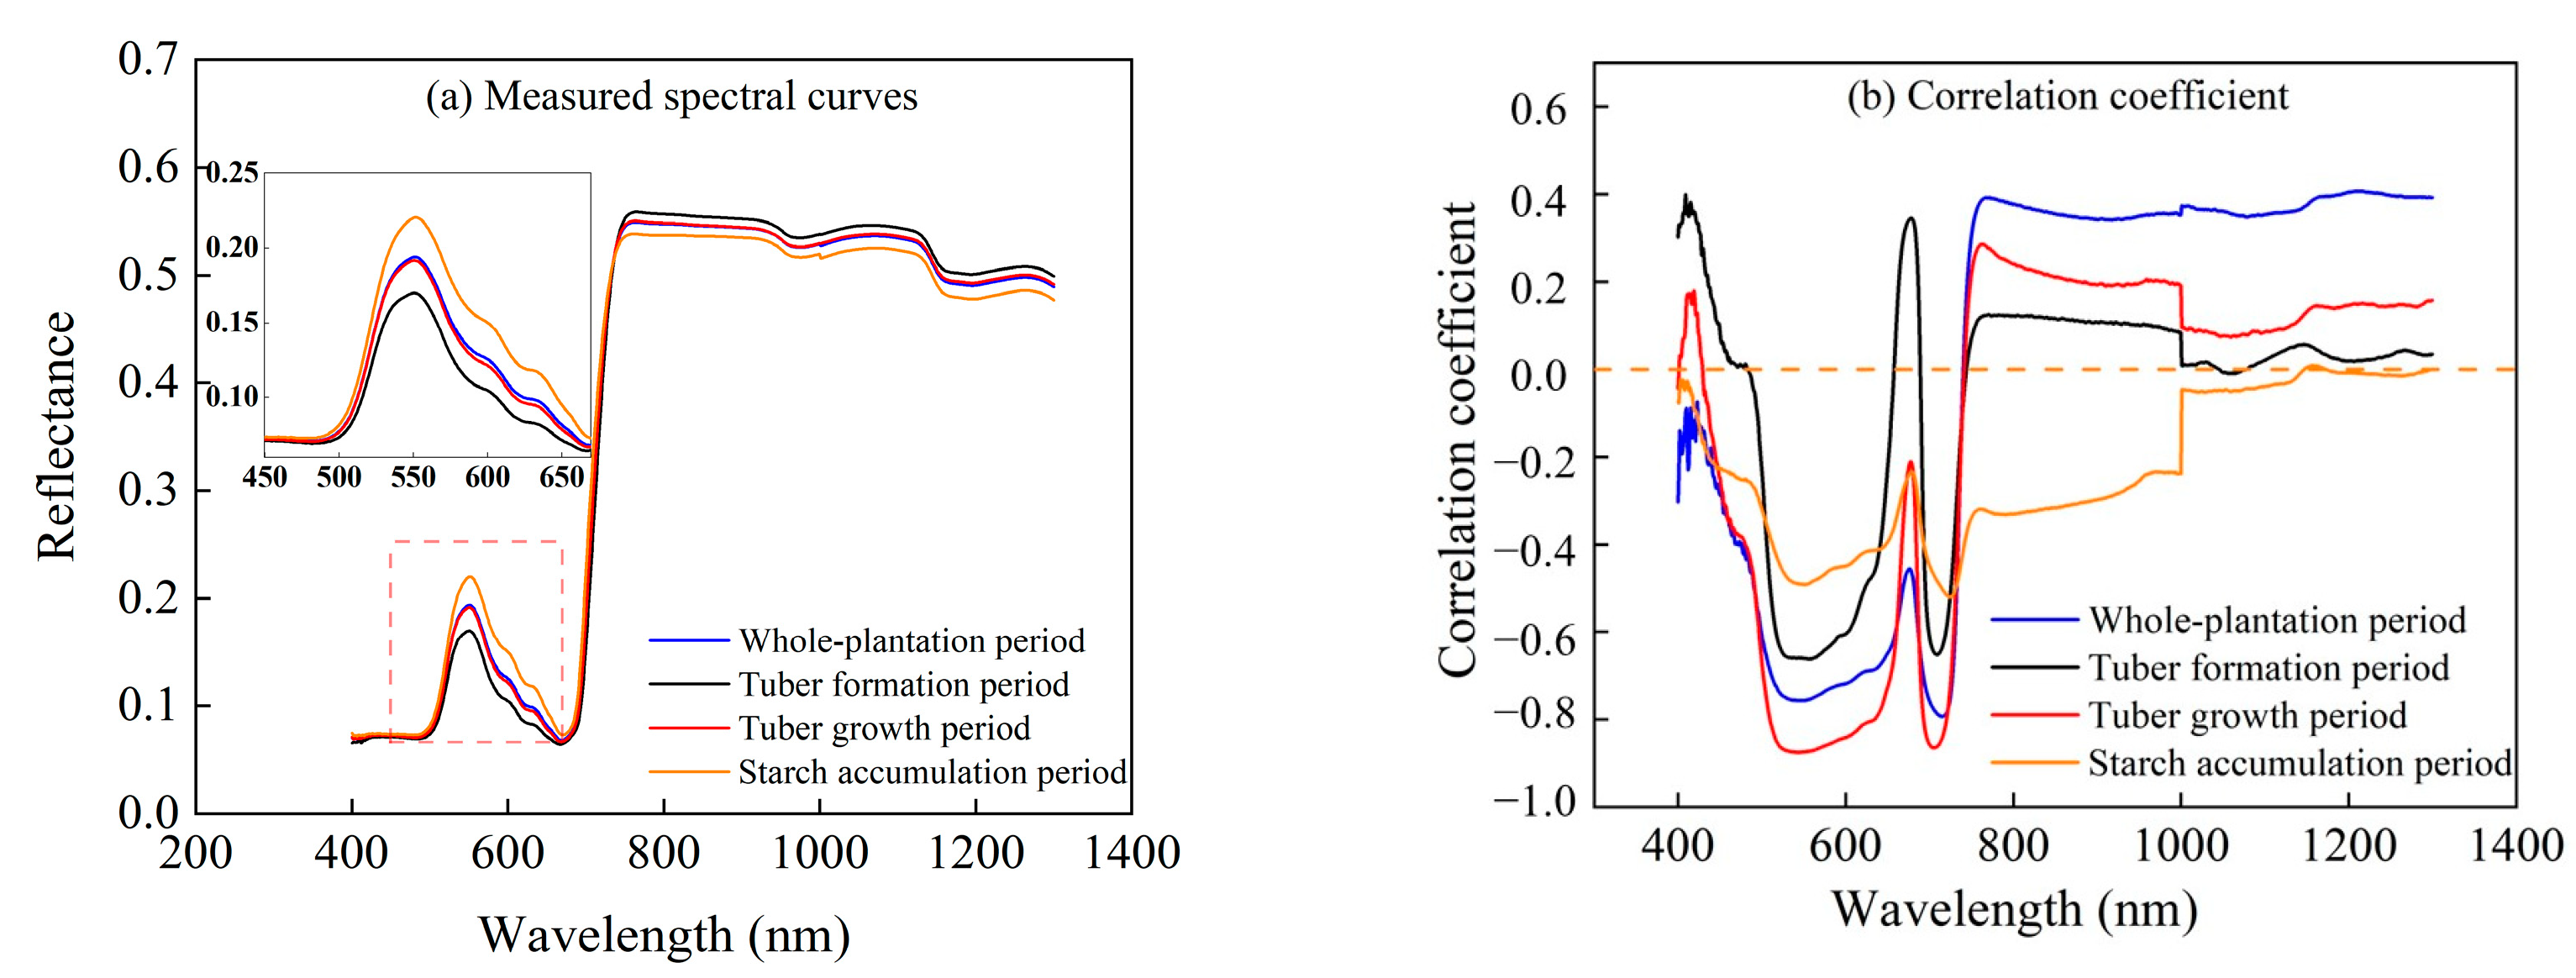
3.1. Relationship between Measured LCC and Spectrum

This investigation involved the measurement of LCC and corresponding spectral data in 60 potato plots throughout three different growth periods. The potato LCC and leaf spectra were measured in the potato tuber formation period on 21 July 2022, the tuber growth period on 8 August 2022, and the starch accumulation period on 28 August 2022. The statistical information of LCC for potatoes in three different growth periods is listed in Table 3.
Figure 3 depicts the distribution of mean measured potato leaf spectral reflectance for all samples at different growth periods and the correlation between LCC and spectral reflectance of potato leaves at different growth periods.
The spectral reflectance trend during the whole plantation and single-growth periods is identical, as shown in Figure 3a. Both increase at the 400 nm wavelength band, climax near the 560 nm reflectance region, and then decrease. A reflectance valley is observed near 700 nm, followed by a sharp ascent to a plateau of exceptionally high reflectance. During the tuber formation period, it was observed that the spectral reflectance of potato leaves was at its minimum at the green peak and its maximum at the near-infrared platform. The reflectance of potato leaves exhibited an increase at the green mountain and a drop at the near-infrared platform as the growth of the potato plant progressed. This is because the potato undergoes a period of rapid growth beginning with tuber formation, during which the LCC and plant leaf area increase faster, thereby enhancing photosynthesis’ ability to absorb sunlight. Following the tuber growth period, the spectral reflectance gradually reaches its maximum value; at this point, the leaf area and chlorophyll content also reach their maximum values. Subsequently, as the potato matures, leaf nutrients begin to diminish. Consequently, while the spectral reflectance decreases during the starch accumulation period, it remains more significant than during the other two growth periods.
Figure 3b illustrates the correlation coefficient between the spectra and LCC at the whole and single growth periods in 2022. A consistent negative correlation appears between LCC and spectral bands within the visible 400–740 nm interval during the potato whole plantation period. Notably, all spectral bands were substantially correlated with LCC within the visual 458–734 nm interval (r(0.001) = 0.249, n = 180) with a correlation coefficient of 0.249. The optimal values were observed at the 545 nm and 715 nm troughs, where the correlation coefficients were −0.756 and −0.793, respectively. Meanwhile, consistently inverse correlations were observed between the LCC and spectral reflectance in the visible-light interval during the starch accumulation period, tuber formation period, and tuber growth period. This is mainly due to the fact that the visible light band produces two absorption valleys (around 660 nm red light and 450 nm blue light) and reflection peaks (at 550 nm green light). This corresponds to the change in LCC.

3.2. LUT Generation with PROSPECT-4 Model

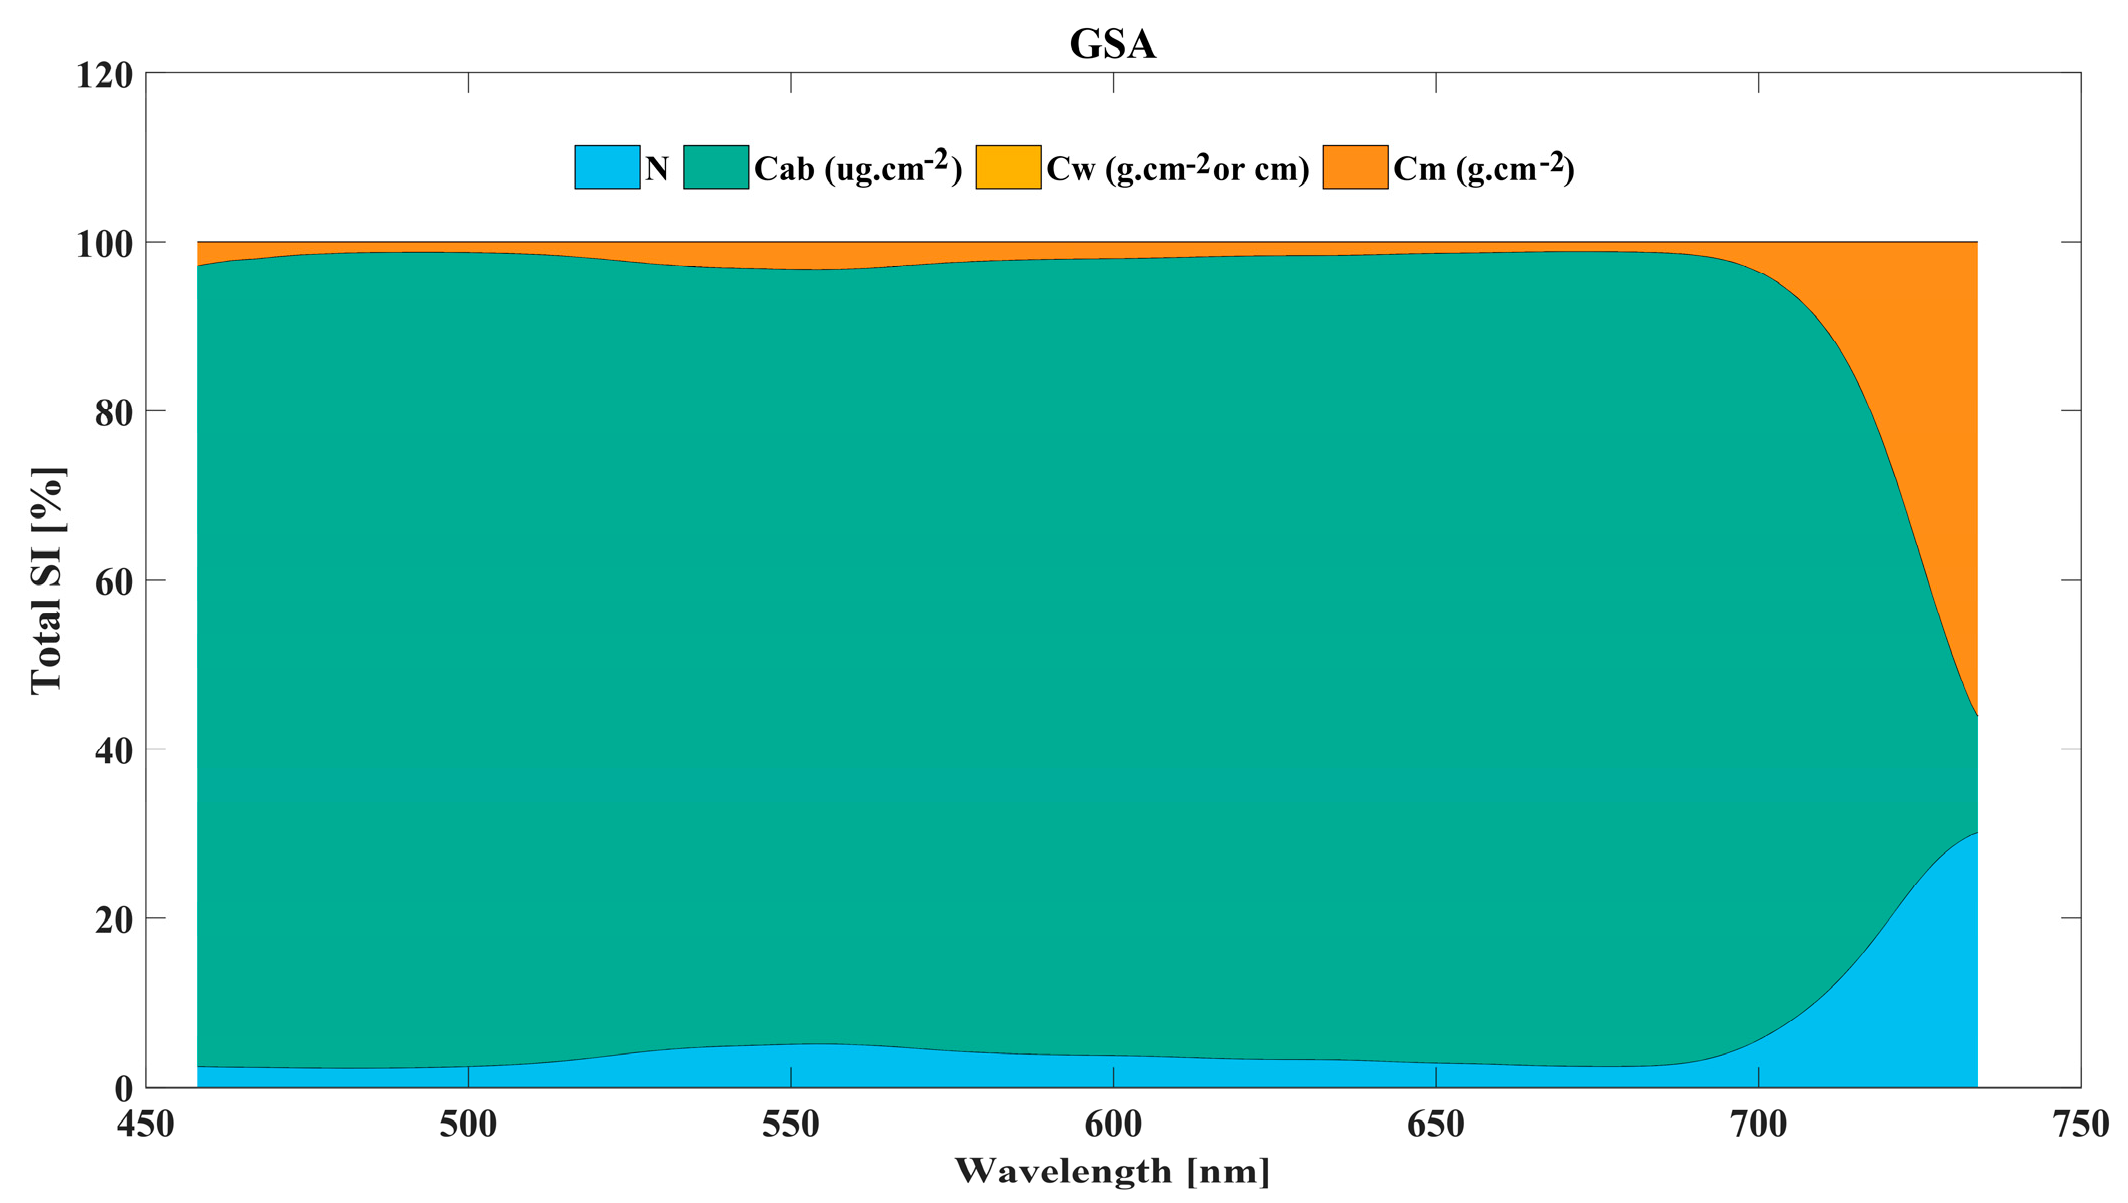
3.2.1. Global Sensitivity Analysis of PROSPECT-4 Model Input Parameters

This study used the PROSPECT-4 model to build a LUT dataset for potato leaves with input parameters including Cab, Cw, N, and Cm. Before constructing the LUT, a GSA was performed on the model input parameters to determine the relative contribution of the input variables to the constructed model. As shown in Figure 4, in the visible part of the spectrum, Cab contributes about 95% to the spectral reflectance and transmittance of the leaf, followed by N and Cm with 2.5% and 1.5%, respectively, while Cw has a small effect on the reflectance of the leaf in this range. Therefore, this study selected the visible light band 458–734 nm as the research interval.

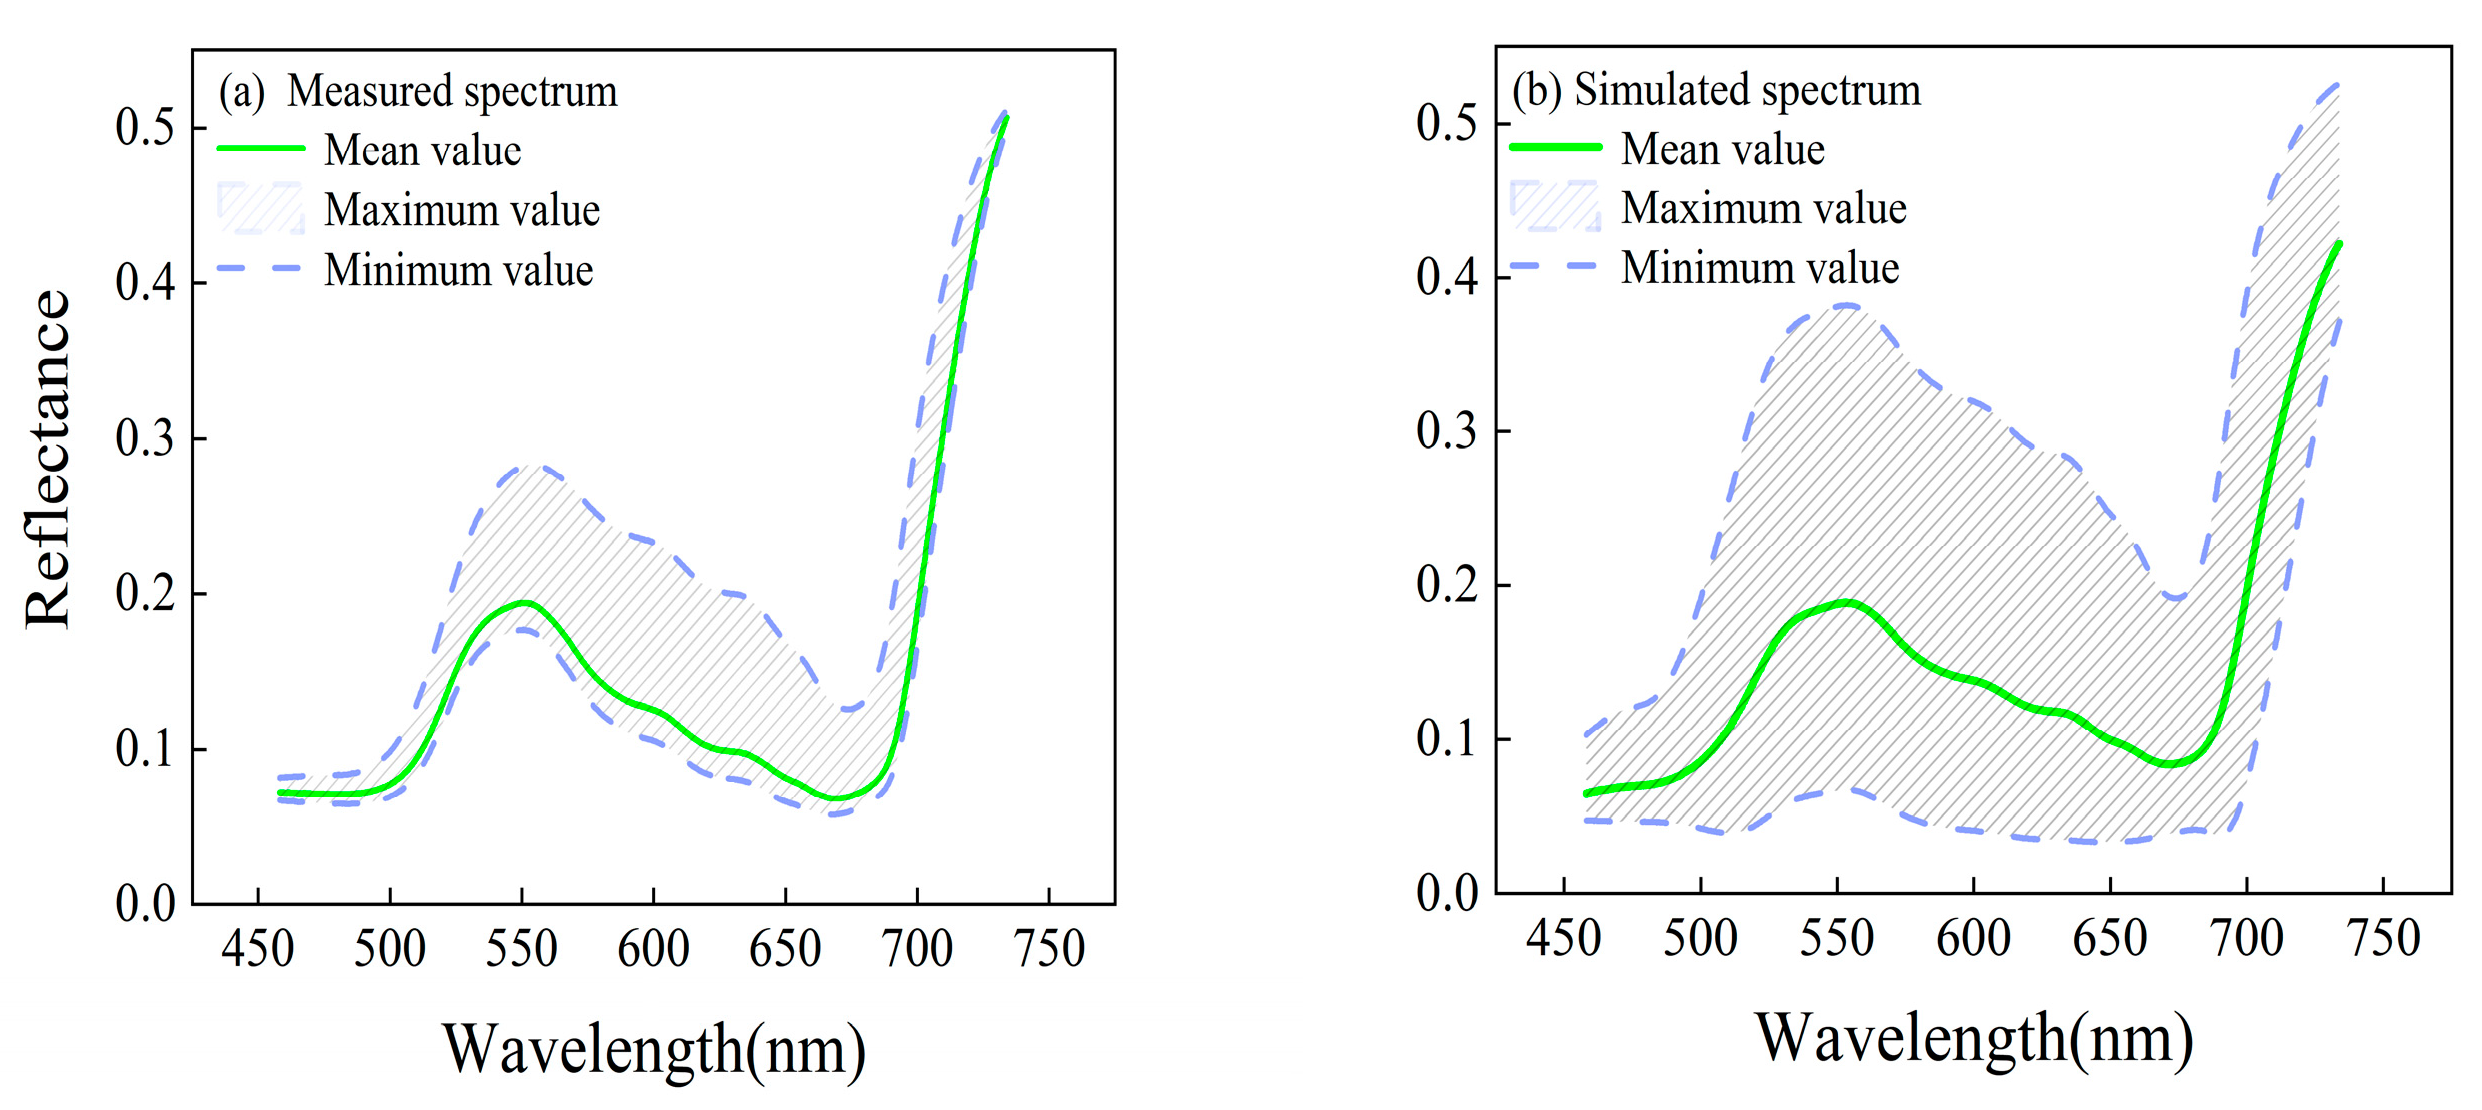
3.2.2. PROSPECT-4 Input Parameters and LUT Generation

In this study, the PROSPECT-4 input parameters include the following—N: 1.5–2.5; Cab: 0–70 µg/cm2; Cw: 0.001–0.08 g/cm2; and Cm: 0.0001–0.05 g/cm2. These parameters were defined based on relevant literature as well as measured data, and the model was then run to simulate the corresponding spectral reflectance of the leaves. Based on previous studies and related literature, 2000 simulations were chosen to establish the LUT in this study.
The measured leaf spectral data and the simulated spectral data of PROSPECT-4 at three different potato growth periods were compared, as shown in Figure 5. The spectral curves show similar spectral change trends for the measured and simulated spectral datasets. The maximum peak is around 550 nm, which indicates that the PROSPECT-4 model can better model the spectral reflectance consistent with the actual situation. The simulated data and the spectral data can fully cover the range of the measured spectral data. This provides a large amount of sample data for later model construction.

3.3. Potato LCC Inversion

3.3.1. GPR_PROSPECT Combined with AL Modeling Inversion

In this study, the AL algorithm was used to select the modeling samples, after which the inversion model of LCC of potato leaves at whole- and single-growth periods was constructed based on the hybrid GPR_PROSPECT-AL method. Table 4 displays the findings of several AL approaches employed to investigate the LCC inversion outcomes of potato leaves across different growth periods. As label data, 180 ground-measured samples were used to select model training samples from the LUT dataset for the whole plantation period of potatoes in this study. Subsequently, the label data consisting of the ground-measured samples (n = 60) from various potato growth periods were employed to select the most suitable modeling samples from the LUT data pool for each period. The value of R2, NRMSE, and the efficiency of algorithm were used as evaluation metrics to assess different AL methods. Finally, the AL method with the highest R2, lowest NRMSE, and shortest time was adopted as the AL method used in this study. The number of training samples from different growth periods selected for the best AL technique was determined to be the optimal number of samples when the root mean square error (RMSE) was at its minimum. For the whole plantation period data, the R2 of the GPR_PROSPECT-AL model based on the EBD algorithm was 0.742, the NRMSE was 9.743%, and the model runtime was 0.026 s, which had certain advantages. During the period of potato tuber formation, the GPR_PROSPECT-AL inversion model, utilizing the EBD algorithm, exhibited an R2 value of 0.683, an NRMSE value of 0.118, and a computational time of 0.026 s. Similarly, during the potato tuber growth period, the inversion model based on RS yielded an R2 value of 0.828, an NRMSE value of 0.088, and a computational time of 0.026 s. Lastly, during the potato starch accumulation period, the inversion model based on the EBD algorithm achieved an R2 value of 0.553, an NRMSE value of 0.103, and a computational time of 0.003 s. Figure 6 shows the variation of RMSE values with the number of samples for different growth periods of potatoes when selecting the training samples based on the optimal AL algorithm. The selection results of training samples for the optimal AL method for chlorophyll modeling in different growth periods of potatoes were 172 for the whole plantation period, 163 for the tuber formation period, 129 for the tuber growth period, and 201 for the starch accumulation period.
The present work employed an AL technique to select the best modeling samples from the PROSPECT-4 LUT dataset. Subsequently, potato LCC inversion models were developed for both the whole plantation period and single growth period using the GPR algorithm. The accuracy of these models are depicted in Figure 7.
As can be seen from the figure, the GPR_PROSPECT-AL model for whole plantation period (n = 172), with an R2 of 0.978, RMSE of 2.869 µg/cm2, and NRMSE of 4.202%. When applying the AL method to the potato single growth period, R2 reached 0.976, 0.965, and 0.944 during the potato tuber formation period (Figure 7b, n = 129), tuber growth period (Figure 7c, n = 163), and starch accumulation period (Figure 7d, n = 201), respectively.

3.3.2. Chlorophyll Inversion Based on LUT CF Method

The potato LCC was also inversed by the LUT CF methods. Five CFs—RMSE, contrast function (K(x)), minimum contrast estimation, Laplace distribution, and normal distribution-LSE—were used to process 2000 simulated spectral reflectance data and observed spectral reflectance data. Subsequently, the best-performing CFs were selected for data screening and parameter inversion of the LUT across the whole plantation period, tuber formation period, tuber growth period, and starch accumulation period. The results of spectral screening are depicted in Figure 8.
Figure 8a–d shows the selected simulated spectrum based on the normal distribution-LSE and Laplace distribute function. It is evident from this graph that the selected simulated spectral reflectance and measured spectral reflectance match well for both the whole plantation and single growth periods. While in the range between 458 and 500 nm, the reflectance of the simulated spectrum differs from that of the measured spectrum, and the simulated spectral value is less than the measured value. Similarly, in the range between 650–700 nm, the simulated spectral reflectance aligns consistently with the measured spectral reflectance when using measured data for the whole plantation period. This is because within this range, the reflectance of visible vegetation surfaces is generally low and changes gradually. The chosen normal distribution-LSE CF appears to contribute to achieving a better match between simulated and measured spectral reflectance in this range. Next, based on the normal distribution-LSE and Laplace distribution, the optimal simulated spectral reflectance corresponding to LCC for the whole plantation period, tuber formation period, tuber growth period, and starch accumulation period are 18.421–46.222, 29.470–47.092, 18.421–39.732, and 14.396−21.477 µg/cm2, respectively. Some of the minimal values are relatively higher than the measured LCC ranges of 8.716–45.718, 25.304–51.123, 8.716–34.828, and 10.526–33.4967 µg/cm2. This could be attributed to the smaller sample size in the single growth period, localized search by the CF, or an incomplete improvement of the inversion’s ill-posedness by the CFs. However, most optimal simulated spectral reflectance values correspond well with the measured LCC values. Hence, the above results of the optimal spectral selection are utilized for model validation.

3.4. Validation of Inversion Model for Potato Chlorophyll Content

In order to verify the generalization ability of the inversion model, this study verified the accuracy and stability of the potato LCC model based on the measured dataset, in which, for the GPR_PROSPECT-AL and LUT_PROSPECT models, the accuracy during the whole plantation period was verified by using all the samples (180) of three different growth periods of the potatoes, while for the different single growth periods, the actual measured 60 validation samples were used for model validation. The results are shown in Figure 9.
Figure 9a presents the validation results for the GPR_PROSPECT-AL model. The validation accuracy for the whole plantation period model is R2 = 0.742, RMSE = 4.207 µg/cm2, and NRMSE = 9.921%. In Figure 9a1, the validation results for the LUT_PROSPECT CF model are shown with a validation accuracy of R2 = 0.623, RMSE = 7.970 µg/cm2, and NRMSE= 21.539% for the whole plantation period. The research findings indicate that when using the AL method, the validation accuracy of the whole plantation period inversion model increases by 0.119 compared to the traditional LUT inversion method, demonstrating the effectiveness of the AL method in enhancing model precision. The validation accuracy of the GPR_PROSPECT-AL model for potato during a single growth period is R2 = 0.683, 0.828, and 0.533, as shown in Figure 9b–d. The validation accuracy of the LUT CF algorithms is shown in Figure 9b1–d1, where the R2 values from the tuber formation phase to the starch accumulation period are 0.483, 0.500, and 0.278, respectively. It can be seen that the potato LCC model constructed based on the AL method (Figure 9a–d) was superior to the model constructed by the LUT CF method, which is because the AL method can select samples in a large number of simulated datasets that better match the measured data, thus improving the inversion accuracy.

4. Discussion

4.1. AL for Hybrid Retrieval Methods

In this study, AL was employed to select the most informative training samples from the LUT dataset, and the study results revealed that AL can improve the compactness, diversity, and richness of the data through intelligent sample selection. Meanwhile, applying the AL method to a large simulated training dataset selection creates an opportunity to improve the accuracy of regression model predictions. This study revealed that AL diversity criteria (EBD) generally performed the best both in terms of reaching high accuracies as well processing time, which is similar to the results of previous studies [42,62].
In this study, experimental ground measured data for potatoes at different growth periods were used as labeled samples to select model training sample from the LUT dataset without considering the issue of redundancy in the measured data, which may affect the data screening results and the accuracy of the model. In future study, We will consider how the labeled sample selection influences various AL algorithms to filter training samples from the data pool.

4.2. Analysis of Potato LCC Hybrid Inversion Model Construction

LCC is crucial for quantitative assessments of crop growth and health, and the present study was carried out for leaf-scale LCC estimation studies on potatoes. The study results indicate that the simulated data based on the radiative transfer mechanism model can reflect the crop growth status to a large extent. The hybrid modeling approach using ML combined with radiative transfer modeling could effectively monitor the LCC status of potato leaves. In terms of potato LCC model construction, several new possibilities have evolved in the ML regression, with GPR [63] being one of the main interesting kernel-based ML methods for vegetation property retrieval. The present study results revealed that the hybrid method, which integrates RTM, GPR, and AL, achieves superior accuracy in predicting LCC than the LUT CF model. Specifically, the RMSE values decreased by 3.767, 2.759, 0.118, and 5.058 µg/cm2, whereas the R2 values increased by 0.119, 0.200, 0.328, and 0.255, respectively. The results indicate that although hybrid model may not alleviate the limitations of the RTM, it offers the primary advantage of providing a comprehensive training database for ML regression models without the need to collect large amounts of data in the field.
In this study, only the GPR algorithm is used for LCC modeling. Although previous studies revealed that GPR outperforms other machine learning methods with competitive prediction accuracy and it has an intriguing feature that allows it to offer related uncertainty ranges for the predictions [64,65], more machine learning algorithms combined with RTM and AL techniques will be considered in our future studies. The GPR_PROSAIL-AL hybrid model developed in this study is an effective tool for accurately monitoring crop growth, and the radiative transfer model, which combines the advantages of AL, may be used in future research to monitor other biophysical variables and guide potato growth and nutrition management.

5. Conclusions

(1)
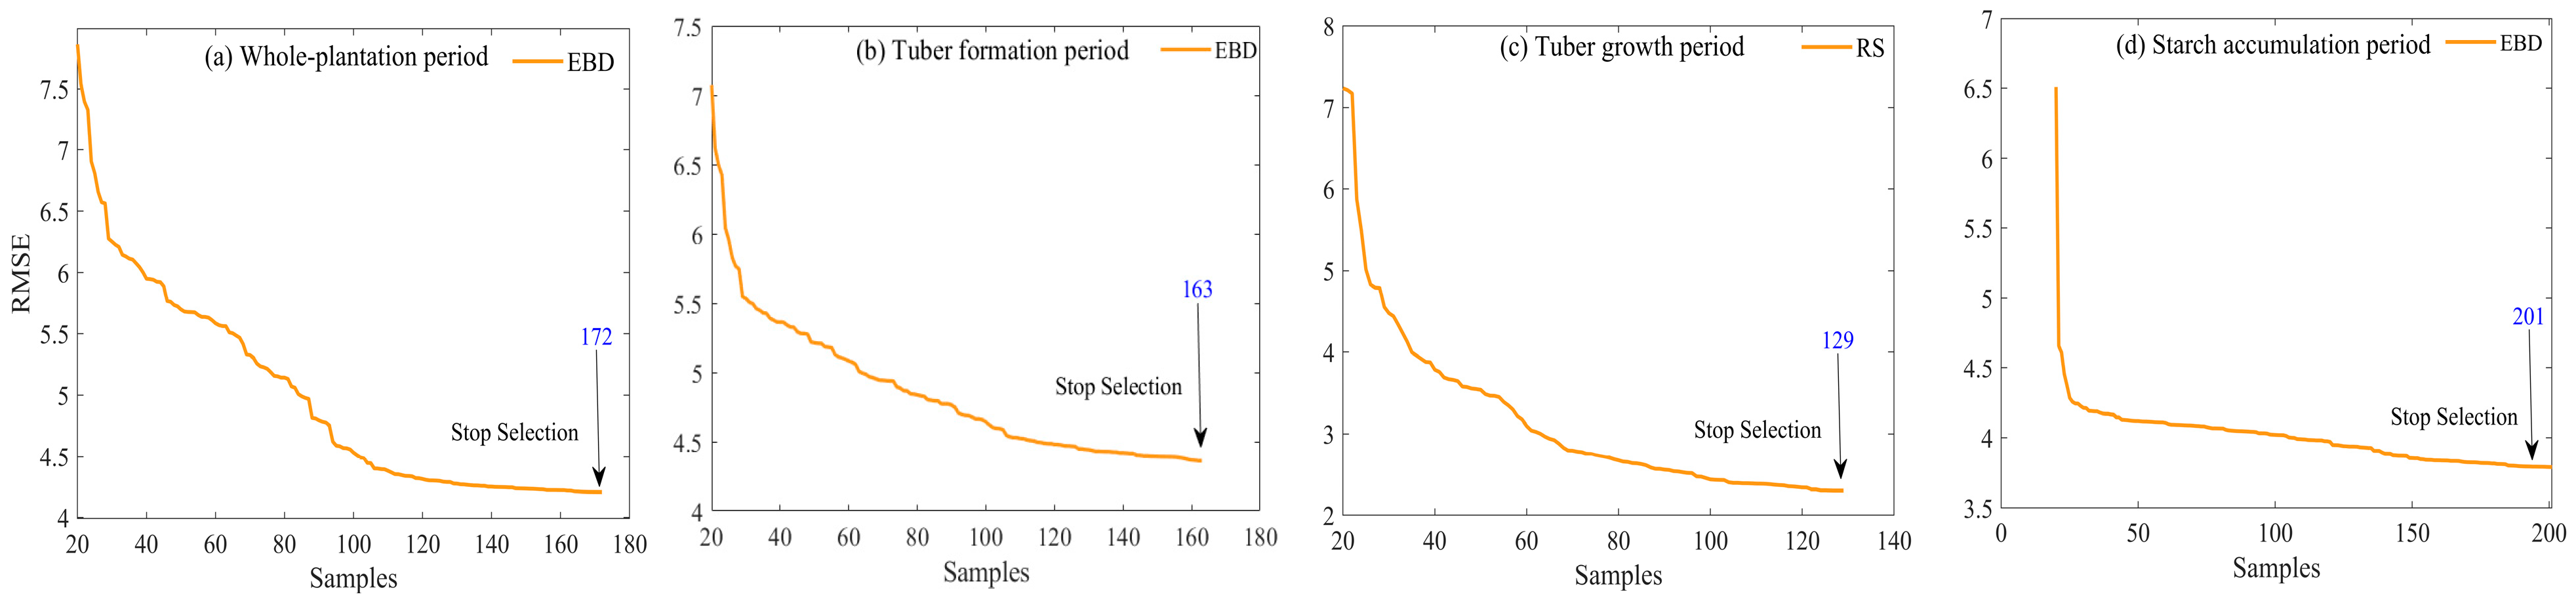
This study demonstrated that the AL algorithm was able to screen the modeling samples efficiently. Based on the measured labeled dataset of potatoes at different growth periods, this study constructed effective modeling samples of potato LCC at different growth periods from the simulated data pool. The training samples were 172, 163, 129, and 201 for the whole plantation, tuber formation, tuber growth, and starch accumulation periods, respectively. The EBD algorithm in the AL algorithm was more efficient in the sample screening process. Based on whole- and single-fertility validation data, six different AL methods were used in this study to screen the training set from the simulated dataset. Each AL method converged faster to the lower error bound than a random sampling strategy. Diversity criteria (EBD, ABD, and CBD) generally performed the best both in terms of reaching high accuracies as well processing time.
(2)
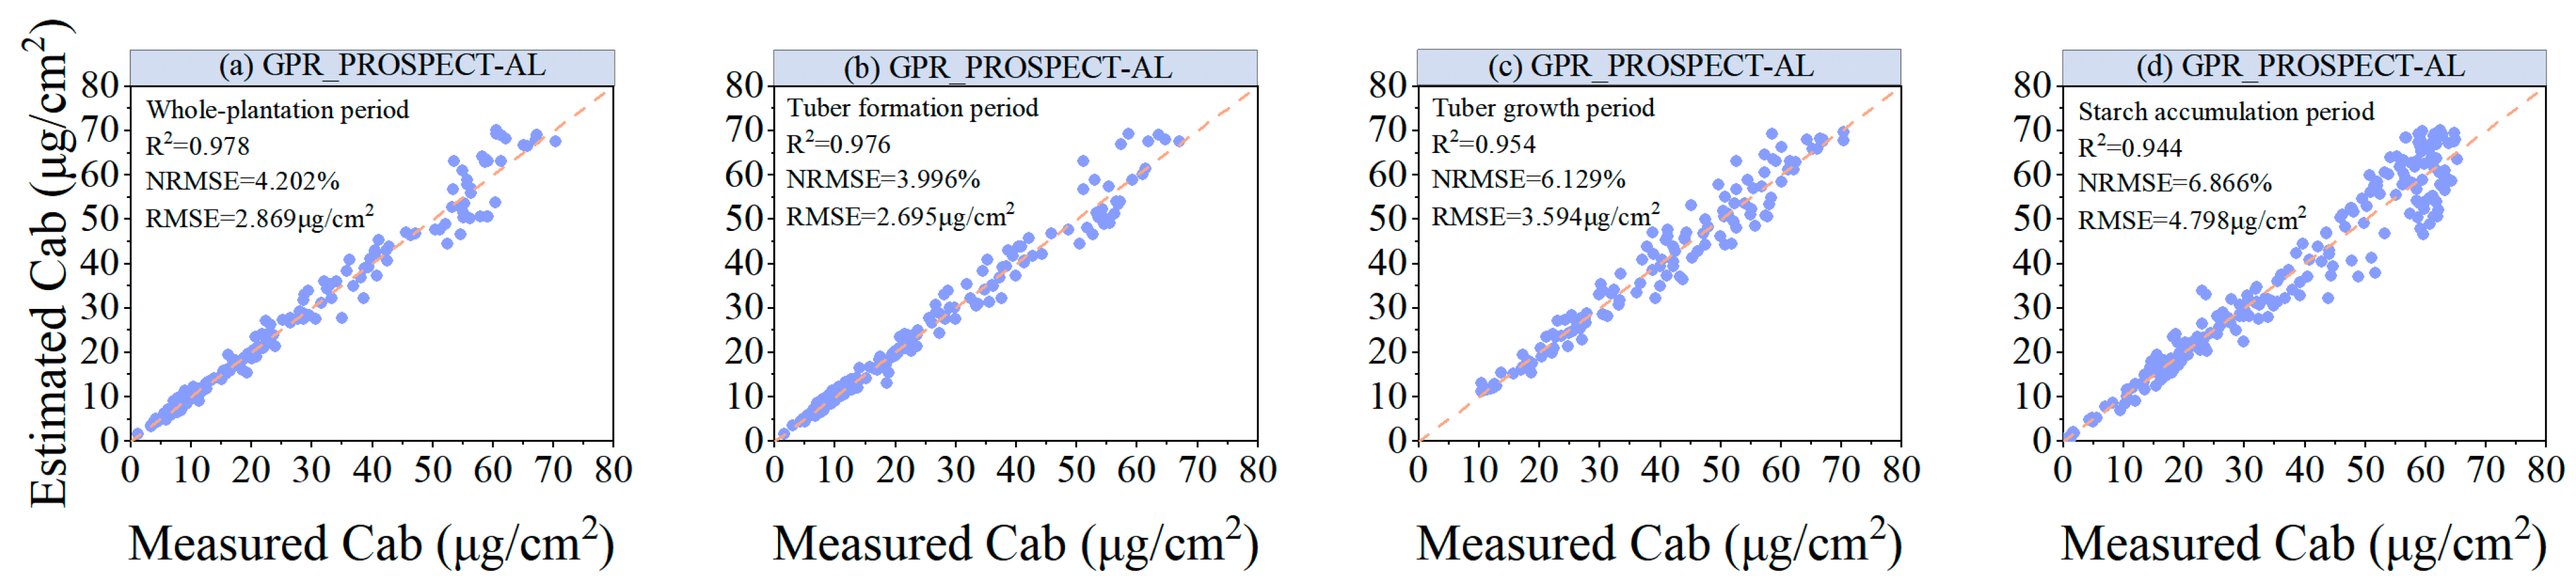
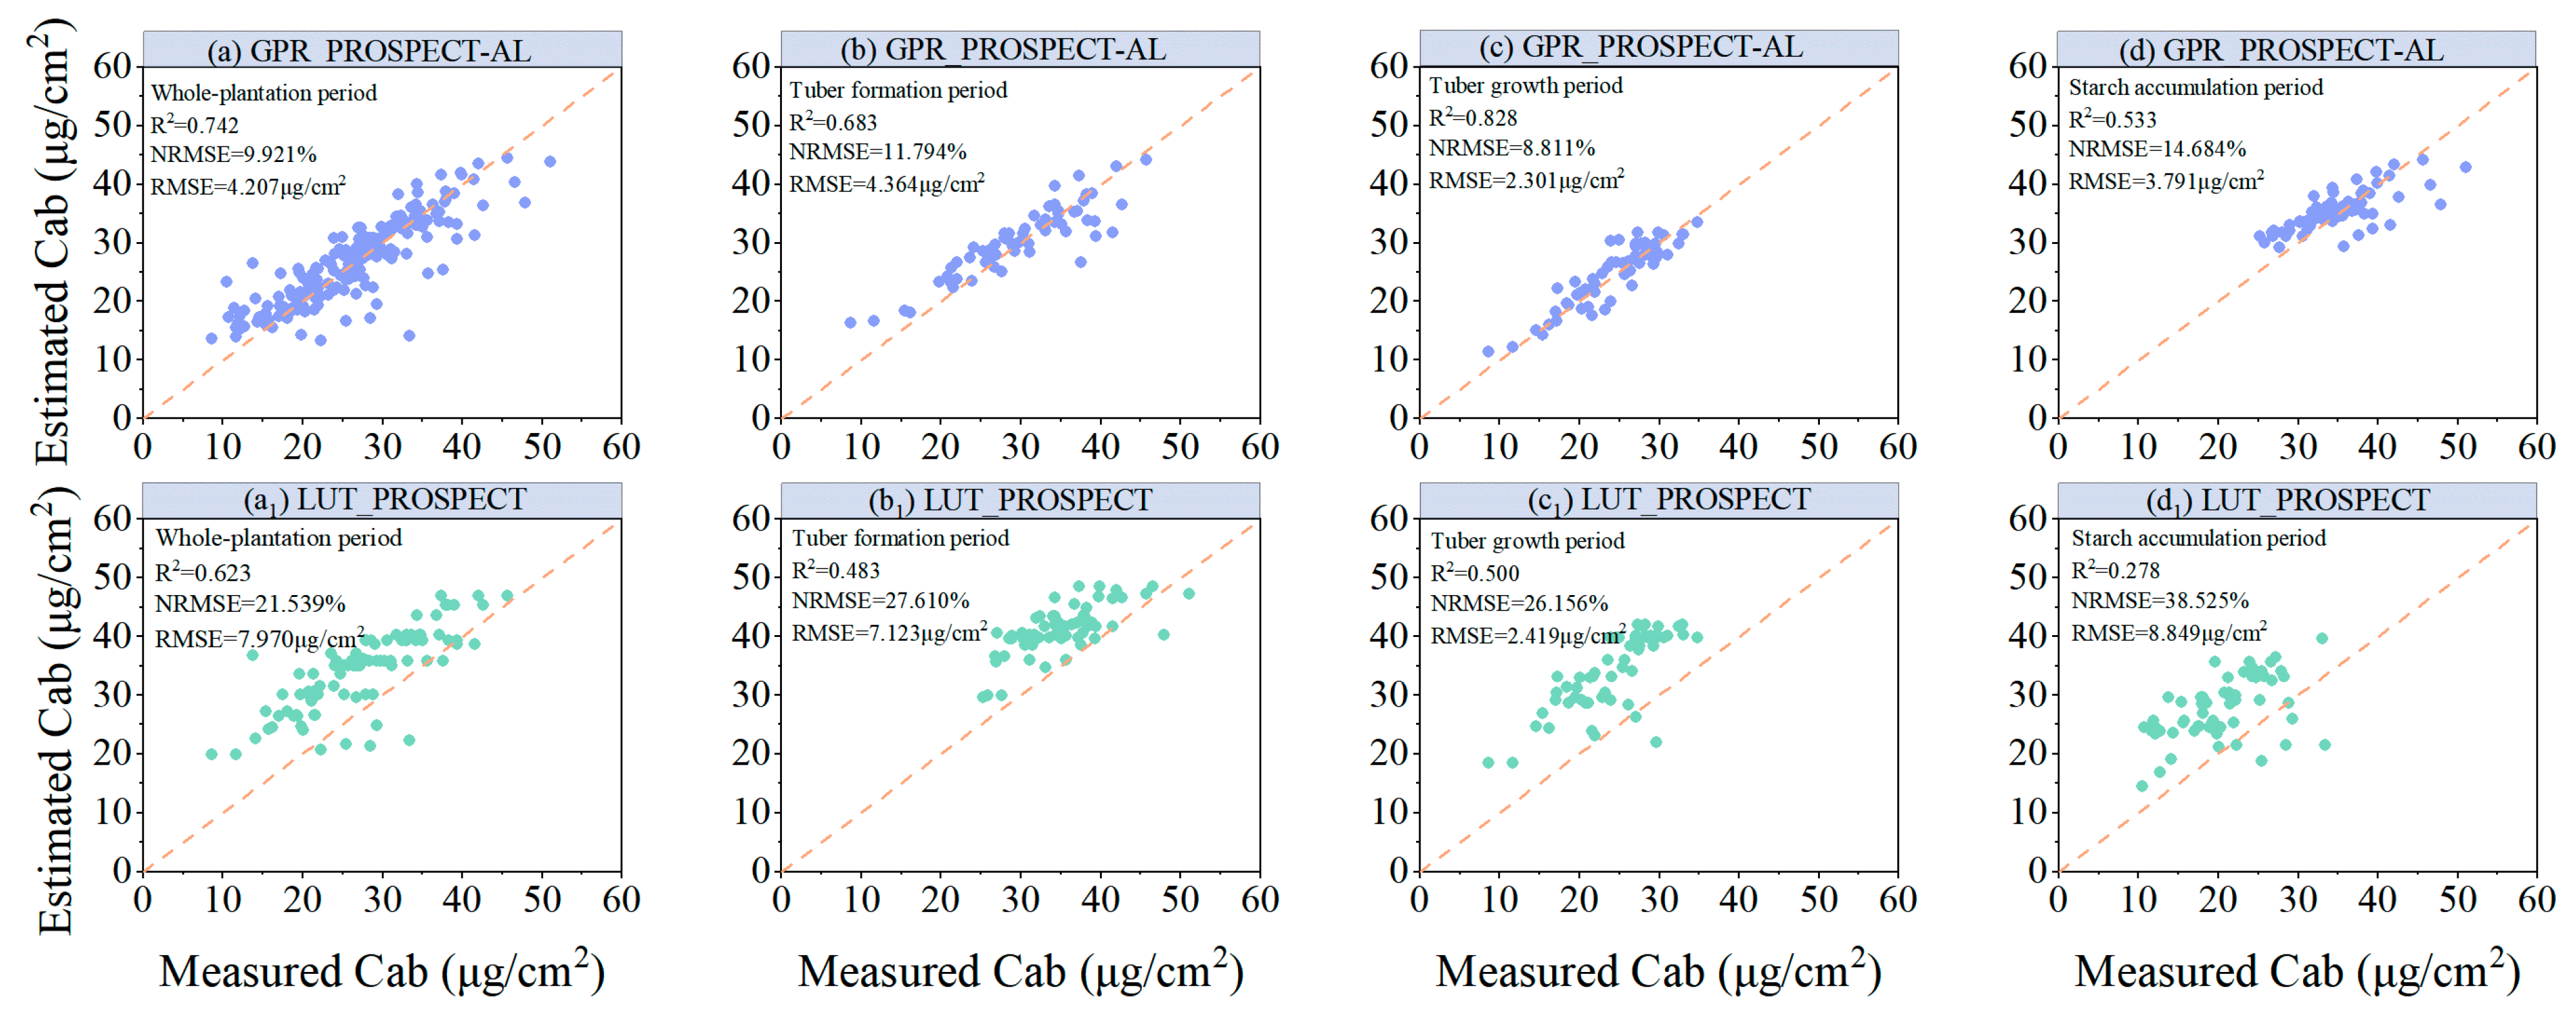
Compared with the LUT CF method, the hybrid model constructed using GPR_PROSPECT-AL has higher modeling accuracy. This indicates that the RTM-based simulation can generate a sufficiently large training dataset and can be used for inverse LCC model training, while the AL approach helps to optimize the training samples for the RTM simulation and improves the accuracy of the model.

Author Contributions

Y.M. and C.Q. processed and analyzed the data and drafted the manuscript. X.S. guided the experimental design, participated in data collection, advised on data analysis, and revised the manuscript. J.Z. and H.F. were involved in the experiments, ground data collection, and/or manuscript revision. Investigation, D.P., C.Z. and H.S. All authors have read and agreed to the published version of the manuscript.

Funding

This research was funded by Key scientific and technological projects of Heilongjiang province (2021ZXJ05A05) and the National Natural Science Foundation of China (41601346).

Data Availability Statement

Data are contained within the article.

Acknowledgments

We appreciate the help from Haikuan Feng, Hong Chang and Weiguo Li during field data collection. At the same time, we also appreciate the support of software ARTMO v.3.30.

Conflicts of Interest

The authors declare no conflict of interest.

References

  1. Guan, K.; Wu, J.; Kimball, J.S.; Anderson, M.C.; Frolking, S.; Li, B.; Hain, C.R.; Lobell, D.B. The shared and unique values of optical, fluorescence, thermal and microwave satellite data for estimating large-scale crop yields. Remote Sens. Environ. 2017, 199, 333–349. [Google Scholar] [CrossRef]
  2. Houborg, R.; Soegaard, H.; Boegh, E. Combining vegetation index and model inversion methods for the extraction of key vegetation biophysical parameters using Terra and Aqua MODIS reflectance data. Remote Sens. Environ. 2007, 106, 39–58. [Google Scholar] [CrossRef]
  3. Guo, Y.; Yin, G.; Sun, H.; Wang, H.; Chen, S.; Senthilnath, J.; Wang, J.; Fu, Y. Scaling effects on chlorophyll content estimations with RGB camera mounted on a UAV platform using machine-learning methods. Sensors 2020, 20, 5130. [Google Scholar] [CrossRef]
  4. Zhang, H.; Ge, Y.; Xie, X.; Atefi, A.; Wijewardane, N.K.; Thapa, S. High throughput analysis of leaf chlorophyll content in sorghum using RGB, hyperspectral, and fluorescence imaging and sensor fusion. Plant Methods 2022, 18, 60. [Google Scholar] [CrossRef]
  5. Mondal, P.; Basu, M. Adoption of precision agriculture technologies in India and in some developing countries: Scope, present status and strategies. Prog. Nat. Sci. 2009, 19, 659–666. [Google Scholar] [CrossRef]
  6. Tang, J.-F.; Lin, C.-Y.; Yang, F.-C.; Chang, C.-L. Influence of nitrogen content and bias voltage on residual stress and the tribological and mechanical properties of CrAlN films. Coatings 2020, 10, 546. [Google Scholar] [CrossRef]
  7. Zhang, J.; Song, X.; Jing, X.; Yang, G.; Yang, C.; Feng, H.; Wang, J.; Ming, S. Remote Sensing Monitoring of Rice Grain Protein Content Based on a Multidimensional Euclidean Distance Method. Remote Sens. 2022, 14, 3989. [Google Scholar] [CrossRef]
  8. Erb, K.-H.; Kastner, T.; Plutzar, C.; Bais, A.L.S.; Carvalhais, N.; Fetzel, T.; Gingrich, S.; Haberl, H.; Lauk, C.; Niedertscheider, M. Unexpectedly large impact of forest management and grazing on global vegetation biomass. Nature 2018, 553, 73–76. [Google Scholar] [CrossRef]
  9. Cao, C.; Wang, T.; Gao, M.; Li, Y.; Li, D.; Zhang, H. Hyperspectral inversion of nitrogen content in maize leaves based on different dimensionality reduction algorithms. Comput. Electron. Agric. 2021, 190, 106461. [Google Scholar] [CrossRef]
  10. Verrelst, J.; Halabuk, A.; Atzberger, C.; Hank, T.; Steinhauser, S.; Berger, K. A comprehensive survey on quantifying non-photosynthetic vegetation cover and biomass from imaging spectroscopy. Ecol. Indic. 2023, 155, 110911. [Google Scholar] [CrossRef]
  11. Verrelst, J.; Rivera, J.P.; Moreno, J.; Camps-Valls, G. Gaussian processes uncertainty estimates in experimental Sentinel-2 LAI and leaf chlorophyll content retrieval. ISPRS J. Photogramm. Remote Sens. 2013, 86, 157–167. [Google Scholar] [CrossRef]
  12. Delegido, J.; Alonso, L.; Gonzalez, G.; Moreno, J. Estimating chlorophyll content of crops from hyperspectral data using a normalized area over reflectance curve (NAOC). Int. J. Appl. Earth Obs. Geoinf. 2010, 12, 165–174. [Google Scholar] [CrossRef]
  13. Wang, X.; Xiao, Z. Hyperspectral Inversion of Chlorophyll Content in Maize Leaves Based on Image and Spectrum Fusion. In Proceedings of the 2022 China Automation Congress (CAC), Xiamen, China, 25–27 November 2022; pp. 6445–6449. [Google Scholar]
  14. Ban, S.; Liu, W.; Tian, M.; Wang, Q.; Yuan, T.; Chang, Q.; Li, L. Rice leaf chlorophyll content estimation using UAV-based spectral images in different regions. Agronomy 2022, 12, 2832. [Google Scholar] [CrossRef]
  15. Zhu, X.; Yang, Q.; Chen, X.; Ding, Z. An Approach for Joint Estimation of Grassland Leaf Area Index and Leaf Chlorophyll Content from UAV Hyperspectral Data. Remote Sens. 2023, 15, 2525. [Google Scholar] [CrossRef]
  16. Kayad, A.; Rodrigues, F.A., Jr.; Naranjo, S.; Sozzi, M.; Pirotti, F.; Marinello, F.; Schulthess, U.; Defourny, P.; Gerard, B.; Weiss, M. Radiative transfer model inversion using high-resolution hyperspectral airborne imagery–Retrieving maize LAI to access biomass and grain yield. Field Crops Res. 2022, 282, 108449. [Google Scholar] [CrossRef] [PubMed]
  17. Verrelst, J.; Rivera, J.P.; Veroustraete, F.; Muñoz-Marí, J.; Clevers, J.G.; Camps-Valls, G.; Moreno, J. Experimental Sentinel-2 LAI estimation using parametric, non-parametric and physical retrieval methods—A comparison. ISPRS J. Photogramm. Remote Sens. 2015, 108, 260–272. [Google Scholar] [CrossRef]
  18. Rivera, J.P.; Verrelst, J.; Leonenko, G.; Moreno, J. Multiple cost functions and regularization options for improved retrieval of leaf chlorophyll content and LAI through inversion of the PROSAIL model. Remote Sens. 2013, 5, 3280–3304. [Google Scholar] [CrossRef]
  19. Binh, N.A.; Hauser, L.T.; Viet Hoa, P.; Thi Phuong Thao, G.; An, N.N.; Nhut, H.S.; Phuong, T.A.; Verrelst, J. Quantifying mangrove leaf area index from Sentinel-2 imagery using hybrid models and active learning. Int. J. Remote Sens. 2022, 43, 5636–5657. [Google Scholar] [CrossRef]
  20. Berger, K.; Verrelst, J.; Féret, J.-B.; Hank, T.; Wocher, M.; Mauser, W.; Camps-Valls, G. Retrieval of aboveground crop nitrogen content with a hybrid machine learning method. Int. J. Appl. Earth Obs. Geoinf. 2020, 92, 102174. [Google Scholar] [CrossRef]
  21. Xu, X.; Lu, J.; Zhang, N.; Yang, T.; He, J.; Yao, X.; Cheng, T.; Zhu, Y.; Cao, W.; Tian, Y. Inversion of rice canopy chlorophyll content and leaf area index based on coupling of radiative transfer and Bayesian network models. ISPRS J. Photogramm. Remote Sens. 2019, 150, 185–196. [Google Scholar] [CrossRef]
  22. Pascual-Venteo, A.B.; Portalés, E.; Berger, K.; Tagliabue, G.; Garcia, J.L.; Pérez-Suay, A.; Rivera-Caicedo, J.P.; Verrelst, J. Prototyping crop traits retrieval models for CHIME: Dimensionality reduction strategies applied to PRISMA data. Remote Sens. 2022, 14, 2448. [Google Scholar] [CrossRef]
  23. Zhu, J.; Lu, J.; Li, W.; Wang, Y.; Jiang, J.; Cheng, T.; Zhu, Y.; Cao, W.; Yao, X. Estimation of canopy water content for wheat through combining radiative transfer model and machine learning. Field Crops Res. 2023, 302, 109077. [Google Scholar] [CrossRef]
  24. Antonucci, G.; Impollonia, G.; Croci, M.; Potenza, E.; Marcone, A.; Amaducci, S. Evaluating biostimulants via high-throughput field phenotyping: Biophysical traits retrieval through PROSAIL inversion. Smart Agric. Technol. 2023, 3, 100067. [Google Scholar] [CrossRef]
  25. ElRafey, A.; Wojtusiak, J. A hybrid active learning and progressive sampling algorithm. Int. J. Mach. Learn. Comput. 2018, 8, 423–427. [Google Scholar]
  26. Meek, C.; Thiesson, B.; Heckerman, D. The learning-curve sampling method applied to model-based clustering. J. Mach. Learn. Res. 2002, 2, 397–418. [Google Scholar]
  27. Amitrano, D.; Giacco, G.; Marrone, S.; Pascarella, A.E.; Rigiroli, M.; Sansone, C. Forest Aboveground Biomass Estimation Using Machine Learning Ensembles: Active Learning Strategies for Model Transfer and Field Sampling Reduction. Remote Sens. 2023, 15, 5138. [Google Scholar] [CrossRef]
  28. Liu, P.; Wang, L.; Ranjan, R.; He, G.; Zhao, L. A survey on active deep learning: From model driven to data driven. ACM Comput. Surv. (CSUR) 2022, 54, 1–34. [Google Scholar] [CrossRef]
  29. Gulzar, Y.; Ünal, Z.; Aktaş, H.; Mir, M.S. Harnessing the power of transfer learning in sunflower disease detection: A comparative study. Agriculture 2023, 13, 1479. [Google Scholar] [CrossRef]
  30. Gulzar, Y. Fruit image classification model based on MobileNetV2 with deep transfer learning technique. Sustainability 2023, 15, 1906. [Google Scholar] [CrossRef]
  31. Dhiman, P.; Kaur, A.; Balasaraswathi, V.; Gulzar, Y.; Alwan, A.A.; Hamid, Y. Image Acquisition, Preprocessing and Classification of Citrus Fruit Diseases: A Systematic Literature Review. Sustainability 2023, 15, 9643. [Google Scholar] [CrossRef]
  32. Verrelst, J.; Dethier, S.; Rivera, J.P.; Munoz-Mari, J.; Camps-Valls, G.; Moreno, J. Active learning methods for efficient hybrid biophysical variable retrieval. IEEE Geosci. Remote Sens. Lett. 2016, 13, 1012–1016. [Google Scholar] [CrossRef]
  33. Wan, L.; Liu, Y.; He, Y.; Cen, H. Prior knowledge and active learning enable hybrid method for estimating leaf chlorophyll content from multi-scale canopy reflectance. Comput. Electron. Agric. 2023, 214, 108308. [Google Scholar] [CrossRef]
  34. Guo, A.; Ye, H.; Li, G.; Zhang, B.; Huang, W.; Jiao, Q.; Qian, B.; Luo, P. Evaluation of Hybrid Models for Maize Chlorophyll Retrieval Using Medium-and High-Spatial-Resolution Satellite Images. Remote Sens. 2023, 15, 1784. [Google Scholar] [CrossRef]
  35. Wocher, M.; Berger, K.; Verrelst, J.; Hank, T. Retrieval of carbon content and biomass from hyperspectral imagery over cultivated areas. ISPRS J. Photogramm. 2022, 193, 104–114. [Google Scholar] [CrossRef] [PubMed]
  36. Isharnani, C.E.; Nurcahyani, E.; Lande, M.L. Kandungan Klorofil Daun Planlet Anggrek Tanah (Spathoglottis plicata Blume.) Hasil Pengimbasan Ketahanan terhadap Asam Fusarat secara In Vitro. In Proceedings of the Prosiding Seminar Nasional Swasembada Pangan Polinela Bandar Lampung, Kota Bandar Lampung, Indonesia, 29 April 2015; pp. 86–92. [Google Scholar]
  37. Yáñez-Rausell, L.; Malenovsky, Z.; Clevers, J.; Schaepman, M.E. Performance of the PROSPECT leaf radiative transfer model version 4 for Norway spruce needles. In Proceedings of the Hyperspectral Workshop 2010, Frascati, Italy, 17–19 March 2010. [Google Scholar]
  38. Jacquemoud, S.; Baret, F. PROSPECT: A model of leaf optical properties spectra. Remote Sens. Environ. 1990, 34, 75–91. [Google Scholar] [CrossRef]
  39. Féret, J.-B.; Berger, K.; De Boissieu, F.; Malenovský, Z. PROSPECT-PRO for estimating content of nitrogen-containing leaf proteins and other carbon-based constituents. Remote Sens. Environ. 2021, 252, 112173. [Google Scholar] [CrossRef]
  40. Spafford, L.; Le Maire, G.; MacDougall, A.; De Boissieu, F.; Féret, J.-B. Spectral subdomains and prior estimation of leaf structure improves PROSPECT inversion on reflectance or transmittance alone. Remote Sens. Environ. 2021, 252, 112176. [Google Scholar] [CrossRef]
  41. Saltelli, A.; Tarantola, S.; Chan, K.-S. A quantitative model-independent method for global sensitivity analysis of model output. Technometrics 1999, 41, 39–56. [Google Scholar] [CrossRef]
  42. Berger, K.; Rivera Caicedo, J.P.; Martino, L.; Wocher, M.; Hank, T.; Verrelst, J. A survey of active learning for quantifying vegetation traits from terrestrial earth observation data. Remote Sens. 2021, 13, 287. [Google Scholar] [CrossRef] [PubMed]
  43. Douak, F.; Melgani, F.; Benoudjit, N. Kernel ridge regression with active learning for wind speed prediction. Appl. Energy 2013, 103, 328–340. [Google Scholar] [CrossRef]
  44. Tuia, D.; Volpi, M.; Copa, L.; Kanevski, M.; Munoz-Mari, J. A survey of active learning algorithms for supervised remote sensing image classification. IEEE J. Sel. Top. Signal Process. 2011, 5, 606–617. [Google Scholar] [CrossRef]
  45. Douak, F.; Benoudjit, N.; Melgani, F. A two-stage regression approach for spectroscopic quantitative analysis. Chemom. Intell. Lab. Syst. 2011, 109, 34–41. [Google Scholar] [CrossRef]
  46. Demir, B.; Persello, C.; Bruzzone, L. Batch-mode active-learning methods for the interactive classification of remote sensing images. IEEE Trans. Geosci. Remote Sens. 2010, 49, 1014–1031. [Google Scholar] [CrossRef]
  47. Patra, S.; Bruzzone, L. A cluster-assumption based batch mode active learning technique. Pattern Recognit. Lett. 2012, 33, 1042–1048. [Google Scholar] [CrossRef]
  48. Verrelst, J.; Berger, K.; Rivera-Caicedo, J.P. Intelligent sampling for vegetation nitrogen mapping based on hybrid machine learning algorithms. IEEE Geosci. Remote Sens. Lett. 2020, 18, 2038–2042. [Google Scholar] [CrossRef]
  49. Bacour, C.; Baret, F.; Béal, D.; Weiss, M.; Pavageau, K. Neural network estimation of LAI, fAPAR, fCover and LAI× Cab, from top of canopy MERIS reflectance data: Principles and validation. Remote Sens. Environ. 2006, 105, 313–325. [Google Scholar] [CrossRef]
  50. MacKay, D.J. Information-based objective functions for active data selection. Neural Comput. 1992, 4, 590–604. [Google Scholar] [CrossRef]
  51. Ki, W.C.; Rasmussen, C.E. Gaussian processes for machine learning. Int. J. Neural Syst. 2006, 14, 69–106. [Google Scholar]
  52. Solla, M.; Pérez-Gracia, V.; Fontul, S. A review of GPR application on transport infrastructures: Troubleshooting and best practices. Remote Sens. 2021, 13, 672. [Google Scholar] [CrossRef]
  53. Cerquera, M.R.P.; Montaño, J.D.C.; Mondragón, I.; Canbolat, H. UAV for landmine detection using SDR-based GPR technology. In Robots Operating in Hazardous Environments; IntechOpen: Rijeka, Croatia, 2017; pp. 26–55. [Google Scholar]
  54. Sinha, S.K.; Padalia, H.; Dasgupta, A.; Verrelst, J.; Rivera, J.P. Estimation of leaf area index using PROSAIL based LUT inversion, MLRA-GPR and empirical models: Case study of tropical deciduous forest plantation, North India. Int. J. Appl. Earth Obs. Geoinf. 2020, 86, 102027. [Google Scholar] [CrossRef]
  55. Locherer, M.; Hank, T.; Danner, M.; Mauser, W. Retrieval of seasonal leaf area index from simulated EnMAP data through optimized LUT-based inversion of the PROSAIL model. Remote Sens. 2015, 7, 10321–10346. [Google Scholar] [CrossRef]
  56. Darvishzadeh, R.; Skidmore, A.; Schlerf, M.; Atzberger, C. Inversion of a radiative transfer model for estimating vegetation LAI and chlorophyll in a heterogeneous grassland. Remote Sens. Environ. 2008, 112, 2592–2604. [Google Scholar] [CrossRef]
  57. Impollonia, G.; Croci, M.; Blandinières, H.; Marcone, A.; Amaducci, S. Comparison of PROSAIL Model Inversion Methods for Estimating Leaf Chlorophyll Content and LAI Using UAV Imagery for Hemp Phenotyping. Remote Sens. 2022, 14, 5801. [Google Scholar] [CrossRef]
  58. Willmott, C.J.; Matsuura, K. Advantages of the mean absolute error (MAE) over the root mean square error (RMSE) in assessing average model performance. Clim. Res. 2005, 30, 79–82. [Google Scholar] [CrossRef]
  59. Verrelst, J.; Rivera, J.P.; Leonenko, G.; Alonso, L.; Moreno, J. Optimizing LUT-based RTM inversion for semiautomatic mapping of crop biophysical parameters from Sentinel-2 and-3 data: Role of cost functions. IEEE Trans. Geosci. Remote Sens. 2013, 52, 257–269. [Google Scholar] [CrossRef]
  60. Sun, J.; Shi, S.; Wang, L.; Li, H.; Wang, S.; Gong, W.; Tagesson, T. Optimizing LUT-based inversion of leaf chlorophyll from hyperspectral lidar data: Role of cost functions and regulation strategies. Int. J. Appl. Earth Obs. Geoinf. 2021, 105, 102602. [Google Scholar] [CrossRef]
  61. Chakhvashvili, E.; Siegmann, B.; Muller, O.; Verrelst, J.; Bendig, J.; Kraska, T.; Rascher, U. Retrieval of crop variables from proximal multispectral UAV image data using PROSAIL in maize canopy. Remote Sens. 2022, 14, 1247. [Google Scholar] [CrossRef]
  62. Berger, K.; Hank, T.; Halabuk, A.; Rivera-Caicedo, J.P.; Wocher, M.; Mojses, M.; Gerhátová, K.; Tagliabue, G.; Dolz, M.M.; Venteo, A.B.P. Assessing non-photosynthetic cropland biomass from spaceborne hyperspectral imagery. Remote Sens. 2021, 13, 4711. [Google Scholar] [CrossRef]
  63. Williams, C.K.; Rasmussen, C.E. Gaussian Processes for Machine Learning; MIT Press: Cambridge, MA, USA, 2006; Volume 2. [Google Scholar]
  64. Verrelst, J.; Alonso, L.; Camps-Valls, G.; Delegido, J.; Moreno, J. Retrieval of vegetation biophysical parameters using Gaussian process techniques. IEEE Trans. Geosci. Remote Sens. 2011, 50, 1832–1843. [Google Scholar] [CrossRef]
  65. Verrelst, J.; Muñoz, J.; Alonso, L.; Delegido, J.; Rivera, J.P.; Camps-Valls, G.; Moreno, J. Machine learning regression algorithms for biophysical parameter retrieval: Opportunities for Sentinel-2 and-3. Remote Sens. Environ. 2012, 118, 127–139. [Google Scholar] [CrossRef]
Figure 1. Design diagram of potato experiment carried out in Keshan farm in Qiqihar.
Agronomy 13 03071 g001
Figure 2. Data analysis flow.
Agronomy 13 03071 g002
Figure 3. Analysis of chlorophyll content distribution and spectral reflectance changes at different growth periods. (a) Spectral reflectance maps at different potato growth periods; (b) Correlation between LCC and leaf spectra at different potato growth periods.
Agronomy 13 03071 g003
Figure 4. Global sensitivity analysis for PROSPECT-4 input parameters.
Agronomy 13 03071 g004
Figure 5. Analysis of spectral curves of potatoes from different datasets. (a) Measured spectral curves of potatoes; (b) Simulated spectral curves of potatoes.
Agronomy 13 03071 g005
Figure 6. Selection results of training samples for optimal AL method for chlorophyll modeling in different growth periods of potatoes. (a) Selection results of AL methods for the whole plantation period; (b) Selection results of AL method during tuber formation period; (c) Selection results of AL method for tuber growth period; (d) Selection results of AL method for starch accumulation period.
Agronomy 13 03071 g006
Figure 7. Scatter plot of measured and estimated LCC for GPR_PROSPECT-AL model at different potato growth periods. (a) GPR_ PROSPECT-AL model for potato whole plantation period; (b) GPR_PROSPECT-AL model for potato tuber formation period; (c) GPR_PROSPECT-AL model for potato tuber growth period; (d) GPR_PROSPECT-AL model for potato starch accumulation period.
Agronomy 13 03071 g007
Figure 8. Spectrum selected from LUT based on CF and measured data. (a) Spectrum selected by the normal distribution-LSE during potato whole plantation period; (b) Spectrum selected by the normal distribution-LSE during potato tuber formation period; (c) Spectrum selected by the normal distribution-LSE during potato tuber growth period; (d) Spectrum selected by the Laplace distribute during potato starch accumulation period.
Agronomy 13 03071 g008
Figure 9. Scatter plots of validation accuracy of different models for potato LCC. (ad) validation accuracy of GPR_PROSPECT-AL models of potato whole plantation period, tuber formation period, tuber growth period, and starch accumulation period, respectively; (a1d1) are the validation accuracies of LUT-PROSPET CF models of potato whole plantation period, tuber formation period, tuber growth period, and starch accumulation period, respectively.
Agronomy 13 03071 g009
Table 1. Thresholds for input parameters of the PROSPECT-4 model.
ParameterUnitMinMaxSamples
Chlorophyll content (Cab)µg/cm20702
Equivalent water thickness (Cw)g/cm20.00010.082
Leaf structure (N)1.52.52
Dry matter content (Cm)g/cm20.00010.052
Table 2. Detailed description of the AL algorithm.
AL Selected CriterionsAL AlgorithmsEquationLiteratures
Diversity Criteria MethodsEuclidean distance-based diversity (EBD) d E = x u x l 2 2 [43]
Angle-based diversity (ABD) ( x u , x l ) = cos 1 ( < x u , x l > x u · x l ) [46]
Cluster-based diversity (CBD)clustering algorithm[47]
Uncertainty Criteria MethodsPool of regressors (PAL) σ y 2 = 1 k i = 1 k ( y i y ¯ ) 2 [43]
Residual regression AL (RSAL) e ( x ) = y y ˆ [45]
Entropy query by bagging (EQB) H ( x ) = i = 1 k p ( x i ) logp ( x i ) [44]
Notes: where x u is a sample from the candidate set; x l is a sample from the training set; < x u , x l > is the inner product between x u and x l ; y ¯ is the average values; y is the actual observed value; y   ˆ is the model prediction given the input x and p ( x i ) is the probability of the sample x being predicted by the regressor i. EBD: This method selects the samples in the candidate set that are distant from the current training set using their squared Euclidean distance. ABD: This strategy measures sample diversity using the cosine angle distance. CBD: This method first groups the data using a clustering algorithm, for instance, k-means. The number of clusters, k, is set to the number of samples to add in each iteration of the AL algorithm. For each cluster, the nearest sample to the cluster centroid is selected. PAL: This strategy first generates k subsets by randomly choosing samples from the original training set. Each subset is then used to train a regressor and to obtain a prediction for each sample in the candidate set. This ends up with k different predictions for each candidate sample. EQB: In this approach, the predictions of k different regressors are ranked according to their entropy. RSAL: This method quantifies the systematic errors generated by a regression algorithm. It does so by training a second model (residual model), which estimates the prediction errors, e ( x ) = y y ˆ , where y is the actual observed value and y   ˆ =   f ˆ ( x ) is the model prediction, given the input x. The algorithm selects the samples that exhibit a high prediction error and adds these to the training set.
Table 3. Description of the measured LCC dataset.
Measured DatasetsTuber Formation PeriodTuber Growth PeriodStarch Accumulation PeriodWhole Plantation Period
Data collection Date21 July 20228 August 202228 August 2022
LCC (µg/cm2)Sample size606060180
Min25.5658.79710.5268.797
Max51.12334.82833.84651.123
Mean38.34421.81322.18629.960
CV (%)0.4710.8440.7430.998
LCC for N treatment (µg/cm2)Sample size30303090
Min25.5658.79713.9458.797
Max46.19233.47333.84646.192
Mean35.87921.13523.89627.4945
CV (%)0.4070.8260.5890.962
LCC for K treatment (µg/cm2)Sample size30303090
Min25.85414.68910.52610.526
Max51.12334.82828.35751.123
Mean38.48924.75919.44230.825
CV (%)0.4640.5750.6490.931
Table 4. Optimal active learning (AL) method selection for chlorophyll modeling in potato different growth periods.
ALWhole Plantation PeriodTuber Formation PeriodTuber Growth PeriodStarch Accumulation Period
GPR_PROSPECT-ALGPR_PROSPECT-ALGPR_PROSPECT-ALGPR_PROSPECT-AL
R2NRMSETimeR2NRMSETimeR2NRMSETimeR2NRMSETime
RAL0.7010.1070.0220.4810.1540.0220.7260.1160.0160.3120.2120.035
RS0.7320.0120.0220.5170.1480.020.828 *0.0880.0260.2560.1950.033
PAL0.7430.0990.0310.4810.1540.0290.7920.0970.0310.2660.2140.032
ABD0.7290.1040.0310.510.1510.0310.6320.1290.0380.2140.2180.033
CBD0.7250.1030.0320.5180.1480.0280.8150.090.0280.2320.2180.033
EBD0.742 *0.0990.0260.683 *0.1180.030.8040.0920.0310.533 *0.1470.003
Notes: * is a precision evaluation index representing the optimal algorithm in different AL algorithms.
Disclaimer/Publisher’s Note: The statements, opinions and data contained in all publications are solely those of the individual author(s) and contributor(s) and not of MDPI and/or the editor(s). MDPI and/or the editor(s) disclaim responsibility for any injury to people or property resulting from any ideas, methods, instructions or products referred to in the content.

