Article

Effect of Partial Root-Zone Irrigation on Plant Growth, Root Morphological Traits and Leaf Elemental Stoichiometry of Tomato under Elevated CO2

1
College of Water Resources and Architectural Engineering, Northwest A&F University, Yangling, Xianyang 712100, China
2
Key Laboratory of Agricultural Soil and Water Engineering in Arid and Semiarid Areas of Ministry of Education, Northwest A&F University, Yangling, Xianyang 712100, China
3
Department of Plant and Environmental Sciences, Faculty of Science, University of Copenhagen, Højbakkegaard Allé 13, DK-2630 Taastrup, Denmark
*
Authors to whom correspondence should be addressed.
Agronomy 2023, 13(12), 3069; https://doi.org/10.3390/agronomy13123069
Submission received: 30 October 2023 / Revised: 9 December 2023 / Accepted: 14 December 2023 / Published: 15 December 2023

Abstract

:
The increasing CO2 concentration ([CO2]) in the atmosphere decreases mineral nutrients concentration in crops, whereas it increases water use efficiency (WUE). Partial root-zone irrigation (PRI) could not only increase WUE but also improve plant nutrient status. Yet the effect of PRI combined with elevated CO2 concentration (e[CO2]) on the element stoichiometry of tomato leaves remains unknown. This study sought to investigate the responses of leaf mineral nutrients status and element stoichiometric ratios in tomatoes to PRI combined with e[CO2]. Tomato plants (cv. Ailsa Craig) were grown in pots in climate-controlled growth chambers with ambient [CO2] (a[CO2], 400ppm) and elevated [CO2] (e[CO2], 800ppm), respectively. Three irrigation regimes, i.e., full irrigation (FI), deficit irrigation (DI) and PRI, were applied to tomato plants at the flowering stage. The results showed that plants grown under DI and PRI had a similar biomass, enhanced root growth including greater root to shoot ratio, root length, surface area, volume and specific length, and an improved WUE in comparison with FI under e[CO2]. Additionally, under e[CO2], PRI showed an increase in leaf [C](+1.5%) and [N] (+9.3%), no decrease in leaf [K], [Ca], [Mg], [S] and [15N], but a decrease in leaf C/N (−6.6%) as compared with FI. Conclusively, PRI had the ability to improve leaf N concentration, maintain most leaf mineral nutrient concentrations, and optimize or maintain leaf element stoichiometric ratios under e[CO2]. Therefore, PRI would be a practicable mode of irrigation for optimizing WUE and nutrient status in tomato leaves in a future freshwater-limited and higher-CO2 environment.

1. Introduction

The atmospheric [CO2] has been continuing to rise for the past few decades and is predicted to reach nearly 800 ppm at the end of this century, even if further actions are taken to reduce emissions [1]. This has aroused wide concern regarding the effects of rising atmospheric [CO2] on crop yield and quality. Positive effects of e[CO2] have been observed in most crop plants, and the results can be summarized as increasing net photosynthetic rate, increasing biomass and yield, decreasing stomatal conductance, and enhancing WUE and C/N ratio [2,3,4,5,6]. Nonetheless, e[CO2] decreases transpiration, and hence decreases soil nutrient mass flow, which can reduce the delivery of mobile mineral nutrients to the root surface and thereby limit the acquisition of mineral nutrients [7]. This has been associated with a significant decrease in the concentrations of important macro- and micro-nutrient elements in C3 crops [8,9], and this effect has been explained as the growth dilution phenomenon [10]. Earlier studies have also shown that e[CO2] could reduce mineral concentration in plants at different levels [9,11], and decrease N more notably than P and K [11], which could disturb the stoichiometry (the comparative ratio of chemical elements) in plants [12]. Nutrient imbalance in plants has a serious impact on plant growth and metabolism [13]. Additionally, mineral nutrient content in plants can be influenced by the capacity of roots to absorb mineral nutrients from soil solution, and plant root systems have morphological plasticity in response to e[CO2] [14]. The roots of plants grown under e[CO2] grow faster, with more numerous, thicker and longer roots [15]. An increase in root length under e[CO2] may change the spatial patterns of exploitation of soil water and nutrients from different soil layers [14,16]. Hence the change in root morphological traits would affect water and mineral nutrient uptake in tomatoes grown under e[CO2] conditions.
Alternate partial root-zone drying irrigation (PRI) and deficit irrigation (DI) are water-saving irrigation strategies [17]. DI irrigates the entire root zone with less water than the potential evapotranspiration, but the mild water stress has minimal effects on plant growth [18]. Alternate PRI is a further improvement of DI [19]. Alternate PRI involves irrigating only part of the root zone and permitting the other part to dry to a predetermined level before the next irrigation [20]. Due to spatial and temporal differences in soil water status under PRI, the plants have greater root biomasses, longer root lengths (RL), and greater root length densities and root to shoot ratio (R/S), but reduced leaf area [21,22,23]. These findings indicate that PRI plants have a greater capacity for more widespread water and nutrient exploration, and less water consumption than DI and FI plants [19,22,24]. It was reported that PRI could increase N concentration in tomato upper leaves, leading to greater photosynthesis and WUE compared with DI [18]. Furthermore, soil drying and rewetting cycles of PRI can stimulate the organic matter decomposition and mineralization of soil nutrients, resulting in enhanced nutrients availability and plant uptake [25,26]. Accumulated evidence has demonstrated that PRI can increase N [18] and P [27] accumulation in plants, and enhance the concentrations of anions and cations in xylem sap [26]. Therefore, it is suggested that PRI has the potential to improve nutrient status in tomatoes grown under e[CO2].
Recent studies have revealed that PRI can improve the quality and mineral nutrient status of tomato fruits grown under e[CO2] [6,28]. However, the combined effects of e[CO2] and PRI on tomato root morphological traits and mineral stoichiometry in leaves have not been effectively studied. Accordingly, the objective of this study was to investigate the responses in leaf mineral nutrient status and leaf element stoichiometry of tomato plants grown under PRI exposed to e[CO2]. In this study, tomato plants (cv. Ailsa Craig) grown in two growth chambers with a[CO2] and e[CO2], respectively, were investigated, and the 15N isotope technique was used to trace N accumulation in tomato leaves during the irrigation treatment period. It is hypothesized that PRI would have positive effects on root morphological traits for mineral nutrient absorption, which would relieve the negative effects on leaf mineral nutrient concentrations, thereby improving the leaf element stoichiometric ratios of tomato grown under e[CO2].

2. Materials and Methods
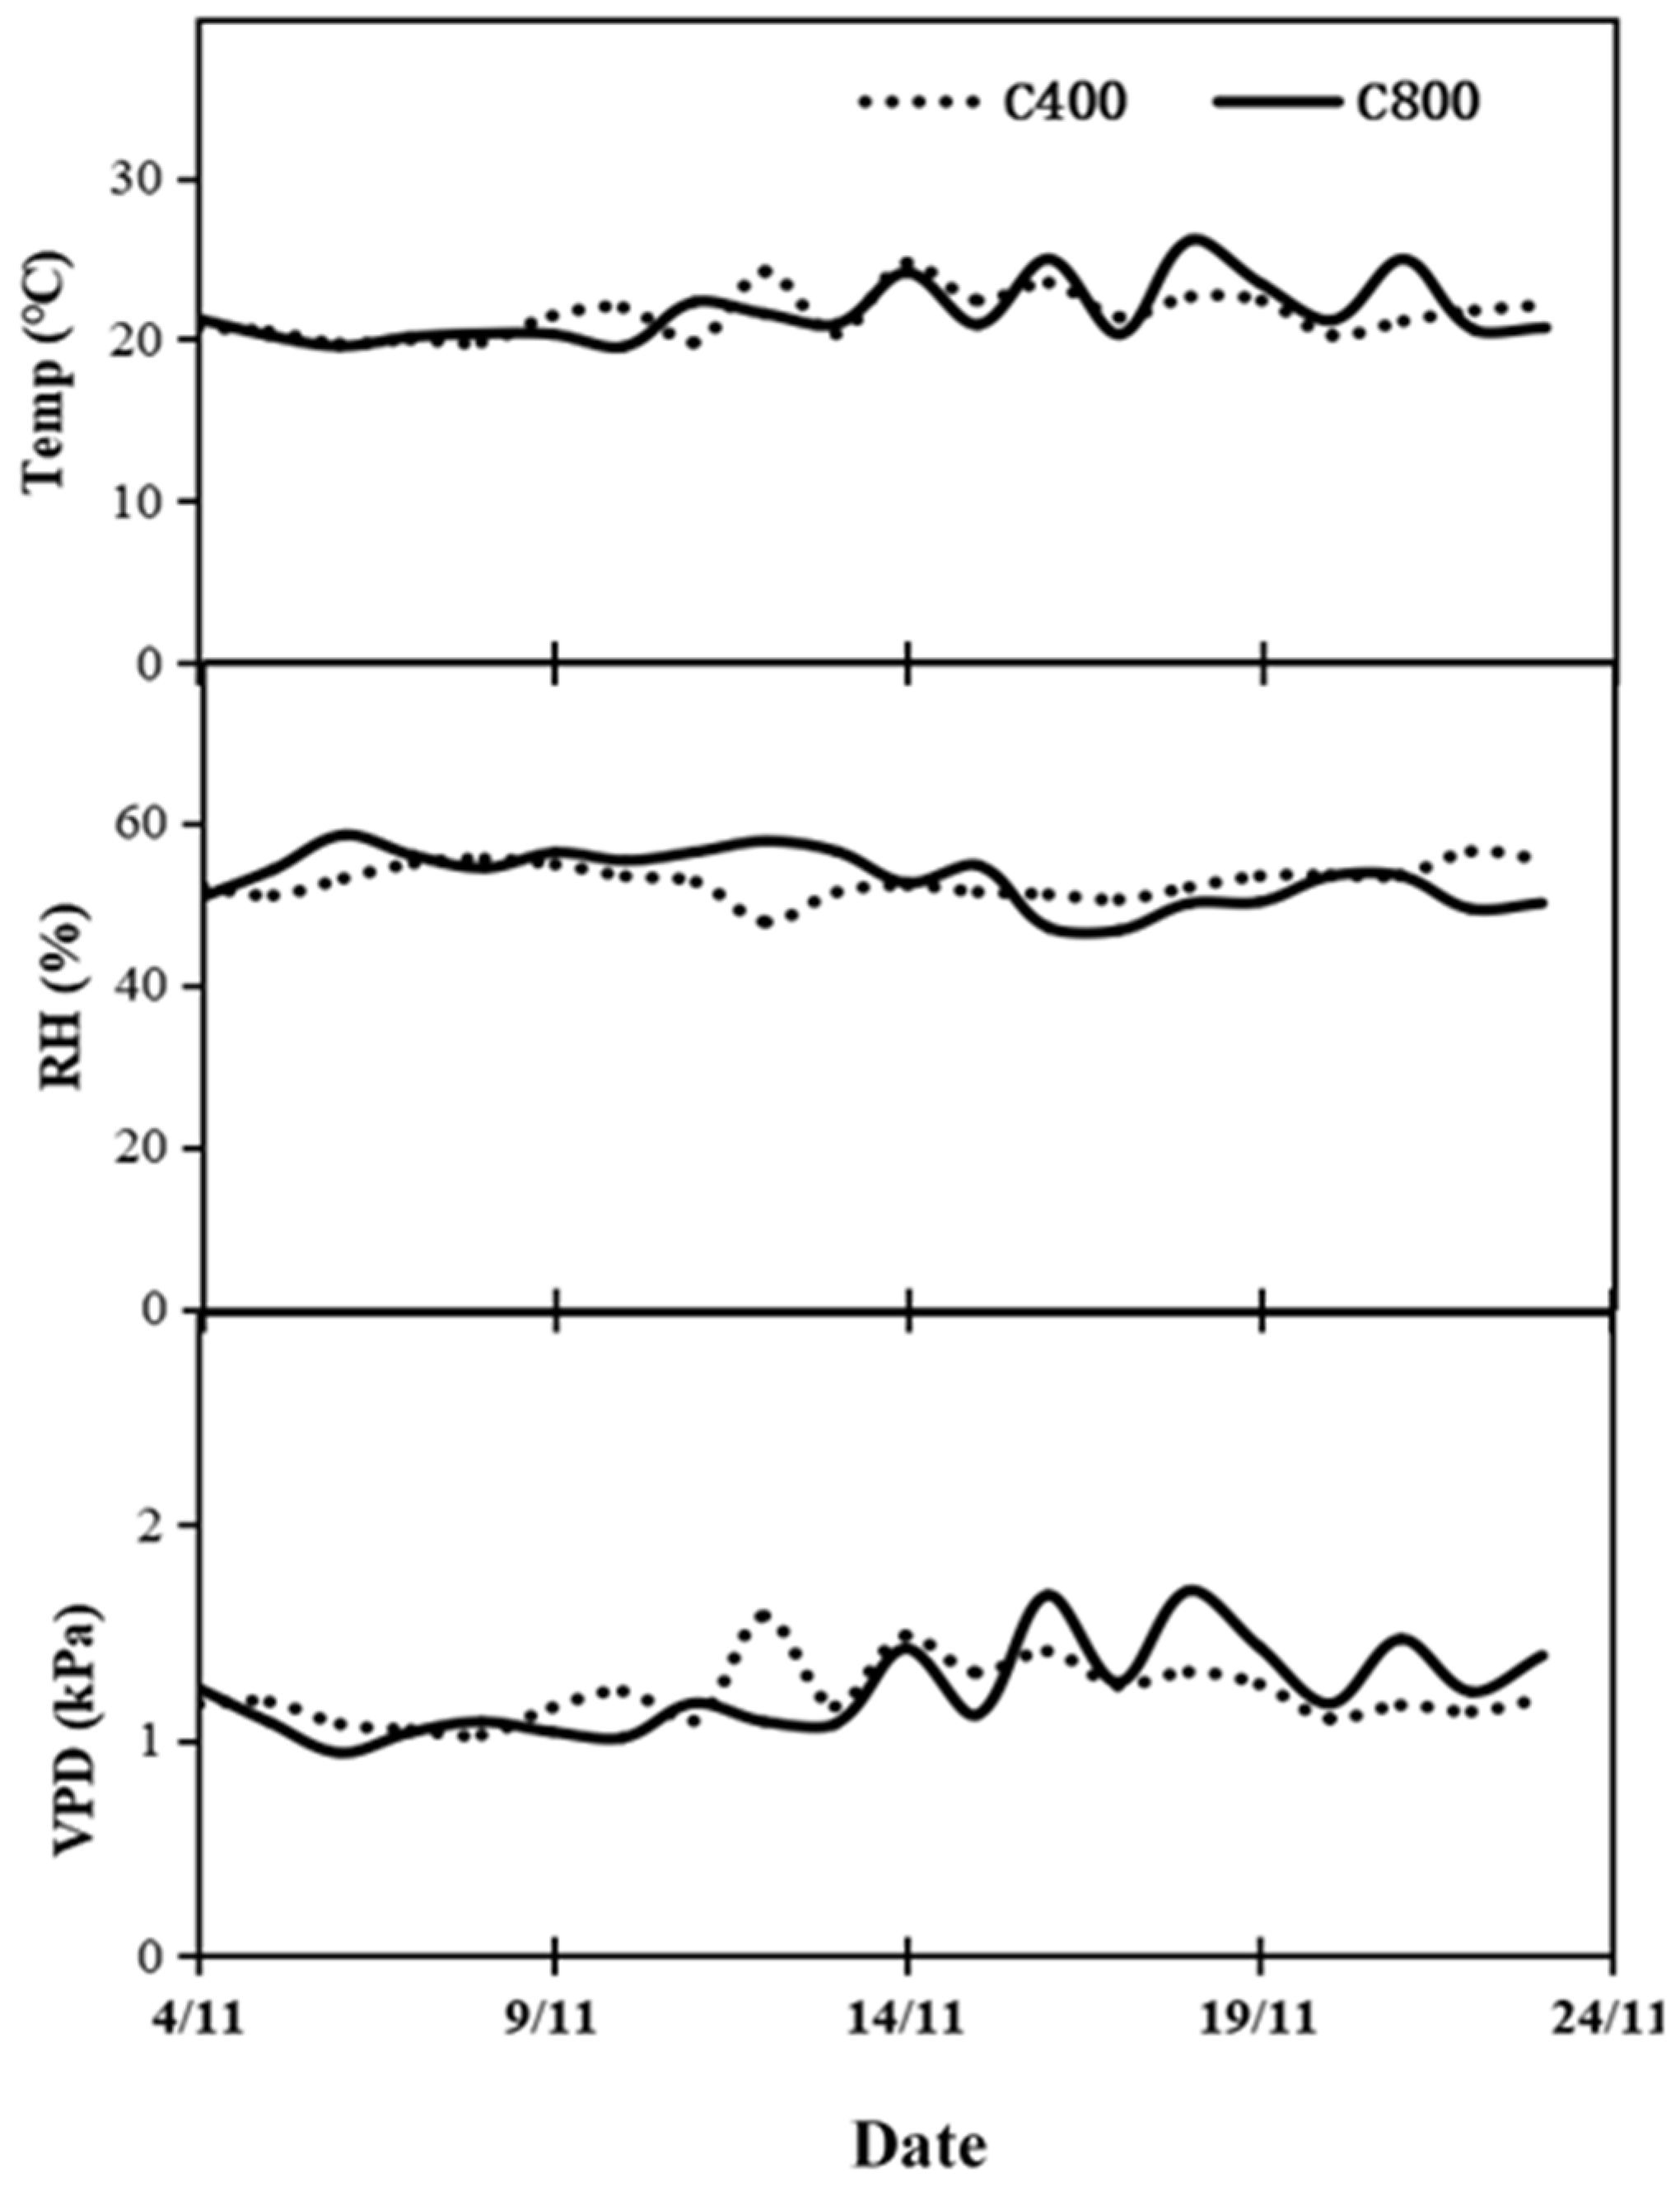
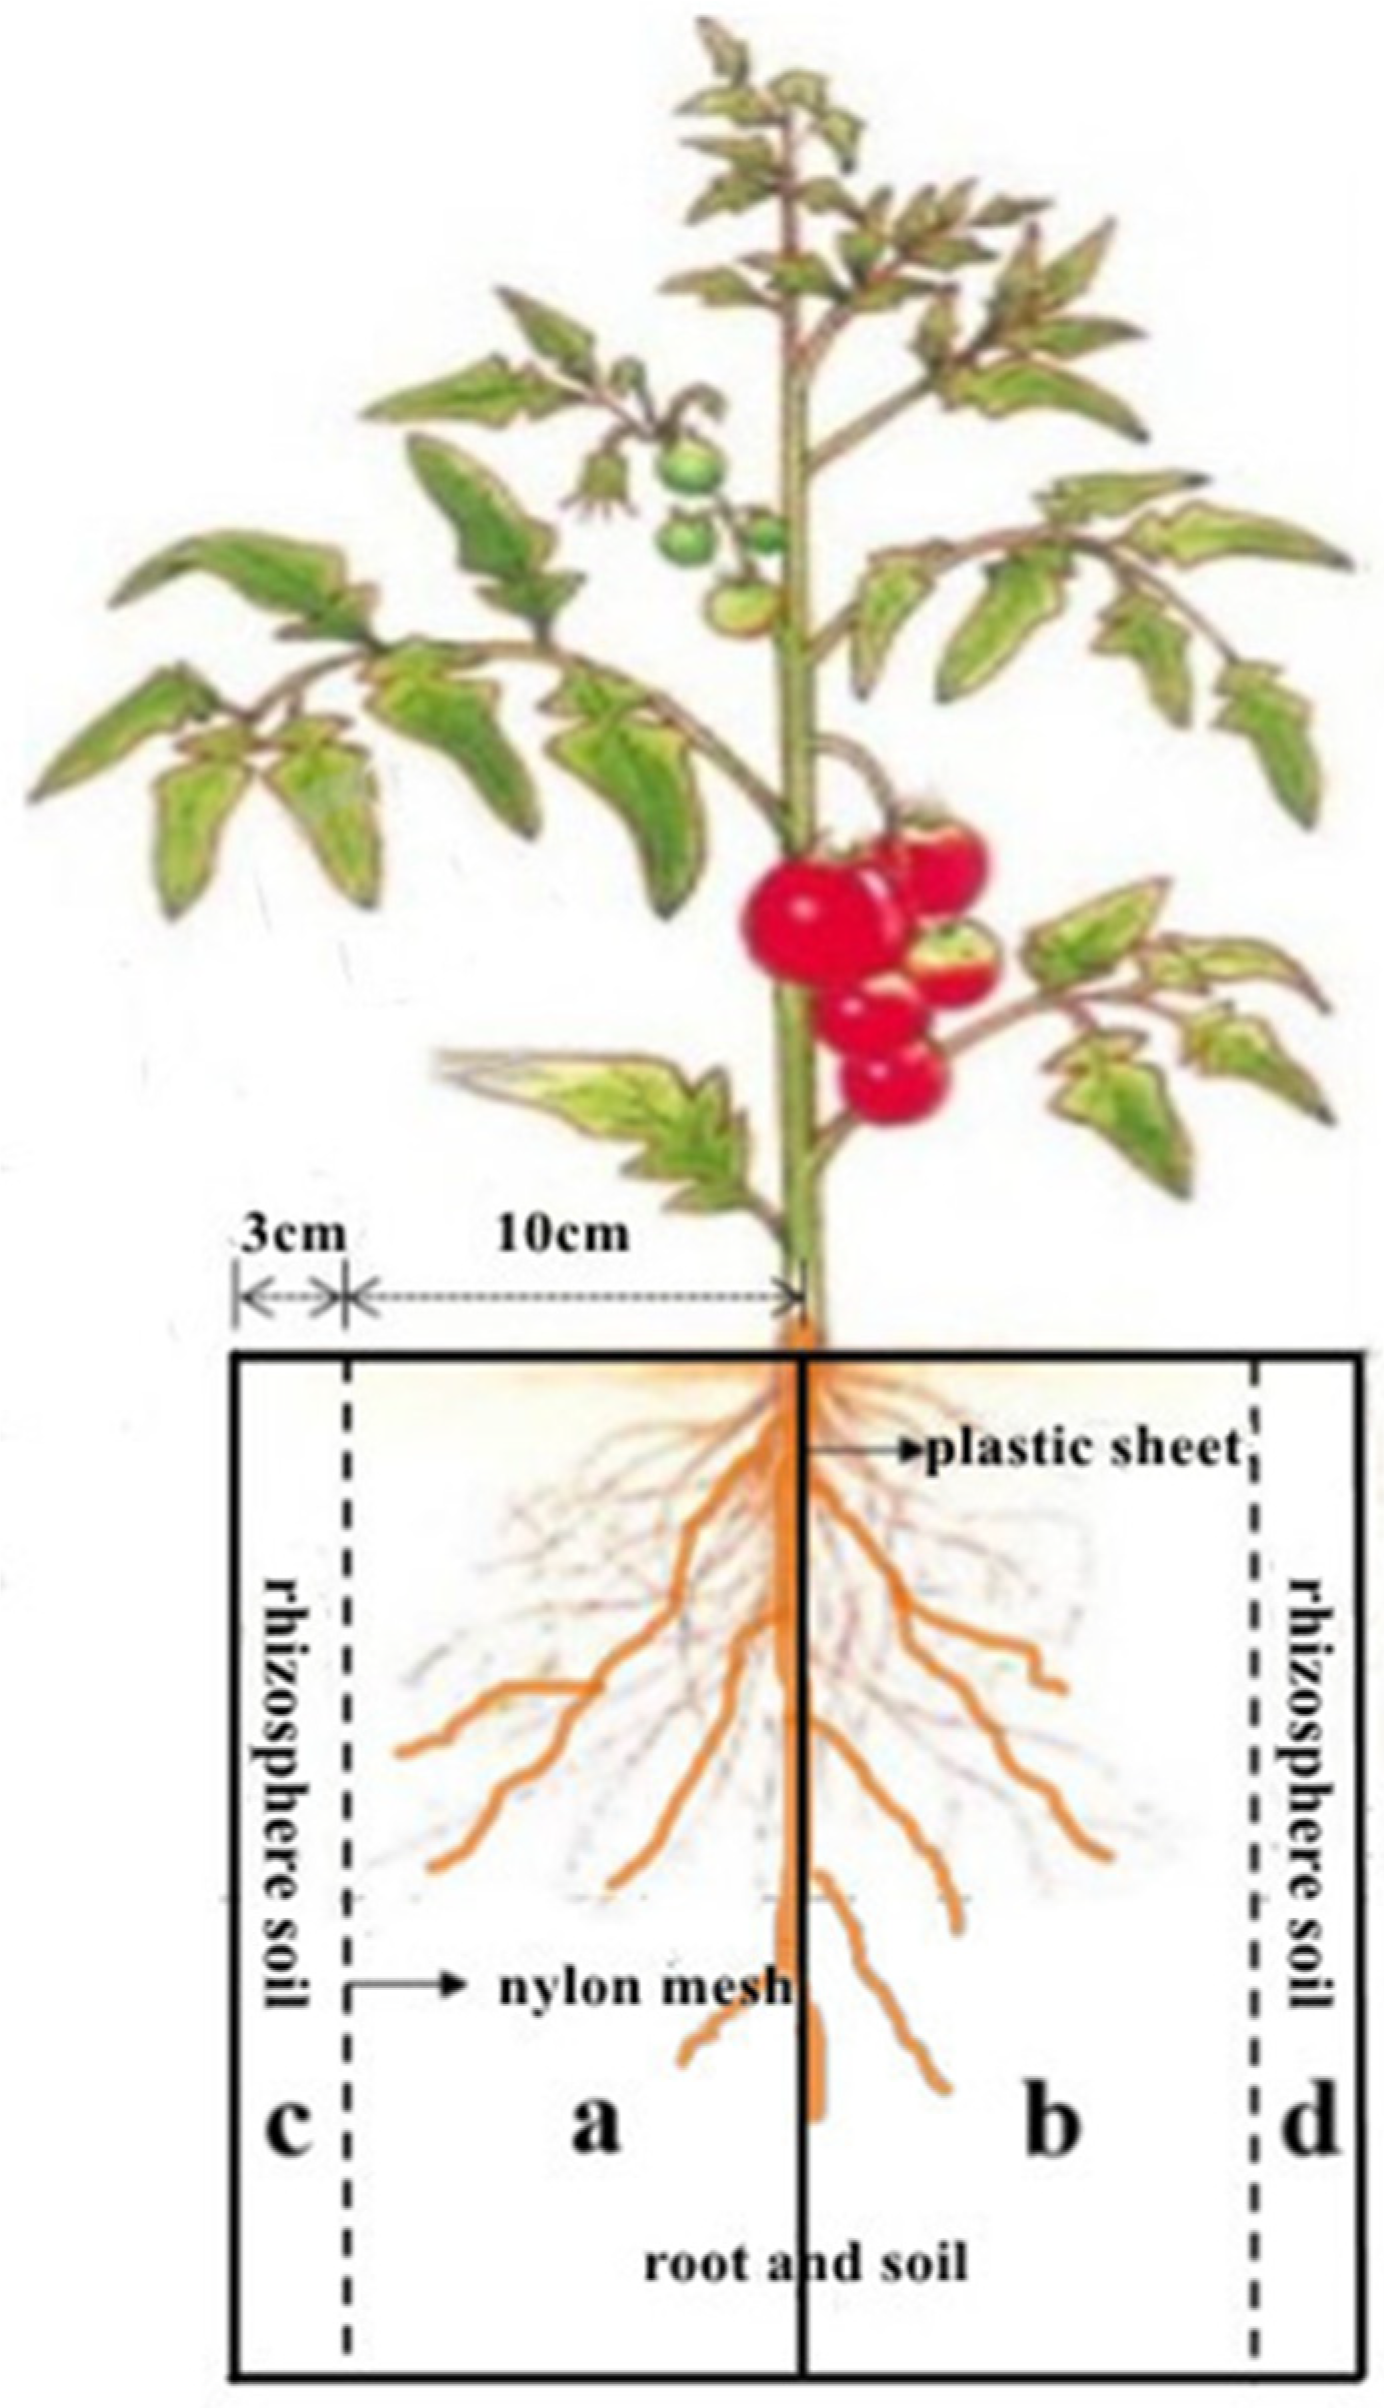
The tomato plant (cv. Ailsa Craig) used in this study is the wild species of many cultivated tomatoes, with good agronomic performance and anti-adversity abilities [29], and it has been widely used in glasshouse adversity studies. The tomato seeds were obtained from the Department of Plant and Environmental Sciences at the University of Copenhagen.
The experiment was carried out from September to November 2020 in the climate-controlled greenhouse of Northwest A&F University (N 34°15′, E 108°04′), Yangling, Shaanxi, China. The tomato seeds were sown on 13 September 2020 under either a[CO2] or e[CO2], respectively, at day/night air temperatures of 25/16 ± 2 °C and relative humidity of 55 ± 5%, and under long-day (16 h of light provided by high-pressure sodium lamps and metal halide lamps) conditions. The daily average temperature (Temp), relative humidity (RH) and vapor pressure deficit (VPD) during the irrigation regime treatment are illustrated in Figure 1.
Four weeks after sowing, the seedlings were transplanted into pots with a volume of 16 L (16 cm inner width, 26 cm length inner, and 40 cm height) at 4-leaf stage with one plant per pot. The pots were divided into two equally sized vertical compartments with plastic sheets to prevent water and nutrient exchange between the two compartments. A small piece of plastic (6 × 8 cm) was removed from the top-middle of the sheet where the tomato seedlings were transplanted. Nylon meshes with an aperture of 150 μm were inserted 3 cm away from both the inner edge of the compartments along the length direction, and therefore, the pot was divided into four sections (a, b, c, d) (Figure 2). The tomato roots were grown in the soil volumes of a and b. The soils in compartments c and d were considered rhizosphere soil. Each pot was filled with 18.5 kg pot−1 naturally dried soil at a bulk density of 1.30 g cm−3. The soil was taken from 25 cm-deep topsoil in a conventional agricultural field in Yangling. The soils were air-dried and sieved through a 0.5 cm mesh. The soil had a pH of 7.8, EC of 0.36 ms/cm, total C of 17.79 g/kg, total N of 0.46 g/kg, total P of 0.60 g/kg and total K of 24.24g/kg. The pot water-holding capacity (WHC, %) was 30%. Two weeks after transplanting, 2.0 g N (as urea), 2.0 g K (as KH2PO4 + K2SO4) and 1.6 g P (as KH2PO4) were applied to each pot with the irrigation water to meet the nutrient requirements for plant growth. To prevent soil evaporation, the soil surface was covered with a 2–3 cm layer of pearlite. Each pot was watered daily to 90% WHC from 18 October to 4 November 2020.

2.1. Treatments

The tomato seedlings were grown in growth chambers with either a[CO2] or e[CO2], and in each of the growth chambers, the pots were randomly arranged, comprising 3 treatments with 4 replicates each, for 12 pots, and an additional 4 pots in each growth chamber were used for acquiring the basic growth indices of the plants before the start of irrigation treatments. Each growth chamber was equipped with a CO2 monitor that controlled the CO2 concentrations over the experimental period by connecting with an automated CO2 adjustable valve, installed on a special high-pressure gas cylinder.
All plants were well watered for 18 days from one week after transplanting. To stimulate root growth and activity, the soil water content was maintained at 60% of WHC during the first week after transplanting. Three days before the onset of the irrigation treatments, 0.10 g 15N urea (5% 15N abundance) was dissolved in 1 mL water and added into the c and d soil compartments with a syringe, respectively. The irrigation treatments included (I) full irrigation (FI), where the whole pot was watered daily to 90% of WHC; (II) deficit irrigation (DI) in which 70% of the water used in the FI was irrigated evenly into the entire pot; (III) partial root-zone drying irrigation (PRI) where the soil compartments a and c were watered using the same volume of water used for DI while b and d were allowed to dry to a soil water content at 12–14%, after which the irrigation was switched. The irrigation treatments lasted 20 days, during which each of the tomato soil compartments underwent two drying/wetting cycles. The average soil water content was determined by TDR (time-domain reflectometer, MINITRASE, Soil Moistures Equipment Crop., SEC, Santa Barbara, CA, USA) with probes (35 cm) inserted in both a and b soil compartments. The plants were irrigated manually with tap water daily between 16:30 and 18:00.

2.2. Measurements

2.2.1. Harvest

The plants were harvested two times during the experimental period. The first harvest was done at the onset of the irrigation treatment, during which four pots of tomato plants from each growth chamber were harvested. The last harvest was conducted when tomato plants reached the blossom stage, then all 24 pots were harvested. During each harvest, the plant samples were divided into three parts: leaf, stem, and root. The entire root was collected by carefully washing with tap water and then stored at 4 °C for further analysis. Leaves and stems were oven-dried separately at 75 °C to a constant weight.

2.2.2. Root Morphological Analyses

The stored root samples were thawed and washed with deionized water before measuring root traits. The procedure has been described in detail by Liu et al. [30]. Roots were carefully washed on a 2 mm sieve and broken segments were also collected during flushing. Then, a representative root subsample from each clean root sample was used for scanning on 20 × 25 cm transparent trays with deionized water using WinRHIZO Pro (Modified Epson Expression 12000XL, Regent Instruments Inc., Québec, QC, Canada) at 400 dots per inch resolution. The obtained images were analyzed with WinRHIZO v.2021 software (Regent Instruments Inc., Quebec, QC, Canada) for root length (RL), root average diameter (RAD), root surface area (RS) and root volume (RV). Afterwards, root samples were oven-dried to a constant weight at 75 °C to determine dry matter. The specific root length (SRL) was calculated as the root length per unit of root dry weight, and root tissue density (RTD) was computed as the ratio of root dry weight/root volume [30].

2.2.3. Plant Biomass, Water Use, Water Use Efficiency

The dry weight of each plant part was measured after oven-drying to a constant weight. Total dry mass (DM) was computed as the sum of the dry weight of leaves, stems and roots. The shoot dry weight (SDW) was evaluated as the sum of leaf dry weight (LDW) and stem dry weight. Total dry matter accumulation (∆DM) during the irrigation treatment period was calculated as the difference in DM between the first harvest and the last harvest. Biomass partitioning was calculated as the ratio of the dry weight of leaves, stems and roots to the plant DM, respectively. Plant water use (WU) was calculated based on the amount of irrigation and changes in soil water content in the pots from the initiation to the end of the irrigation treatments. Plant water use efficiency (WUE) was calculated as the ratio of ∆DM to WU. Thereafter, the oven-dried leaf samples were thoroughly ground into powder and passed through a 0.2 mm sieve for further analysis.

2.2.4. Elemental Analyses

The values of δ15 N as well as the total C and N contents in the leaves were measured using elemental analyzer (vario PYRO cube, Elementar Analysensysteme GmbH, Hanau, Germany) coupled to an isotope-ratio mass spectrometer (Isoprime100, Elementar Analysensysteme GmbH, Hanau, Germany).
Leaf P, K and S concentrations were determined after digestion with 10 mL of concentrated nitric acid + 2 mL perchloric acid, using an Automatic Flow Elemental Analyzer (Seal AA3, Seal Analytical Instrument Co., Ltd, Berlin, Germany). Leaf Ca and Mg concentrations were measured by Atomic Absorption Spectroscopy (PE-pinAAcle, 900 F) after digestion with 5 mL concentrated nitric acid + 1 mL perchloric acid. The obtained values of the leaf were used to calculate stoichiometric ratios of C/N, C/P, C/K, C/Ca, C/Mg, C/S, N/P and N/K. The elements’ uptake values were determined as leaf elemental concentration multiplied by leaf DM.

2.3. Statistical Analysis

The data were analyzed by two-way analysis of variance (ANOVA) using SPSS 20.0 (IBM Corporation, New York, NY, USA) to evaluate the effects of CO2 and irrigation regimes, as well as their interactions, on plants growth, WUE, root morphological traits, leaf element concentrations, leaf element uptakes, and leaf element stoichiometry. One-way ANOVA and Duncan’s multiple range tests at the 5% confidence level were further conducted when there were significant interactions between the independent factors, to test for significant differences among treatments. Principle component analysis (PCA) and Pearson correlation coefficient were assessed using Origin 2021 (OriginLab, Northampton, MA, USA).

3. Results

3.1. Plant Dry Matter Accumulation, Dry Biomass Allocation, Shoot Dry Weight, Plant Water Use and Plant Water Use Efficiency

The ΔDM, SDW, LDW, biomass allocation to leaf (LMR), stem (SMR) and root (RMR), WU and WUE values of tomato plants, and the output of two-way ANOVA, are all shown in (Table 1). CO2 significantly affected these parameters. e[CO2] led to significantly more ΔDM, SDW, LDW, LMR, RMR, WU and WUE—101.5%, 99.2%, 101.5%, 3.8%, 14.1%, 38.5% and 45.4%, respectively—and 13.3% lower SMR in tomato plants than a[CO2]. IR significantly influenced LMR, SMR, RMR, LDW, WU and WUE. Compared to FI, the reduced irrigations (DI and PRI) increased SMR (+13.7% at DI, +16.2% at PRI), RMR (+22.7% at DI, +18.5% at PRI) and WUE (+35.5% at DI, +38.7% at PRI), but reduced LMR (−5.5% at DI, 5.2% at PRI), LDW (−7.5% at DI, −9.0% at PRI) and WU (ca. 30% at both DI and PRI). C × IR had little effect on the ΔDM, SDW, LDW, biomass allocation to leaf (LMR), stem (SMR) and root (RMR), WU and WUE values of tomato plants.

3.2. Root Growth and Morphological Traits

The RL, RS, RD, RV, SRL, RTD, R/S and RDW of tomatoes grown under different irrigation regimes with a[CO2] and e[CO2], respectively, and the output of the two-way ANOVA are shown in Table 2. [CO2] significantly affected the RL, RS, RV, R/S and RDW values. e[CO2] significantly increased the RL, RS, RV, R/S and RDW values by 154.7%, 144.9%, 134.5%, 20.0% and 139.2%, respectively. IR significantly influenced RL, RS, RV, SRL, RTD and R/S. Reduced irrigations led to longer RL, greater RS and RV, and larger SRL, RTD and R/S than FI. C × IR significantly affected RSL but had no influence on other indices. Compared to a[CO2], e[CO2] enhanced SRL by 121.2% and 19.4%, respectively, under FI and PRI, whereas it decreased SRL by 26.7% at DI.

3.3. Leaf Element Concentration

The leaf [C], [N], [P], [K], [Ca], [Mg], [S] and [15N] of tomatoes grown under different irrigation regimes under a[CO2] and e[CO2], respectively, and the output of the two-way ANOVA are presented in Table 3. [CO2] significantly affected leaf [N], [Ca], [Mg] and [S]. e[CO2] significantly lowered leaf N and Mg, respectively, by 13.1% and 6.9%, but increased leaf [Ca] and [S], respectively, by 8.2% and 20.2%. IR significantly affected leaf [C], [[P], [Ca], [Mg] and [15N]. Reduced irrigations significantly decreased leaf [P] (−10.7% at DI, −19.0% at PRI), [Ca] (−2.5% at DI, −8.3% at PRI) and [Mg](−2.6% at DI, −10.3% at PRI), while they increased leaf [C] (+1.2% at DI, +1.7% at PRI) and [15N] (+46.2% at DI, +11.5% at PRI). C × IR had little effect on leaf [C], [N], [P], [K], [Ca], [Mg], [S] and [15N] of tomatoes. Nevertheless, compared to a[CO2], e[CO2] decreased leaf [N] and [P], and had equivalent leaf [C], [K], [Mg] and [15N], but increased leaf [Ca] and [S] (Table 3). Moreover, under e[CO2], PRI increased leaf [C], [N] and [S], and had no effect on leaf [K], [Ca], [Mg] and [15N] relative to FI (Table 3).

3.4. Leaf Element Uptakes

The leaf C, N, P, K, Ca, Mg, S an 15N uptakes of tomatoes grown under different irrigation regimes with a[CO2] and e[CO2], respectively, and the outputs of the two-way ANOVA are depicted in Table 4. [CO2] significantly affected leaf C, N, P, K, Ca, Mg, S and 15N uptakes. e[CO2] significantly enhanced these indices. IR significantly influenced leaf P, K, Ca, Mg, S and 15N uptakes. Reduced irrigations significantly lowered leaf P, K, Ca, Mg and S uptakes, but increased leaf 15N uptakes. C × IR significantly affected leaf P uptake. Compared to a[CO2], e[CO2] increased leaf P uptake under FI more notably than reduced irrigations.

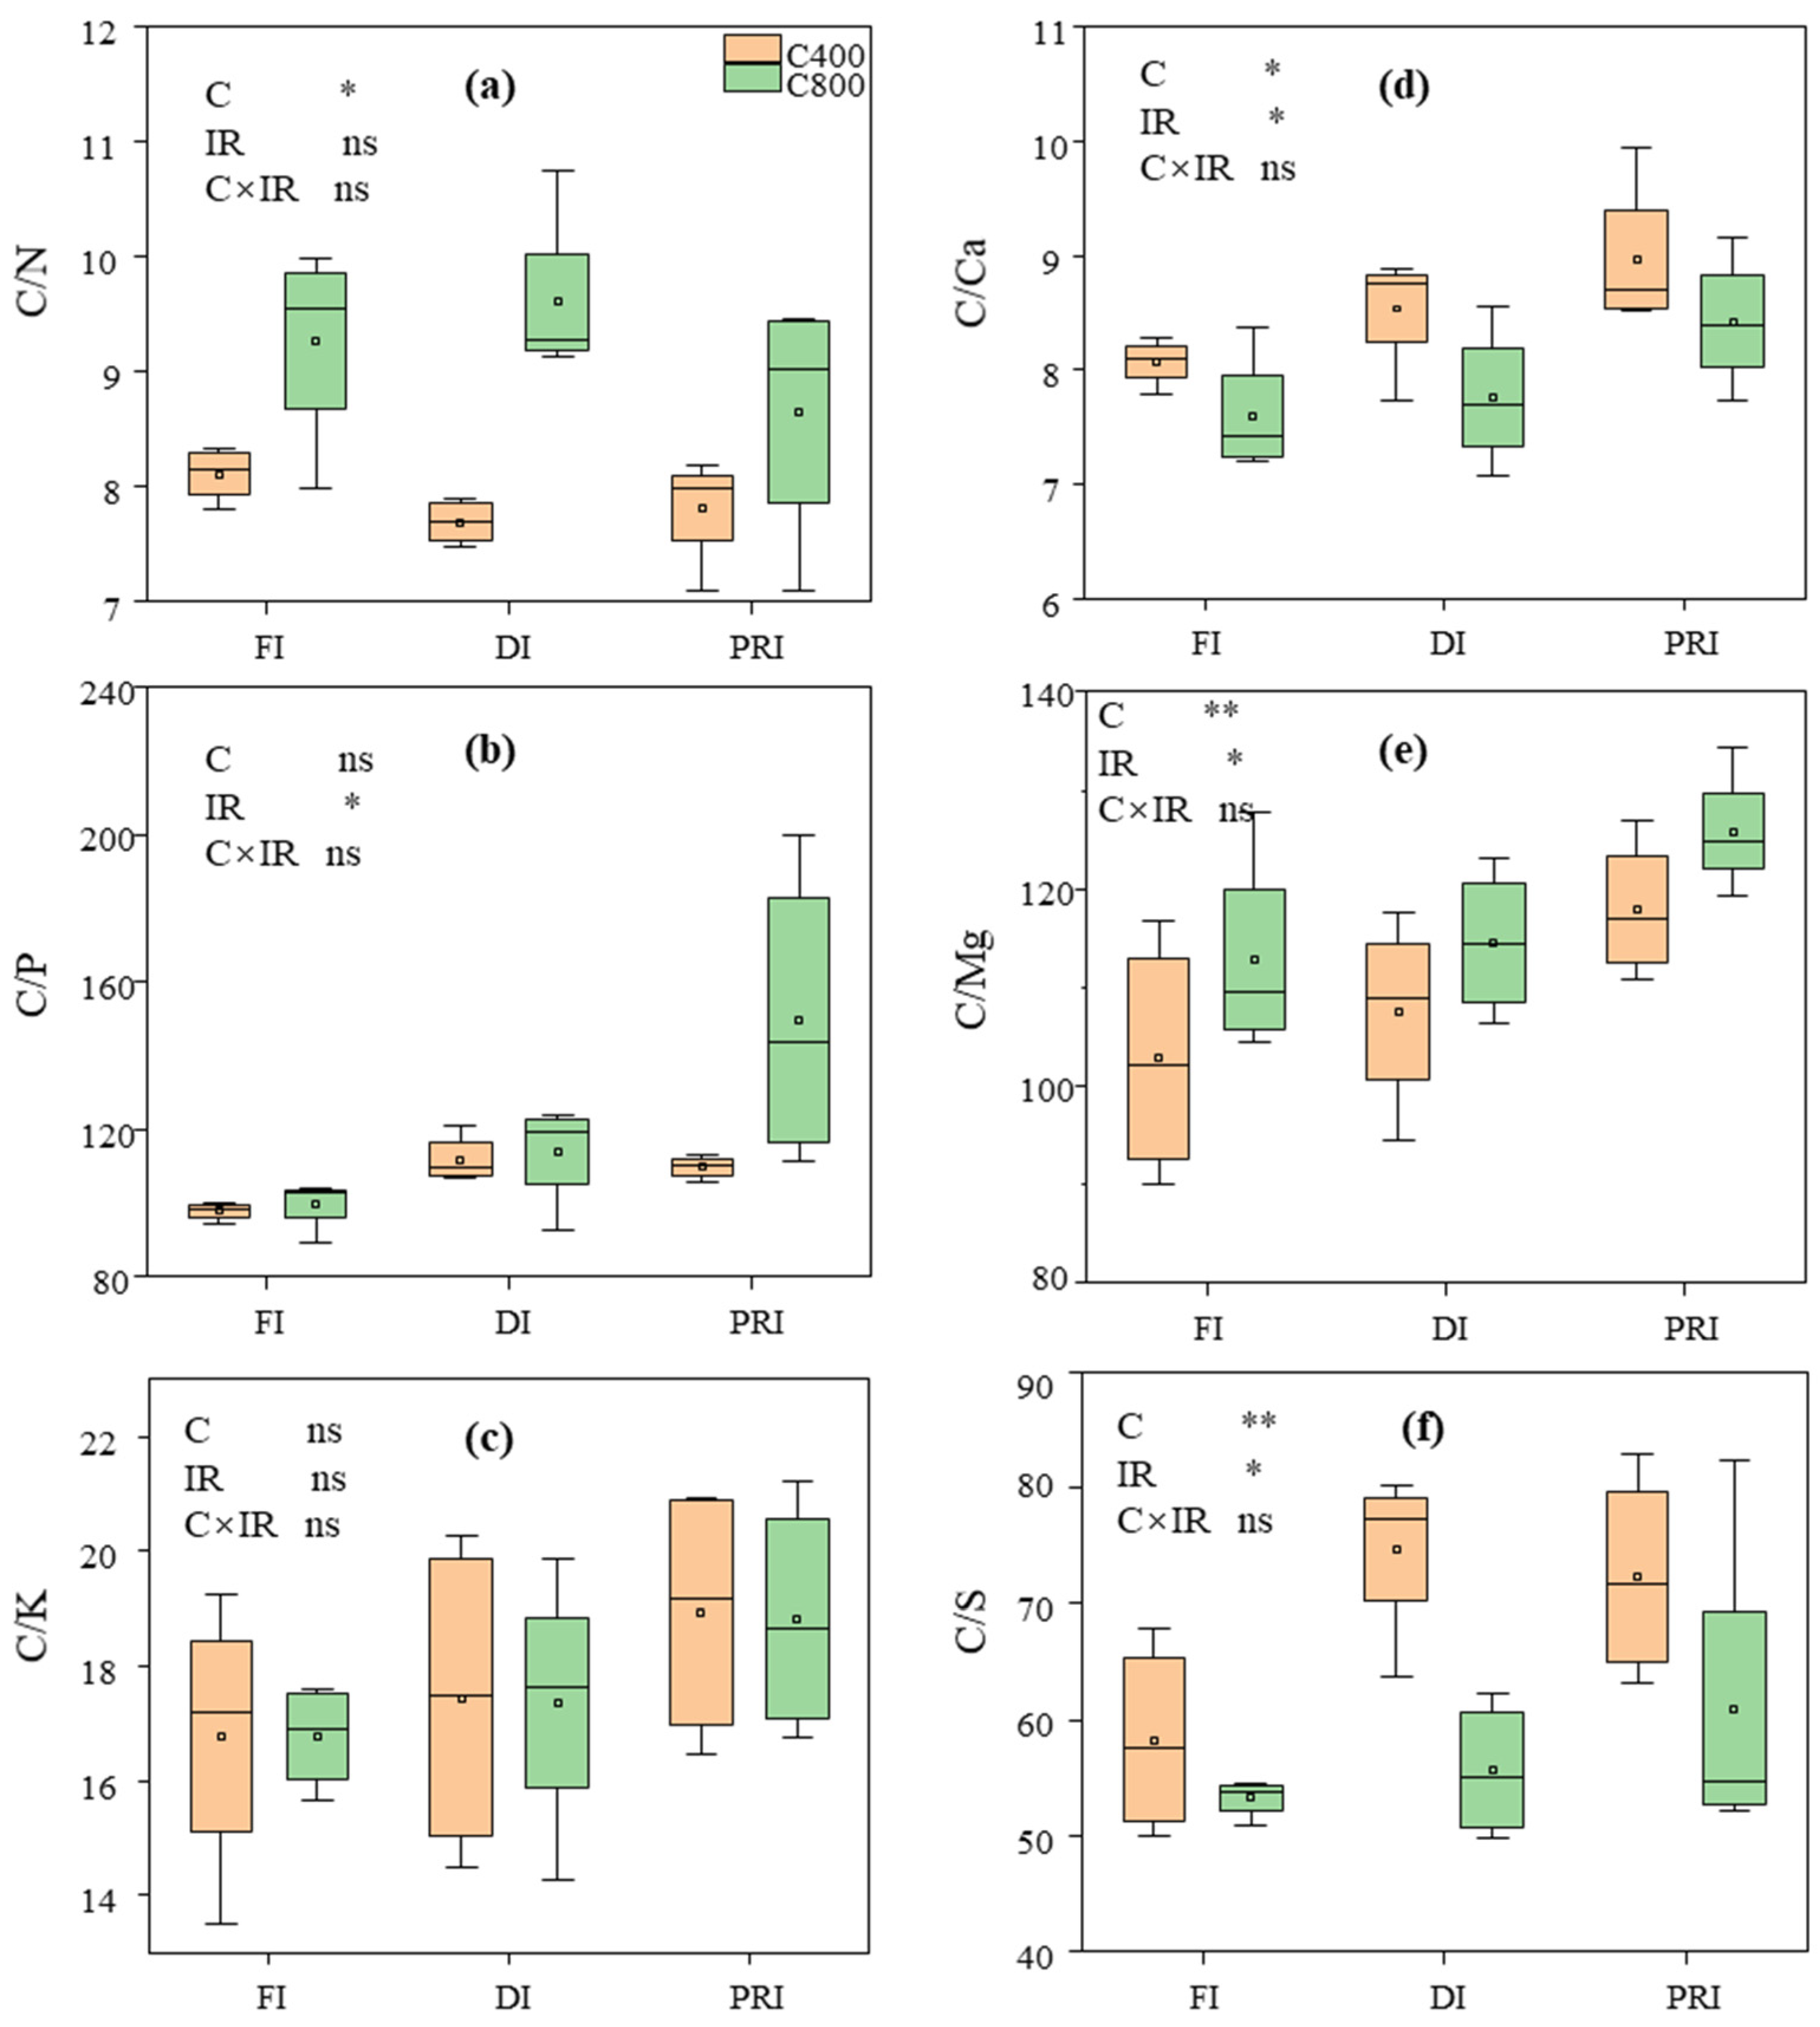
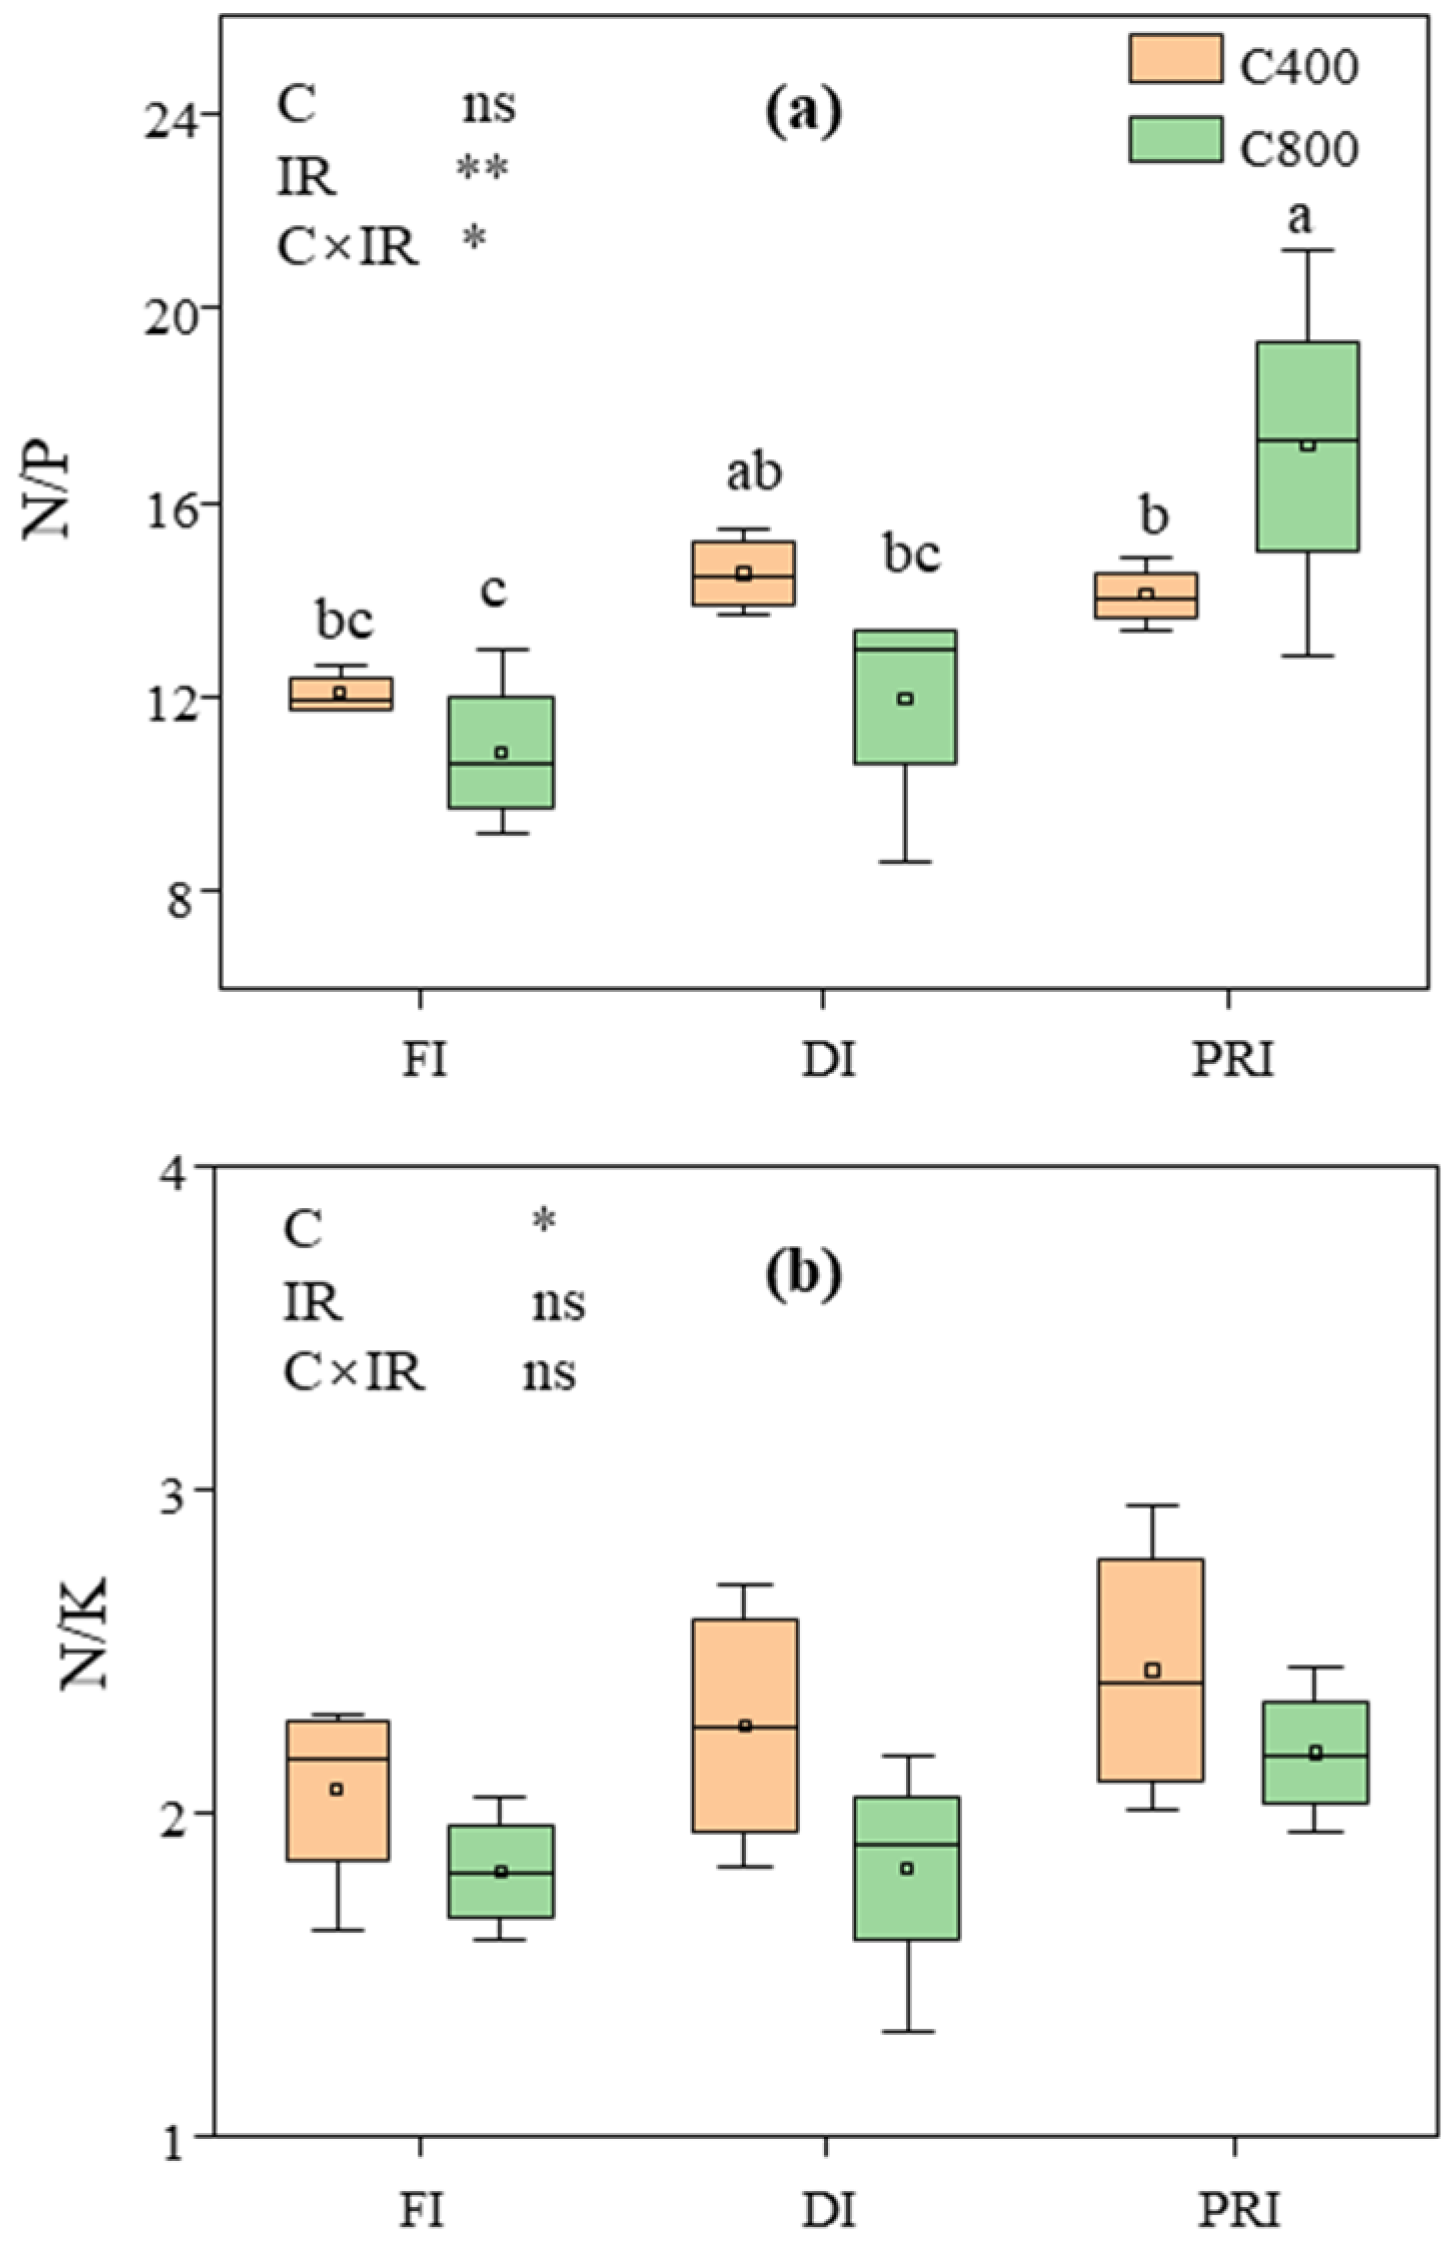
3.5. C/N, C/P, C/K, C/Ca, C/Mg, C/S, N/P and N/K in Tomato Leaves

Leaf C/N, C/P, C/K, C/Ca, C/Mg, C/S, N/P, N/K and P/K of tomatoes grown under different irrigation regimes with a[CO2] and e[CO2], respectively, and the outputs of the two-way ANOVA are shown in Figure 3 and Figure 4. [CO2] significantly affected leaf C/N, C/Ca, C/Mg, C/S and N/K. e[CO2] significantly increased leaf C/N and C/Mg, respectively by 16.6% and 7.6%, while it decreased leaf C/Ca, C/S and N/K, respectively, by 7.0%, 17.2% and 14.0%. IR significantly affected leaf C/P, C/Ca, C/Mg, C/S and N/P. Reduced irrigations significantly increased leaf C/P, C/Ca, C/Mg, C/S and N/P. C × IR significantly affected leaf N/P. Compared to a[CO2], e[CO2] decreased leaf N/P at FI (−10.0%) and DI (−17.5%), but increased it by 21.8% at PRI. Nevertheless, compared to a[CO2], e[CO2] showed similar leaf C/K and C/Mg and increased leaf C/N, C/P and N/P, but decreased leaf C/Ca, C/S and N/K, under PRI. Additionally, under e[CO2], PRI showed an increase in leaf C/N and C/S as compared with FI.

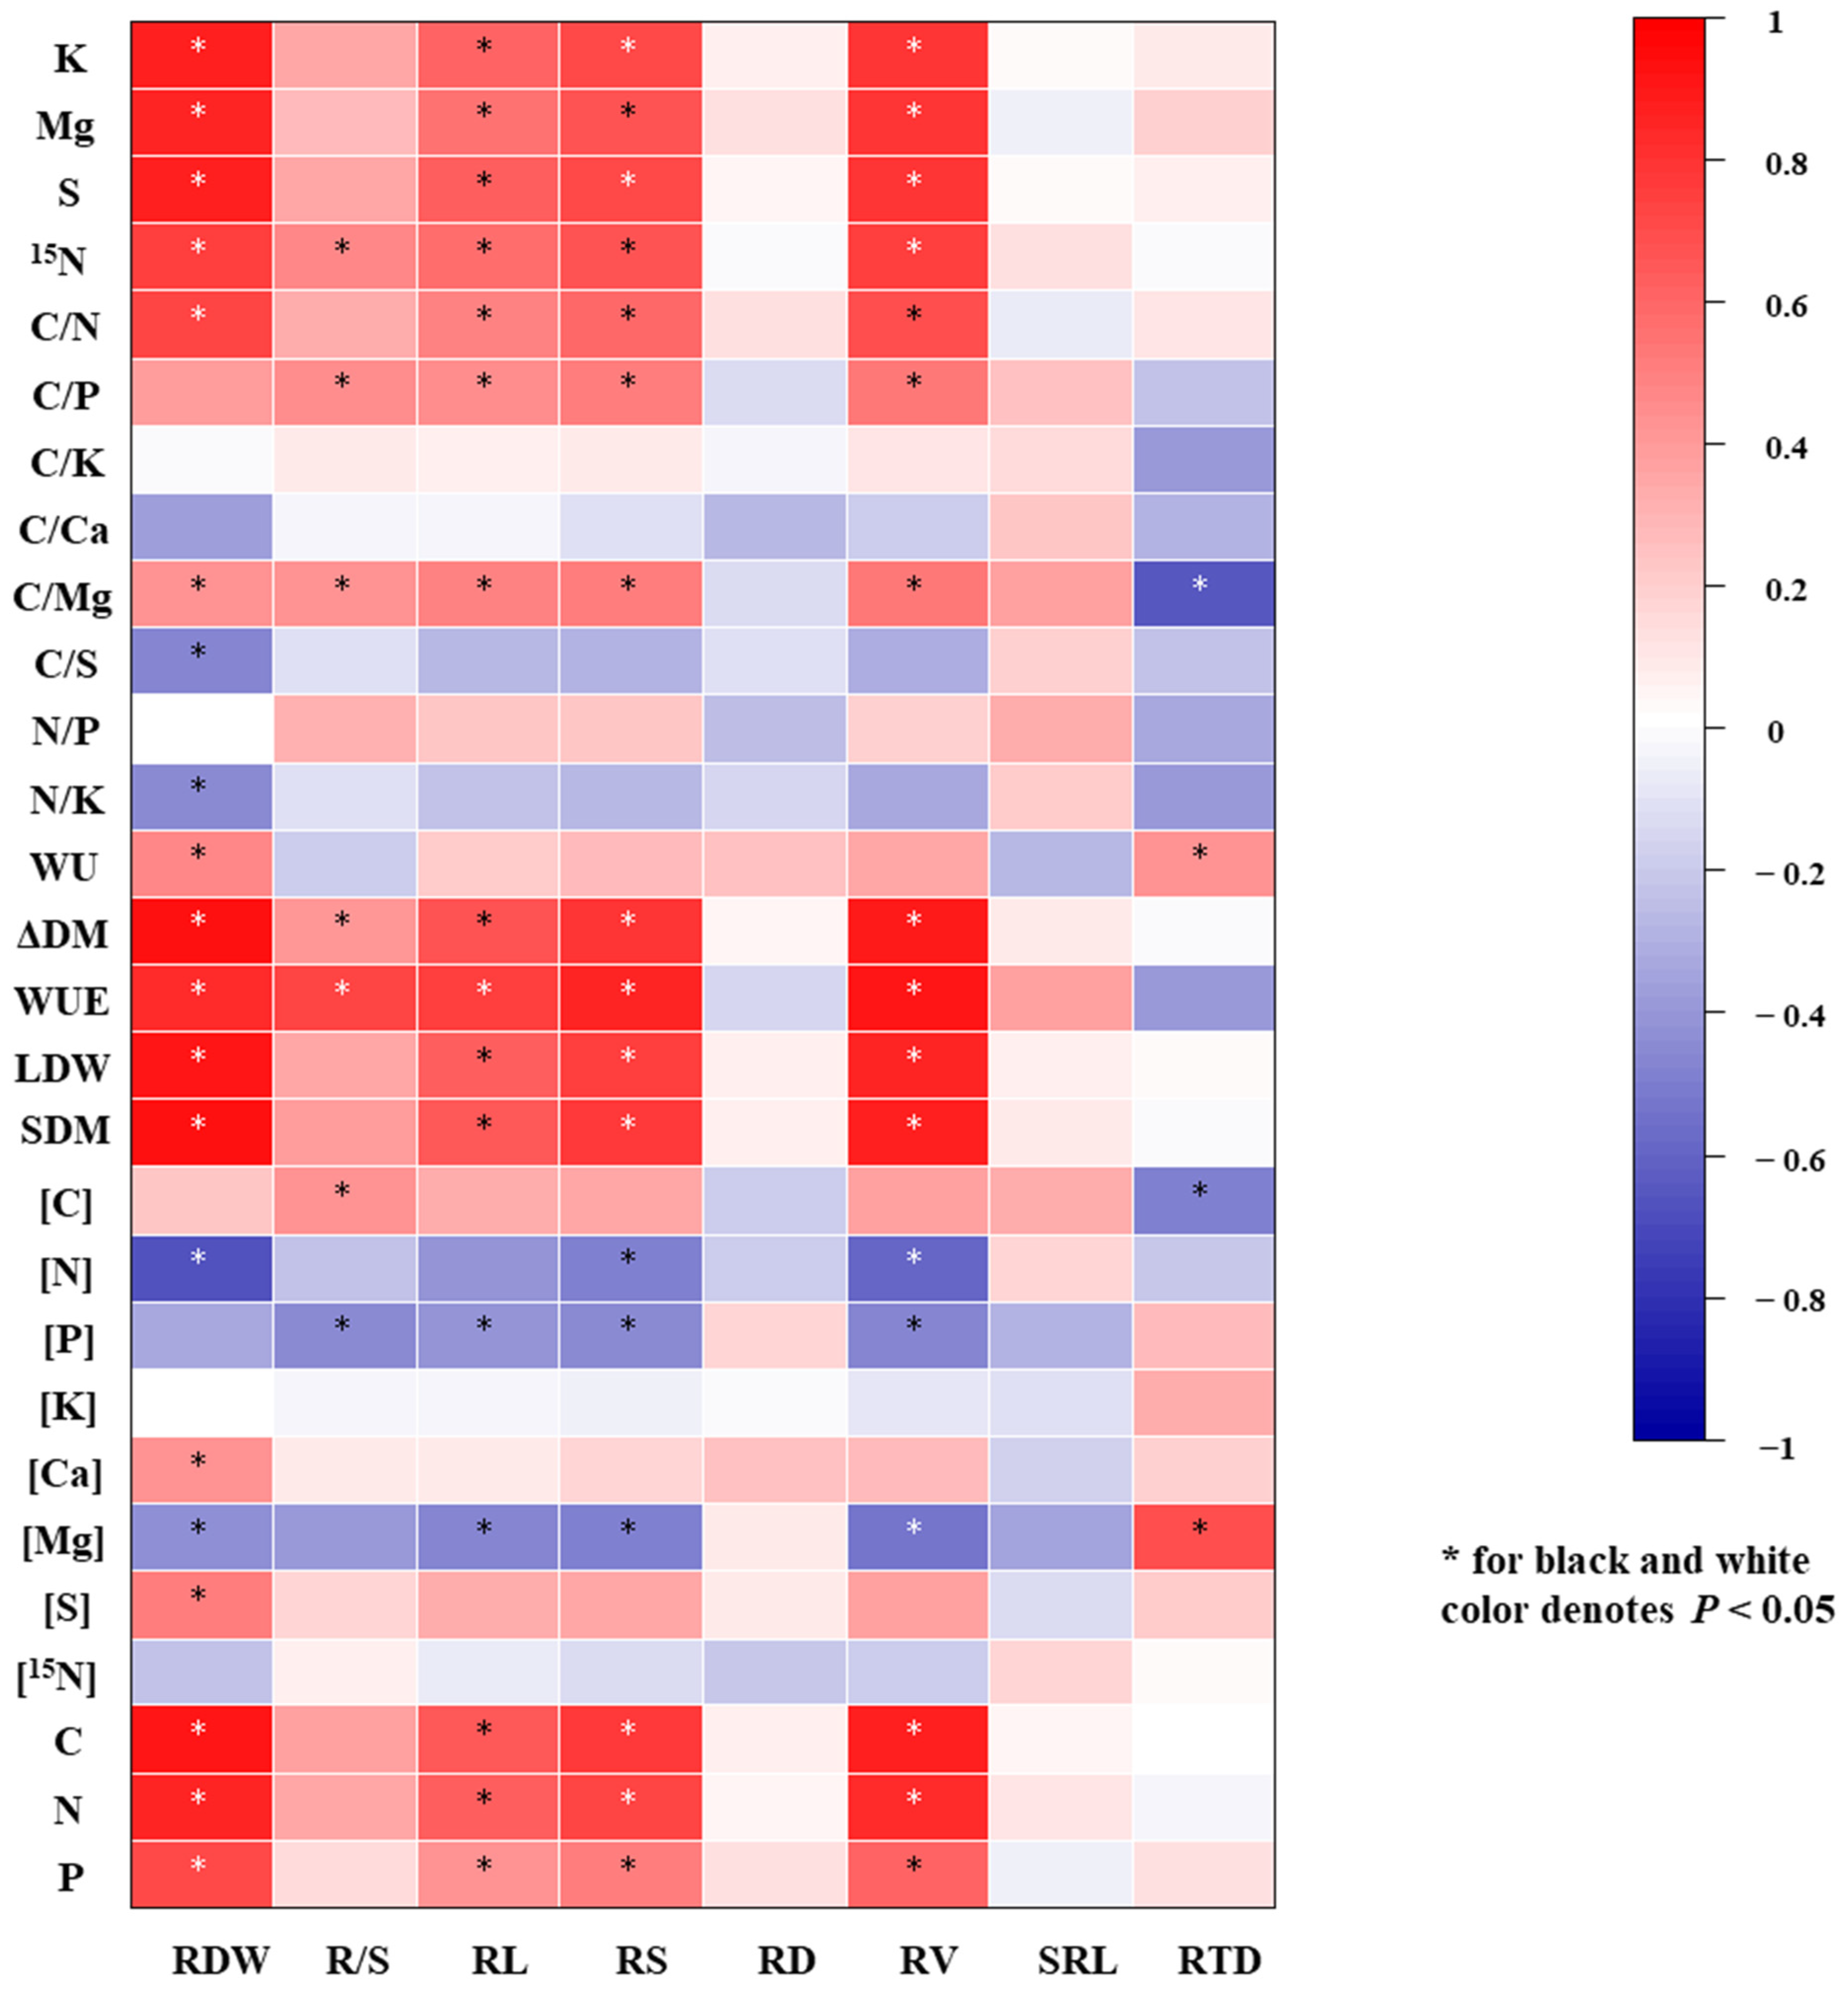
3.6. The Pearson Correlation Analysis between Root Morphology Traits and Tomato Growth, Element Concentrations, Element Uptakes and Stoichiometric Ratios

The Pearson correlation analysis results indicate that ΔDM, LDM, WU, WUE, SDW, leaf element uptakes, leaf C/N and C/Mg were all significantly positively correlated, whereas leaf [Mg] was significantly negatively correlated with RV, RS, RL and RDW (Figure 5). ΔDM, WUE, leaf 15N uptake, leaf [C], leaf C/Mg and C/P correlated significantly positively, whereas leaf [P] correlated significantly negatively, with R/S. RD was significantly positively correlated with WU and leaf [Mg], but significantly negatively with leaf [C] and leaf C/Mg.

3.7. PCA Analysis of Tomato Parameters

PCA plots of tomato attributes for tomato plants including plant growth parameters, plant root morphology parameters, leaf element concentrations, leaf element uptakes and leaf nutrition stoichiometry ratios are shown in Figure 6. PC1 and PC2 explained 45.0% and 20.8% of the variation in tomato attributes, respectively. The clusters for tomato plants are distinct, since a[CO2] and e[CO2] treatments are distributed on the left and right sides of the PCA plot, respectively. a[CO2] is clustered in the same direction as the vectors of [N], [15N], [Mg], [P], leaf C/S, leaf N/K and C/Ca, indicating tomatoes grown under a[CO2] had higher values of these parameters. [C400, FI] is clustered in the same direction as leaf [Mg] and [P], indicating it had higher values of these parameters. [C400, DI] and [C400, PRI] are clustered towards higher [N], [15N], leaf C/S, N/K and C/Ca. e[CO2] is clustered towards higher ΔDM, SDW, RDW, LDW, WU, WUE, RL, RS, RV, R/S, SRL, mineral nutrient uptakes, leaf [C], [Ca], [S], leaf C/N, C/P and C/Mg. [C800, PRI] is clustered to the upper right side of the PCA plot, possessing higher RL, RS, RV, RDW, SRL, R/S, WUE, leaf C/P, C/Mg and [C]. [C800, FI] is clustered to the bottom right of the PCA plot, showing higher leaf C, Ca, S, Mg, P, K, [Ca], [S] and plant WU, but lower leaf [N] and [15N], and leaf C/Ca, C/S and N/K.

4. Discussion

Root morphological traits mediate the responses of the shoot to environmental changes, which are altered under PRI and e[CO2] scenarios. Nevertheless, most studies have concentrated on the effects of PRI combined with e[CO2] on the aboveground tissues [5,28], and less information is available on roots. In the present study, the responses of plant growth, root morphological traits, leaf element concentration and uptake, and leaf element stoichiometry in tomato plants to different irrigation regimes under e[CO2] were studied. The results confirm our hypothesis that PRI has a positive effect on root morphological traits related to mineral nutrient uptake, relieving the negative effect on leaf mineral nutrient concentrations and optimizing leaf stoichiometrical ratios related to e[CO2]. More importantly, studying root morphological traits would deepen our understanding of the effect of PRI on nutrient status and element balance in plants grown under e[CO2].

4.1. The Effects of PRI on Plant Biomass, Biomass Allocation and Water Use Efficiency under e[CO2]

In accordance with the findings of Pazzagli et al. [31] and Wei et al. [5], the ∆DM, SDM, LDM and RDM values of tomatoes were greater under e[CO2] than a[CO2] (Table 1 and Table 2, Figure 6). In addition, in the present study, despite the 30% water reduction relative to the FI plants, reduced irrigation led to similar ∆DM values in tomato plants grown under both CO2 conditions. This coincides with the evidence in the literature [17,18,32], and it is believed that both DI and PRI could consume 25–50% less water without significant reductions in biomass compared to FI. Therefore, reduced irrigation resulted in higher WUE than under FI with both CO2 conditions, since WUE was calculated as ∆DM/WU. e[CO2] has been suggested to cause reduced plant WU as a result of a decline in leaf stomatal conductance [4]. Nonetheless, decreased stomatal conductance could increase leaf temperature, and accordingly enhance the rates of leaf transpiration [33]. On the other hand, plants grown under high [CO2] usually have larger leaf areas, RS and RV, which increases the transpiration of whole plants as well as water acquisition [33,34]. Although leaf area was not measured in this study, e[CO2] led to larger LDM (+101.5%), RS, RV and RDW than a[CO2] (Table 1 and Table 2, Figure 6), and WU was positively associated with RDW (Figure 5). The greater LDM value reflects a larger leaf area, combined with a larger RDW, which could imply the response of an increase in WU to CO2 enrichment. Therefore, plants grown under e[CO2] might be able to totally offset the effects of lowered stomatal conductance, and ultimately bring about an increase in transpiration and WU at the plant level. Tomato plants exposed to e[CO2] achieved 45.3% higher WUE than those exposed to a[CO2] (Table 1, Figure 6). We ascribe this result to the 102.6% increase in ∆DM and 38.5% increase in WU (Table 1).
Furthermore, biomass allocation to different plant tissues is affected by growth environment [35], and changes in biomass allocation patterns provide an explanation of the physiological differences in plants grown in various environments [36]. One theory of functional equilibrium is that plants shift their biomass allocation towards the part that is short of resources [37], which means that under e[CO2], the photosynthesis rate per unit of leaf mass is increased, and nutrient demand may also be increased due to accelerated plant growth, but transpiration rate and mineral nutrient mass flows will be decreased, which increases the need to allocate more biomass to the roots [35]. Many previous studies have indicated that the root biomass of most horticultural crops is enhanced under e[CO2], and is often stimulated more notably than shoot biomass, with increases in R/S taking place more frequently [14,38,39,40]. In agreement with these findings, our results show that, compared to a[CO2], e[CO2] more significantly increased the biomass allocation to leaves and roots from stems, and enhanced RDW by 139.2% and R/S by 20% (Table 1 and Table 2).
Similarly, according to functional equilibrium theory [35], water uptake is decreased per unit root mass, and a decline in nutrient uptake may occur due to a decrease in mass flow, which is expected to increase biomass allocation to roots under drought conditions [35]. Moreover, many studies have also shown that PRI could reduce the leaf area, as well as leaf and stem biomass [31], but could promote root growth and increase biomass allocation to roots from the shoot organs [41], as well as increasing R/S [21,42]. These findings are partly consistent with our findings that reduced irrigation increases RDM, R/S ratio and biomass allocation to roots from leaves (Table 1). Hence the lower LDW and LMR under reduced irrigation regimes, which are due to the greater amount of ΔDM allocated to stems and roots compared to under FI (Table 1). The reasons for the enhanced SMR in this study are still unknown, and need to be studied further. Our findings suggest that the allocation of more biomass to roots and higher R/S could, to some extent, mean that the tomato plants will have a stronger ability to capture water and nutrients.

4.2. The Effects of PRI on Root Morphological Traits of Tomato Leaves under e[CO2]

Generally, the roots of higher plants are the only tissues responsible for mineral nutrient uptake, hence the growth and development of roots greatly affects the ability of plants to acquire mineral nutrients and water [43]. The growth of roots is in close coordination with the supply of photosynthesis-derived energy from the shoot [44]; in turn, mineral nutrient uptake by the roots has a strong effect on the shoot growth and development [45]. Consistently with these results, our results show that RDW, RL, RS and RV were positively correlated with ΔDM, SDW and LDW (Figure 5). In addition, root growth is highly sensitive to soil mineral nutrients and water conditions [43,46]. Plants could achieve a fast relative growth rate, deeper resource exploration and more rapid water and nutrient acquisition rates by increasing their RL, RS, RV and SRL, and decreasing RD and RTD, allowing them to extend their root systems with low investment in dry matter under limited resource conditions [40,47,48,49]. This has been considered as an important indicator of the strategy of plant resource use [47]. Likewise, in this study, reduced irrigation under either CO2 condition increased root system size, and enhanced RL, RS, RV, and SRL, but decreased RTD (Table 2). These results may be due to the upregulation of genes controlling root RL, RS, RV and the elongation of seminal roots under reduced irrigation [46]. Furthermore, ABA induced by reduced irrigation promotes seminal root elongation, and lateral root development and branching [50], vie the upregulation of the expression of auxin-related genes [51], and the inhibition of the synthesis of ethylene [46]. Additionally, a decline in RD and RTD is considered a functional trait of drought tolerance, and RD and RTD regulate SRL and RS per root biomass [52]. In the present study, the increased levels of SRL under reduced irrigation (particularly under PRI with e[CO2]) were due to the decreased RTD, while no influence was seen on RD as compared with FI, implying that tomato plants grown under reduced irrigation had a higher efficiency in water and nutrient acquisition via the exploration of a greater soil volume per unit of dry matter investment in root length [53] compared to those grown under FI. However, the lack of decline in RD under reduced irrigations requires further study.
In addition, many studies have demonstrated that root traits are sensitive to e[CO2] [14,43]. e[CO2] stimulates root growth much more effectively than shoot growth, increasing RL, RD, RV, RS, RTD, R/S and RDW [40,54,55], while decreasing the SRL of the absorptive root [56], and the efficiency of direct water and nutrient acquisition [57,58]. In this study, we found that e[CO2] increased RL, RS, RV, R/S and RDW compared to a[CO2] (Table 2, Figure 6). These results may be attributed to e[CO2] allocating more biomass to roots, but with little effect on RD, RTD and SRL in tomato plants (Table 2, Figure 6), since an increase in root biomass can reflect an increase in total RL or average RD or RTD [59]. The equivalent SRL values indicate that the tomato plants achieved similar efficiency in direct water and nutrient acquisition under the two CO2 regimes. Additionally, the rapid growth caused by e[CO2] is related to the synthesis of auxin in shoots, which is transported to the root and stimulates primary root elongation and lateral root development [43], resulting in the enhanced RL, RS and RV values of tomato plants grown under e[CO2].
We found an interactive effect between [CO2] and IR on SRL (Table 2). Compared to a[CO2], e[CO2] increased SRL under FI and PRI, while it decreased it under DI. This might be partly due to e[CO2] showing similar RTD values under the three irrigation regimes, a slight decrease in RD under FI and PRI, and a tiny increase in RD under DI in relative to a[CO2]. This is because RD and RTD regulate SRL and RS [52].
Nutrient uptake in roots is achieved in three ways, namely, root interception, mass flow and diffusion [43,60]. Root interception depends on the contents of nutrients in the soil where the roots grow, and the quantity of nutrients intercepted by the roots is equivalent to the amount of nutrients in a volume of soil identical to the root volume [43]; therefore, enhanced RL, RS and RV can increase root nutrient interception. Mass flow and diffusion are the modes of transport of nutrients from the bulk soil to the root surface [60,61]. The further increased values of RS, RL, RV and SRL in tomato plants grown under PRI with e[CO2] (Table 2, Figure 6) would be more beneficial to the acquisition of diffusion-limited nutrients, such as phosphorus and potassium, whereas the co-optimization of traits improving water acquisition would also more notably assist in the acquisition of soluble mobile resources, such as nitrate, calcium, magnesium and sulfur [53]. In good agreement with these findings, the RL, RS, RV and RDW were also significantly positively correlated with element uptake.

4.3. The Effects of PRI on Leaf Nutrient Concentration, Nutrient Uptake, and Nutrient Stoiochiometry of Tomato Leaves under e[CO2]

Plant nutrient uptake depends not only on the morphological traits of roots, but also on plant physiological properties and the nutrient availability in the soil [43]. It is reported that the mass flow of a nutrient is driven by transpiration, drawing water from roots and releasing it to the atmosphere, which can be calculated as nutrient concentration multiplied by the amount of water transpired, and the mass flow of water is equal to the volume of water transpired [61]. In this study, e[CO2] was found to enhance the WU (amount of water transpired) of tomato plants more notably than a[CO2] with the same supply of mineral nutrients to the plants, which indicates that the mineral nutrient mass flow was enhanced, or at least not lowered. In addition, RL, RS, RV and RDW were significantly positively correlated with element uptakes (Figure 5). These might be the reasons for the enhanced levels of mineral nutrient uptake and leaf [Ca] and [S], and similar leaf [C], [P], K and [15N] values, of tomato plants grown under e[CO2] (Table 3 and Table 4).
Furthermore, compared with a[CO2], e[CO2] increased the LDM and leaf N and Mg uptake, respectively, by 101.46%, 75.16%, and 87.8%, which led to a reduced leaf [N] and leaf [Mg], respectively, by 13.1% and 6.9% (Table 1, Table 3 and Table 4). Additionally, e[CO2] enhanced leaf carbon uptake by 102.37%, leading to increased leaf C/N and C/Mg. Therefore, the decrease in leaf [N] and [Mg], and the higher leaf C/N and C/Mg, were mainly due to the dilution effect [4].
Plant 15N values are related to the acquisition, assimilation and allocation of N [62]. It has been reported that 15N uptake under a[CO2] is greater than that under e[CO2] in Arabidopsis [63]. In leaves, 15N concentration shows a positive correlation with N concentration [64]. However, we found that e[CO2] enhanced 15N uptake, while it had little effect on leaf [15N] and decreased leaf [N], as compared with a[CO2] (Table 3 and Table 4, Figure 6). These results might be attributed to the N of leaves being transported to stems and roots, and the fractionation of 15N during the reallocation of N, leaving 15N in leaves during the faster growth period [65].
Stoichiometry assesses comparative ratios of nutrients [12]. Recent studies have stated that leaf C/N, C/P, C/K, C/Mg, C/Ca and C/S could be used to indicate variations in the balance between leaf structural (i.e., cell wall construction) and metabolic functional (i.e., photosynthesis and synthesis of biomolecules) investments [13,66]. Leaf stoichiometry can also demonstrate leaf structural and metabolic strategies, such as regarding leaf C and Ca (primarily linked with cell wall construction), P and K (mostly used in regulating leaf cell protoplasm metabolic status), and N, Mg and S (associated with both leaf structural function and metabolic activity) [13,66]. Furthermore, the nutrient ratios can reflect the relative availabilities of nutrients, and can be used to determine the degree of nutrient limitation [67]. When a plant’s N/P ratio is <14, N is limited, and when the plant N/P ratio is >16, P is limited, whereas within this range (combined with a N/K ratio = 2.1), the effects of fertilization are not unequivocally related to N/P and N/K ratio [68,69]. But when the N/K ratio is <2.1, N is limited, and when the N/K ratio is >2.1, K is limited [69]. In this study, compared to a[CO2], e[CO2] increased leaf C/N and C/Mg, while it decreased C/Ca, C/S and N/K, and had no influence on leaf C/P, C/K and N/P, with N/P < 14 and N/K < 2.1 (Figure 3 and Figure 4). These results indicate that N limits tomatoes growth under e[CO2], and e[CO2] positively affects cell wall construction but negatively influences leaf cell protoplasm metabolism.
It has been reported that the drying and wetting cycles of soil under PRI enhance root growth [41] and improve leaf mineral nutrient concentrations [18]. In accordance with these results, we found that reduced irrigation methods enhanced RL, RS, RV, SRL and R/S, particularly under PRI (Table 2). RDW, RL, RS and RV correlated positively with element uptakes, LDW, and leaf C/N and C/Mg, whereas they correlated negatively with leaf [N], [P] and [Mg] (Figure 6); this might be due to the greater LDW diluting the leaf N, P and Mg concentrations in tomato leaves exposed to e[CO2]. In partial agreement with previous studies [18], here, the reduced irrigation plants showed equivalent leaf [N], [K] and [S], leaf C and N uptakes and leaf C/N, C/K and N/K, increased leaf [C] and [15N] and leaf C/P, C/Ca, C/Mg, C/S and N/P, and decreased leaf [P], [Ca] and [Mg] and leaf P, K, Ca, Mg and S, compared to FI (Table 4, Figure 3 and Figure 4). The reductions in mineral nutrient uptake were mostly due to the reduced LDW under reduced irrigation (particularly under PRI). The element uptakes were computed as LDW multiplied by element concentration. Moreover, the decreases in leaf [P], [Ca] and [Mg] under reduced irrigation were due to the reduced diffusion of soil P and the mass flow of soil Ca and Mg under reduced irrigations [70,71]. The similar levels of leaf [N], [K] and [S] under FI might be due to the positive effects of bioavailability on mineral nutrients under PRI [18]. The equivalent leaf C/N, C/K and N/K values were due to the similar levels of increase in leaf [C], [N] and [K], while the increases in leaf C/P, C/Ca, C/Mg, C/S and N/P were due to the increased leaf [C], the decreased leaf P, [Ca] and [Mg], and the equivalent leaf [N]. Additionally, the results regarding the stoichiometric ratio suggest greater C but less Ca investment to leaf cell wall construction, less P investment to the leaf cell protoplasm metabolic ability, and less Mg investment to leaf structural and metabolic activity [13].
The reduced irrigation methods enhanced leaf [15N], but led to similar leaf [N] values, relative to FI, which result is attributed to leaf N transportation to the stems and roots, with higher 15N left in the leaves due to 15N discrimination during leaf N reallocation [65]. More dry mass was allocated to the stems and roots with reduced irrigation (Table 1), implying that these tissues needed more N.
An interaction was found between [CO2] and IR in terms of their effects on leaf P uptake and leaf N/P (Table 4 and Figure 4). Compared to a[CO2], e[CO2] led to a smaller increase in leaf P uptake under PRI than under FI and DI, while e[CO2] decreased leaf N/Punder FI and DI but enhanced itunder PRI. The lower increase in leaf P uptake under PRI with e[CO2] was mostly due to the e[CO2] reducing leaf [P] under PRI in comparison with a[CO2] (Table 3). e[CO2] reduced leaf N/P under FI and DI, whereas it increased it under PRI, which was attributed to e[CO2] causing a greater decrease in leaf N than in leaf [P] under FI and DI, and non-significantly lowering leaf [N] but significantly decreasing leaf P under PRI relative to a[CO2].
Moreover, compared to a[CO2], e[CO2] led to similar leaf [C], [K] and [Mg] and leaf C/K and C/Mg, decreased leaf N and P and leaf C/Ca, C/S and N/K, and increased leaf [Ca] and [S] and leaf C/N, C/P and N/P, under PRI. These results indicate that PRI could increase leaf [Mg], and maintain or improve most leaf mineral nutrient concentrations and element stoichiometric ratios in tomatoes grown under e[CO2]. The decreased leaf [N] and [P] were due to the dilution effect. Compared to a[CO2], e[CO2] increased LDW by 100%, but enhanced leaf N and P uptake, respectively, by 90% and 54.8% under PRI. The similar levels of leaf [K] and [Mg] and enhanced levels of leaf [Ca] and [S] might be attributed to the increased RL, RS and RV (Table 2) and the higher degree of transpiration (WU) (Table 1). The different effects of PRI under the two [CO2] conditions on stoichiometric ratios were due to the changes in element concentration.
Furthermore, under e[CO2], PRI led to an increase in leaf [C] and [N], and no decrease in leaf [K], [Ca], [Mg], [S] and [15N], but it caused a decrease in leaf C/N as compared with FI. The similar mineral nutrient concentrations under PRI might be ascribed to the elevated RL, RS, RV and SRL (Table 2, Figure 6) and the improved bioavailability of mineral nutrients as induced by PRI [18]. These results suggest that PRI had the ability to improve N concentration, maintain most other mineral nutrient concentrations, and improve leaf C/N under e[CO2]. The reduced leaf C/N was due to the higher leaf [N] under PRI. These results are consistent with our previous finding that PRI could alleviate the negative effects on N concentration caused by e[CO2] [6,28].

5. Conclusions

Collectively, the reduced irrigation methods had no effect on ΔDM and SDW, stimulated root growth, increased R/S ratio, elevated RL, RS, RV and SRL, and improved the WUE of tomato plants. e[CO2] was shown to further stimulate root growth, enlarge the root system, enhance R/S ratio and improve the plant WUE of tomatoes grown under PRI. Compared with a[CO2], e[CO2] led to similar leaf [C], [K] and [Mg] and leaf C/K and C/Mg, and increased leaf [Ca], [S] and leaf C/N, C/P and N/P, but it decreased leaf [N] and [P] and leaf C/Ca, C/S and N/K under PRI. Additionally, under e[CO2], PRI led to an increase in leaf C, and no difference in leaf [N], [K], [Ca], [Mg], [S] and [15N], but it caused a decrease in leaf C/N as compared with FI. Accordingly, PRI could improve plant WUE, and had the ability to alleviate the negative effects on N concentration while maintaining the concentrations of most other mineral nutrients and optimizing leaf stoichiometric ratios under e[CO2]. Therefore, PRI is recommended as a mode of IR for improving WUE and optimizing nutrient status in tomato plants under a future water-deficient and CO2-enriched scenario.

Author Contributions

Conceptualization, F.L. and G.W.; methodology, F.L., G.W., X.X., B.C. and M.Z.; software, G.W. and X.X.; formal analysis, G.W.; investigation, G.W., X.X, B.C., M.Z., J.L. and Z.W.; data curation, G.W.; writing—original draft preparation, G.W.; writing—review and editing, F.L.; supervision, Z.W.; funding acquisition, Z.W. All authors have read and agreed to the published version of the manuscript.

Funding

This work was supported by the National Natural Science Foundation of China (51909220).

Data Availability Statement

The data related to this study are shown in the paper. Any additional data may be acquired from the corresponding author upon request.

Acknowledgments

We were grateful to the college of Natural Resources and Environment for analyzing element concentrations and ensuring laboratory safety and services, making plant growth chambers available for use.

Conflicts of Interest

The authors declare no conflict of interest.

References

  1. IPCC. Climate Change 2014: Synthesis Report. Contribution of Working Groups I, II and III to the Fifth Assessment Report of the Intergovernmental Panel on Climate Change; CoreWriting Team, Pachauri, R.K., Meyer, L.A., Eds.; IPCC: Geneva, Switzerland, 2014. [Google Scholar]
  2. Ainsworth, E.A.; Long, S.P. What have we learned from 15 years of free-air CO2 enrichment (FACE)? A meta-analytic review of the responses of photosynthesis, canopy properties and plant production to rising CO2. New Phytol. 2005, 165, 351–371. [Google Scholar] [CrossRef] [PubMed]
  3. Ainsworth, E.A.; Long, S.P. 30 years of free-air carbon dioxide enrichment (FACE): What have we learned about future crop productivity and its potential for adaptation? Glob. Chang. Biol. 2021, 27, 27–49. [Google Scholar] [CrossRef] [PubMed]
  4. Leakey, A.D.; Ainsworth, E.A.; Bernacchi, C.J.; Rogers, A.; Long, S.P.; Ort, D.R. Elevated CO2 effects on plant carbon, nitrogen, and water relations: Six important lessons from FACE. J. Exp. Bot. 2009, 60, 2859–2876. [Google Scholar] [CrossRef] [PubMed]
  5. Wei, Z.; Du, T.; Li, X.; Fang, L.; Liu, F. Interactive effects of CO2 concentration elevation and nitrogen fertilization on water and nitrogen use efficiency of tomato grown under reduced irrigation regimes. Agric. Water Manag. 2018, 202, 174–182. [Google Scholar] [CrossRef]
  6. Yang, X.; Bornø, M.L.; Wei, Z.; Liu, F. Combined effect of partial root drying and elevated atmospheric CO2 on the physiology and fruit quality of two genotypes of tomato plants with contrasting endogenous ABA levels. Agric. Water Manag. 2021, 254, 106987. [Google Scholar] [CrossRef]
  7. McDonald, E.P.; Erickson, J.E.; Kruger, E.L. Can decreased transpiration limit plant nitrogen acquisition in elevated CO2? Funct. Plant Biol. 2002, 22, 1115–1120. [Google Scholar] [CrossRef] [PubMed]
  8. Myers, S.S.; Zanobetti, A.; Kloog, I.; Huybers, P.; Leakey, A.D.; Bloom, A.J.; Carlisle, E.; Dietterich, L.H.; Fitzgerald, G.; Hasegawa, T.; et al. Increasing CO2 threatens human nutrition. Nature 2014, 510, 139–142. [Google Scholar] [CrossRef]
  9. Loladze, I. Hidden shift of the ionome of plants exposed to elevated CO2 depletes minerals at the base of human nutrition. eLife 2014, 3, e02245. [Google Scholar] [CrossRef]
  10. Müller, C.; Elliott, J.; Levermann, A. Fertilizing hidden hunger. Nat. Clim. Chang. 2014, 4, 540–541. [Google Scholar] [CrossRef]
  11. Loladze, I. Rising atmospheric CO2 and human nutrition: Toward globally imbalanced plant stoichiometry? Trends Ecol. Evol. 2002, 17, 457–461. [Google Scholar] [CrossRef]
  12. Kundu, P.; Goel, K.; Zinta, G. Nutritional imbalance in plants under rising atmospheric CO2. In Plant Nutrition and Food Security in the Era of Climate Change; Academic Press: Cambridge, MA, USA, 2022; pp. 513–536. [Google Scholar]
  13. Xing, K.; Zhao, M.; Niinemets, U.; Niu, S.; Tian, J.; Jiang, Y.; Chen, H.Y.H.; White, P.J.; Guo, D.; Ma, Z. Relationships Between Leaf Carbon and Macronutrients Across Woody Species and Forest Ecosystems Highlight How Carbon Is Allocated to Leaf Structural Function. Front. Plant Sci. 2021, 12, 674932. [Google Scholar] [CrossRef] [PubMed]
  14. Benlloch-Gonzalez, M.; Bochicchio, R.; Berger, J.; Bramley, H.; Palta, J.A. High temperature reduces the positive effect of elevated CO2 on wheat root system growth. Field Crops Res. 2014, 165, 71–79. [Google Scholar] [CrossRef]
  15. Chaudhuri, U.N.; Kirkham, M.B.; Kanemasu, E.T. Root Growth of Winter Wheat under Elevated Carbon Dioxide and Drought. Crop Sci. 1990, 30, 853–857. [Google Scholar] [CrossRef]
  16. Uddin, S.; Low, M.; Parvin, S.; Fitzgerald, G.J.; Tausz-Posch, S.; Armstrong, R.; O’Leary, G.; Tausz, M. Elevated [CO2] mitigates the effect of surface drought by stimulating root growth to access sub-soil water. PLoS ONE 2018, 13, e0198928. [Google Scholar] [CrossRef] [PubMed]
  17. Kang, S.; Zhang, J. Controlled alternate partial root-zone irrigation: Its physiological consequences and impact on water use efficiency. J. Exp. Bot. 2004, 55, 2437–2446. [Google Scholar] [CrossRef] [PubMed]
  18. Wang, Y.S.; Liu, F.L.; Andersen, M.N.; Jensen, C.R. Improved plant nitrogen nutrition contributes to higher water use efficiency in tomatoes under alternate partial root-zone irrigation. Funct. Plant Biol. 2010, 37, 175–182. [Google Scholar] [CrossRef]
  19. Dodd, I.C. Soil moisture heterogeneity during deficit irrigation alters root-to-shoot signalling of abscisic acid. Funct. Plant Biol. 2007, 34, 439–448. [Google Scholar] [CrossRef]
  20. Wang, Y.S.; Liu, F.L.; Jensen, C.R. Comparative effects of partial root-zone irrigation and deficit irrigation on phosphorus uptake in tomato plants. J. Hortic. Sci. Biotechnol. 2012, 87, 600–604. [Google Scholar] [CrossRef]
  21. Kang, S.Z.; Liang, Z.S.; Hu, W.; Zhang, J.H. Water use efficiency of controlled alternate irrigation on root-divided maize plants. Agric. Water Manag. 1998, 38, 69–76. [Google Scholar] [CrossRef]
  22. Kang, S.Z.; Shi, W.J.; Cao, H.X.; Zhang, J.H. Alternate watering in soil vertical profile improved water use effciency of maize (Zea mays). Field Crops Res. 2002, 77, 31–41. [Google Scholar] [CrossRef]
  23. Wang, L.; de Kroon, H.; Bogemann, G.M.; Smits, A.J.M. Partial root drying effects on biomass production in Brassica napus and the significance of root responses. Plant Soil. 2005, 276, 313–326. [Google Scholar] [CrossRef]
  24. Dodd, I.C. Rhizosphere manipulations to maximize ‘crop per drop’ during deficit irrigation. J. Exp. Bot. 2009, 60, 2454–2459. [Google Scholar] [CrossRef]
  25. Birch, H.F. The Effec tOf Soi lDrying On Humus Decomposition and Nitrogen availability. Plant Soil. 1958, 1, 9–31. [Google Scholar] [CrossRef]
  26. Wang, Y.S.; Liu, F.L.; Jensen, C.R. Comparative effects of deficit irrigation and alternate partial root-zone irrigation on xylem pH, ABA and ionic concentrations in tomatoes. J. Exp. Bot. 2012, 63, 1907–1917. [Google Scholar] [CrossRef] [PubMed]
  27. Bünemann, E.K.; Keller, B.; Hoop, D.; Jud, K.; Boivin, P.; Frossard, E. Increased availability of phosphorus after drying and rewetting of a grassland soil: Processes and plant use. Plant Soil. 2013, 370, 511–526. [Google Scholar] [CrossRef]
  28. Wei, G.; Zhang, M.; Cui, B.; Wei, Z.; Liu, F. Ammonium nitrogen combined with partial root-zone drying enhanced fruit quality of tomato under elevated atmospheric CO2. Sci. Hortic. 2024, 323, 112514. [Google Scholar] [CrossRef]
  29. Darby, L.A.; Ritchie, D.B.; Taylor, I.B. Isogenic Lines of the Tomato ‘Ailsa Craig’; Annual Report Glasshouse Crops Research Institute, tgrc.ucdavis.edu; Dorset Press: Dorchester, UK, 1977; pp. 168–184. [Google Scholar]
  30. Liu, X.; Ma, Y.; Manevski, K.; Andersen, M.N.; Li, Y.; Wei, Z.; Liu, F. Biochar and alternate wetting-drying cycles improving rhizosphere soil nutrients availability and tobacco growth by altering root growth strategy in Ferralsol and Anthrosol. Sci. Total Environ. 2021, 806, 150513. [Google Scholar] [CrossRef] [PubMed]
  31. Pazzagli, P.T.; Weiner, J.; Liu, F. Effects of CO2 elevation and irrigation regimes on leaf gas exchange, plant water relations, and water use efficiency of two tomato cultivars. Agric. Water Manag. 2016, 169, 26–33. [Google Scholar] [CrossRef]
  32. Elhani, S.; Haddadi, M.; Csákvári, E.; Zantar, S.; Hamim, A.; Villányi, V.; Douaik, A.; Bánfalvi, Z. Effects of partial root-zone drying and deficit irrigation on yield, irrigation water-use efficiency and some potato (Solanum tuberosum L.) quality traits under glasshouse conditions. Agric. Water Manag. 2019, 224, 105745. [Google Scholar] [CrossRef]
  33. Reddy, A.R.; Rasineni, G.K.; Raghavendra, A.S. The impact of global elevated CO2 concentration on photosynthesis and plant productivity. Curr. Sci. 2010, 99, 46–57. [Google Scholar]
  34. Fleisher, D.H.; Timlin, D.J.; Reddy, V.R. Interactive Effects of Carbon Dioxide and Water Stress on Potato Canopy Growth and Development. Agron. J. 2008, 100, 711–719. [Google Scholar] [CrossRef]
  35. Poorter, H.; Nagel, O. The role of biomass allocation in the growth response of plants to different levels of light, CO2, nutrients and water: A quantitative review. Aust. J. Plant Physiol. 2000, 27, 595–607. [Google Scholar]
  36. Kizildeniz, T.; Pascual, I.; Irigoyen, J.J.; Morales, F. Future CO2, warming and water deficit impact white and red Tempranillo grapevine: Photosynthetic acclimation to elevated CO2 and biomass allocation. Physiol. Plant 2021, 172, 1779–1794. [Google Scholar] [CrossRef] [PubMed]
  37. Brouwer, R. Distribution of dry matter in the plant. Neth. J. Agric. Sci. 1962, 10, 361–376. [Google Scholar] [CrossRef]
  38. Benlloch-Gonzalez, M.; Berger, J.; Bramley, H.; Rebetzke, G.; Palta, J.A. The plasticity of the growth and proliferation of wheat root system under elevated CO2. Plant Soil. 2013, 374, 963–976. [Google Scholar] [CrossRef]
  39. Madhu, M.; Hatfield, J.L. Dynamics of Plant Root Growth under Increased Atmospheric Carbon Dioxide. Agron. J. 2013, 105, 657–669. [Google Scholar] [CrossRef]
  40. Rogers, H.H.; Peterson, C.M.; Mccrimmon, J.N.; CURE, J.D. Response of plant roots to elevated atmospheric carbondioxide. Plant Cell Environ. 1992, 15, 749–752. [Google Scholar] [CrossRef]
  41. Mingo, D.M.; Theobald, J.C.; Bacon, M.A.; Davies, W.J.; Dodd, I.C. Biomass allocation in tomato (Lycopersicon esculentum) plants grown under partial rootzone drying: Enhancement of root growth. Funct. Plant Biol. 2004, 31, 971–978. [Google Scholar] [CrossRef]
  42. Chen, C.; Xu, F.; Zhu, J.R.; Wang, R.F.; Xu, Z.H.; Shu, L.Z.; Xu, W.W. Nitrogen forms affect root growth, photosynthesis, and yield of tomato under alternate partial root-zone irrigation. J. Plant Nutr. Soil. Sci. 2015, 179, 104–112. [Google Scholar] [CrossRef]
  43. Wang, H.; Inukai, Y.; Yamauchi, A. Root Development and Nutrient Uptake. Crit. Rev. Plant Sci. 2007, 25, 279–301. [Google Scholar] [CrossRef]
  44. Ogawa, A.; Kawashima, C.; Yamauchi, A. Sugar Accumulation along the Seminal Root Axis, as Affected by Osmotic Stress in Maize: A Possible Physiological Basis for Plastic Lateral Root Development. Plant Prod. Sci. 2015, 8, 173–180. [Google Scholar] [CrossRef]
  45. Ristova, D.; Busch, W. Natural variation of root traits: From development to nutrient uptake. Plant Physiol. 2014, 166, 518–527. [Google Scholar] [CrossRef] [PubMed]
  46. Ranjan, A.; Sinha, R.; Singla-Pareek, S.L.; Pareek, A.; Singh, A.K. Shaping the root system architecture in plants for adaptation to drought stress. Physiol. Plant 2022, 174, e13651. [Google Scholar] [CrossRef] [PubMed]
  47. Birouste, M.; Zamora-Ledezma, E.; Bossard, C.; Pérez-Ramos, I.M.; Roumet, C. Measurement of fine root tissue density: A comparison of three methods reveals the potential of root dry matter content. Plant Soil. 2013, 374, 299–313. [Google Scholar] [CrossRef]
  48. Kong, D.; Wang, J.; Wu, H.; Valverde-Barrantes, O.J.; Wang, R.; Zeng, H.; Kardol, P.; Zhang, H.; Feng, Y. Nonlinearity of root trait relationships and the root economics spectrum. Nat. Commun. 2019, 10, 2203. [Google Scholar] [CrossRef] [PubMed]
  49. Spitzer, C.M.; Lindahl, B.; Wardle, D.A.; Sundqvist, M.K.; Gundale, M.J.; Fanin, N.; Kardol, P. Root trait-microbial relationships across tundra plant species. New Phytol. 2021, 229, 1508–1520. [Google Scholar] [CrossRef]
  50. Li, Z.; Liu, C.; Zhang, Y.; Wang, B.; Ran, Q.; Zhang, J. The bHLH family member ZmPTF1 regulates drought tolerance in maize by promoting root development and abscisic acid synthesis. J. Exp. Bot. 2019, 70, 5471–5486. [Google Scholar] [CrossRef]
  51. Zhang, Q.; Yuan, W.; Wang, Q.; Cao, Y.; Xu, F.; Dodd, I.C.; Xu, W. ABA regulation of root growth during soil drying and recovery can involve auxin response. Plant Cell Environ. 2022, 45, 871–883. [Google Scholar] [CrossRef]
  52. Wasaya, A.; Zhang, X.; Fang, Q.; Yan, Z. Root Phenotyping for Drought Tolerance: A Review. Agronomy 2018, 8, 241. [Google Scholar] [CrossRef]
  53. Ho, M.D.; Rosas, J.C.; Brown, K.M.; Lynch, J.P. Root architectural tradeoffs for water and phosphorus acquisition. Funct. Plant Biol. 2005, 32, 737–748. [Google Scholar] [CrossRef]
  54. Nie, M.; Lu, M.; Bell, J.; Raut, S.; Pendall, E. Altered root traits due to elevated CO2: A meta-analysis. Glob. Ecol. Biogeogr. 2013, 22, 1095–1105. [Google Scholar] [CrossRef]
  55. Pokorný, R.; Tomášková, I.; Marek, M.V. Response of Norway spruce root system to elevated atmospheric CO2 concentration. Acta Physiol. Plant. 2013, 35, 1807–1816. [Google Scholar] [CrossRef]
  56. Wang, N.; Gao, G.; Wang, Y.; Wang, D.; Wang, Z.; Gu, J. Coordinated responses of leaf and absorptive root traits under elevated CO2 concentration in temperate woody and herbaceous species. Environ. Exp. Bot. 2020, 179, 104199. [Google Scholar] [CrossRef]
  57. Li, X.; Jiang, D.; Liu, F. Soil warming enhances the hidden shift of elemental stoichiometry by elevated CO2 in wheat. Sci. Rep. 2016, 6, 23313. [Google Scholar] [CrossRef] [PubMed]
  58. Taub, D.R.; Wang, X. Why are nitrogen concentrations in plant tissues lower under elevated CO2? A critical examination of the hypotheses. J. Integr. Plant Biol. 2008, 50, 1365–1374. [Google Scholar] [CrossRef] [PubMed]
  59. Mueller, K.E.; LeCain, D.R.; McCormack, M.L.; Pendall, E.; Carlson, M.; Blumenthal, D.M.; Lamb, E. Root responses to elevated CO2, warming and irrigation in a semi-arid grassland: Integrating biomass, length and life span in a 5-year field experiment. J. Ecol. 2018, 106, 2176–2189. [Google Scholar] [CrossRef]
  60. Jungk, A. Root hairs and the acquisition of plant nutrients from soil. J. Plant Nutr. Soil. Sci. 2001, 164, 121–129. [Google Scholar] [CrossRef]
  61. McGrath, J.M.; Lobell, D.B. Reduction of transpiration and altered nutrient allocation contribute to nutrient decline of crops grown in elevated CO2 concentrations. Plant Cell Environ. 2013, 36, 697–705. [Google Scholar] [CrossRef] [PubMed]
  62. Yoneyama, T.; Ito, O.; Engelaar, W.M.H.G. Uptake, metabolism and distribution of nitrogen in crop plants traced by enriched and natural 15N: Progress over the last 30 years. Phytochem. Rev. 2003, 2, 121–132. [Google Scholar] [CrossRef]
  63. Bloom, A.J.; Burger, M.; Rubio Asensio, J.S.; Cousins, A.B. Carbon dioxide enrichment inhibits nitrate assimilation in wheat and Arabidopsis. Science 2010, 328, 899–903. [Google Scholar] [CrossRef]
  64. Ullah, S.; Zhao, Q.; Wu, K.; Ali, I.; Liang, H.; Iqbal, A.; Wei, S.; Cheng, F.; Ahmad, S.; Jiang, L.; et al. Biochar application to rice with 15N-labelled fertilizers, enhanced leaf nitrogen concentration and assimilation by improving morpho-physiological traits and soil quality. Saudi J. Biol. Sci. 2021, 28, 3399–3413. [Google Scholar] [CrossRef]
  65. Zhou, W.; Hu, C.-S.; Li, J.; Christie, P.; He, X.-H.; Ju, X.-T. Natural 15N Abundance in Winter Wheat Amended with Urea and Compost: A Long-Term Experiment. Pedosphere 2013, 23, 835–843. [Google Scholar] [CrossRef]
  66. Fratte, M.D.; Pierce, S.; Zanzottera, M.; Cerabolini, B.E.L. The association of leaf sulfur content with the leaf economics spectrum and plant adaptive strategies. Funct. Plant Biol. 2021, 48, 924–935. [Google Scholar] [CrossRef] [PubMed]
  67. Gusewell, S.; Koerselman, W. Variation in nitrogen and phosphorus concentrations of wetland plants. Perspect. Plant Ecol. Evol. Syst. 2002, 5, 37–61. [Google Scholar] [CrossRef]
  68. Craine, J.M.; Morrow, C.; Stock, W.D. Nutrient concentration ratios and co-limitation in South African grasslands. New Phytol. 2008, 179, 829–836. [Google Scholar] [CrossRef] [PubMed]
  69. Olde Venterink, H.; Wassen, M.J.; Verkroost, A.W.M.; De Ruiter, P.C. Species Richness–Productivity Patterns Differ between N-, P-, and K-Limited Wetlands. Ecology 2003, 84, 2191–2199. [Google Scholar] [CrossRef]
  70. Liu, C.; Rubæk, G.H.; Liu, F.; Andersen, M.N. Effect of partial root zone drying and deficit irrigation on nitrogen and phosphorus uptake in potato. Agric. Water Manag. 2015, 159, 66–76. [Google Scholar] [CrossRef]
  71. Oliveira, E.M.M.; Ruiz, H.A.; Alvarez V., V.H.; Ferreira, P.A.; Costa, F.O.; Almeida, I.C.C. Nutrient supply by mass flow and diffusion to maize plants in response to soil aggregate size and water potential. Rev. Bras. Ciência Solo 2010, 34, 317–328. [Google Scholar] [CrossRef]
Figure 1. The average daily climate data inside the climate-controlled growth chambers during the treatment period.
Agronomy 13 03069 g001
Figure 2. The profile of tomato growth pot. Roots were grown in the compartments of a and b. The compartments of c and d were rhizosphere soil.
Agronomy 13 03069 g002
Figure 3. Leaf C/N ratio (C/N, (a)), leaf C/P ratio (C/P, (b)), leaf C/K ratio (C/K, (c)), leaf C/Ca ratio (C/Ca, (d)), leaf C/Mg (C/Mg, (e)), as well as leaf C/S ratio (C/S, (f)) of tomato plants grown under three irrigation regimes (IR) (full irrigation, FI; deficit irrigation, DI; and alternative partial root-zone irrigation, PRD) under either ambient (400 ppm, C400) or elevated (800 ppm, C800) atmospheric CO2 concentrations. Bars show the maximum (top edge) and minimum (lower edge) percentiles, whereas boxes represent the 25% and 75% percentiles across tomato plants (n = 4). The median (50%) percentile is represented by the horizontal line within the box. Symbols indicate extreme values. *, ** indicate significant levels at p < 0.05, p < 0.01, respectively; “ns” denotes non-significant differences.
Agronomy 13 03069 g003
Figure 4. Leaf N/P ratio (N/P, (a)) and leaf N/K ratio (N/K, (b)) of tomato plants grown under three irrigation regimes (IR) (full irrigation, FI; deficit irrigation, DI; and alternative partial root-zone irrigation, PRD) under either ambient (400 ppm, C400) or elevated (800 ppm, C800) atmospheric CO2 concentrations. Bars show the maximum (top edge) and minimum (lower edge) percentiles, whereas boxes represent the 25% and 75% percentiles across tomato plants (n = 4). The median (50%) percentile is represented by the horizontal line within the box. Symbols indicate extreme values. Different letters indicate significant difference determined by Duncan’s multiple range test at p < 0.05. *, ** indicate significant levels at p < 0.05, p < 0.01, respectively; “ns” denotes non-significant differences.
Agronomy 13 03069 g004
Figure 5. Heat map of Pearson correlation coefficient between root morphological traits and plant dry mass and WUE, leaf element concentration, leaf element uptake and leaf nutrition stoichiometry of tomato plants. The color gradient is proportional to the Pearson’s correlation coefficient. Red and blue colors denote positive and negative relationships, respectively. * indicates significance at p < 0.05.
Agronomy 13 03069 g005
Figure 6. PCA plots for different parameters of tomato plants grown under three irrigation regimes (IR) (full irrigation, FI; deficit irrigation, DI; and alternative partial root-zone irrigation, PRD) under either ambient (400 ppm, C400) or elevated (800 ppm, C800) atmospheric CO2 concentrations. Brown vectors are related to plant root traits (RV, RL, RS, RDW, RD, RTD, SRL, root to shoot), red vectors are related to dry mass and WUE (mass, LDM, SDW, WU and WUE), pink vectors are related to leaf nutrition stoiochiometry (leaf C/N, leaf C/P, leaf C/K, leaf C/Ca, leaf C/Mg, leaf C/S, leaf N/P, leaf N/K), green vectors are related to leaf nutrition uptake (C, N, P, K, Ca, Mg, S, 15N), and blue vectors are related to leaf nutrition concentration (leaf [C], leaf [N], leaf [P], leaf [K], leaf [Ca], leaf [Mg], leaf [S], leaf [15N]).
Agronomy 13 03069 g006
Table 1. The main effects of treatments and the output of two-way ANOVA for dry biomass accumulation, dry biomass allocation, shoot dry mass, water use and water-use efficiency.
CO2Irrigation Regimes∆DM
(g Plant−1)
Biomass Allocation (%)SDW
(g Plant−1)
LDW
(g Plant−1)
WU
(L Plant−1)
WUE
(g L−1)
LeafStemRoot
C400FI25.9 ± 1.673.0 ± 1.521.6 ± 1.45.4 ± 0.226.6 ± 1.520.5 ± 1.07.0 ± 0.33.7 ± 0.3
DI25.7 ± 0.568.5 ± 1.224.9 ± 1.26.7 ± 0.226.2 ± 1.819.2 ± 1.24.9 ± 05.2 ± 0.1
PRI25.8 ± 2.067.6 ± 1.225.6 ± 1.26.8 ± 0.126.1 ± 0.518.9 ± 0.34.9 ± 05.3 ± 0.4
C800FI53.8 ± 2.174.3 ± 1.319.2 ± 1.46.5 ± 0.252.6 ± 2.141.8 ± 1.99.7 ± 0.75.6 ± 0.3
DI50.3 ± 1.670.7 ± 1.121.5 ± 1.07.9 ± 0.450.2 ± 2.438.4 ± 1.36.8 ± 07.4 ± 0.2
PRI52.1 ± 2.772.0 ± 0.721.8 ± 0.37.3 ± 0.448.8 ± 1.337.8 ± 0.86.8 ± 07.6 ± 0.4
Output of two-way ANOVA
[CO2] (C)********************
Irrigation regimes (IR)ns******ns********
C × IRnsnsnsnsnsnsnsns
The table shows the significance results of two-way analysis of variance (ANOVA) of dry mass accumulation (ΔDM), the allocation of ΔDM to leaf (LMR), stem (SMR) and root (RMR), shoot dry weight (SDW), leaf dry weight (LDW), water use (WU) and water use efficiency (WUE) of tomato plants as affected by the CO2 concentration (400 ppm and 800 ppm) and irrigation regimes (IR) (FI, full irrigation; DI, deficit irrigation; and PRI, alternative partial root drying irrigation), as well as their interactions. Values are means ± standard error of the means (SE) (n = 4). Different letters after the means indicate significant differences among treatments determined by Duncan’ s multiple range test at p < 0.05. *, **, *** indicates significance level at p < 0.05, p < 0.01, and p < 0.001, respectively, while “ns” is non-significant.
Table 2. The effects of treatments and output of two-way ANOVA for root traits of tomato plants.
CO2Irrigation Regimes RL
(m)
RS
(cm2)
RD
(mm)
RV
(cm3)
SRL
(m g−1)
RTD
(g cm−3)
R/SRDW
(g Plant−1)
C400FI12.9 ± 1.1280.5 ± 28.60.54 ± 0.024.5 ± 0.69.9 ± 0.8c0.3 ± 0.020.06 ± 0.0031.5 ± 0.1
DI60.8 ± 4.6718.0 ± 55.80.38 ± 0.017.1 ± 0.535.9 ± 2.7a0.2 ± 0.020.07 ± 0.0031.9 ± 0.2
PRI43.1 ± 6.4609.8 ± 62.70.45 ± 0.037.4 ± 0.625.8 ± 2.9ab0.2 ± 0.010.07 ± 0.0031.9 ± 0.0
C800FI75.0 ± 19.71045.5 ± 132.70.47 ± 0.0412.4 ± 0.621.9 ± 5.9b0.3 ± 0.010.07 ± 0.0033.6 ± 0.1
DI99.5 ± 24.51324.4 ± 240.70.47 ± 0.0515.2 ± 1.626.3 ± 4.5ab0.2 ± 0.010.08 ± 0.0054.3 ± 0.4
PRI123.0 ± 14.31569.4 ± 123.70.43 ± 0.0317.0 ± 1.130.8 ± 4.6ab0.2 ± 0.010.09 ± 0.0053.8 ± 0.3
Output of two-way ANOVA
CO2 (C)******ns***nsns*****
Irrigation regimes (IR)***ns********ns
C × IRnsnsnsns*nsnsns
The table reports the significance results of two-way analysis of variance (ANOVA) of root length (RL), root surface area (RS), root average diameter (RD), root volume (RV), specific root length (SRL), root tissue density (RTD), root dry weight (RDW) and root to shoot ratio (R/S) of tomato plants as affected by the CO2 concentration (400ppm and 800ppm) and irrigation regimes (FI, full irrigation; DI, deficit irrigation; and PRI, alternative partial root drying irrigation), as well as their interactions. Values are means ± standard error of the means (SE) (n = 4). Different letters after the means indicate significant differences among treatments determined by Duncan’s multiple range test at p < 0.05. *, ** and *** indicate significance at p < 0.05, p < 0.01, and p < 0.001, respectively, while “ns” is non-significant.
Table 3. The effects of treatments and output of two-way ANOVA for leaf element concentrations.
CO2Irrigation Regimes [C]
(mg g−1)
[N]
(mg g−1)
[P]
(mg g−1)
[K]
(mg g−1)
[Ca]
(mg g−1)
[Mg]
(mg g−1)
[S]
(mg g−1)
[15N]
(mg g−1)
C400FI412.2 ± 4.150.9 ± 0.94.2 ± 0.0925.0 ± 1.951.2 ± 1.14.1 ± 0.27.2 ± 0.51.5 ± 0.1
DI421.4 ± 2.954.8 ± 1.13.8 ± 0.124.6 ± 2.049.5 ± 1.53.9 ± 0.25.7 ± 0.32.2 ± 0.3
PRI420.4 ± 1.154.0 ± 1.83.8 ± 0.0522.5 ± 1.447.1 ± 1.73.6 ± 0.15.9 ± 0.41.4 ± 0.2
C800FI417.6 ± 1.445.4 ± 2.24.2 ± 0.1625.0 ± 0.755.2 ± 1.73.7 ± 0.27.8 ± 0.11.1 ± 0.1
DI418.4 ± 3.143.7 ± 1.63.7 ± 0.2724.5 ± 1.854.2 ± 1.93.7 ± 0.17.6 ± 0.41.6 ± 0.1
PRI423.9 ± 1.749.6 ± 3.33.0 ± 0.3922.7 ± 1.250.5 ± 1.63.4 ± 0.17.2 ± 0.71.5 ± 0.1
Output of two-way ANOVA
CO2 (C)ns***nsns*****0.052
Irrigation regimes (IR)*ns**ns**ns**
C × IRnsnsnsnsnsnsnsns
The table shows the significance results of two-way analysis of variance (ANOVA) of leaf C concentration ([C]), leaf N concenrationt ([N]), leaf P concentration ([P]), leaf K concentration ([K]), leaf Ca concentration ([Ca]), leaf Mg concentration ([Mg]), leaf S concentration ([S]) and leaf [15N] of tomato plants as affected by the CO2 concentration (400 ppm and 800 ppm) and irrigation regimes (FI, full irrigation; DI, deficit irrigation; and PRI, alternative partial root drying irrigation) and their interactions. Values are means ± standard error of the means (SE) (n = 4). Different letters after the means indicate significant differences among treatments determined by Duncan’s multiple range test at p < 0.05. *, ** and *** indicate significance at p < 0.05, p < 0.01, and p < 0.001, respectively, while “ns” is non-significant.
Table 4. The effects of treatments and output of two-way ANOVA for leaf element uptakes.
CO2Irrigation Regimes C
(g Plant−1)
N
(g Plant−1)
P
(mg Plant−1)
K
(mg Plant−1)
Ca
(g Plant−1)
Mg
(mg Plant−1)
S
(mg Plant−1)
15N
(mg Plant−1)
C400FI8.5 ± 0.51.0 ± 0.0586.4 ± 5.1d506.8 ± 17.21.1 ± 0.182.5 ± 3.1147.7 ± 13.231.0 ± 2.2
DI8 ± 0.11.0 ± 0.0271.2 ± 1.5d463.6 ± 31.80.9 ± 0.074.3 ± 2.4107.5 ± 6.641.0 ± 5.2
PRI8.1 ± 0.51.0 ± 0.0673.2 ± 3.9d431.9 ± 41.50.9 ± 0.168.7 ± 5.5112.4 ± 8.226.9 ± 4.7
C800FI17.5 ± 0.81.9 ± 0.05175.8 ± 11.2a1041.3 ± 43.52.3 ± 0.1155.2 ± 7.9328.0 ±17.645.7 ± 5.8
DI15.8 ± 0.41.7 ± 0.04141.4 ± 13.3b929.5 ± 89.32.0 ± 0.0138.7 ± 6.3287.9 ± 21.961.7 ± 3.5
PRI16.3 ± 0.61.9 ± 0.11113.3 ± 11.1c867.4 ± 18.51.9 ± 0.1129.5 ± 5.8273.9 ± 21.158.2 ± 4.2
Output of two-way ANOVA
CO2 (C)************************
Irrigation regimes (IR)nsns*********
C × IRnsns*nsnsnsnsns
The table reports the significance results of three-way analysis of variance (ANOVA) of leaf C accumulation, and N, P, K, Ca, Mg and S uptakes of tomato plants as affected by the CO2 concentration (400 ppm and 800 ppm) and irrigation regimes (FI, full irrigation; DI, deficit irrigation; and PRI, alternative partial root drying irrigation), as well as their interactions. Values are means ± standard error of the means (SE) (n = 4). Different letters after the means indicate significant differences among treatments determined by Duncan’s multiple range test at p < 0.05. *, ** and *** indicate significance at p < 0.05, p < 0.01, and p < 0.001 respectively, while “ns” is non-significant.
Disclaimer/Publisher’s Note: The statements, opinions and data contained in all publications are solely those of the individual author(s) and contributor(s) and not of MDPI and/or the editor(s). MDPI and/or the editor(s) disclaim responsibility for any injury to people or property resulting from any ideas, methods, instructions or products referred to in the content.

