Article

Modeling Callus Induction and Regeneration in Hypocotyl Explant of Fodder Pea (Pisum sativum var. arvense L.) Using Machine Learning Algorithm Method

1
Department of Field Crops, Faculty of Agriculture, Necmettin Erbakan University, Konya 42310, Türkiye
2
Department of Genetics and Bioengineering, Faculty of Engineering, Yeditepe University, Istanbul 34755, Türkiye
3
Department of Field Crops, Faculty of Agriculture, Ataturk University, Erzurum 25240, Türkiye
4
Department of Agricultural Biotechnology, Faculty of Agriculture, Igdır University, Igdir 76000, Türkiye
5
Department of Botany and Nature Protection, Institute of Biology, Pomeranian University in Słupsk, 22b Arciszewskiego St., 76-200 Słupsk, Poland
6
Department of Biosystems Engineering, Faculty of Environmental and Mechanical Engineering, Poznań University of Life Sciences, Wojska Polskiego 50, 60-627 Poznań, Poland
*
Authors to whom correspondence should be addressed.
Agronomy 2023, 13(11), 2835; https://doi.org/10.3390/agronomy13112835
Submission received: 9 October 2023 / Revised: 24 October 2023 / Accepted: 15 November 2023 / Published: 17 November 2023
(This article belongs to the Section Precision and Digital Agriculture)

Abstract

:
A comprehensive understanding of genetic diversity and the categorization of germplasm is important to effectively identify appropriate parental candidates for the goal of breeding. It is necessary to have a technique of tissue culture that is both effective and reproducible to perform genetic engineering on fodder pea genotypes (Pisum sativum var. arvense L.). In this investigation, the genetic diversity of forty-two fodder pea genotypes was assessed based on their ability of callus induction (CI), the percentage of embryogenic callus by explant number (ECNEP), the percentage of responding embryogenic calluses by explant number (RECNEP), the number of somatic embryogenesis (NSE), the number of responding somatic embryogenesis (RSE), the regeneration efficiency (RE), and the number of regenerated plantlets (NRP). The findings of the ANOVA showed that there were significant differences (p < 0.001) between the genotypes for all in vitro parameters. The method of principal component analysis (PCA) was used to study the correlations that exist between the factors associated with tissue culture. While RE and NRP variables were most strongly associated with Doğruyol, Ovaçevirme-4, Doşeli-1, Yolgeçmez, and Incili-3 genotypes, RECNEP, NSE, RDE, and RECNEP variables were strongly associated with Avcılar, Ovaçevirme-3, and Ardahan Merkez-2 genotypes. The in vitro process is a complex multivariate process and more robust analyses are needed for linear and nonlinear parameters. Within the scope of this study, artificial neural network (ANN), random forest (RF), and multivariate adaptive regression spline (MARS) algorithms were used for RE estimation, and these algorithms were also compared. The results that we acquired from our research led us to the conclusion that the employed ANN-multilayer perceptron (ANN-MLP) model (R2 = 0.941) performs better than the RF model (R2 = 0.754) and the MARS model (R2 = 0.214). Despite this, it has been shown that the RF model is capable of accurately predicting RE in the early stages of the in vitro process. The current work is an inquiry regarding the use of RF, MARS, and ANN models in plant tissue culture, and it indicates the possibilities of application in a variety of economically important fodder peas.

1. Introduction

Legumes play a crucial role in global agriculture, exerting significant influence on the agricultural, livestock, and human nutritional landscapes. The application of in vitro selection and the retrieval of valuable genetic diversity can be achieved through plant cell and tissue culture, representing a pivotal method for enhancing plant improvement [1,2]. The genetic diversity inherent in plants is a key factor influencing their potential for enhanced productivity and, consequently, their suitability for inclusion in breeding programs aimed at bolstering food production. Currently, one of the most promising areas of investigation within the realm of cell culture is the generation of stable and heritable variations through the application of somacloning. Factors such as the genotype under consideration, the nature of the explant, the composition of the culture medium, and the cultural conditions employed all contribute to influencing the frequency of these variations.
The cultivation of plant cells, tissues, and organs in plant cell and tissue culture is enabled through the utilization of nutrient-rich culture media, coupled with the maintenance of carefully controlled aseptic conditions [3]. In vitro culture methods have become indispensable in various facets of plant science, encompassing the production of pathogen-free plants, the efficient propagation of limited plant genotypes, the genetic modification of plant genomes, and the synthesis of commercially valuable compounds derived from plants [4]. The intrinsic totipotency of plant cells enables the rapid proliferation of genetically identical clones, thereby preserving the fidelity of the genetic information inherited from the original cells [5]. Therefore, it is feasible to stimulate callus formation from cotyledon and hypocotyl explants, subsequently establishing a dependable and efficient technique for in vitro regeneration through callus-mediated organogenesis [6,7].
Tissue culture offers a substantial reduction in the time required for conventional breeding programs by expediting the production of plant material with well-defined traits. Additionally, it facilitates the clonal propagation of plants, ensuring the faithful inheritance of desirable traits in the offspring. This method enables the rapid propagation of elite genotypes possessing sought-after traits. Moreover, tissue culture serves as a pivotal tool for plant transformation and genetic modification, allowing the targeted insertion of specific genes or traits into plant genomes. In some studies, the use of tissue culture for the production of plant materials has been discussed [8,9], where pathogenicity is reduced in various crops, which is very important for successful breeding programs; also, it can be used to subject plant material to controlled stress conditions and helps breeders to identify genotypes with superior stress tolerance [10,11]. Plant cells that have undergone differentiation possess the ability to re-enter the cell cycle, undergo proliferation, regenerate tissues, and organs, and ultimately mature into a fully functional plant organism. Numerous studies have demonstrated the remarkable totipotent capacity of plant cells, showcasing their ability to regenerate entire plants. [12].
In the process of in vitro plant regeneration, explants undergo cell division and differentiation, ultimately developing into organs and tissues over the course of their maturation period [13]. Organogenesis or somatic embryogenesis can serve as methods for in vitro plant regeneration [14]. Organogenesis is the process by which new organs, and in certain cases, entire plants, develop in response to injuries inflicted on previous organs. Somatic embryogenesis, on the other hand, entails the formation of a structural cell initially resembling zygotic embryos, ultimately leading to the regeneration of the entire plant [15].
In conclusion, the observed variation in tissue culture responses has emerged as a valuable determinant in numerous studies and applications related to breeding. Among its manifold advantages, tissue culture facilitates the swift multiplication of elite genotypes, eradication of diseases, introduction of novel traits, and screening for stress tolerance. While not always the exclusive determinant, tissue culture can play a pivotal role in contemporary breeding programs, particularly when integrated with other genetic and phenotypic data.
The assessment and classification of genetic diversity, analysis of yield components, evaluation of yield stability, enhancement of stress tolerance, and the implementation of hybrid breeding programs are illustrative examples of conventional plant breeding techniques. In contrast, in vitro-based biotechnological breeding approaches encompass methods such as Agrobacterium-mediated gene transformation, induction of artificial polyploidy, production of doubled haploids, and in vitro micropropagation [16]. In plant tissue culture research, the impact of input elements (uni or multi) on the potential for regeneration (outputs) of desired plants is systematically examined. Traditionally, the output variables are analyzed and interpreted using conventional statistical methods. In establishing the relationship between input (independent) and output (dependent) variables, these methods often employ variance analysis and linear regression models. However, the effectiveness of these widely successful methods poses notable challenges in plant tissue culture investigations, particularly in dealing with the intricacies of complex and nonlinear inputs, as well as high probability scenarios [17,18]. Indeed, the in vitro process is a nonlinear and intricate biological phenomenon. Traditional statistical methods, such as simple regression, are not well-suited for capturing the complexities inherent in this process. There is a notable potential for novel nonlinear computational methods to optimize the in vitro process, potentially streamlining the required treatments [19].
Indeed, it has been demonstrated that machine learning (ML) algorithms have the capability to accurately predict and enhance the performance of diverse and complex biological systems [20]. Artificial neural networks (ANNs) are computerized mathematical models inspired by biological nervous systems. These models are used to perform complex data processing and pattern recognition tasks [18,21,22]. Recent research indicates that both artificial neural networks (ANNs) and machine learning (ML) are valuable and reliable tools for researching and predicting various stages of the plant tissue culture process. These stages encompass in vitro sterilization, callogenesis, shoot proliferation, and the in vitro generation of secondary metabolites [17,18,19,23,24].
Therefore, the application of artificial neural networks (ANN) and machine learning (ML) techniques can be considered a precise and dependable approach for investigating, predicting, and enhancing in vitro regeneration efficiency. Moreover, the evaluation and quantification of morphological attributes of plantlets cultivated in vitro represent laborious and time-intensive procedures in the context of in vitro research. Thus, there is a need for the refinement of protocols, a process that may be both time-consuming and costly [25]. In addressing these challenges, novel methodologies employing machine vision techniques demonstrate the capability to optimize the workflow [26].
The incorporation of recent findings into the intricate network of in vitro plant tissue culture techniques is imperative for advancing research across a diverse spectrum of plant species. Grasping the multifaceted implications of the plant tissue culture paradigm poses a challenging undertaking. Within this context, making well-informed decisions based on scientific facts presents a formidable challenge. However, this obstacle can be overcome through the strategic application of various models and algorithms, ultimately enhancing the precision and accuracy of predictive assessments. In the specific context of forage peas, the utilization of mathematical frameworks and AI-based models in in vitro settings remains remarkably limited. This limitation is attributed to the primary focus on comprehending the intricate dynamics of callus formation and regeneration efficiency factors. The objective of this research was threefold: (i) to classify 42 fodder pea genotypes based on their embryogenesis capacity, (ii) to establish a predictive model for regeneration efficiency (RE) from hypocotyl explants of fodder pea using artificial neural network (ANN) and machine learning (ML) algorithms, and (iii) to assess and compare the efficacy of these models in estimation. These steps were undertaken as a preparatory phase for subsequent investigations in breeding programs, focusing on the genetic factors and in vitro parameters influencing regeneration efficiency.

2. Materials and Methods

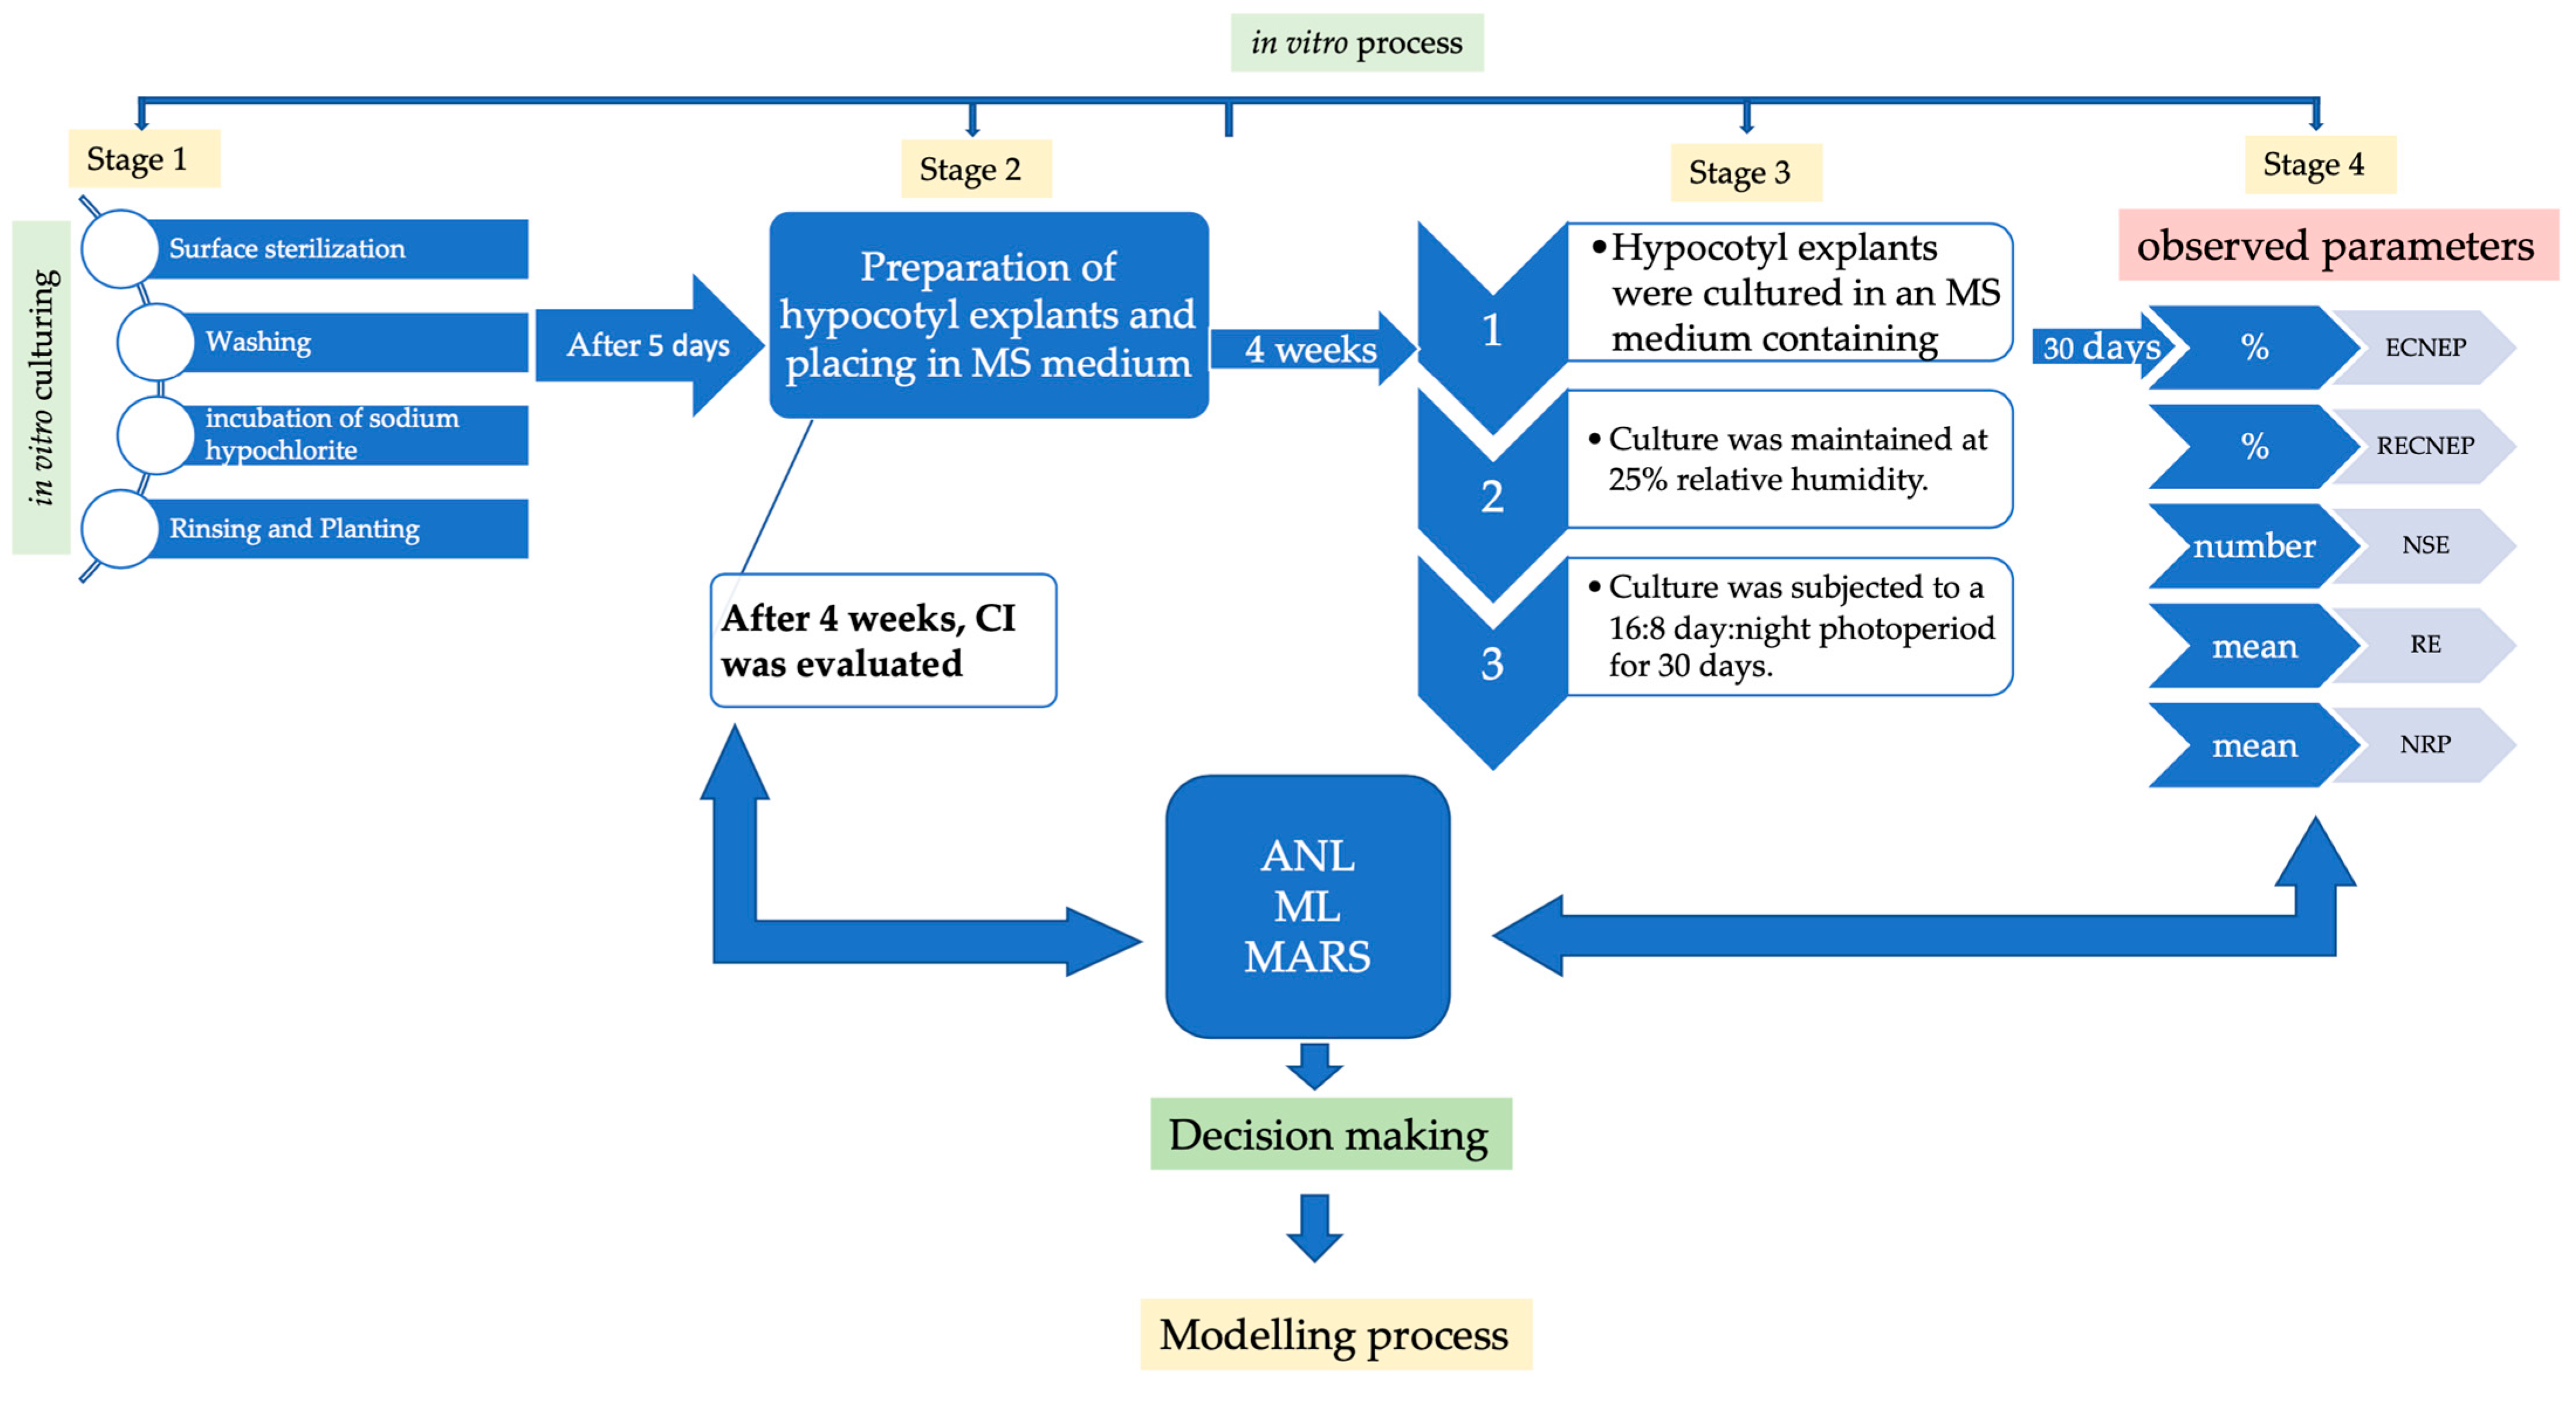
2.1. Plant Material, Callus Initiation, Formation of Embryogenic Calluses, and Plant Regeneration and Rooting Condition

Plant material was sourced from 42 distinct genotypes of fodder pea (Pisum sativum var. arvense L.), each originating from a unique location in the Eastern Anatolia Region. The plant materials utilized in this study were derived from forage pea landraces. Forage pea landraces were collected from cultivated fields in the Turkish provinces of Erzurum, Bayburt, Ardahan, Kars, and Giresun in the northeastern Anatolia region [27]. The seeds were initially subjected to surface sterilization using 70% (v/v) ethanol for a duration of five minutes, followed by two consecutive washes with sterile distilled water. Subsequently, the seeds were immersed in a solution of commercial bleach (5% sodium hypochlorite) with the addition of two drops of Tween for a period of thirty-five minutes. Afterward, the seeds underwent two rinses with sterile distilled water. For germination, the sterilized seeds were planted in an MS (Murashige and Skoog) medium devoid of any hormones. Hypocotyl explants obtained from 5-day-old in vitro-grown seedlings were cultured for a duration of 4 weeks on Murashige and Skoog (MS) medium [28] supplemented with 20 mg/L sucrose, 2 g/L phytagel, 1.95 g/L MES, and 0.5 mg/L picloram. The objective of this cultivation was to induce callus formation [29]. The pH of the medium was adjusted to 5.8 by adding 1 N sodium hydroxide. To sterility, solutions containing basal salts and a solidifying agent were autoclaved for 15 min at 121 °C. Filtration and sterilization methods were applied to vitamins and plant growth regulators in the medium. The optimal temperature for transplant culture was maintained at 25 °C. Following a four-week period, the assessment of callus induction was conducted. Hypocotyl explants were cultivated in an MS medium containing 0.05 mg/L NAA, 0.017 mg/L each of BA, kinetin, and TDZ [30]; along with 2 mg/L phytagel and 20 g/L sucrose. The cultivation conditions included a 25% relative humidity and a 16:8 day/night photoperiod, and the duration of cultivation was four weeks.
This allowed the embryogenic callus to develop and mature. After 4 weeks, callus induction (CI) (%), mean embryogenic callus by the number of explants by percentage (ECNEP) (%), mean responded embryogenic callus by the number of explants by percentage (RECNEP) (%), mean number of somatic embryos (NSE) (number), mean regeneration efficiency (RE), and mean regenerated plant number (NRP) was calculated. Plantlets were then moved to a rooted medium that included MS medium with 0.2 mg/L NAA, 2 mg/L phytagel, and 20 g/L sucrose. This medium was maintained at a temperature of 25 °C with a photoperiod of 16:8 day/night for 4 weeks.

2.2. Statistical Analysis

This research was conducted using a completely randomized factorial design with four replicates and 15 explants in each replicate. Each Petri dish was considered as the experimental unit and 15 hypocotyl explants were cultured in each Petri dish. The approach known as the general linear model (GLM) was used to carry out an analysis of variance (ANOVA), and SPSS version 20 was used to do so (SPSS, Chicago, IL, USA). Each Petri dish was an independent experimental unit, and 15 hypocotyl explants were grown in each medium. The Fisher’s Duncan test was used to compare the means of the treatments. The statistical software XLSTAT (Addinsoft, version 2023.1.3) was used to carry out cluster analysis based on the ward’s approach using squared Euclidian distance [31], and principal component analysis (PCA) was performed.

2.3. Modeling Using Machine Learning Algorithms

The main data source of this study was in vitro tissue culture data of fodder pea genotypes. These data included five different input variables, callus induction (CI) (%), percentage of embryogenic calluses by explant number (ECNEP) (%), percentage of responding embryogenic calluses by explant number (RECNEP) (%), number of somatic embryogenesis (NSE) (number), and number of responding somatic embryogenesis (RSE), and these were associated with an output (regeneration efficiency (RE)) variable (Figure 1). The aim was to estimate the output variable using these input variables. Three different ML algorithms were used to make predictions on the data set: MLP model based on ANN, random forest (RF) model, and multivariate adaptive regression spline (MARS) model. The ANN-MLP model was used to capture the complexity of the data set and learn the patterns [18,23,32]. The RF algorithm, one of the most widely used algorithms, was chosen to capture and predict patterns in the data set [19,21]. The MARS algorithm was used to capture non-linear relationships and interactions in the data set [33]. Three main criteria were used to evaluate the performance of the algorithms: mean squared error (MSE), R-square (R2), and mean absolute deviation (MAD). R2 refers to the explanatory power of the model (Equation (1)), MSE measures how close the predictions are to the true values (Equation (2)), and MAD refers to the overall distribution of prediction errors (Equation (3)) [34].
R 2 = 1 i = 1 n y i y i p 2 i = 1 n y i y ¯ 2
M S E = 1 n i = 1 n y i y i p 2
M A D = 1 n   i = 1 n y i y i p
where n is the total number of samples used for training and testing, y i is the actual value that was measured, y i p is the value that was predicted, and y ¯ is the mean of the measured values. The ANN-MLP, RF, and MARS methods and performance metrics were both computed with the help of the R program [35,36,37].

3. Results

3.1. In Vitro Parameters

The results of the analysis of variance showed that there were significant differences among the 42 genotypes in terms of callus induction (CI) (%), percentage of embryogenic calluses by explant number (ECNEP) (%), percentage of responding embryogenic calluses by explant number (RECNEP) (%), number of somatic embryogenesis (NSE) (number), number of responding somatic embryogenesis (RSE), regeneration efficiency (RE), and number of regenerated plantlets (NRP) (number) (p < 0.001) (Table 1). The genotypes that were grown in vitro were a significant factor that had an impact on both the effectiveness of the process and the features of the variables that were observed. The first signs of calluses appeared two weeks after the start of culture, and various types of calluses developed in the following weeks. According to the mean CI values among the genotypes, the highest mean CI% value was observed in Ardahan Merkez-2, Aşağıcambaz, Camlıçatak-2, Değirmencik-1, Görele-1, Koyunpınarı, Ovaçevirme-4, Ovaçevirme-5, Paslı, Subatan, Sulakyurt, Tahtakıran, and Yamçılı genotypes (100.00%), and the lowest mean CI% value was observed in Doğruyol genotype (60.94%) (Table 1).
According to the values of ECNEP that were observed, the average of the genotypes was 72.58%, while the ECNEP value of the Yamçılı genotype was the highest with 100% and the ECNEP value of the Cayaz genotype was the lowest with 26.56%. The RECNEP values of the genotypes had a mean value of 65.40%. The Değirmencik-1 genotype had the greatest RECNEP value, which was seen to be 100%, while the Cayağzı genotype had the lowest, which was observed to be 21.88%. The NSE value that was averaged across all the genotypes was 35.63. The Avcılar genotype was seen to have the greatest NSE value (96.75), whilst the Cumhuriyet genotype was observed to have the lowest NSE value (8.25). The genotypes had an average RSE value of 29.01. The Avcılar genotype showed the greatest RSE value, which was found to be 8.25%, while the Cayağzı genotype showed the lowest RSE value, which was found to be 4.00%. The mean RE and NR values of the genotypes were 0.11% and 15.00 (number), respectively. The Doğruyol genotype was found to have the greatest RE value and NRP value, while the Ardahan Merkez-1, Ardahan Merkez-2, Ardahan Merkez-3, Aşağıkırzı, Balçeşme, Camlıçatak-1, Camlıçatak-2, Cayağzı, Cumhuriyet, Değirmencik-1, Incili-1, Incili-2, Koyunpınarı, Oburcak, Ovaçevirme-1, Ovaçevirme-2, Ovaçevirme-3, Ovaçevirme-5, Paslı, Sayvan, Selamverdi, Seyitören, and Tepeköy genotypes all had RE values and NRP values of zero (Table 1).

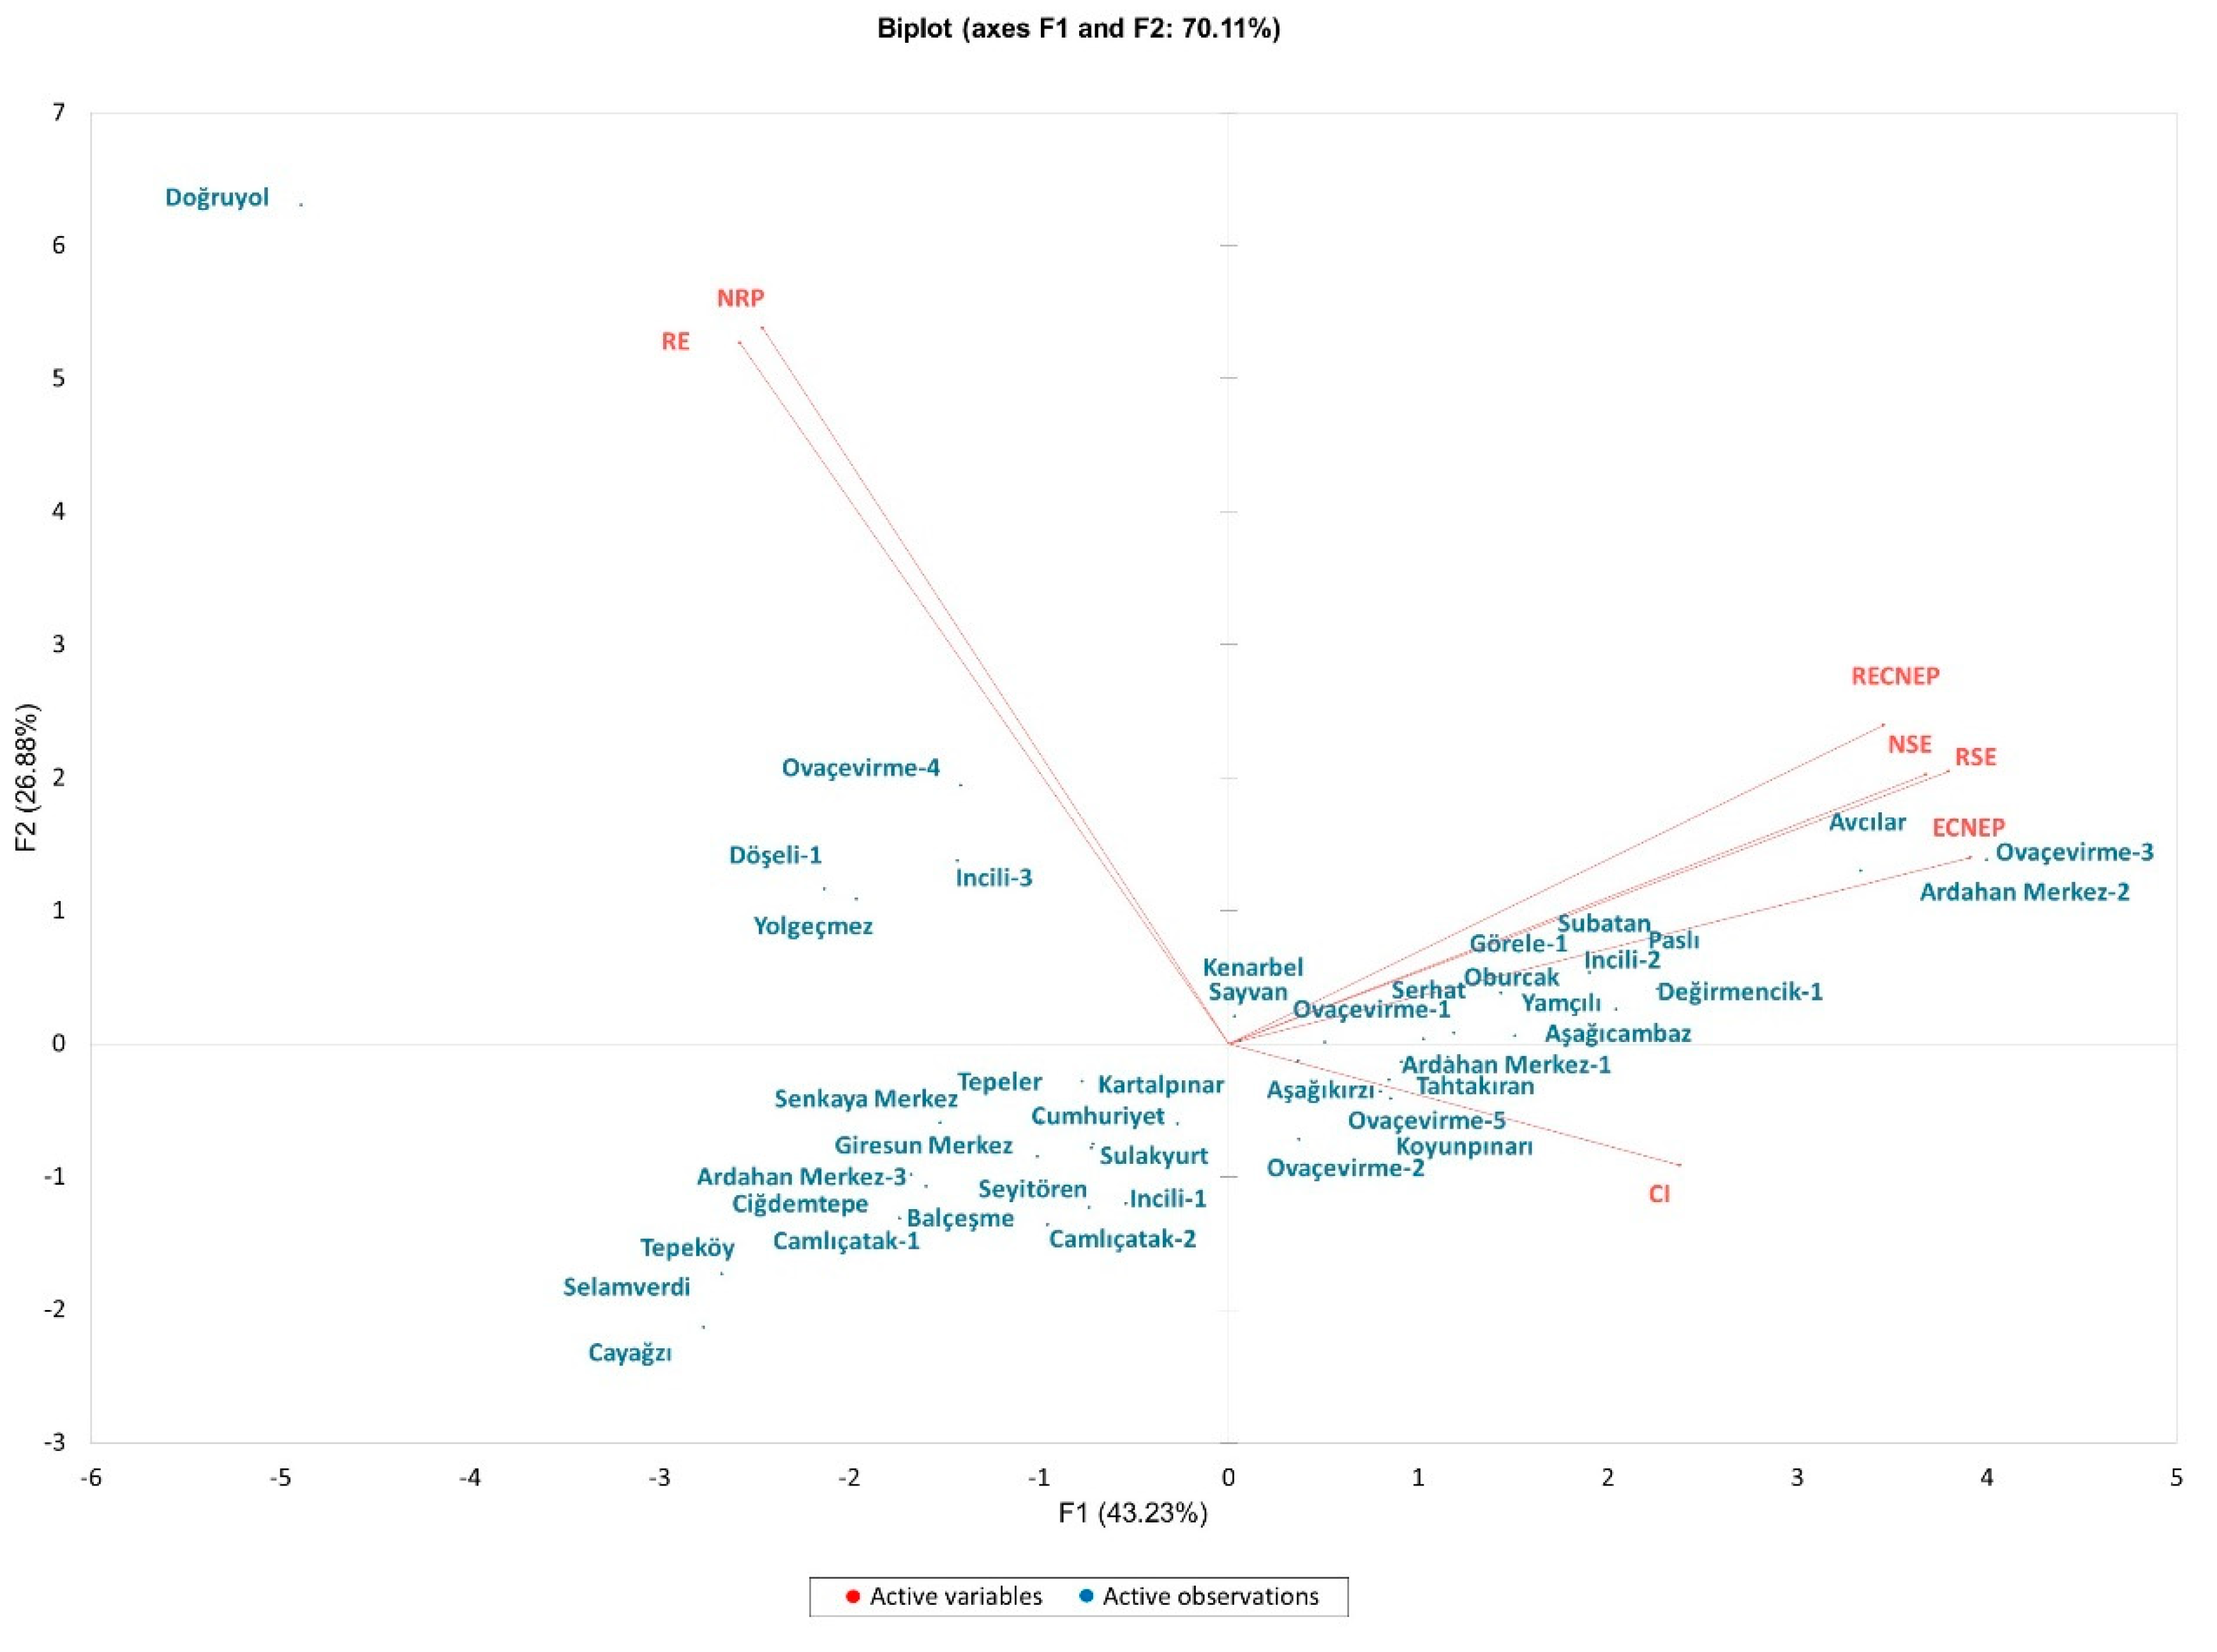
3.2. Principal Component Analysis

Principal Component Analysis (PCA) was conducted to derive a concise set of linear combinations that effectively elucidate most variations in the utilized data. In this investigation, five distinct components were identified, and the analysis revealed that the initial three components possessed Eigen values exceeding one. According to the cumulative values presented in Table 2, these three components, resulting from PCA using similarity values, collectively accounted for 87.30% of the total variation. Specifically, the variable ECNEP (F1) emerged as the most significant contributor, with a value of 0.691, elucidating 43.23% of the overall variance. The second factor (F2) contributed to 70.11% of the overall variance, with the NRP variable exerting the greatest influence, as indicated by its value of 0.697. Factor 3 (F3) contributed to the remaining 17.19% of the overall variance, with the CI variable demonstrating the most substantial impact, reflected in its coefficient value of 0.484 (see Table 2). A visual representation of the obtained PCA analysis is depicted in Figure 2 in the form of a biplot.

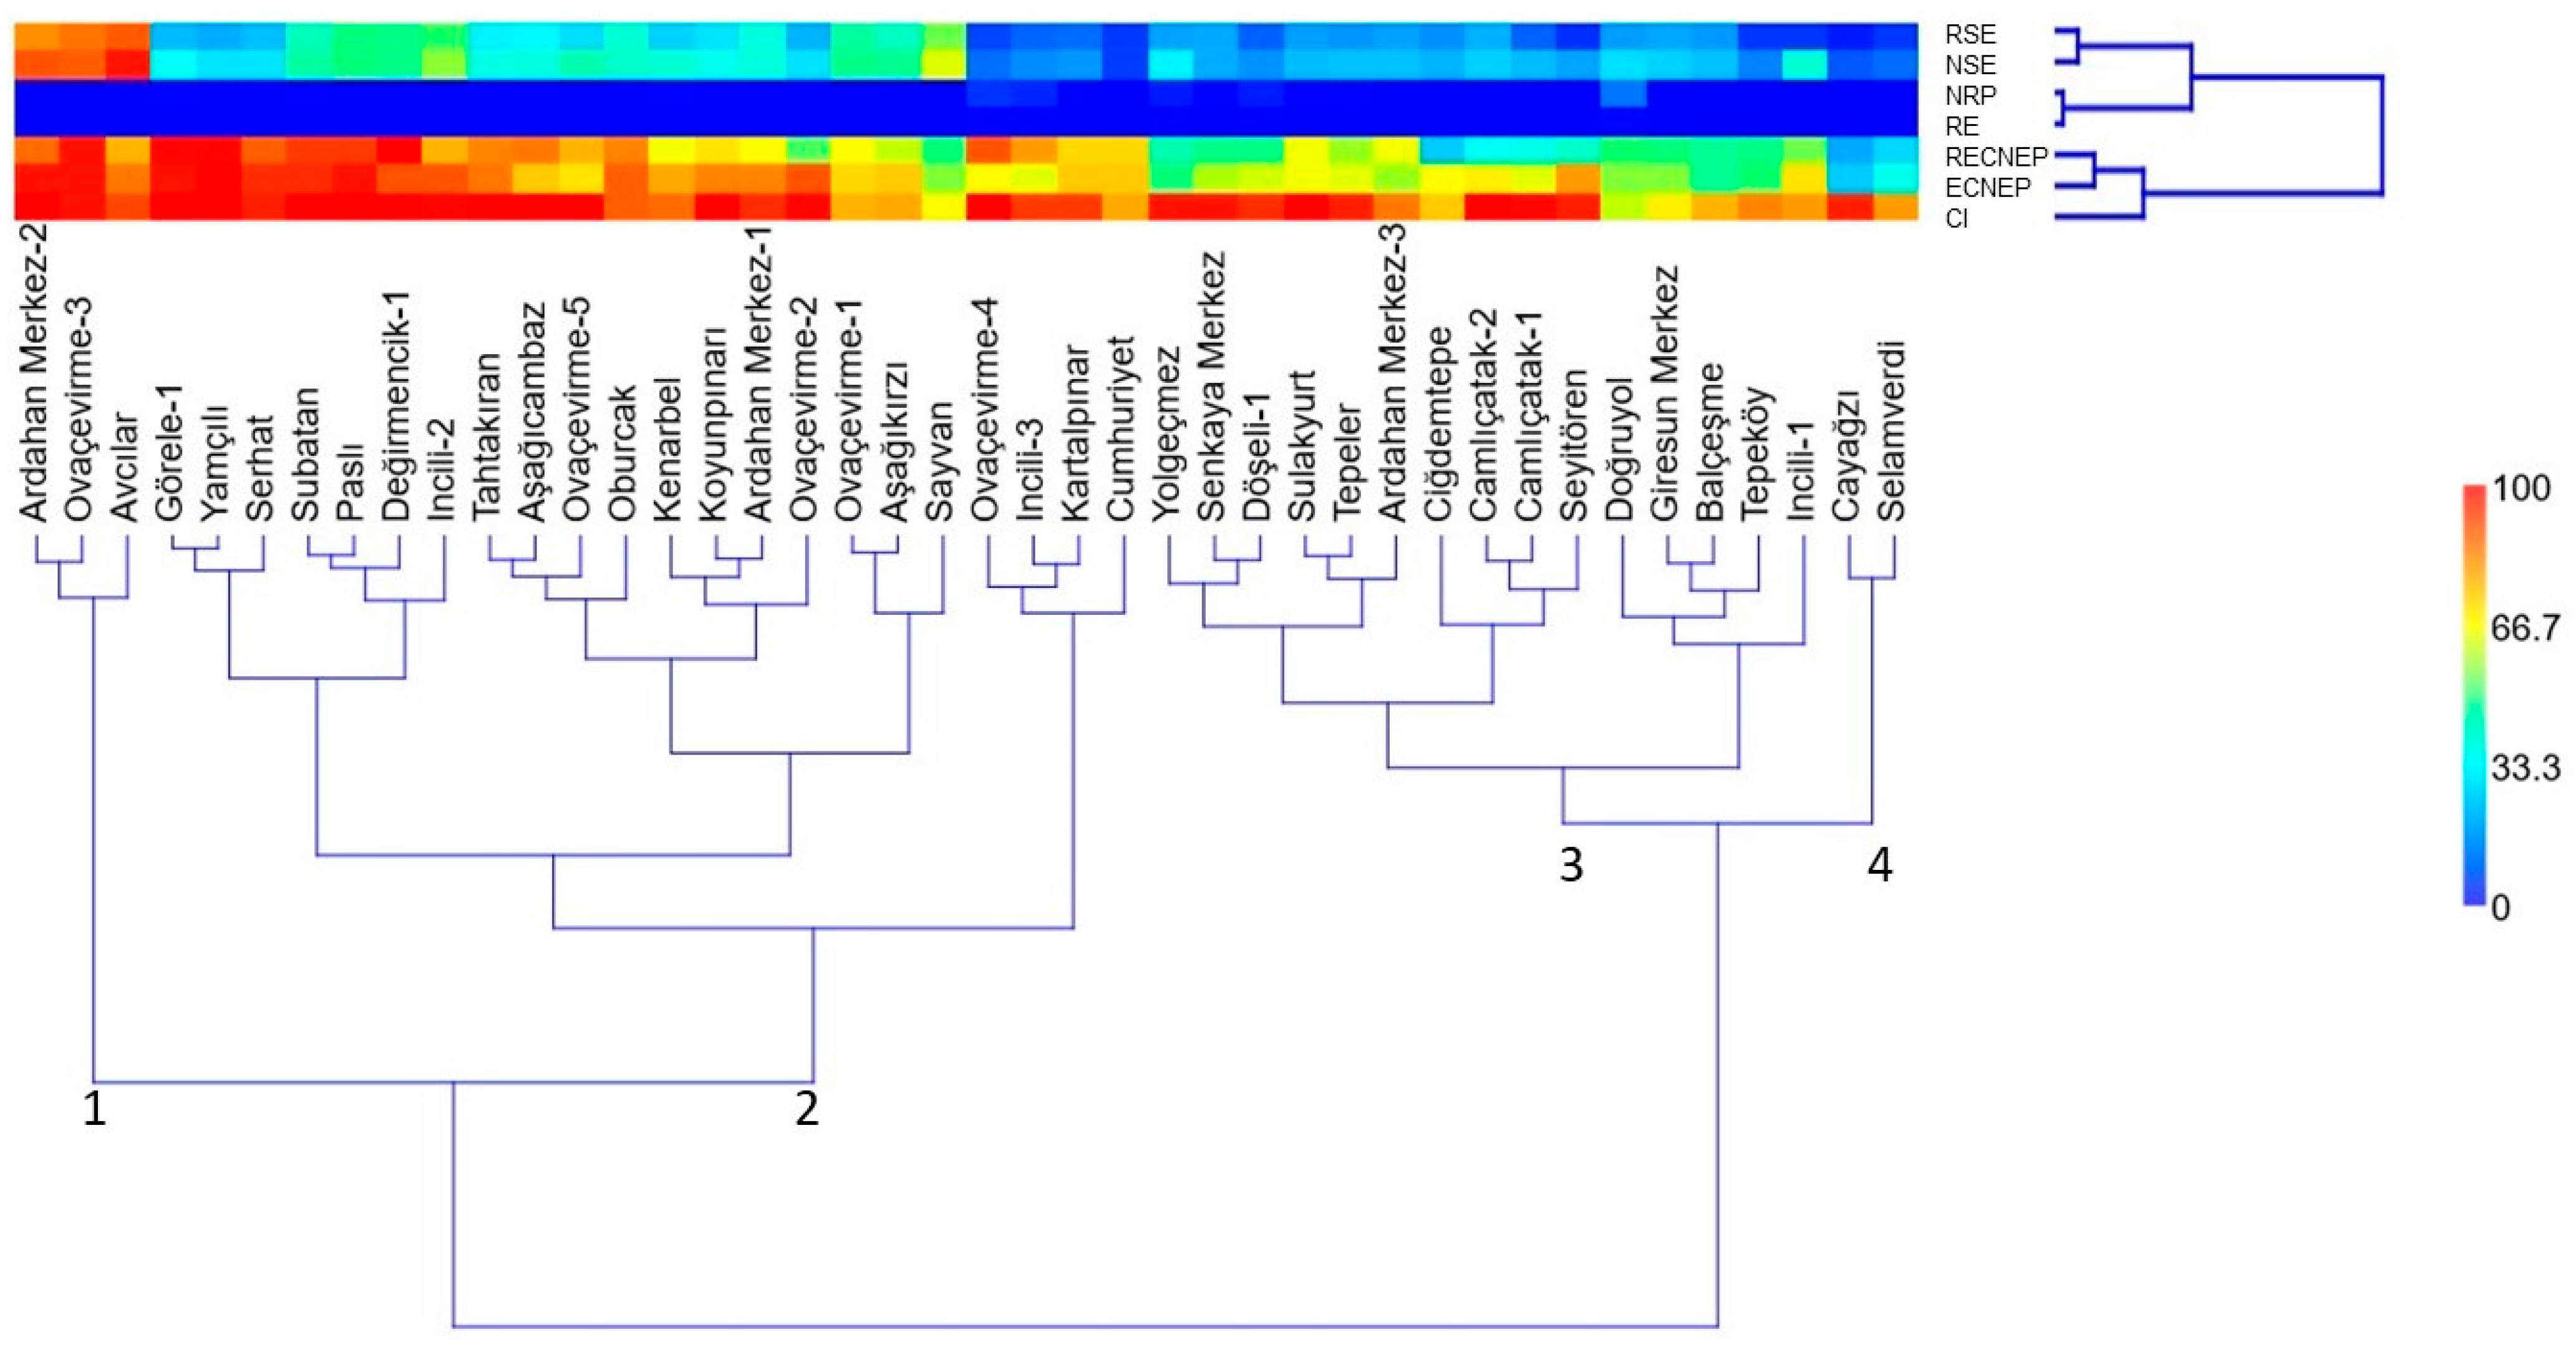
3.3. Cluster Analysis

Genotypes were divided into four groups in the dendrogram (Figure 3). The first group included 7.14% of all genotypes, the second group included 52.38% of all genotypes, the third group included 35.71% of all genotypes, and the fourth group included 4.76% of all genotypes. The genetic difference between the first group and fourth group was the highest. Regarding plant breeding operations, the genetic distance between genotypes is paramount. Because hybrids of genetically different genotypes have a high yield, and because a cross between these genotypes can provide the optimum heterosis for use in breeding programs, hybrids of genetically diverse genotypes are preferred [38].

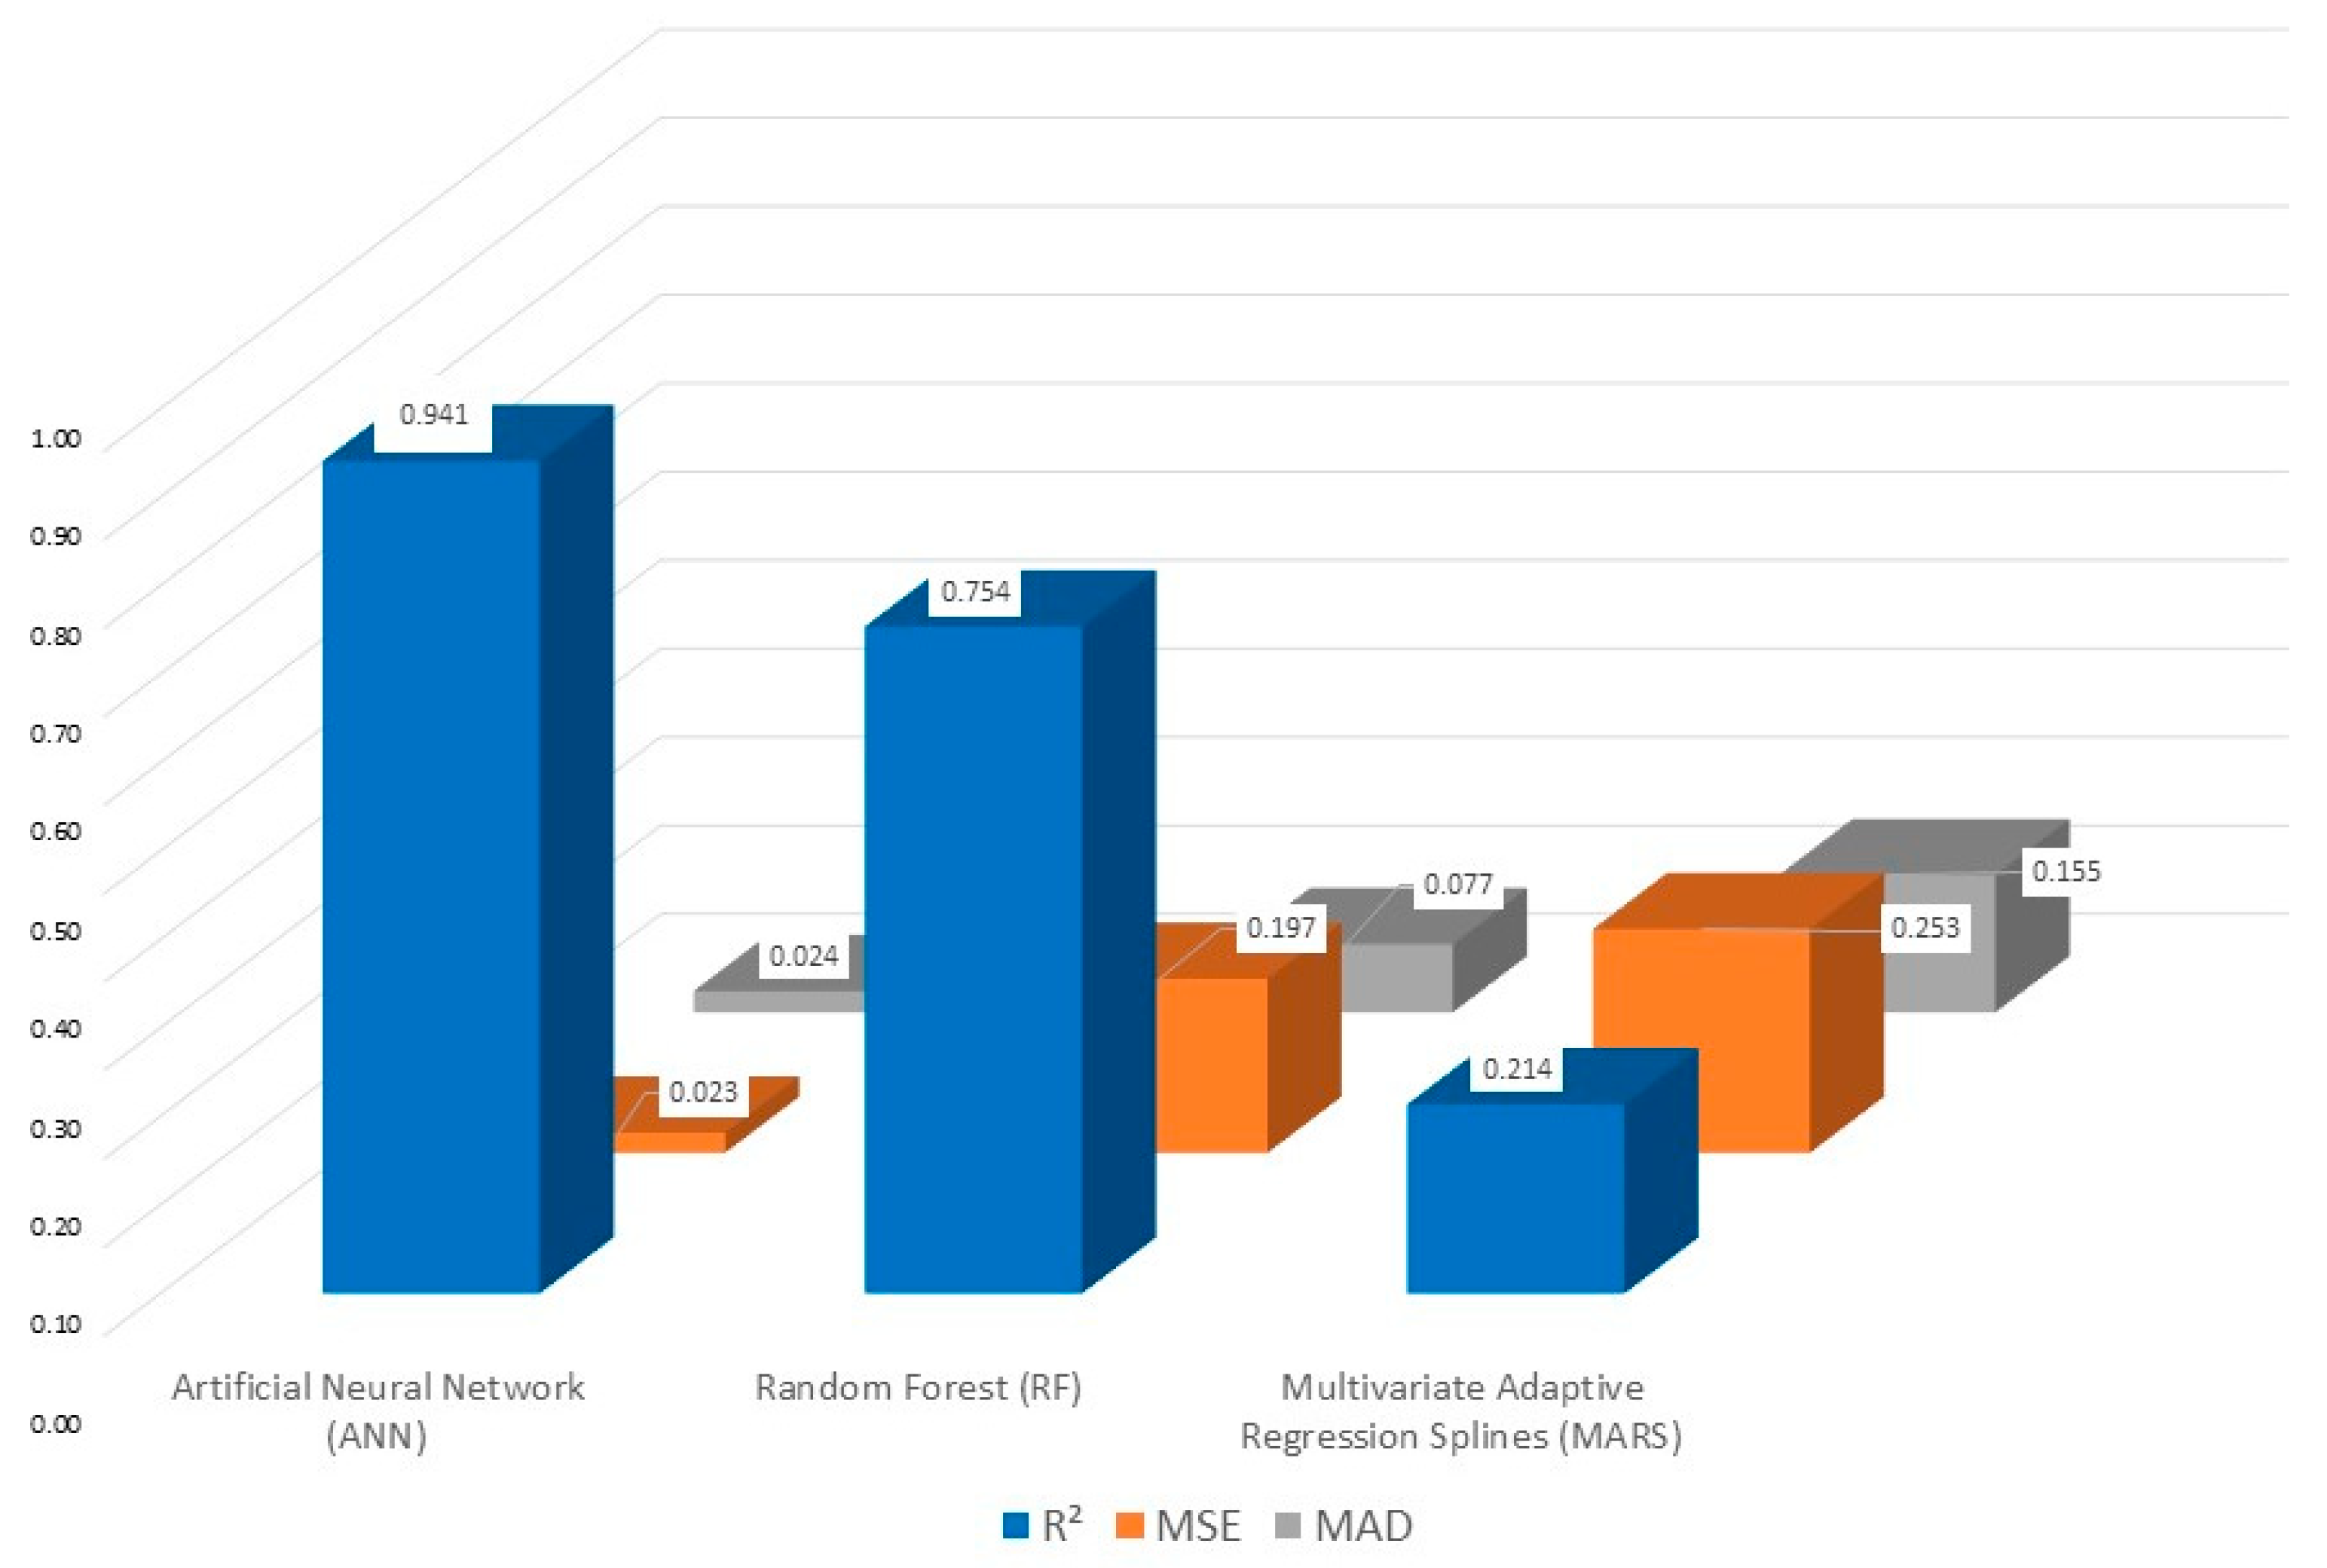
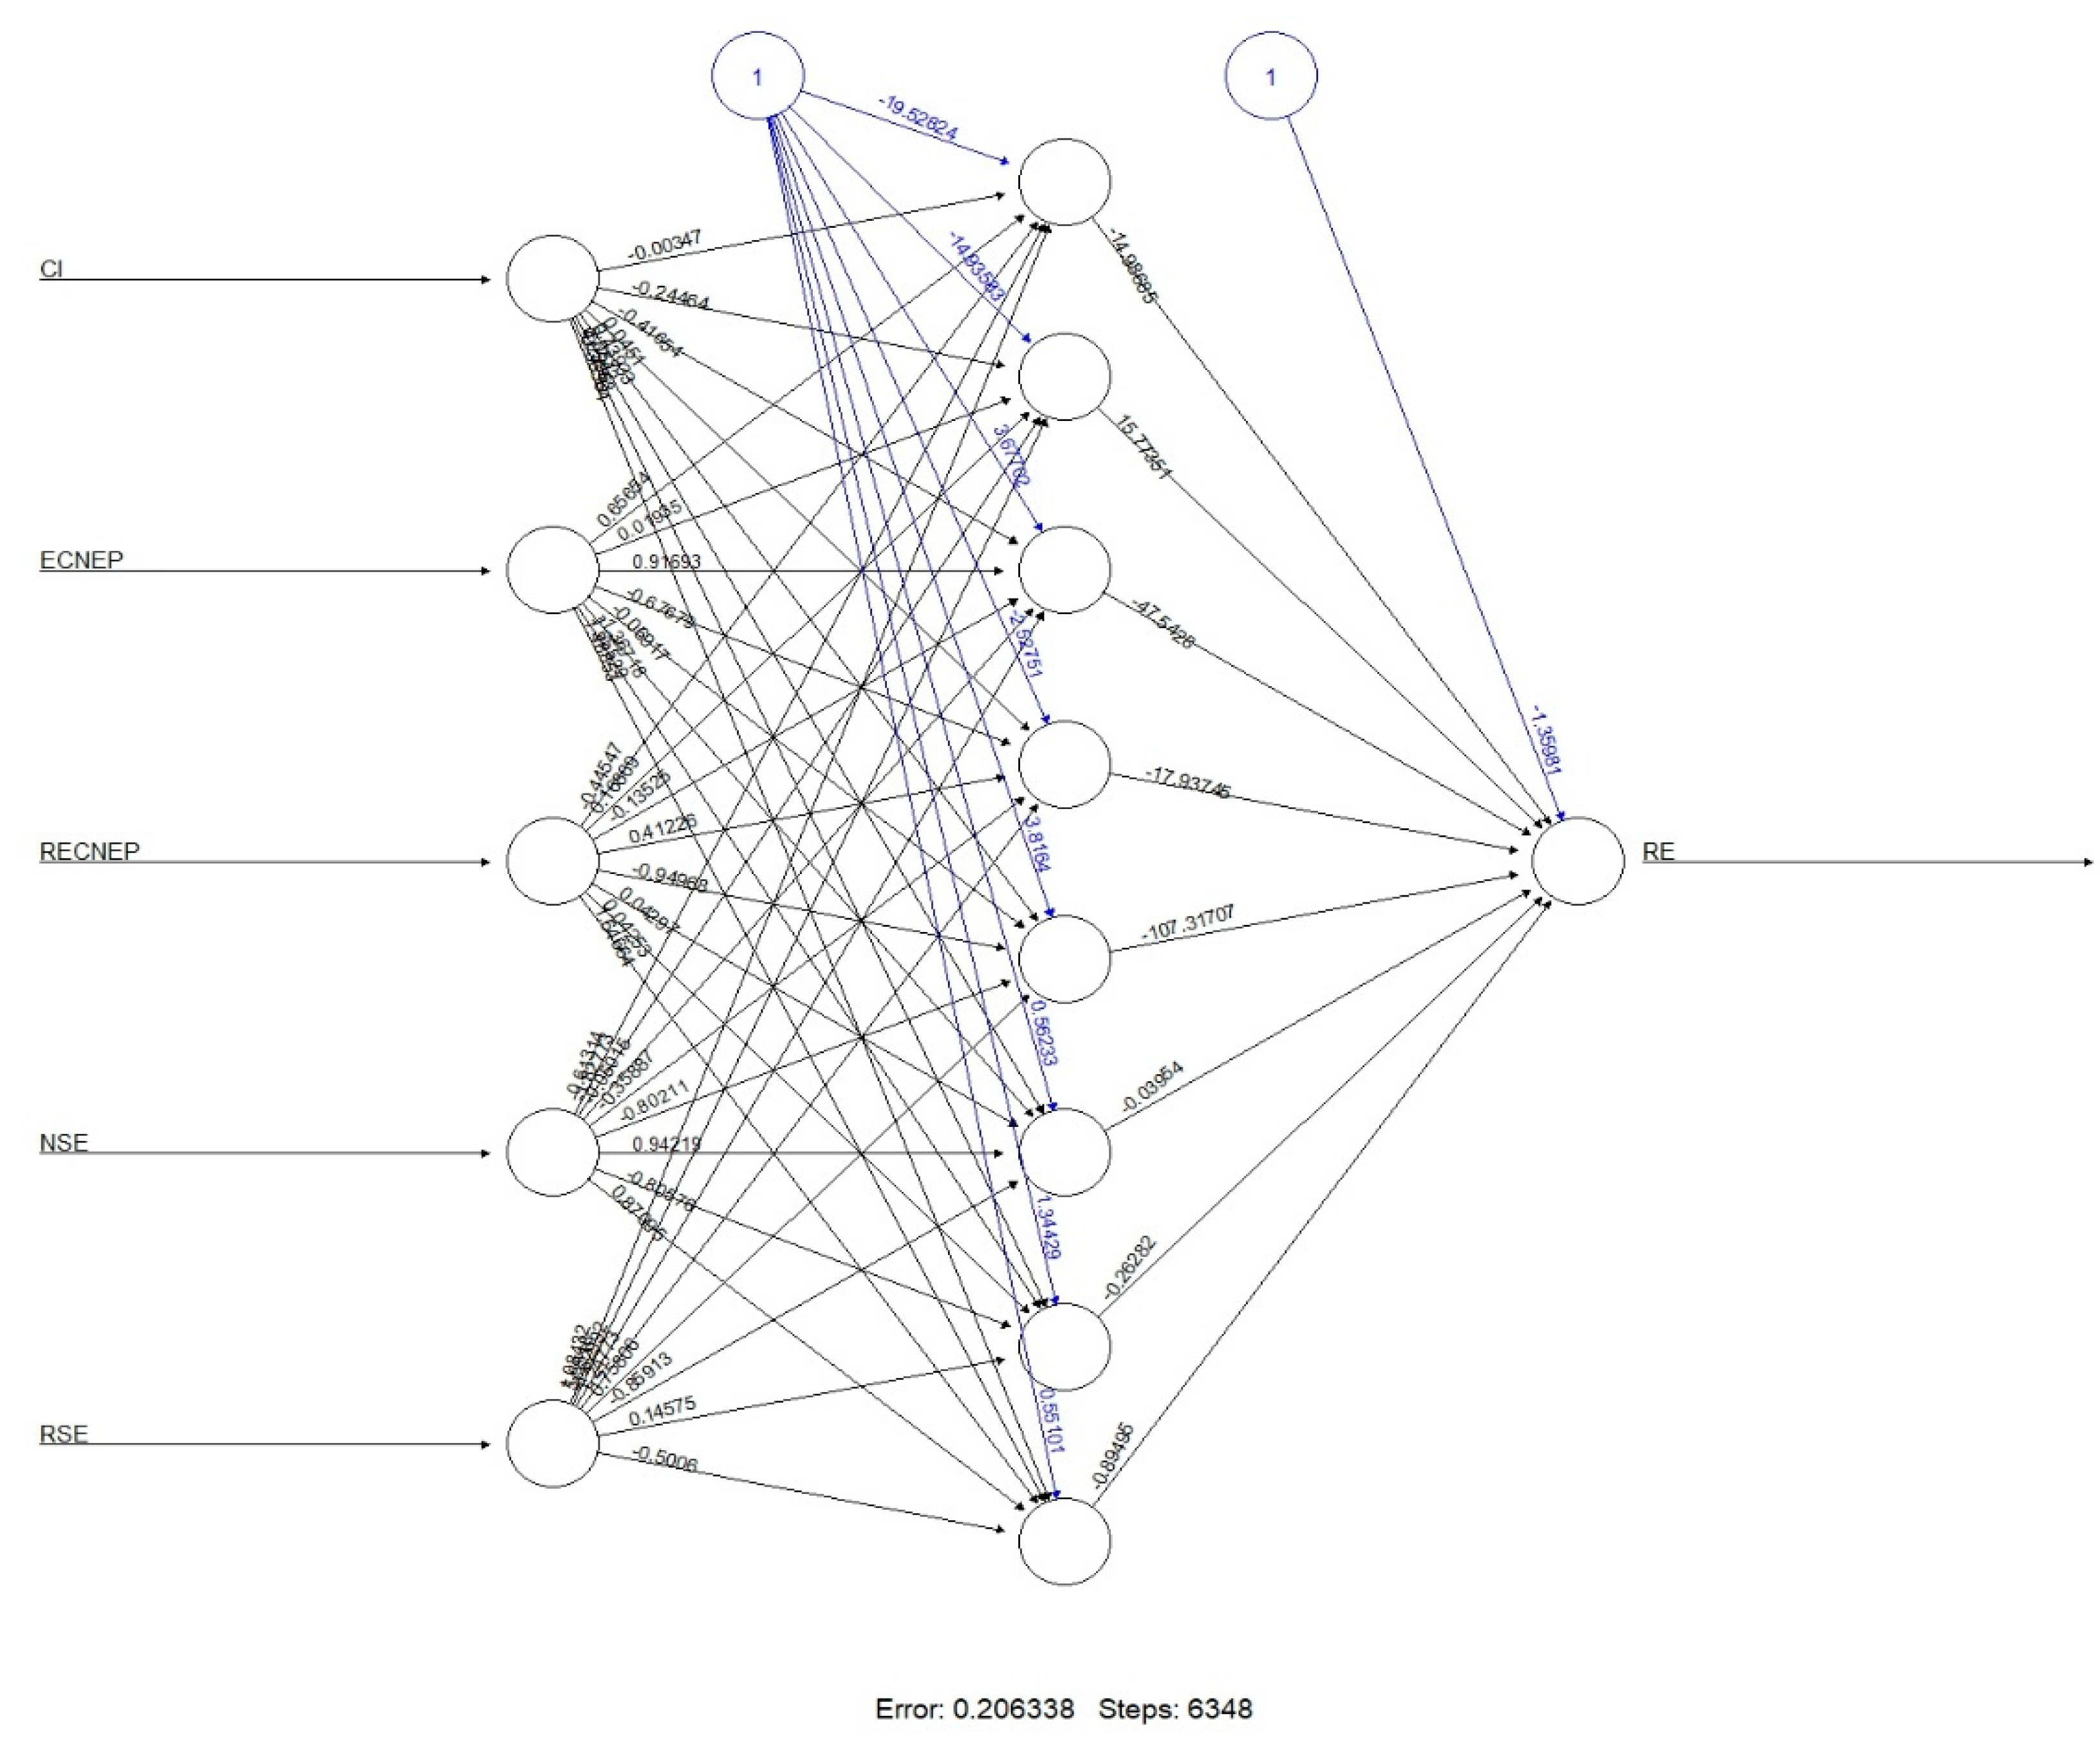
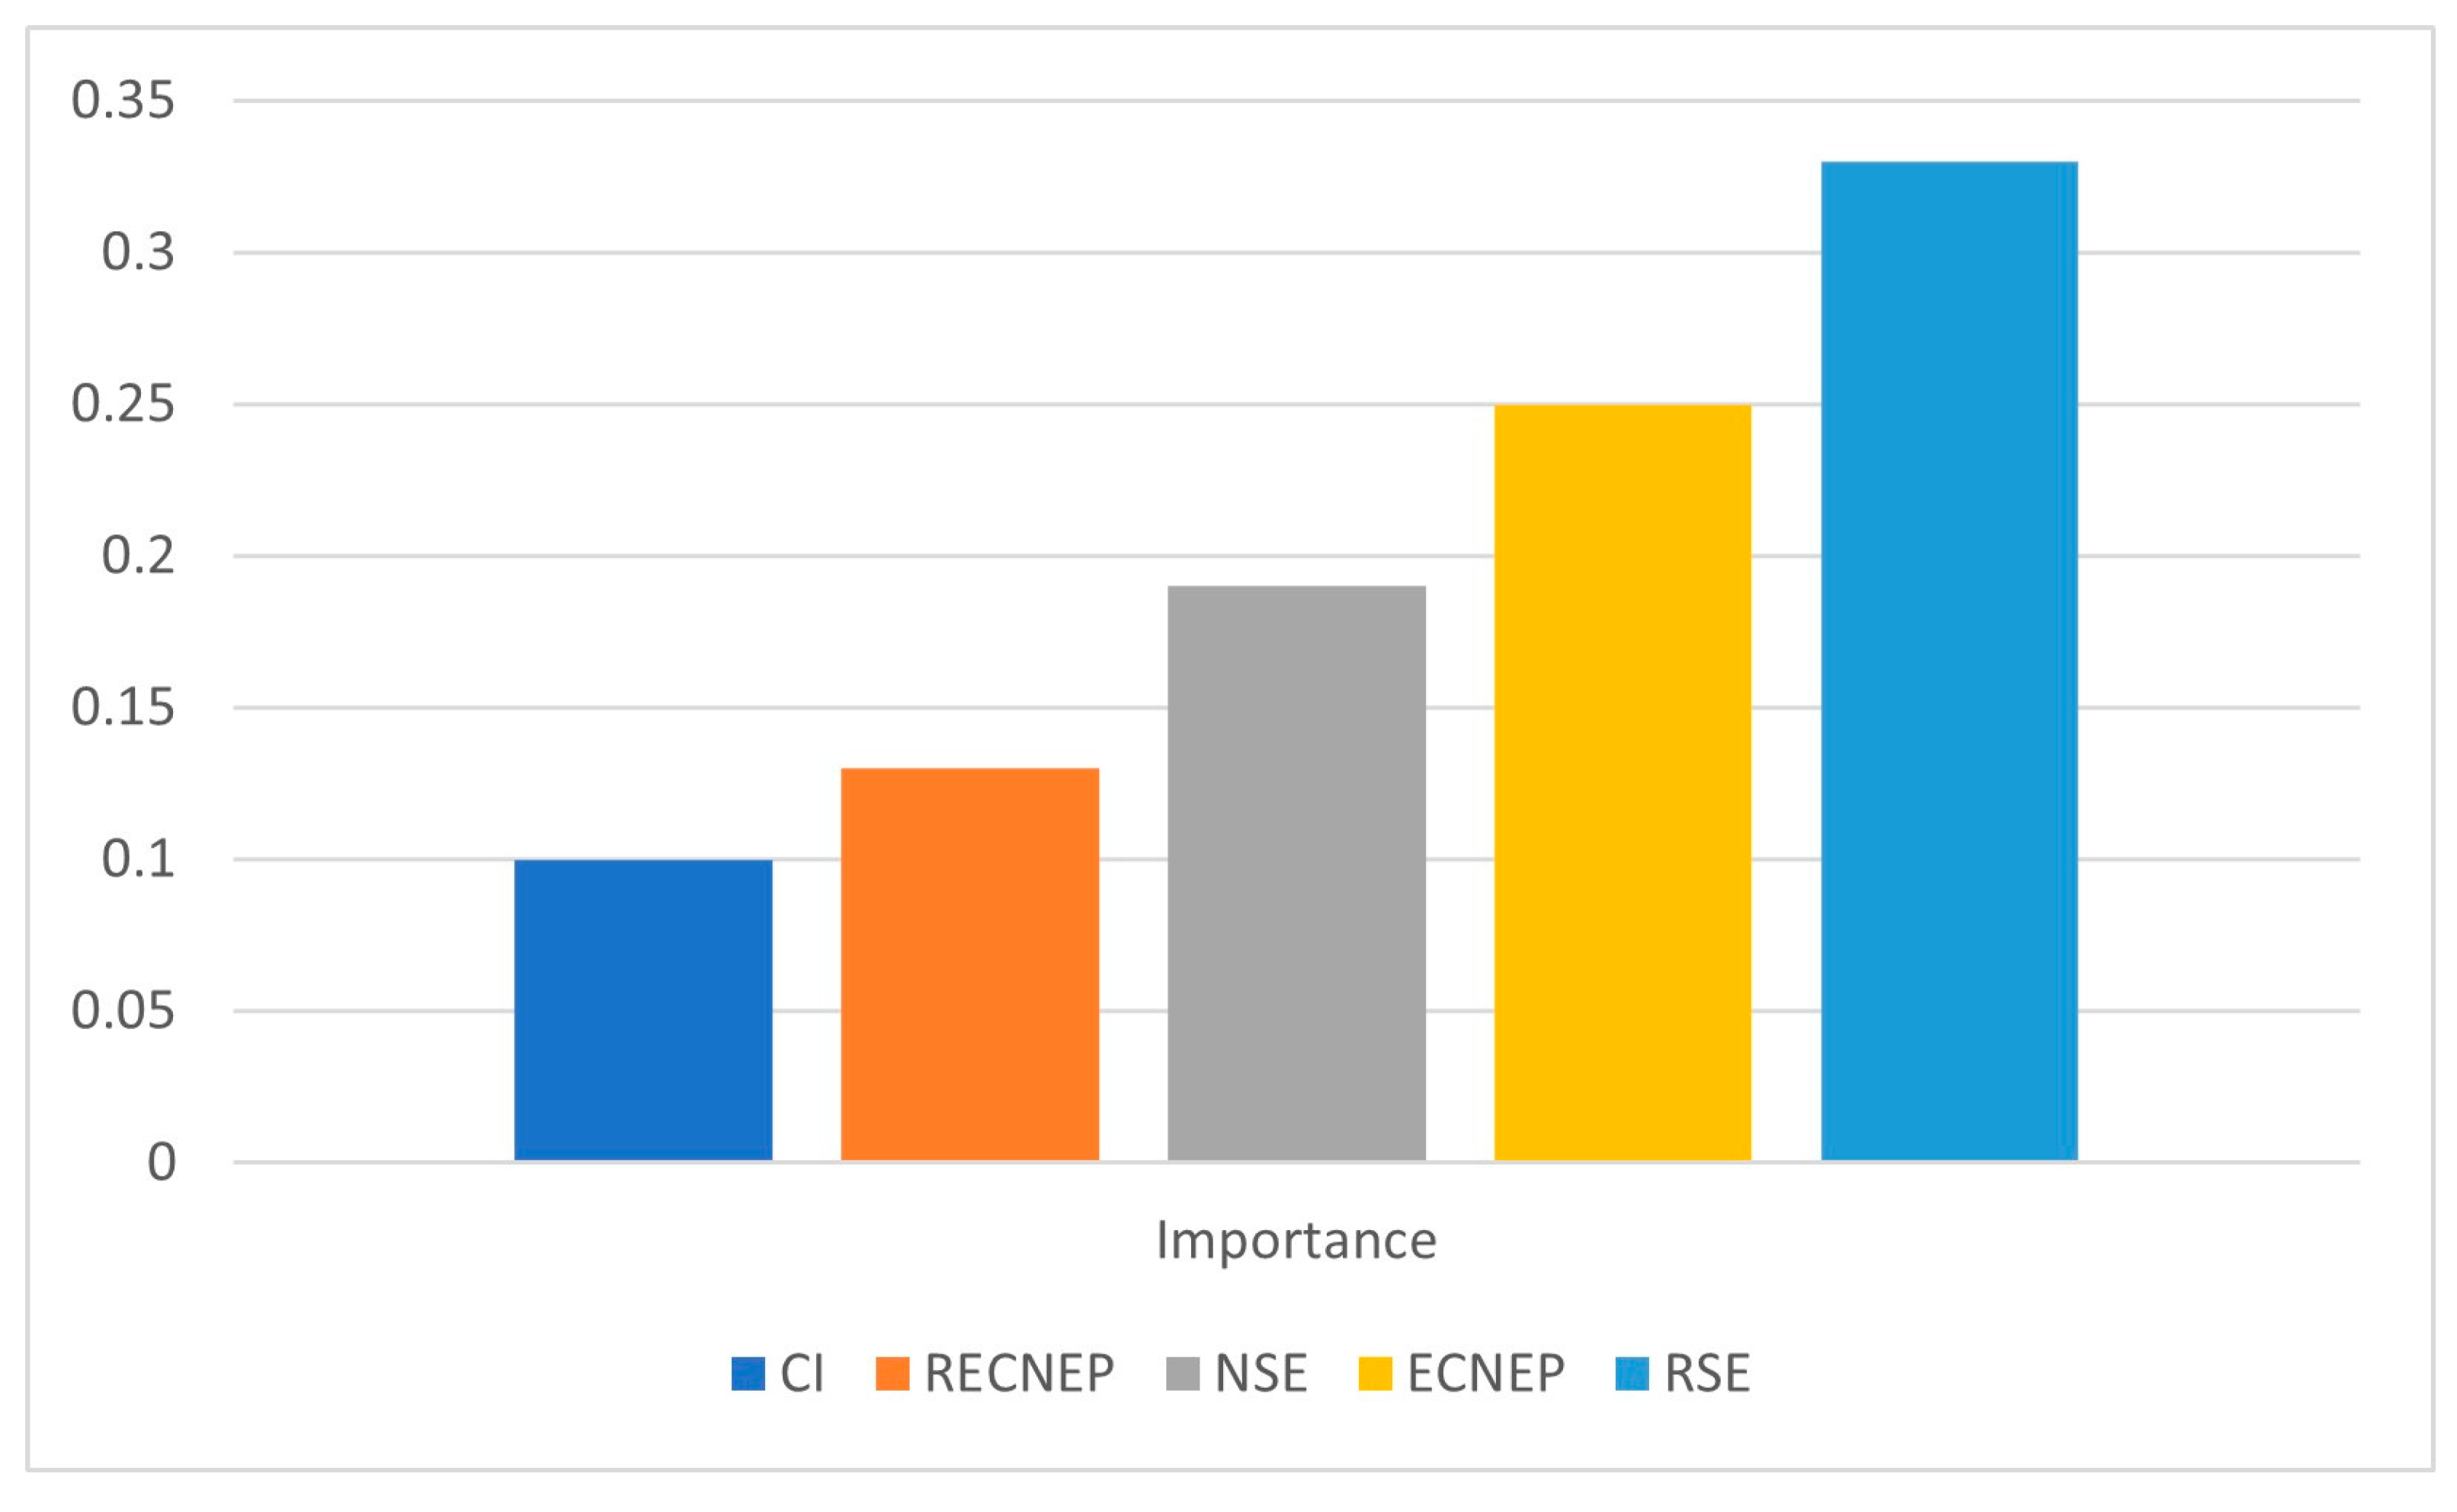
3.4. Machine Learning (ML) Analysis

In summary, the results obtained through simple statistical analysis revealed numerous differences between genotypes but fell short in providing comprehensive insights into the key factors governing the efficiency of callus regeneration from hypocotyls. This limitation stems from the complex, non-linear, and multifactorial nature of interactions among various factors. Machine Learning (ML) emerges as a robust and versatile technique, employed across diverse domains for resolving intricate issues, making predictions, uncovering patterns, and analyzing data. In this study, ML techniques, specifically Artificial Neural Networks with Multilayer Perceptron (ANN-MLP) and Random Forest (RF), were harnessed. Additionally, the Multivariate Adaptive Regression Splines (MARS) technique was employed to construct multi-part linear regression models. This approach aimed not only to evaluate prediction performance but also to capture non-linear correlations inherent in the data. By leveraging these advanced ML methods, the research sought a more nuanced understanding of the intricate dynamics influencing callus regeneration efficiency, surpassing the limitations of traditional statistical analyses.
The evaluation of algorithm efficacy in this study employed Mean Squared Error (MSE) and Mean Absolute Deviation (MAD) as metrics. Additionally, the determination of how well the trained regression models align with the data involved the calculation of R2, as illustrated in Figure 4. The examination of test performance metrics, MSE, and MAD, revealed a notable trend wherein the Artificial Neural Network (ANN) model demonstrated the highest level of performance, followed by the Random Forest (RF) model and the Multivariate Adaptive Regression Spline (MARS) model, respectively. Specifically, the ANN model exhibited the highest R2 value among the three models, registering at 94.1%. In comparison, the RF model achieved an R2 value of 75.4%, while the MARS model lagged with a value of 21.4%. Notably, the research findings indicate that the MARS model performed significantly poorer than both the ANN and RF models, underscoring the superior performance of the ANN model in capturing the complexities of the data and making accurate predictions.
Consequently, the Artificial Neural Network (ANN) algorithm emerged as the most accurate model for predicting the Regeneration Efficiency (RE) values of in vitro-grown fodder peas. The structure of the ANN model is depicted in Figure 5. The initial layer, known as the Input Layer, acts as the entry point for the data, with each input characteristic assigned to a respective input neuron. The model incorporates a Hidden Layer, functioning as an intermediate layer to enhance complexity and effectively capture intricate patterns within the dataset. Neurons within each hidden layer are intricately interconnected by specific weights and activation functions. The final layer of the ANN, the Output Layer, is responsible for generating predictions or classification outcomes, with neurons in this layer representing the model’s output. The error value, expressing the extent to which the model’s predictions deviate from real values, was determined to be 0.206338. The model underwent 6348 steps, representing iterations in which the model processes a dataset and updates its weights. A model with a smaller error and a greater number of steps signifies superior performance in prediction. In this context, the ANN model demonstrated notable accuracy and efficiency in predicting the RE values for in vitro-cultivated fodder peas.
In Figure 6, the ranking of variable importance for estimating the output variable using the input variables in the ANN model is presented, while Figure 7 depicts the importance ranking for the same estimation process in the RF model. The analysis unveiled that, in the ANN model, the most influential factor determining Regeneration Efficiency (RE) was RSE, closely followed by ECNEP. On the other hand, in the RF model, it was observed that the variable with the highest significance in predicting RE was CI, followed by RECNEP. Despite the ANN model demonstrating superior accuracy in predictive modeling based on performance criteria (Figure 4), a nuanced analysis of the relative significance of variables indicated that the RF model outperformed the ANN model in forecasting data related to the final stage of the in vitro experimental procedure. This was particularly evident in the context of the variables CI and ECNEP, which were identified at the earliest stage of the process. Nevertheless, it is worth noting that, considering performance standards, a combined approach involving both the RF and ANN models might offer advantages. The integration of these models could potentially leverage the strengths of each, resulting in a more comprehensive and robust predictive framework.

4. Discussion

In this study, hypocotyl explants from 42 distinct fodder pea plants underwent in vitro cultivation. At specified time intervals outlined in the methodology, various characteristics such as callus induction (CI), percentage of embryogenic calluses per explant (ECNEP), percentage of responding embryogenic calluses per explant (RECNEP), number of somatic embryogenesis (NSE), number of responding somatic embryogenesis (RSE), regeneration efficiency (RE), and number of regenerated plantlets (NRP) were observed for each genotype. One of the primary objectives was to investigate the relationships between the genetic variants of these genotypes by analyzing their embryogenetic capabilities. The analysis of variance revealed a statistically significant difference (p < 0.001) between genotypes for each of the in vitro parameters measured. This suggests that the observed heterogeneity in tissue culture performance among fodder peas is largely influenced by genetic factors. Similar findings were reported in studies involving wheat (Triticum aestivum L.), rice (Oryza sativa L.), and pea plants cultivated in callus culture, emphasizing the substantial impact of genotype on tissue culture outcomes [4,39,40,41,42].
Efficient regeneration is a prerequisite for polyploidy induction in plants. Hypocotyls are often used as explants for polyploid induction and organogenesis [43].
Another investigation focused on the regeneration potential of epicotyl and hypocotyl explants in the genotype Caesalpinia bonduc L., a traditional medicinal plant of the Fabaceae/Caesalpinaceae family. The study reported a remarkable 92% success rate for explants, along with a high shoot regeneration frequency. Maximum shoot production (3.6 ± 0.3) was observed in epicotyl explants supplemented with Murashige and Skoog (MS) medium. In a study on tetraploid black locust (Robinia pseudoacacia L.) plants, the highest induction efficiency, reaching 53.33%, was achieved by treating hypocotyl explants with 70 mg L−1 of colchicine for 2 days [44]. Another investigation focused on the regeneration potential of epicotyl and hypocotyl explants in the genotype Caesalpinia bonduc L., a traditional medicinal plant of the Fabaceae/Caesalpinaceae family. The study reported a remarkable 92% success rate for explants, along with a high shoot regeneration frequency. Maximum shoot production (3.6 ± 0.3) was observed in epicotyl explants supplemented with Murashige and Skoog (MS) medium.
Previous reports on fodder pea genotypes indicated varying responses to callus induction. For instance, the callus induction frequency was higher in epicotyl and leaf explants compared to root explants [45]. In contrast, a study conducted by Bolouri et al. [46] using root explants of pea (Pisum arvense L.) reported lower in vitro values (for CI, ECNEP, RECNEP, NSE, RSE, RE, and NRP) than the observations in your research. The results of your research suggest that the root explants used by Bolouri et al. were less effective compared to the hypocotyl explants employed in your study. Indeed, the choice of explant is a critical factor influencing the success of in vitro culture [47,48].
Principal components analysis is employed to generate a concise set of linear combinations that effectively encapsulate the predominant variation within the dataset [31,49]. The coefficients of variation for the distribution around the primary components were computed individually for each component. This metric is commonly referred to as the eigenvalue. Following the principal component analysis, five distinct independent principal component axes were derived for the observed characteristics. These five principal component axes accounted for 98.90% of the total variation across 42 fodder pea genotypes. The eigenvalues associated with the first three principal components ranged from 1.20 to 3.03, with the third principal component axis contributing significantly by explaining 87.30% of the overall variation. The application of principal component analysis (PCA) allows for the characterization of variations observed among experimental materials, thereby aiding in the identification of noteworthy plant traits [49,50]. In the biplot diagram, genotypes are deemed to have substantial contribution coefficients when their F values surpass 0. In the stability context, F values closer to zero are interpreted as indicative of greater stability, in contrast to values farther away [51]. The selection of specific fodder pea genotypes was determined based on the obtained data, which uncovered a notable correlation between the variables RE and NRP in our study, particularly within the genotypes Doğruyol, Ovaçevirme-4, Döşeli-1, Yolgeçmez, and Incili-3. Additionally, the genotypes Avcılar, Ovaçevirme-3, and Ardahan Merkez-2 exhibited the strongest associations with variations in RECNEP, NSE, RDE, and RECNEP.
Cluster analysis, utilizing tissue culture characteristics, resulted in the classification of genotypes into four groups. The greatest genetic distance was observed between the first and fourth groups. The genetic diversity of plants is a crucial factor that determines their potential for enhanced productivity and, consequently, their suitability for applications in plant breeding [52]. Hybrids resulting from genetically distinct genotypes demonstrate a significant boost in productivity, rendering them highly desirable for inclusion in breeding programs. This preference is rooted in the fact that the crossing of such diverse genotypes leads to an optimal level of heterosis, thereby augmenting the overall efficiency of breeding initiatives [38]. An evaluation of genetic diversity among the offspring designated for the development of pure line varieties can be attained by examining the levels of genetic diversity within the adapted elite germplasm. In fodder pea hybridization systems, a viable strategy for parent selection involves estimating the genetic distance between potential parents [53].
The optimization of in vitro culturing, being a nonlinear, multivariable, and complex system, is characterized by its challenging nature, substantial costs, and time-intensive demands [18,22,23]. Hence, there is a substantial requirement for the adoption of innovative computational methodologies, such as machine learning algorithms, to systematically analyze and improve the efficiency of this specific system by reducing the number of treatments applied [16,54]. In their study, Aasim et al. [21] explored the potential influence of varying concentrations of hydrogen peroxide (H2O2) on the germination and morphological characteristics of cannabis seedlings cultivated in vitro. For data analysis, the researchers utilized four distinct machine learning algorithms, namely the support vector classifier (SVC), Gaussian process (GP), extreme gradient boosting (XGBoost), and random forest (RF) algorithms. The findings of the study indicated that the RF model exhibited superior performance in predicting the output variable. In recent studies, researchers have explored the reliability and accuracy of various types of Artificial Neural Networks (ANNs) across different stages of plant tissue growth [18,23,55]. For example, Zhang et al. [56] employed the MLP model for modeling and forecasting organogenic callus development based on four input variables (agar concentration, humidity, light duration, and culture temperature). They found that the MLP was able to properly model and predict the system (R2 > 0.96). Aasim et al. (2022) [19] found that comparing artificial neural network algorithms with machine learning algorithms made it easier to forecast and verify in vitro organogenesis in sorghum for shoot count and shoot length. In addition to this, the researchers demonstrated that the MLP (R2  =  0.799 for shoot count and R2  =  0.831 for shoot length) model was superior to the ML methods of random forest (RF) (R2 = 0.779 for shoot count and R2 = 0.786 for shoot length) and extreme gradient boost (XGBoost) (R2  =  0.768 for shoot count and R2  =  0.781 for shoot length) in terms of its overall performance efficiency. The results that we acquired from our research led us to the conclusion that the ANN-MLP model (R2 = 0.941) performs better than the RF model (R2 = 0.754) and the MARS model (R2 = 0.214) (Figure 4). Despite this, it has been demonstrated that the Random Forest (RF) model is proficient in accurately predicting Regeneration Efficiency (RE) in the early stages of the in vitro process (Figure 7). This revelation was made by considering the order of significance of the input variables in the estimation process (Figure 6 and Figure 7). The Multivariate Adaptive Regression Splines (MARS) model is occasionally positioned between statistical modeling and machine learning (ML). Due to its capability to capture more intricate patterns in the data, it is quite comparable to machine learning techniques, even though it is fundamentally grounded in the principles of regression analysis [33,57]. Consequently, MARS is apt for inclusion in both the Machine Learning (ML) and statistical modeling categories. In various studies, comparisons between the MARS model and Artificial Neural Network (ANN) algorithms have been conducted, and contrary to our findings, it has been observed that the MARS model yielded superior results [58]. In modeling and estimation studies, diverse findings across various case studies and research may arise due to multiple factors at play. MARS, ANN, and RF algorithms employ different approaches and possess distinct learning capacities. The performance of an algorithm can vary based on the characteristics of the dataset and the nature of the problem at hand.

5. Conclusions

In traditional statistical approaches, reliance on basic statistical measures and a limited set of key variables is common for evaluating the biological characteristics of plants. In our research, we took a different approach by classifying genotypes into groups to establish genetic relationships among fodder pea genotypes. We specifically identified genotypes with the greatest genetic distance, such as those in the first and fourth groups. Utilizing Principal Component Analysis (PCA)-based biplot analysis, we established relationships between observed variables and genotypes, facilitating genotype selection based on specific characteristics. The in vitro procedure poses challenges due to its time-consuming nature in experimental investigations. Moreover, the inclusion of multiple variables adds complexity to the analysis and understanding. In the stressful in vitro environment, the developmental patterns of plant cells and tissues exhibit non-deterministic and non-linear characteristics. Therefore, robust prediction analyses are essential to account for these nonlinear factors. In this study, the Artificial Neural Network (ANN), Random Forest (RF), and Multivariate Adaptive Regression Splines (MARS) models were effectively employed to address these challenges. The ANN model demonstrated superior performance compared to the RF and MARS models. However, the Random Forest (RF) model exhibited superior performance, especially in predicting Regeneration Efficiency (RE), when utilizing data collected at the initial stages of the in vitro process. Utilizing a machine learning and artificial neural network-based technique, as demonstrated in our study, accelerates evaluations of regeneration efficiency for various cultivars.

Author Contributions

Conceptualization, A.T., K.H. and G.N.; methodology, A.T., B.E., F.D., P.B. and G.N.; software, A.T., F.D., M.İ.I., M.P., T.W. and G.N.; validation, A.T., K.H., M.İ.I., F.D., M.P., T.W. and G.N.; formal analysis, A.T., K.H., F.D. and G.N.; investigation, A.T., K.H. and G.N.; resources, A.T., K.H., M.İ.I., M.P. and G.N.; data curation, A.T., K.H., F.D., B.E., T.W, and G.N.; writing—original draft preparation, A.T., K.H., F.D., B.E. and G.N.; writing—review and editing, A.T., K.H., B.E., F.D., M.P., T.W. and G.N.; visualization, K.H., A.T. and G.N.; supervision, K.H. and G.N.; project administration, K.H., A.T. and G.N.; funding acquisition A.T., K.H. and G.N. All authors have read and agreed to the published version of the manuscript.

Funding

This research received no external funding.

Data Availability Statement

All data supporting the conclusions of this article are included in this article.

Conflicts of Interest

The authors declare no conflict of interest.

References

  1. Vidyagina, E.O.; Kharchenko, N.N.; Shestibratov, K.A. Efficient cryopreservation of Populus tremula by in vitro-grown axillary buds and genetic stability of recovered plants. Plants 2021, 10, 77. [Google Scholar] [CrossRef] [PubMed]
  2. Yilmaz, K.; Huyop, F.Z. An easy and reliable method for establishment and maintenance of tissue cultures of Nicotiana tabacum cv TAPM 26. Int. J. Sci. Lett. 2020, 2, 62–71. [Google Scholar]
  3. Espinosa-Leal, C.A.; Puente-Garza, C.A.; García-Lara, S. In vitro plant tissue culture: Means for production of biologically active compounds. Planta 2018, 248, 1–18. [Google Scholar] [CrossRef]
  4. Altpeter, F.; Springer, N.M.; Bartley, L.E.; Blechl, A.E.; Brutnell, T.P.; Citovsky, V.; Conrad, L.J.; Gelvin, S.B.; Jackson, D.P.; Kausch, A.P. Advancing crop transformation in the era of genome editing. Plant Cell 2016, 28, 1510–1520. [Google Scholar] [CrossRef] [PubMed]
  5. Verdeil, J.-L.; Alemanno, L.; Niemenak, N.; Tranbarger, T.J. Pluripotent versus totipotent plant stem cells: Dependence versus autonomy? Trends Plant Sci. 2007, 12, 245–252. [Google Scholar] [CrossRef] [PubMed]
  6. Efferth, T. Biotechnology applications of plant callus cultures. Engineering 2019, 5, 50–59. [Google Scholar] [CrossRef]
  7. Huang, H.; Wei, Y.; Zhai, Y.; Ouyang, K.; Chen, X.; Bai, L. High frequency regeneration of plants via callus-mediated organogenesis from cotyledon and hypocotyl cultures in a multipurpose tropical tree (Neolamarkia cadamba). Sci. Rep. 2020, 10, 4558. [Google Scholar] [CrossRef] [PubMed]
  8. Kaviani, B.; Hesar, A.A.; Kharabian-Masouleh, A. In vitro propagation of Matthiola incana (Brassicaceae)—An ornamental plant. Plant Omics 2011, 4, 435–440. [Google Scholar]
  9. Pramanik, D.; Shelake, R.M.; Park, J.; Kim, M.J.; Hwang, I.; Park, Y.; Kim, J.-Y. CRISPR/Cas9-mediated generation of pathogen-resistant tomato against tomato yellow leaf curl virus and powdery mildew. Int. J. Mol. Sci. 2021, 22, 1878. [Google Scholar] [CrossRef]
  10. Dalla Costa, L.; Malnoy, M.; Gribaudo, I. Breeding next generation tree fruits: Technical and legal challenges. Hortic. Res. 2017, 4, 17067. [Google Scholar] [CrossRef]
  11. Klap, C.; Yeshayahou, E.; Bolger, A.M.; Arazi, T.; Gupta, S.K.; Shabtai, S.; Usadel, B.; Salts, Y.; Barg, R. Tomato facultative parthenocarpy results from SlAGAMOUS-LIKE 6 loss of function. Plant Biotechnol. J. 2017, 15, 634–647. [Google Scholar] [CrossRef] [PubMed]
  12. Palaz, E.; Ugur, R.; Yaman, M. Micropropagation Protocols of New Prunus Hybrids with Significant Rootstock Potential in Fruit Breeding and Cultivation. Erwerbs-Obstbau 2023, 65, 1359–1364. [Google Scholar] [CrossRef]
  13. Dinneny, J.R.; Benfey, P.N. Plant stem cell niches: Standing the test of time. Cell 2008, 132, 553–557. [Google Scholar] [CrossRef] [PubMed]
  14. Trick, H.N. Recent advances in soybean transformation. Plant Tissue Cult. Biotechnol. 1997, 3, 9–26. [Google Scholar]
  15. Jain, S.M.; Gupta, P.K. Step-Wise Protocols for Somatic Embryogenesis of Important Woody Plants; Springer: Berlin/Heidelberg, Germany, 2018. [Google Scholar]
  16. Niazian, M.; Niedbała, G. Machine learning for plant breeding and biotechnology. Agriculture 2020, 10, 436. [Google Scholar] [CrossRef]
  17. Farhadi, S.; Salehi, M.; Moieni, A.; Safaie, N.; Sabet, M.S. Modeling of paclitaxel biosynthesis elicitation in Corylus avellana cell culture using adaptive neuro-fuzzy inference system-genetic algorithm (ANFIS-GA) and multiple regression methods. PLoS ONE 2020, 15, e0237478. [Google Scholar] [CrossRef]
  18. Hesami, M.; Condori-Apfata, J.A.; Valderrama Valencia, M.; Mohammadi, M. Application of artificial neural network for modeling and studying in vitro genotype-independent shoot regeneration in wheat. Appl. Sci. 2020, 10, 5370. [Google Scholar] [CrossRef]
  19. Kirtis, A.; Aasim, M.; Katırcı, R. Application of artificial neural network and machine learning algorithms for modeling the in vitro regeneration of chickpea (Cicer arietinum L.). Plant Cell Tissue Organ Cult. PCTOC 2022, 150, 141–152. [Google Scholar] [CrossRef]
  20. Gökmen, F.; Uygur, V.; Sukuşu, E. Extreme Gradient Boosting Regression Model for Soil Available Boron. Eurasian Soil Sci. 2023, 56, 738–746. [Google Scholar] [CrossRef]
  21. Aasim, M.; Katırcı, R.; Akgur, O.; Yildirim, B.; Mustafa, Z.; Nadeem, M.A.; Baloch, F.S.; Karakoy, T.; Yılmaz, G. Machine learning (ML) algorithms and artificial neural network for optimizing in vitro germination and growth indices of industrial hemp (Cannabis sativa L.). Ind. Crops Prod. 2022, 181, 114801. [Google Scholar] [CrossRef]
  22. Aasim, M.; Katirci, R.; Baloch, F.S.; Mustafa, Z.; Bakhsh, A.; Nadeem, M.A.; Ali, S.A.; Hatipoğlu, R.; Çiftçi, V.; Habyarimana, E. Innovation in the breeding of common bean through a combined approach of in vitro regeneration and machine learning algorithms. Front. Genet. 2022, 13, 897696. [Google Scholar] [CrossRef]
  23. Hesami, M.; Jones, A.M.P. Application of artificial intelligence models and optimization algorithms in plant cell and tissue culture. Appl. Microbiol. Biotechnol. 2020, 104, 9449–9485. [Google Scholar] [CrossRef] [PubMed]
  24. Salehi, M.; Farhadi, S.; Moieni, A.; Safaie, N.; Ahmadi, H. Mathematical modeling of growth and paclitaxel biosynthesis in Corylus avellana cell culture responding to fungal elicitors using multilayer perceptron-genetic algorithm. Front. Plant Sci. 2020, 11, 1148. [Google Scholar] [CrossRef] [PubMed]
  25. Niazian, M.; Shariatpanahi, M.E.; Abdipour, M.; Oroojloo, M. Modeling callus induction and regeneration in an anther culture of tomato (Lycopersicon esculentum L.) using image processing and artificial neural network method. Protoplasma 2019, 256, 1317–1332. [Google Scholar] [CrossRef] [PubMed]
  26. Genze, N.; Bharti, R.; Grieb, M.; Schultheiss, S.J.; Grimm, D.G. Accurate machine learning-based germination detection, prediction, and quality assessment of three grain crops. Plant Methods 2020, 16, 157. [Google Scholar] [CrossRef] [PubMed]
  27. Haliloglu, K.; Turkoglu, A.; Tan, M.; Poczai, P. SSR-based molecular identification and population structure analysis for forage pea (Pisum sativum var. arvense L.) landraces. Genes 2022, 13, 1086. [Google Scholar] [CrossRef]
  28. Murashige, T.; Skoog, F. A revised medium for rapid growth and bioassays with tobacco tissue cultures. Physiol. Plant. 1962, 15, 473–497. [Google Scholar] [CrossRef]
  29. Bencheikh, M.; Gallais, A. Somatic embryogenesis in pea (Pisum sativum L. and Pisum arvense L.): Diallel analysis and genetic control. Euphytica 1996, 90, 257–264. [Google Scholar] [CrossRef]
  30. Lazzeri, P.A.; Hildebrand, D.F.; Collins, G.B. Soybean somatic embryogenesis: Effects of hormones and culture manipulations. Plant Cell Tissue Organ Cult. PCTOC 1987, 10, 197–208. [Google Scholar] [CrossRef]
  31. Demirel, F.; Gurcan, K.; Akar, T. Clustering analysis of morphological and phenological data in einkorn and emmer wheats collected from Kastamonu region. Int. J. Sci. Technol. Res. 2019, 5, 25–36. [Google Scholar]
  32. Gago, J.; Martínez-Núñez, L.; Landín, M.; Gallego, P. Artificial neural networks as an alternative to the traditional statistical methodology in plant research. J. Plant Physiol. 2010, 167, 23–27. [Google Scholar] [CrossRef] [PubMed]
  33. Demirel, F.; Eren, B.; Yilmaz, A.; Türkoğlu, A.; Haliloğlu, K.; Niedbała, G.; Bujak, H.; Jamshidi, B.; Pour-Aboughadareh, A.; Bocianowski, J. Prediction of Grain Yield in Wheat by CHAID and MARS Algorithms Analyses. Agronomy 2023, 13, 1438. [Google Scholar] [CrossRef]
  34. Eyduran, E.; Akin, M.; Eyduran, S. Application of Multivariate Adaptive Regression Splines through R Software; Nobel Academic Publishing: Ankara, Turkey, 2019. [Google Scholar]
  35. Eren, B.; Türkoğlu, A.; Haliloğlu, K.; Demirel, F.; Nowosad, K.; Özkan, G.; Niedbała, G.; Pour-Aboughadareh, A.; Bujak, H.; Bocianowski, J. Investigation of the Influence of Polyamines on Mature Embryo Culture and DNA Methylation of Wheat (Triticum aestivum L.) Using the Machine Learning Algorithm Method. Plants 2023, 12, 3261. [Google Scholar] [CrossRef] [PubMed]
  36. Kuhn, M.; Wing, J.; Weston, S.; Williams, A.; Keefer, C.; Engelhardt, A.; Cooper, T.; Mayer, Z.; Kenkel, B.; Benesty, M. Caret: Classification and Regression Training: R Package; CRAN: Vienna, Austria, 2019. [Google Scholar]
  37. R Core Team. R: A Language and Environment for Statistical Computing; R Foundation for Statistical Computing: Vienna, Austria, 2010. [Google Scholar]
  38. Hussain, I.; Ali, S.; Liu, W.; Awais, M.; Li, J.; Liao, Y.; Zhu, M.; Fu, C.; Liu, D.; Wang, F. Identification of heterotic groups and patterns based on genotypic and phenotypic characteristics among rice accessions of diverse origins. Front. Genet. 2022, 13, 811124. [Google Scholar] [CrossRef] [PubMed]
  39. Carsono, N.; Yoshida, T. Variation in spikelet-related traits of rice plants regenerated from mature seed-derived callus culture. Plant Prod. Sci. 2007, 10, 86–90. [Google Scholar] [CrossRef]
  40. Haliloglu, K.; Bezirganoğlu, İ.; Aydin, M.; Tosun, M.; Şahin, E. Response of current winter wheat cultivars grown in Turkey to immature embryo culture. Atatürk Uni. J. Agri. Fac. 2013, 44, 21–25. [Google Scholar]
  41. Kuznetsova, O.; Ash, O.; Hartina, G.; Gostimskij, S. RAPD and ISSR analyses of regenerated pea (Pisum sativum L.) plants. Russ. J. Genet. 2005, 41, 60–65. [Google Scholar] [CrossRef]
  42. Varshney, A.; Altpeter, F. Stable transformation and tissue culture response in current European winter wheats (Triticum aestivum L.). Mol. Plant Breed. 2002, 8, 295–309. [Google Scholar] [CrossRef]
  43. Nagar, D.S.; Jha, S.K.; Jani, J. Direct adventitious shoot bud formation on hypocotyls explants in Millettia pinnata (L.) Panigrahi —A biodiesel-producing medicinal tree species. Physiol. Mol. Biol. Plants 2015, 21, 287–292. [Google Scholar] [CrossRef]
  44. Li, X.; Zhang, Z.; Ren, Y.; Feng, Y.; Guo, Q.; Dong, L.; Sun, Y.; Li, Y. Induction and early identification of tetraploid black locust by hypocotyl in vitro. Vitr. Cell. Dev. Biol. 2021, 57, 372–379. [Google Scholar] [CrossRef]
  45. Cardi, T.; Monti, L. Optimization of callus culture in pea (Pisum sativum L.). Ann. Della Fac. Di Sci. Agrar. Della Univ. Degli Studi Di Napoli Portici 1990, 24, 11–18. [Google Scholar]
  46. Bolouri, P.; Hosseinpour, A.; Jannati, G.; Haliloğlu, K. Genetic diversity of Pea (Pisum arvense L.) genotypes according to the tissue culture traits. Atatürk Uni. J. Agri. Fac. 2019, 50, 11–17. [Google Scholar]
  47. Chakraborty, N.; Chakraborty, P.; Sen, M.; Bandopadhyay, R. Choice of explant for plant genetic transformation. In Biolistic DNA Delivery in Plants: Methods and Protocols; Springer: Berlin/Heidelberg, Germany, 2020; pp. 107–123. [Google Scholar]
  48. Koufan, M.; Belkoura, I.; Mazri, M.A. In vitro propagation of caper (Capparis spinosa L.): A review. Horticulturae 2022, 8, 737. [Google Scholar] [CrossRef]
  49. Nascimento, L.E.S.; Arriola, N.D.A.; da Silva, L.A.L.; Faqueti, L.G.; Sandjo, L.P.; de Araújo, C.E.S.; Biavatti, M.W.; Barcelos-Oliveira, J.L.; Amboni, R.D.M.C. Phytochemical profile of different anatomical parts of jambu (Acmella oleracea (L.) RK Jansen): A comparison between hydroponic and conventional cultivation using PCA and cluster analysis. Food Chem. 2020, 332, 127393. [Google Scholar] [CrossRef] [PubMed]
  50. Zhang, L.; Qu, H.; Liu, X.; Li, Q.; Liu, Y.; Wang, W.; Chen, D.; Xiao, L.; Gu, R. Comparison and selection of probiotic Lactobacillus from the human intestinal tract and traditional fermented food in vitro via PCA, unsupervised clustering algorithm, and heat-map analysis. Food Sci. Nutr. 2022, 10, 4247–4257. [Google Scholar] [CrossRef] [PubMed]
  51. Esan, V.I.; Oke, G.O.; Ogunbode, T.O.; Obisesan, I.A. AMMI and GGE biplot analyses of Bambara groundnut (Vigna ubterranean (L.) Verdc.) for agronomic performances under three environmental conditions. Front. Plant Sci. 2023, 13, 997429. [Google Scholar] [CrossRef]
  52. Fuller, D.Q.; Denham, T.; Allaby, R. Plant domestication and agricultural ecologies. Curr. Biol. 2023, 33, R636–R649. [Google Scholar] [CrossRef]
  53. Mohamed, A.; Aka Kaçar, Y.; Toklu, F.; Dönmez, D.; Erol, M.; Şimşek, Ö.; Biçen, B.; Karaköy, T.; Tlahig, S.; Loumerem, M. Evaluation of the Genetic Relationships of Some Endangered Tunisian Peas Adapted to Arid Regions and Turkish Accessions Revealed by Inter Simple Sequence Repeat (ISSR) Markers. Pol. J. Environ. Stud. 2023, 32, 2251–2260. [Google Scholar] [CrossRef]
  54. Silva, J.C.F.; Teixeira, R.M.; Silva, F.F.; Brommonschenkel, S.H.; Fontes, E.P. Machine learning approaches and their current application in plant molecular biology: A systematic review. Plant Sci. 2019, 284, 37–47. [Google Scholar] [CrossRef]
  55. Hesami, M.; Pepe, M.; Monthony, A.S.; Baiton, A.; Jones, A.M.P. Modeling and optimizing in vitro seed germination of industrial hemp (Cannabis sativa L.). Ind. Crops Prod. 2021, 170, 113753. [Google Scholar] [CrossRef]
  56. Zhang, Q.; Deng, D.; Dai, W.; Li, J.; Jin, X. Optimization of culture conditions for differentiation of melon based on artificial neural network and genetic algorithm. Sci. Rep. 2020, 10, 3524. [Google Scholar] [CrossRef]
  57. Wei, L.; Tian, W.; Silva, E.A.; Choudhary, R.; Meng, Q.; Yang, S. Comparative study on machine learning for urban building energy analysis. Procedia Eng. 2015, 121, 285–292. [Google Scholar] [CrossRef]
  58. Çeli, Ş.; Çaçan, E.; Yaryab, S. Prediction of stem weight in selected alfalfa varieties by artificial neural networks, multivariate adaptive regression splines, and multiple regression analysis. J. Anim. Plant Sci. 2023, 33, 1006–1020. [Google Scholar]
Figure 1. In vitro tissue culture data and modelling process of fodder pea genotypes.
Agronomy 13 02835 g001
Figure 2. Two-dimensional graph obtained because of PCA of fodder peas.
Agronomy 13 02835 g002
Figure 3. Tree diagram and heat map of 42 genotypes for 7 variables obtained using hierarchical cluster analysis.
Agronomy 13 02835 g003
Figure 4. Algorithms’ goodness-of-fit criterion for prediction of regeneration efficiency (RE): mean squared error (MSE), R-square (R2), and mean absolute deviation (MAD).
Agronomy 13 02835 g004
Figure 5. Plot graph of ANN model.
Agronomy 13 02835 g005
Figure 6. The order of importance of the input variables in estimating the RE of the ANN-MLP model.
Agronomy 13 02835 g006
Figure 7. The order of importance of the input variables in estimating the RE of the RF model.
Agronomy 13 02835 g007
Table 1. A total of 42 examined traits of fodder pea genotypes.
GenotypeCI% *
%
ECNEP
%
RECNEP
%
NSE
(Number)
RSE
(Number)
RE
(Number)
NRP
(Number)
Ardahan Merkez-193.75 a–d **82.81 a–f67.19 e–m37.75 c–j37.50 b–i0.00 c0.00 d
Ardahan Merkez-2100.00 a96.88 ab85.94 a–f89.25 a81.250 a0.00 c0.00 d
Ardahan Merkez-384.37 c–i57.81 h–k65.63 e–m25.25 g–n21.00 g.n0.00 c0.00 d
Aşağıcambaz100.00 a73.44 d–h84.38 a–g37.25 d–j32.75 c–j0.03 c0.25 d
Aşağıkırzı78.13 g–j73.44 d–h60.94 f–n47.50 b–e41.25 b–h0.00 c0.00 d
Avcılar90.63 a–g84.38 a–e76.56 a–i96.75 a88.25 a0.02 c0.25 d
Balçeşme76.56 h–j46.88 kl46.88 k–r25.25 g–n20.00 g–n0.00 c0.00 d
Camlıçatak-198.44 ab64.06 g–j35.94 n–r24.50 g–n12.75 j–n0.00 c0.00 d
Camlıçatak-2100.00 a68.75 e–h34.38 o–r27.00 f–n23.00 g–n0.00 c0.00 d
Cayağzı 95.31 a–d26.56 m21.88 r11.75 mn4.00 n0.00 c0.00 d
Ciğdemtepe73.44 ij67.19 e–i26.56 qr23.25 h–n18.75 I–n0.05 c0.25 d
Cumhuriyet78.13 g–j73.44 d–h71.88 b–k8.25 n7.75 k–n0.00 c0.00 d
Değirmencik-1100.00 a89.06 a–d100.00 a48.25 b–e48.25 b–e0.00 c0.00 d
Doğruyol60.94 k56.25 h–k51.56 I–q29.00 e–m20.25 g–n1.61 a15.00 a
Döşeli-193.75 a–d62.50 g–k48.44 k–q19.25 I–n12.75 j–n0.65 b4.25 b–d
Giresun Merkez68.75 jk56.25 h–k50.00 I–q27.25 f–n21.50 g–n0.05 c0.50 d
Görele-1100.00 a96.88 ab98.44 ab34.25 d–l24.25 f–n0.06 c1.00 cd
Incili-179.69 e–j70.31 e–h54.69 h–o39.25 c–i7.25 l–n0.00 c0.00 d
Incili-298.44 ab89.06 a–d76.56 a–j56.75 bc52.00 bc0.00 c0.00 d
Incili-392.19 a–e64.06 g–j79.69 a–h18.25 j–n13.25 j–n0.43 bc5.25 bc
Kartalpınar92.19 a–f73.44 d–h71.88 c–k19.75 I–n14.25 j–n0.04 c0.50 d
Kenarbel85.94 b–i78.13 c–g65.63 e–m39.25 c–i27.25 e–m0.13 c1.25 cd
Koyunpınarı100.0 a82.81 a–f70.31 d–l35.75 d–k29.75 d–k0.00 c0.00 d
Oburcak 87.50 a–h87.50 a–d82.81 a–g40.00 c–h39.00 b–i0.00 c0.00 d
Ovaçevirme-176.56 h–j71.88 d–h67.19 e–m48.25 b–e45.25 b–f0.00 c0.00 d
Ovaçevirme-298.44 ab89.06 a–d53.13 h–p29.25 e–m23.25 g–n0.00 c0.00 d
Ovaçevirme-396.88 a–c96.88 ab96.88 abcd88.00 a85.00 a0.00 c0.00 d
Ovaçevirme-4100.00 a67.19 e–i89.06 a–e14.50 l–n9.00 k–n0.51 bc7.00 b
Ovaçevirme-5100.00 a70.31 e–h76.56 a–j43.75 c–g29.00 d–l0.00 c0.00 d
Paslı100.00 a96.88 ab92.19 a–e49.75 b–d49.25 b–d0.00 c0.00 d
Sayvan67.19 jk56.25 h–k50.00 j–q63.50 b54.75 b0.00 c0.00 d
Selamverdi79.69 f–j35.94 lm28.13 p–r14.25 l–n7.50 l–n0.00 c0.00 d
Senkaya Merkez96.88 a–c59.38 h–k48.44 k–q22.50 h–n22.00 g–n0.15 c1.00 cd
Serhat95.31 a–d93.75 a–c87.50 a–f30.00 e–m24.75 f–n0.04 c0.50 d
Seyitören95.31 a–d79.69 b–g40.63 m–r21.25 h–n6.50 mn0.00 c0.00 d
Subatan100.00 a93.75 a–c92.19 a–e45.50 b–f42.00 b–g0.05 c0.75 cd
Sulakyurt100.00 a65.63 f–j65.63 e–m24.50 g–n20.50 g–n0.05 c0.75 cd
Tahtakıran 100.00 a84.38 a–e82.81 a–g36.75 d–k31.75 c–j0.02 c0.25 d
Tepeköy82.81 d–i51.6 I–k48.44 k–q17.00 k–n7.25 l–n0.00 c0.00 d
Tepeler95.31 a–d64.06 g–j57.81 g–o25.25 g–n19.50 h–n0.17 c1.25 cd
Yamçılı100.00 a100.00 a98.44 a–c29.75 e–m22.25 g–n0.02 c0.25 d
Yolgeçmez96.88 a–c50.00 j–l43.75 l–r32.00 d–l21.00 g–n0.62 b4.00 b–d
Means90.6772.5865.4035.6329.010.111.05
F value7.82 ***11.83 ***7.62 ***11.95 ***10.46 ***4.03 ***3.64 ***
* Callus induction (CI) (%), mean embryogenic callus by the number of explants by percentage (ECNEP) (%), mean responded embryogenic callus by the number of explants by percentage (RECNEP) (%), mean number of somatic embryos (NSE) (number), mean regeneration efficiency (RE), and mean regenerated plant number (NRP), ** Letters of the same notation indicate important items and *** significant at p ≤ 0.001.
Table 2. Principal component analysis of genotypes.
In Vitro TraitsF1F2F3F4F5
CI0.2560.0200.4840.2400.000
ECNEP0.6910.0470.0860.0630.113
RECNEP0.5380.1380.1410.0990.084
RE0.2990.6680.0080.0120.003
NSE0.6090.0990.2420.0340.000
RSE0.6500.1010.2030.0280.002
NRP0.2720.6970.0200.0020.000
Eigen value3.031.881.200.500.31
Percent of Variance43.2326.8817.887.184.43
Cumulative Percentage43.2370.1187.3094.4798.90
Disclaimer/Publisher’s Note: The statements, opinions and data contained in all publications are solely those of the individual author(s) and contributor(s) and not of MDPI and/or the editor(s). MDPI and/or the editor(s) disclaim responsibility for any injury to people or property resulting from any ideas, methods, instructions or products referred to in the content.

