Article

The Differentiations in the Soil Nematode Community in an Agricultural Field after Soil Amendment Using Composted Coffee Waste in Various Concentrations

by
Panagiotis Kekelis
1,2,
Maria D. Argyropoulou
3,
Aphrodite Theofilidou
1,2,
Effimia M. Papatheodorou
4,
Vassilis Aschonitis
2 and
Nikolaos Monokrousos
1,*
1
University Center of International Programmes of Studies, International Hellenic University, 57001 Thessaloniki, Greece
2
Soil and Water Resources Institute, Hellenic Agricultural Organization—Dimitra, 57001 Thessaloniki, Greece
3
Department of Zoology, School of Biology, Aristotle University of Thessaloniki (AUTH), 54124 Thessaloniki, Greece
4
Department of Ecology, School of Biology, Aristotle University of Thessaloniki (AUTH), 54124 Thessaloniki, Greece
*
Author to whom correspondence should be addressed.
Agronomy 2023, 13(11), 2831; https://doi.org/10.3390/agronomy13112831
Submission received: 21 October 2023 / Revised: 12 November 2023 / Accepted: 15 November 2023 / Published: 17 November 2023

Abstract

:
In a field experiment, composted coffee waste (CW) was used as soil amendment at three different rates (2%, 4%, and 8%) in plots cultivated with wheat; the effects on the soil nematode community and plant growth were studied. By sampling twice, i.e., three and six months after the application of treatments (3MAA and 6MAA), the duration of these effects was also evaluated. Treatment using composted coffee waste (CW) led to an increased abundance of all soil nematodes, especially of bacterivores and fungivores, probably via a bottom-up effect of CW on the soil community. The most-affected genera were the enrichment opportunists Panagrolaimus and Rhabditis, which increased after CW addition in a dosage-dependent way at 3MAA, while at 6MAA they were replaced by general opportunists, mainly bacterivorous and fungivorous genera; a nematotoxic effect of CW was also observed in the 6MAA condition. The nematode indices and the metabolic footprint indicated an enriched and vigorous soil three months after CW addition and a lower enrichment status of the soil together with a higher fungal participation in the decomposition pathway six months after treatments. However, in the 6 MAA condition, the soil nutrient values were higher in the CW-treated plots. None of our treatments inhibited or enhanced plant growth.

1. Introduction

The disposal of coffee waste (CW) predominantly involves its placement in trash, ultimately leading to its presence in landfills or its introduction into the sewage system, resulting in the direct release of residues into water bodies [1]. The International Coffee Organization estimated global coffee consumption for 2021/22 to be 175.6 million bags (1 bag equals 60 kg), indicating a 4.2% increase from the 2020/21 figure of 168.5 million bags [2]. Notably, a substantial portion of this waste, approximately 6 million tons annually, originates primarily from coffee shops and domestic production [3].
While there is a considerable volume of organic waste subjected to recycling, disposal rates remain elevated. Therefore, exploring methods to decrease these rates is deemed highly valuable [4]. The interest in utilizing CW has surged in recent years due to its rich content of organic compounds such as fatty acids, lignin, cellulose, hemicellulose, and other polysaccharides [5]. Research has been conducted on its potential use for enhancing soil quality and crop yield [6,7,8]. In terms of CW quantities for soil amendment, comparable amounts to manures and other organic amendments (up to 10 t ha−1) have been employed in open-field conditions [9,10]. Conversely, greenhouse experiments have involved higher application quantities (700 t ha−1) [11,12,13,14,15,16,17].
Concerning the quality of the integrated material, even small amounts of composted CW have been found to enhance essential plant growth nutrients (Mg, Mn, K, and Na). In contrast, the application of fresh CW has been reported to decrease crop yield [18]. Fresh CW application might limit plant growth, due to some kind of toxicity effect [10,17] caused by polyphenols [19], tannin, and caffeine (CFN) [20] or due to the stimulation of microbial growth and consequent competition for soil nitrogen between soil microorganisms and plant roots [21]. However, the problem of plant growth inhibition may be solved by applying lower doses of CW [13], by using composted CW [22], or by mixing CW with other products like wheat straw (high lignocellulosic biomass) [23] or inorganic fertilizers before the application [17].
Most of the above-mentioned experiments aimed to address the effect of CW on crop yield and on the physical and chemical variables of the soil. Also, there are two studies outlining the nematicidal properties against root-knot nematodes of the polyphenol components of either the whole coffee grounds [24] or of coffee silverskin, a by-product of the coffee roasting process [25]. The effects on the soil community and their alterations over time have been largely neglected [21]. There are only two studies linking soil microbial properties with CW application [6,26].
Soil nematodes have been characterized as soil health and quality indicators. They occur at multiple levels of the soil food web; therefore, the study of their community, in terms of trophic types and life strategies, offers a better insight into the structure of the food web and, hence, the nutritional profile of the soil. Additionally, nematological indices further illuminate the successional stage of communities, reflecting soil enrichment and the extent of fungal involvement in decomposition pathways. These indices also serve as indicators of nematodes with high longevity, substantial body size, and heightened sensitivity to environmental disruptions, providing a comprehensive understanding of ecosystem dynamics as Du Preez et al. [27] suggested. Nevertheless, to our knowledge, there is no research on the effects of CW on the whole community of soil nematodes, except the one that was conducted by our research team [28]; briefly, in a pot experiment, fresh CW was used and a significant increase in the beneficial free-living nematode genera was observed after fresh CW application and a reduced abundance of the plant parasitic ones.
In the present study, the results of a new experiment that took place in open-field conditions were presented, where composted CW was used as a soil amendment at different rates. Our aim was to investigate the alterations of the soil nematode community induced by CW application at two time intervals (three and six months after the application). The nematode community was studied in terms of trophic structure, nematode indices, metabolic footprints, genera composition, and diversity. To complete the evaluation of composted CW as a soil amendment, estimations of the crop plant growth were also conducted.

2. Materials and Methods

2.1. Coffee Waste Composting

Coffee waste was collected from various coffee shops in the Thessaloniki region in Greece and put in 5 m3 containers with air circulation, where it was wettened regularly with water for 6 months until it had an earthy odor, brown to brownish-black color, and soil-like texture. The containers had a strainer at the bottom from which excess water could drain.

2.2. Experimental Field Area

The experimental site is part of the experimental farm of Staramaki SCE and is situated within the Kilkis region of Greece, precisely located at coordinates 40°58′47″ N and 22°51′00″ E. The topographical elevation of the broader vicinity spans an altitude range of 100 to 300 m above sea level, and the soil was characterized as loam. Detailed climatic data, including average temperature and total rainfall for the duration of the experiment, are provided in Table S2. This information was obtained from MeteoSearch, an online platform that provides data from the network of automatic meteorological stations of the National Observatory of Athens [29].

2.3. Experimental Design and Sampling

The composted CW was applied to the soil, through surface tillage using a disc harrow, at three different rates (2% w/v (2%); 4% w/v (4%); and 8% w/v (8%)). The concentrations were calculated by considering the soil volume of the first 10 cm, which is the tilling depth, and applying the respective amount of CW expressed as grams of CW per liter of soil. The resulting concentrations were 2 kg/m2 for 2%, 4 kg/m2 for 4%, and 8 kg/m2 for 8%. Each treatment was applied to five replicate 6 m × 6 m plots randomly interspersed within an experimental field cultivated with wheat (Triticum aestivum L.). Control plots were also included in the experimental design [0% w/v (Ctrl)]. Buffer zones of 4 m were maintained between the plots. Treatments took place one month prior to the sowing of wheat. The choice of a one-month interval between soil treatment and wheat sowing was based on previous findings indicating an increase in organic C, total N, and available P in the soil following coffee waste (CW) application [11] and to mitigate any potential phytotoxic effects of CW.
Two soil samplings were conducted: the first occurred three months after application of treatments (3MAA), when the plants were at an early stage of development (Zadoks scale: GS 10–19), and the second occurred six months after application (6MAA), when the plants had reached full maturity (Zadoks scale: GS 80–89). From every replicate plot, five soil samples were taken at random from the upper 15 cm of the soil layer with a core sampler of 3 cm diameter. These samples were mixed together to generate one composite sample. Thus, a total of forty composite soil samples were collected (4 treatments × 5 replicate plots × 2 samplings).
In order to assess the effect of treatments on the growth of wheat plants, the dry, above-ground plant biomass was estimated once, immediately after the second sampling. For this purpose, the above ground parts of all plants were cropped and weighed, within 1 m2 of each replicate plot. Moreover, at this point, soil samples were taken from all plots for estimation of physicochemical parameters (pH, EC, OM%, N%, P, and K).

2.4. Laboratory Methods

2.4.1. Chemical Analysis of Composted Coffee Waste and Soil Samples

Following the completion of the digestion period, a chemical analysis of the coffee waste (CW) was conducted, and the findings are outlined in Table 1. The CW underwent a drying process by being placed in an oven at 75 °C for 48 h. Subsequently, it was transferred to porcelain bowls and subjected to incineration in a furnace at 515 °C for a duration of 5 h. The resulting ash was dissolved using 3 mL of HCl 6 N and then diluted with distilled water until reaching a final volume of 50 mL. The concentrations of total Ca, P, Cu, Zn, K, Mg, Mn, and Na were determined through the ICP method, while total N was assessed using the Kjeldahl method. Total C was determined by placing 2 g of composted CW in 105 °C for 24 h (CWdry) to dry and then placing it at 550 °C (CWash). The Total C percentage was then taken using the following equation:
Total C (%) = 100 × (CWdryCWash)/CWdry.
The soil samples were mechanically crumbled, air-dried, sieved using a 2 mm sieve, and prepared for soil-texture assessment using the Bouyoucos method [30]. Measurements also included total nitrogen determined via the Kjeldahl method, available phosphorus assessed according to the Olsen method [31], exchangeable potassium determined using ammonium acetate at pH = 7.0 [32], organic matter (OM%) evaluated using potassium dichromate, pH measured using the saturation paste method, and electrical conductivity (EC) measured in the water extract of saturated soil.

2.4.2. Nematode Extraction and Identification

Nematodes were harvested from 150 mL of each soil sample, having undergone prior treatment involving manual soil aggregate breakup. The extraction process adhered to Cobb’s sieving and decanting method, with a modification introduced by S’Jacob and van Bezooijen [33], which incorporated a cotton wool filter in the final step. Subsequent to nematode counting, preservation was carried out using 4% formaldehyde. Following this, 100 nematodes were randomly selected from each sample and identified at the genus level using Bongers’ [34] identification key. The nematode genera were then categorized based on trophic classifications according to Yeates et al. [35]. The classification along the colonization-persistence gradient (c–p values) followed the criteria outlined by Bongers [36] and Bongers and Bongers [37]. Concerning nematode functional indices, the Maturity Index (MI) for free-living nematodes and the Plant Parasitic Index (PPI) for plant-feeding nematodes were ascertained. These indices indicate the successional stage of communities, as per Bongers [36]. The calculations for the Enrichment Index (EI), Channel Index (CI), and Structure Index (SI) were performed using the weighted faunal analysis proposed by Ferris et al. [38]. EI and CI reflect soil enrichment and the degree of fungal involvement in the decomposition pathway, respectively. Meanwhile, SI serves as an indicator of nematodes with high longevity, body size, and disruption sensitivity. The metabolic footprint (MF), indicating carbon utilization by nematodes, was calculated based on Ferris [39], representing the sum of lifetime carbon gained and partitioned into growth, egg production, and respiration. The MF is expressed in standardized carbon units per gram of dry soil. The NINJA (Nematode Indicator Joint Analysis) online platform [40] was utilized for the computation of nematode indices and the metabolic footprint.

2.5. Statistical Analyses
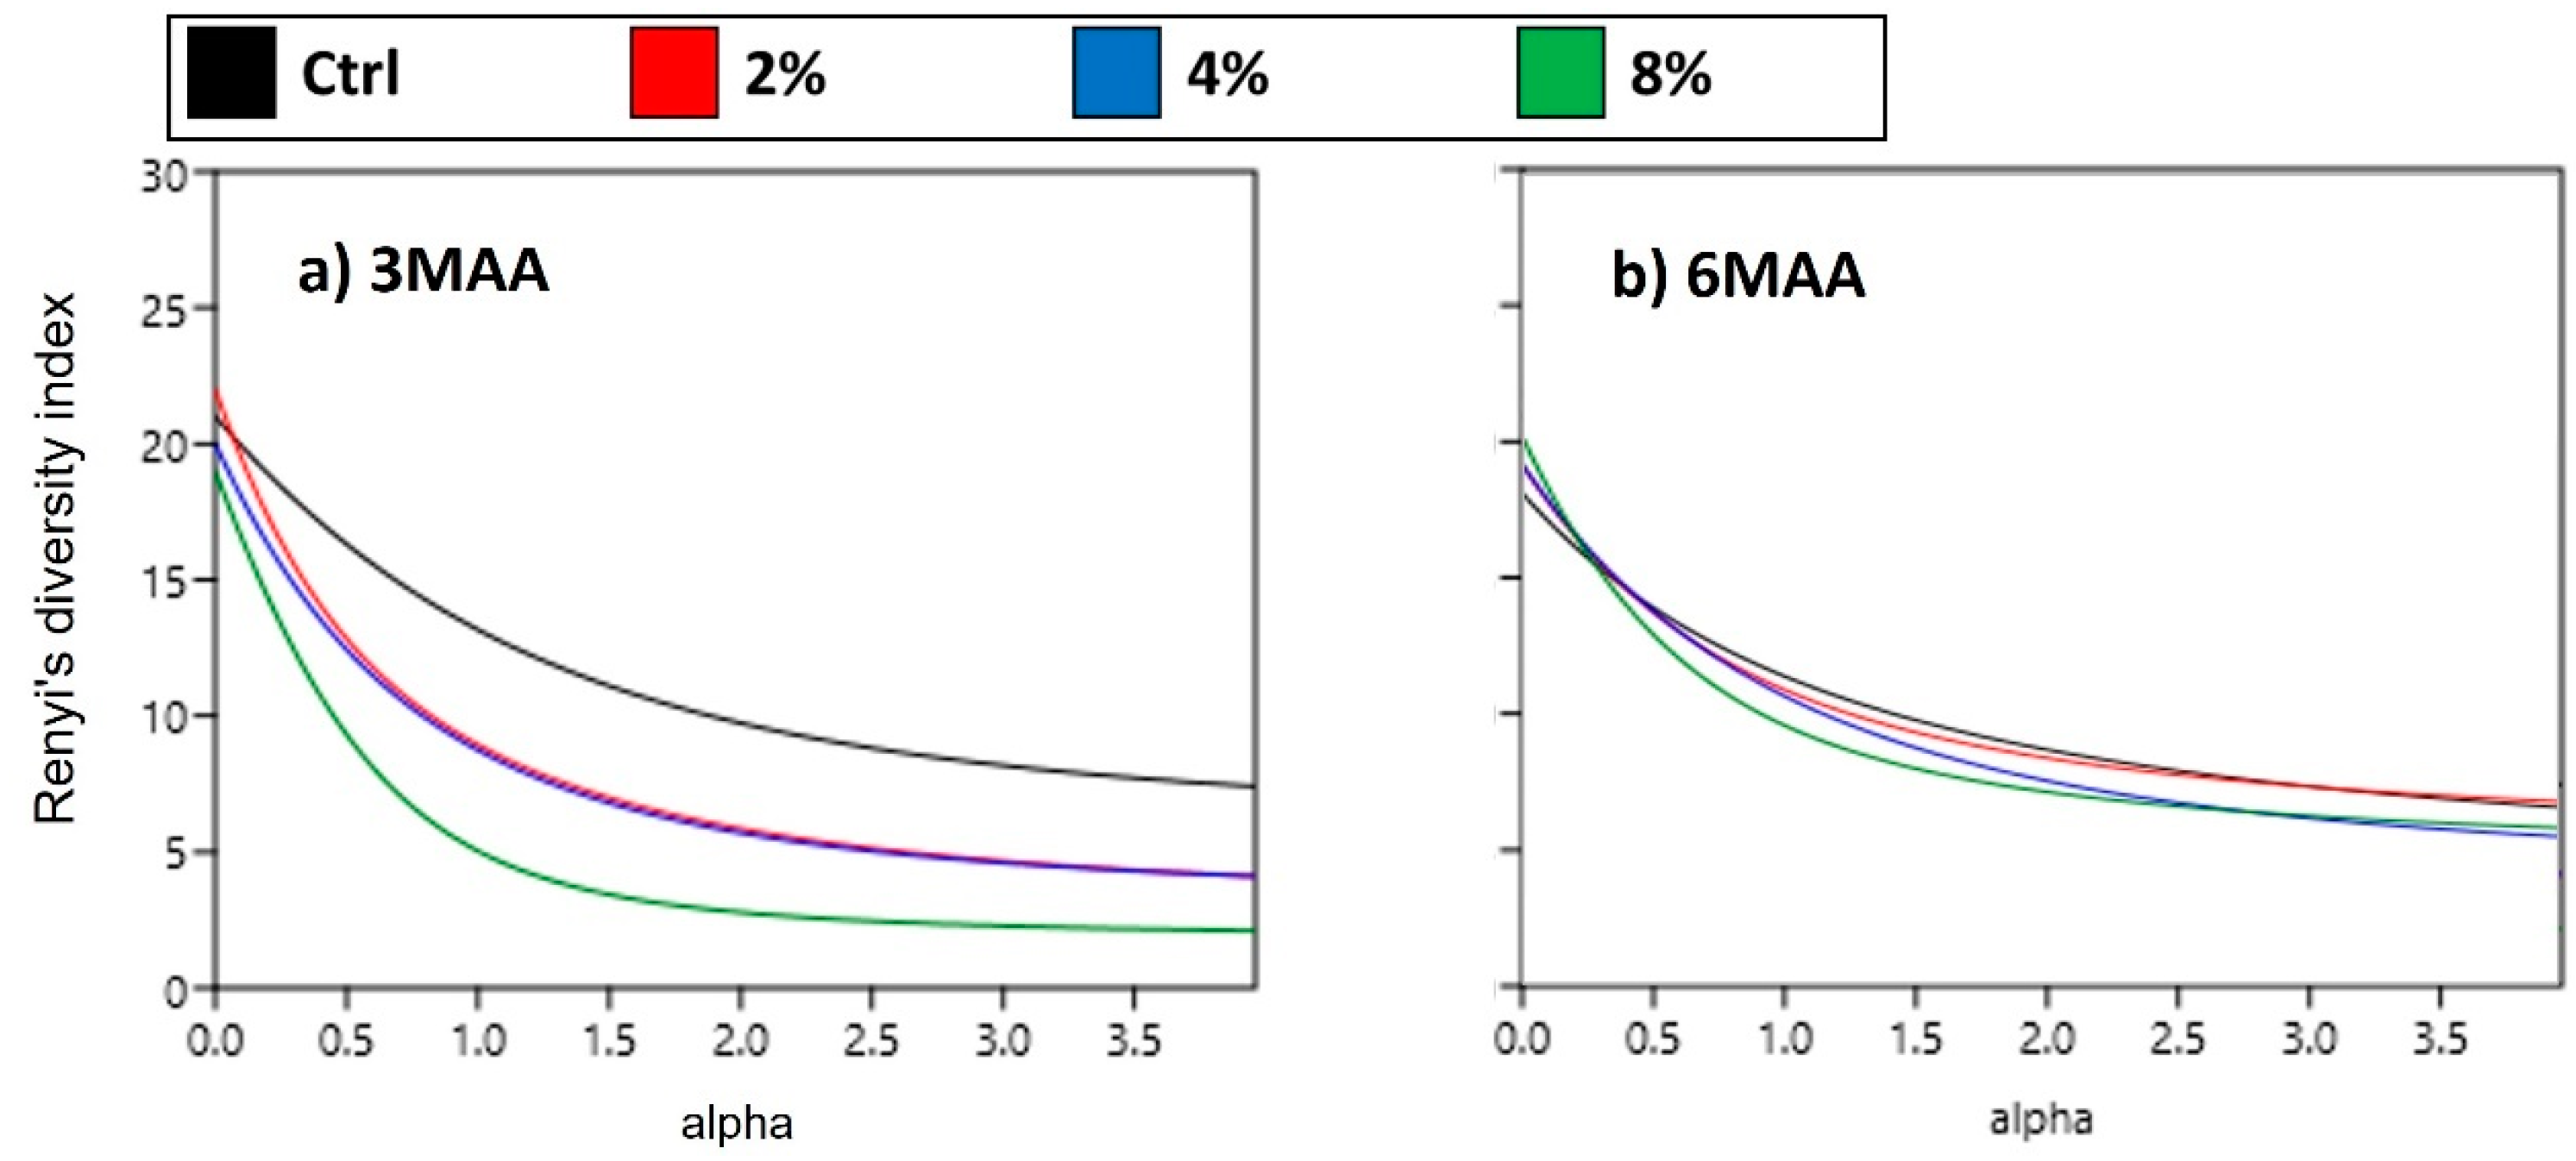
To determine the effect of time and different CW doses, on the community of soil nematodes, a repeated-measures ANOVA was applied to the total nematode abundance, trophic group abundances, nematode indices, and metabolic footprint. The dispersion index based on Taylor [41] (Table S3) was also calculated in order to ensure a more reliable soil nematode analysis and also to detect a possible spatial differentiation [42]. When statistically significant effects were found, post hoc analyses (Fisher LSD test) were performed. In the case of wheat above-ground biomass, in order to test differences due to treatment, a one-way ANOVA was used. Before conducting the analyses, we appropriately transformed the data, if necessary, to fulfill the assumptions of the ANOVA.
To evaluate nematode community diversity, the diversity-ordering approach developed by Patil and Taillie [43] was applied, which relies on Renyi’s index [44]. Renyi’s parametric index with order alpha demonstrates varying sensitivity to both rare and abundant species within a community, depending on the value of the scale parameter alpha [45]. This method provides a comprehensive diversity profile for each community, with specific diversity indices corresponding to different alpha values. When alpha equals 0, the index represents the species count; for alpha equal to 1, it mirrors Shannon’s index, and for alpha equal to 2, it corresponds to Simpson’s index. When alpha tends towards infinity, the index becomes highly responsive to the abundant species within the community. Consequently, disparities in diversity profiles at lower alpha values primarily reflect differences in species numbers, while distinctions at higher alpha values are driven by variations in the presence of abundant species. When diversity profiles intersect, it indicates that the two communities may be ranked differently according to different diversity indices. In our research, nematode genera were substituted for species in this analysis.
To study changes in the genera composition of communities, nonmetric multidimensional scaling (NMDS) was used, where a Bray–Curtis distance similarity matrix was calculated based on the pairwise taxonomic profiles of 40 soil samples and used to generate NMDS coordinates of each sample. The shorter the distance linking two samples the higher the similarity between them.
For the repeated-measures ANOVA, and one-way ANOVA, STATISTICA 9 for windows (StatSoft, Tulsa, OK, USA) was used. Additionally, NMDS analysis, and diversity ordering were performed using Past 3.17 [46].

3. Results

The above-ground biomass of wheat plants after different CW applications is presented in Figure 1. No significant differences were detected either among the different CW treatments or between them and the control.
The total nematode abundance as well as the abundance of nematode trophic groups under different treatments at 3MAA and 6MAA are presented in Figure 2, while the percentage contribution of each trophic group to the total community is presented in Figure S1. Bacterial feeders were the most abundant trophic group accounting for 30.3–80.4% of the total nematode community, followed by fungal feeders (13–49.7%) and herbivores (6.4–18.2%). Low populations of predators and omnivores were recorded and, therefore, these groups were treated together. In most cases, time, CW treatment, and/or their interaction significantly affected the trophic group abundances. More specifically, the total nematode abundance as well as the abundances of the three major trophic groups increased from the first to the second sampling in the control treatment. On the contrary, in the CW treatments, nematode abundance decreased with time after the application of the treatments. Only the abundance of omnivores/predators increased with time in all treatments. All CW treatments enhanced bacterivores, fungivores, and herbivores in the 3MAA sampling. In the second sampling (6MAA), this effect was reversed in the case of herbivores, while in the case of bacterial and fungal feeders it remained only in the 8% treatment. In most cases, the differences between the three CW dosages were discernible but not statistically significant.
The changes in nematode indices and metabolic footprint (MF) due to time and treatment are presented in Table 2; the dispersion index (DI) is presented in Table S3 showing no spatial differentiation of the nematode community (DI < 1). As with abundance, almost all indices were significantly affected by time, CW treatment, and/or their interaction. At 3MAA, the values of the Maturity Index (MI) and the Channel Index (CI) were lower, while those of the Enrichment Index (EI) and the metabolic footprint (MF) were higher, in the CW treatments compared to the control, but at 6MAA the changes due to treatment did not follow any specific pattern. With regard the SI values, they were higher during the second sampling (6MAA). Changes in the PPI were not statistically significant.
The diversity profiles of nematode communities at all treatments in both samplings are presented in Figure 3. In the first sampling (3MAA), the highest diversity was observed in the control plots and the lowest in the 8%-treated ones. The differences between curves fall mainly in the range of high values of the scale parameter alpha. This means that the differences between treatments were not due to the number of nematode genera (indicated at alpha = 0) but mostly due to the presence of dominant genera in the least diverse communities. In the second sampling (6MAA), an overall increase in diversity was observed, while the differences between treatments became less pronounced.
A list of the 36 nematode genera recorded in our samples is provided in Table S1. Among them, fourteen genera were bacterivorous, four were fungivorous, ten were herbivorous, seven were omnivorous, and one was predatory. Apart from the root-hair feeder Malenchus, all the other herbivorous genera were parasitic.
The composition of the nematode community 3MAA and 6MAA under different treatments is given in the form of rank abundance graphs (Figure 4). At 3MAA, a hierarchical structure in the nematode community in the control plots was observed, without any over-dominant genus. In the CW-treated plots, the cp-1 bacterial feeders Panagrolaimus and Rhabditis, which were underrepresented in the control plots, over-dominated the communities. Especially in the 8% treatment, Rhabditis represented more than 50% of the community. At 6MAA, nematode communities had hierarchical structures in all treatments. Panagrolaimus was still present and often among the dominant genera, but no over-dominant pattern was observed for any treatment.
In the NMDS graph of Figure 5, the biggest distance, indicating the biggest differentiation of communities, is between the control and the 4% and 8% CW treatments at 3MAA. At 6MAA, on the other hand, all samples are clustered in the middle of the graph.

4. Discussion

In a field experiment, composted CW was used as a soil amendment at three different rates (2%, 4%, and 8%) in plots cultivated with wheat, and the effects on the soil nematode community and plant growth were studied. By sampling twice, i.e., three and six months after the application of treatments (3MAA and 6MAA), the duration of these effects was also evaluated.
The improvement in soil chemical and physical characteristics after CW addition is well documented, but the toxic effect, especially of fresh CW on plant growth, needs to be considered [47]. Pérez-Burillo et al. [21] reported several cases of fresh CW phytotoxicity in their review, along with cases of plant growth enhancement; the latter occurred when fresh CW concentrations were below 10%. On the other hand, Yamane et al. [10] stated that fresh CW inhibits plant growth only for six months after application, while Horgan et al. [48] suggested that, to avoid inhibiting plant growth or even to promote it, CW needs to be allowed to age for an appropriate period of 8 to 14 months. In our experiment, the CW concentrations were up to 8%, while CW was aged for 6 months before application (composting period). Indeed, none of our treatments inhibited the growth of wheat. However, plant growth enhancement was also not observed, although, at six months, soil nutrient values were higher in CW-treated plots compared to the control (Table S4). Probably, an even higher CW rate should be used, as Bomfim et al. [22] suggested for composted CW (e.g., 15%), or a second supplementing application of CW during our experiment should be considered.
Our results showed that the abundance of all nematode trophic groups increased from the first to the second sampling in the control plots that received no CW. This was due to the growth of the wheat roots that not only gave food to root herbivores but also to microbivorous nematodes, i.e., bacterivores and fungivores. Indeed, plants supply food to soil microbia and consequently to microbivores via their above- and below-ground litter and their root exudates [49,50]. Thus, time per se was expected to lead to a more resourceful rhizosphere environment in the control plots.
The addition of coffee CW resulted in increased nematode abundance, especially bacterivores and fungivores at 3MAA. CW constitutes a rich carbon source for soil microbes, and it is reported that its application enhances plant growth-promoting bacteria [26] and increases microbial respiration [6]. Apparently, the enhancement in soil microflora has led to an increased abundance of microbivores through the soil food chain. These changes in the abundance of microbivores were more intense with increasing CW rates, although the differences between dosages were not always statistically significant at 3MAA. During the second sampling (6MAA), only the 8% CW treatment differed from the rest regarding the abundance of microbivores, especially the fungivores. This indicates a dosage-dependent depletion of organic resources with time, especially the most easily degraded ones. With regard the effect of CW addition on the abundance of herbivores, quite different results were yielded. More specifically, herbivores increased in CW treatments at 3MAA, like the other trophic groups, but at 6MAA they decreased. Our results are in agreement with those of Shoenberger [24] who found that plant parasitic nematodes were enhanced after CW addition but declined later as coffee decomposition proceeded. The initial elevation of the herbivorous nematodes could be attributed to quicker seed sprouting occurring when coffee residues are applied [51]. A reduction in plant-parasitic nematodes six months after fresh CW addition was also found in our previous study [28]. According to Thligene et al. [25], the coffee substances reduced the eggs and juveniles of root-knot nematodes in tomato pots. Two questions are raised, however. The first one is why the nematicidal effects of CW were delayed in our experiment. Possibly, the release of nematotoxic compounds of CW might depend on its degree of degradation. A delayed indirect nematicidal effect of CW, via the soil microflora, offers another possible explanation. Indeed, incorporating organic matter into the soil increases soil microorganisms that may act as nematode parasites or antagonists or may release metabolic by-products, such as toxic proteins, enzymes, and small molecule metabolites, which may be nematicidal [52]. The second question raised is whether the negative CW effects on herbivores hold for the free-living nematodes as well. Indeed, most nematicides, organic or not, have detrimental effects on all soil nematodes, not only on the target ones. However, contrasting effects of organic amendments on the free-living vs. the herbivorous nematodes have often been reported [52,53,54,55,56]. The most probable explanation given is that, apart from their potential nematotoxic properties, organic amendments offer a significant trade-off to microbivorous free-living nematodes by providing food to soil microflora [55]. In our experiment, at 6MAA the abundance of microbivores in the 2% and 4% treatments did not differ from that in the control. This may be partly due to the depletion of resources, as mentioned previously, and partly because of the delayed nematotoxic effects of CW. The microbial trade-off may have offset the CW’s adverse effects to some extent in the 2% and 4% treatments and entirely in the 8% treatment.
The increased abundance of bacterivores on our first sampling (3MAA) was responsible for the observed differences in the Maturity Index (MI), the Enrichment Index (EI), and the Channel Index (CI) between the CW-treated and the control plots. The genera that were favored most by CW were the cp-1 bacterivores Panagrolaimus and Rhabditis. These genera, with short lifecycles and high reproductive potential, mirror the bloom of bacteria more closely than other nematodes and are, therefore, described as enrichment opportunists [57]. The rapid proliferation of these opportunistic genera was reflected in the increase in the EI and the decline in MI and CI values in the CW-treated plots. These values indicate that CW resulted in an enhancement of the bacterial decomposition pathway, which led to an enriched, pre-mature, and more-productive soil [58]. Indeed, microbivorous nematodes are beneficial for the soil because, by feeding on microflora, they excrete nutrients that are in excess of their metabolic needs in mineral or readily mineralizable forms, enhancing soil quality [59,60]. The overdominance of Panagrolaimus and/or Rhabditis was responsible for the decreased diversity observed in CW-treated plots in the first sampling. In the second sampling (6MAA), Rhabditis was not recorded at all, while the abundance of Panagrolaimus was reduced as the cp-2 bacterivorous and fungivorous genera, which are considered general opportunists, became equally prevalent. The changes in the composition of the nematode community might indicate equivalent changes in their food resources. Indeed, alterations in the synthesis of the soil microbial community occur during CW decomposition in soil, which is also influenced by the CW dosage [26]. The different tolerance of nematode genera to nemato-toxic coffee components released during CW degradation might offer an additional explanation. For example, the cp-1 bacterivores that respond positively to eutrophication-induced stress are less tolerant to stress induced by chemicals [27]. Overall, these alterations in the composition of the soil nematode community 6MAA, mainly the reduction in enrichment opportunistic genera, led to a more hierarchical community structure with no patterns of over-dominance and with increased diversity. This indicates a soil with resources that were equally distributed among many nematode genera. Moreover, the high SI values, compared to those at 3MAA, designate a less disturbed environment, where persisters like the cp-4 and cp-5 predators and omnivores may survive. However, the lower EI and higher CI values indicate a lower enrichment status and higher fungal participation in the decomposition pathway. The high CI values recorded 6MAA indicate that mostly recalcitrant CW constituents have remained, favoring fungi and, consequently, fungivores [27].
The NMDS analysis showed that CW addition had a much stronger effect on the composition of the soil nematode community than time. The community in the CW-2% treatment was very dissimilar to that of the control at 3MAA, while in the CW-4% and CW-8% treatments the dissimilarity increased even more. Our previously discussed results showed that the main drivers of this shift in community structure were the microbivorous nematodes, mostly Panagrolaimus and Rhabditis, which increased after CW addition in a dosage-dependent way. At 6MAA, a time effect was evident in the control community, yet not intense, while the CW-treated communities did not differ much from that of the control. The ordination of all samples from 6MAA communities in the middle of the NMDS graph indicates that time per se and CW degradation have mitigated the effects of the initial CW addition. This shift in nematode communities was driven by the reduction in the abundance of microbivorous and herbivorous genera and by the replacement of enrichment opportunists by general opportunists, like the cp-2 bacterivorous and fungivorous genera.

5. Conclusions

Composted coffee waste application fueled the soil food web three months after treatments through a bottom-up effect that led to an increased abundance of all soil nematodes, especially the beneficial ones, decreased MI, and increased EI and MF values. These findings indicate an enriched, pre-mature, and vigorous, soil. The most-affected genera were the enrichment opportunists Panagrolaimus and Rhabditis, which increased after CW addition in a dosage-dependent way at 3MAA, while at 6MAA they were replaced by general opportunists, like the cp-2 bacterivorous and fungivorous genera. Indeed, six months after CW addition, our results indicated a lower enrichment status of the soil and a higher fungal participation in the decomposition pathway, probably due to recalcitrant CW constituents that have remained. Most importantly, smaller numbers of root herbivores were recorded 6MAA, indicating a delayed nematotoxic effect of CW. Thus, composted CW, apart from enhancing soil quality when used as a soil amendment, seems to have some potential in controlling plant parasitic nematodes, but it is just an initial observation requiring deeper and more targeted investigation. Regarding the CW effect on wheat plants, neither inhibition nor enhancement of plant growth was observed. Future research should refine the proper CW amounts, timing of application, and degree of CW decomposition to maximize benefits while avoiding potentially harmful effects on plants.

Supplementary Materials

The following supporting information can be downloaded at: https://www.mdpi.com/article/10.3390/agronomy13112831/s1, Figure S1: Pie charts illustrating the relative abundance of nematode trophic groups in coffee waste (CW) at different rates are presented for two time points: (a) 3 months after application (3MAA); (b) 6 months after application (6MAA) (for all cases n = 5); Table S1: The genera observed in both samplings (3MAA and 6MAA) with their cp values and respective trophic group (3MAA: three months after application; 6MAA: six months after application); Table S2: Mean temperatures and total rainfall for each month throughout the experimental period; Table S3: Mean values (±SE) of the Dispersion Index (DI) were recorded 3 and 6 Months After the Application (MAA) of coffee waste (CW) at different rates. The results of the repeated-measures ANOVA are indicated (ns: p > 0.05) (Fisher’s LSD post hoc test, for all cases n = 5); Table S4: Total concentrations of N, P, K, OM, pH, and EC in the soil samples (means ± SE) of coffee waste (CW) at different rates 6 Months After Application. The results of the one-way ANOVA are denoted (**: p < 0.01; ***: p < 0.001; and ns: p > 0.05), while different letters within each column indicate statistically significant differences between treatments (Fisher’s LSD post hoc test; for all cases n = 5) (N: nitrogen; P: phosphorus; K: potassium; OM: organic matter; and EC: electric conductivity).

Author Contributions

Conceptualization, V.A. and N.M.; methodology, P.K. and N.M.; formal analysis, P.K. and A.T.; investigation, P.K.; data curation, P.K., A.T. and N.M.; writing—original draft preparation, P.K.; writing—review and editing, N.M., E.M.P., V.A. and M.D.A.; supervision, N.M. All authors have read and agreed to the published version of the manuscript.

Funding

This research received no external funding.

Data Availability Statement

The data presented in this study are available upon request from the corresponding author.

Acknowledgments

The authors are grateful to Staramaki SCE for granting their experimental farm and making this open-field experiment possible.

Conflicts of Interest

The authors declare no conflict of interest.

References

  1. Fernandes, A.S.; Mello, F.V.C.; Thode Filho, S.; Carpes, R.M.; Honorio, J.G.; Marques, M.R.C.; Felzenszwalb, I.; Ferraz, E.R.A. Impacts of discarded coffee waste on human and environmental health. Ecotoxicol. Environ. Saf. 2017, 141, 30–36. [Google Scholar] [CrossRef] [PubMed]
  2. International Coffee Organization. World Coffee Consumption. 2022. Available online: http://www.ico.org/prices/newconsumption-table.pdf (accessed on 6 September 2023).
  3. Tokimoto, T.; Kawasaki, N.; Nakamura, T.; Akutagawa, J.; Tanada, S. Removal of lead ions in drinking water by coffee grounds as vegetable biomass. J. Colloid Interface Sci. 2005, 281, 56–61. [Google Scholar] [CrossRef] [PubMed]
  4. Randell, P.; Pickin, J.; Grant, B. Waste Generation and Resource Recovery in Australia: Reporting Period 2010/11; Final Report Prepared for DSEWPC; Blue Environment Pty Ltd.: Docklands, Australia, 2014; Volume 128. [Google Scholar]
  5. Pujol, D.; Liu, C.; Gominho, J.; Olivella, M.À.; Fiol, N.; Villaescusa, I.; Pereira, H. The chemical composition of exhausted coffee waste. Ind. Crops Prod. 2013, 50, 423–429. [Google Scholar] [CrossRef]
  6. Cervera-Mata, A.; Pastoriza, S.; Rufián-Henares, J.Á.; Párraga, J.; Martín-García, J.M.; Delgado, G. Impact of spent coffee grounds as organic amendment on soil fertility and lettuce growth in two Mediterranean agricultural soils. Arch. Agron. Soil Sci. 2018, 64, 790–804. [Google Scholar] [CrossRef]
  7. Cervera-Mata, A.; Martín-García, J.; Delgado, R.; Sánchez-Marañón, M.; Delgado, G. Short-term effects of spent coffee grounds on the physical properties of two Mediterranean agricultural soils. Int. Agrophysics 2019, 33, 205–216. [Google Scholar] [CrossRef]
  8. Afriliana, A.; Hidayat, E.; Yoshiharu, M.; Taizo, M.; Harada, H. Evaluation of Potency Spent Coffee Grounds for Make Black Compost. In E3S Web of Conferences, Proceedings of the 3rd International Conference on Agricultural and Life Sciences (ICALS 2019), Jember, Indonesia, 31 July–2 August 2019; EDP Sciences: Les Ulis, France, 2020; Volume 142, p. 04002. [Google Scholar]
  9. Morikawa, C.K.; Saigusa, M. Recycling coffee grounds and tea leaf wastes to improve the yield and mineral content of grains of paddy rice. J. Sci. Food Agric. 2011, 91, 2108–2111. [Google Scholar] [CrossRef]
  10. Yamane, K.; Kono, M.; Fukunaga, T.; Iwai, K.; Sekine, R.; Watanabe, Y.; Iijima, M. Field evaluation of coffee grounds application for crop growth enhancement, weed control, and soil improvement. Plant Prod. Sci. 2014, 17, 93–102. [Google Scholar] [CrossRef]
  11. Kasongo, R.K.; Verdoodt, A.; Kanyankagote, P.; Baert, G.; van Ranst, E. Coffee waste as an alternative fertilizer with soil improving properties for sandy soils in humid tropical environments. Soil Use Manag. 2010, 27, 94–102. [Google Scholar] [CrossRef]
  12. Kasongo, R.K.; Verdoodt, A.; Kanyankogote, P.; Baert, G.; Van Ranst, E. Response of Italian ryegrass (Lolium multiflorum Lam.) to coffee waste application on a humid tropical sandy soil. Soil Use Manag. 2013, 29, 22–29. [Google Scholar] [CrossRef]
  13. Cruz, R.; Baptista, P.; Cunha, S.; Pereira, J.A.; Casal, S. Carotenoids of lettuce (Lactuca sativa L.) grown on soil enriched with spent coffee grounds. Molecules 2012, 17, 1535–1547. [Google Scholar] [CrossRef]
  14. Cruz, R.; Gomes, T.; Ferreira, A.; Mendes, E.; Baptista, P.; Cunha, S.; Pereira, J.A.; Ramalhosa, E.; Casal, S. Antioxidant activity and bioactive compounds of lettuce improved by espresso coffee residues. Food Chem. 2014, 145, 95–101. [Google Scholar] [CrossRef] [PubMed]
  15. Cruz, R.; Morais, S.; Mendes, E.; Pereira, J.A.; Baptista, P.; Casal, S. Improvement of vegetables elemental quality by espresso coffee residues. Food Chem. 2014, 148, 294–299. [Google Scholar] [CrossRef] [PubMed]
  16. Cruz, R.; Mendes, E.; Torrinha, Á.; Morais, S.; Pereira, J.A.; Baptista, P.; Casal, S. Revalorization of spent coffee residues by a direct agronomic approach. Food Res. Int. 2015, 73, 190–196. [Google Scholar] [CrossRef]
  17. Hardgrove, S.J.; Livesley, S.J. Applying spent coffee grounds directly to urban agriculture soils greatly reduces plant growth. Urban For. Urban Green. 2016, 18, 1–8. [Google Scholar] [CrossRef]
  18. Cervera-Mata, A.; Navarro-Alarcón, M.; Rufián-Henares, J.Á.; Pastoriza, S.; Montilla-Gómez, J.; Delgado, G. Phytotoxicity and chelating capacity of spent coffee grounds: Two contrasting faces in its use as soil organic amendment. Sci. Total Environ. 2020, 717, 137247. [Google Scholar] [CrossRef]
  19. Santos, C.; Fonseca, J.; Aires, A.; Coutinho, J.; Trindade, H. Effect of different rates of spent coffee grounds (SCG) on composting process, gaseous emissions and quality of end-product. Waste Manag. 2017, 59, 37–47. [Google Scholar] [CrossRef]
  20. Dafouz, R.; Cáceres, N.; Rodríguez-Gil, J.L.; Mastroianni, N.; de Alda, M.L.; Barceló, D.; de Miguel, Á.G.; Valcárcel, Y. Does the presence of caffeine in the marine environment represent an environmental risk? A regional and global study. Sci. Total Environ. 2018, 615, 632–642. [Google Scholar] [CrossRef]
  21. Pérez-Burillo, S.; Cervera-Mata, A.; Fernández-Arteaga, A.; Pastoriza, S.; Rufián-Henares, J.Á.; Delgado, G. Why Should We Be Concerned with the Use of Spent Coffee Grounds as an Organic Amendment of Soils? A Narrative Review. Agronomy 2022, 12, 2771. [Google Scholar] [CrossRef]
  22. de Bomfim, A.S.C.; de Oliveira, D.M.; Walling, E.; Babin, A.; Hersant, G.; Vaneeckhaute, C.; Dumont, M.-J.; Rodrigue, D. Spent Coffee Grounds Characterization and Reuse in Composting and Soil Amendment. Waste 2023, 1, 2–20. [Google Scholar] [CrossRef]
  23. Wakasawa, H.; Takahashi, K.; Mochizuki, K. Application and composting conditions of coffee grounds, 1: Application of coffee grounds in soil. Jpn. J. Soil Sci. Plant Nutr. 1998, 69, 1–6. [Google Scholar]
  24. Shoenberger, E. Effect of Coffee Grounds on the Soil Nematode Population of Meloidogyne Hapla under Greenhouse Conditions. ECHOcommunity, Resources, Research-Posters. 2018. Available online: http://edn.link/gxhdzj (accessed on 20 October 2023).
  25. Thligene, N.; Mezzapesa, G.N.; Mondelli, D.; Trani, A.; Veronico, P.; Melillo, M.T.; Dumontet, S.; Miano, T.; Sasanelli, N. Effect of Coffee Silver Skin and Brewers’ Spent Grain in the Control of Root-Knot Nematodes. Helminthologia 2019, 56, 30–41. [Google Scholar] [CrossRef] [PubMed]
  26. Vela-Cano, M.; Cervera-Mata, A.; Purswani, J.; Pozo, C.; Delgado, G.; González-López, J. Bacterial community structure of two Mediterranean agricultural soils amended with spent coffee grounds. Appl. Soil Ecol. 2019, 137, 12–20. [Google Scholar] [CrossRef]
  27. Du Preez, G.; Daneel, M.; De Goede, R.; Du Toit, M.J.; Ferris, H.; Fourie, H.; Geisen, S.; Kakouli-Duarte, T.; Korthals, G.; Sánchez-Moreno, S.; et al. Nematode-based indices in soil ecology: Application, utility, and future directions. Soil Biol. Biochem. 2022, 169, 108640. [Google Scholar] [CrossRef]
  28. Kekelis, P.; Papatheodorou, E.M.; Terpsidou, E.; Dimou, M.; Aschonitis, V.; Monokrousos, N. The Free-Living Nematodes as Indicators of the Soil Quality in Relation to the Clay Content, When Coffee Waste Is Applied. Agronomy 2022, 12, 2702. [Google Scholar] [CrossRef]
  29. Available online: https://meteosearch.meteo.gr/data/list-station-files720.cfm (accessed on 7 November 2023).
  30. Gee, G.W.; Bauder, J.W. Particle-size analysis. In Methods of Soil Analysis; Klute, A., Ed.; SSSA: Madison, WI, USA, 1986; pp. 383–411. [Google Scholar]
  31. Watanabe, F.S.; Olsen, S.R. Test of an ascorbic acid method for determining phosphorus in water and NaHCO3 extracts from soil. Soil Sci. Soc. Am. J. 1965, 29, 677–678. [Google Scholar] [CrossRef]
  32. Thomas, G.W. Exchangeable Cations. In Methods of Soil Analysis Part-2 Chemical and Mineralogical Properties; Page, A.L., Ed.; ASA: Schaumburg, IL, USA; SSSA: Madison, WI, USA, 1982; pp. 159–165. [Google Scholar]
  33. S’Jacob, J.J.; Van Bezooijen, J. Manual for Practical Work in Nematology; Landbouwhogeschool: Wageningen, The Netherlands, 1984; pp. 40–70. [Google Scholar]
  34. Bongers, T. Systematisch gedeelte. In De Nematoden van Nederland: Vormgeving en Technische Realisatie, 2nd ed.; Uitgeverij Pirola: Schoorl, The Netherlands, 1994; pp. 67–383. [Google Scholar]
  35. Yeates, G.W.; Bongers, T.D.; De Goede, R.G.M.; Freckman, D.W.; Georgieva, S.S. Feeding habits in soil nematode families and genera-an outline for soil ecologists. J. Nematol. 1993, 25, 315–331. [Google Scholar]
  36. Bongers, T. The maturity index: An ecological measure of environmental disturbance based on nematode species composition. Oecologia 1990, 83, 14–19. [Google Scholar] [CrossRef]
  37. Bongers, T.; Bongers, M. Functional diversity of nematodes. Appl. Soil Ecol. 1998, 10, 239–251. [Google Scholar] [CrossRef]
  38. Ferris, H.; Bongers, T.; de Goede, R.G. A framework for soil food web diagnostics: Extension of the nematode faunal analysis concept. Appl. Soil Ecol. 2001, 18, 13–29. [Google Scholar] [CrossRef]
  39. Ferris, H. Form and function: Metabolic footprints of nematodes in the soil food web. Eur. J. Soil Biol. 2010, 46, 97–104. [Google Scholar] [CrossRef]
  40. Sieriebriennikov, B.; Ferris, H.; de Goede, R.G. NINJA: An automated calculation system for nematode-based biological monitoring. Eur. J. Soil Biol. 2014, 61, 90–93. [Google Scholar] [CrossRef]
  41. Taylor, R.A.J. Taylor’s Power Law: Order and Pattern in Nature; Academic Press: Cambridge, MA, USA, 2019. [Google Scholar]
  42. Abd-Elgawad, M.M.M. Optimizing sampling and extraction methods for plant-parasitic and entomopathogenic nematodes. Plants 2021, 10, 629. [Google Scholar] [CrossRef]
  43. Patil, G.; Taillie, C. An overview of diversity. In Ecological Diversity in Theory and Practice; Grassle, J., Patil, G., Smith, W., Taillie, C., Eds.; International Cooperative Publishing House: Fairland, ML, USA, 1979. [Google Scholar]
  44. Rényi, A. On measures of entropy and information. In Proceedings of the Fourth Berkeley Symposium on Mathematical Statistics and Probability, Volume 1: Contributions to the Theory of Statistics, Berkley, CA, USA, 20 June–30 July 1961; pp. 547–562. [Google Scholar]
  45. Ricotta, C. From theoretical ecology to statistical physics and back: Self-similar landscape metrics as a synthesis of ecological diversity and geometrical complexity. Ecol. Modell. 2000, 125, 245–253. [Google Scholar] [CrossRef]
  46. Hammer, O.; Harper, A.; Ryan, P. PAST: Paleontological statistics software package for education and data analysis. Palaeontol. Electron. 2001, 4, 1–9. Available online: https://palaeo-electronica.org/2001_1/past/past.pdf (accessed on 3 August 2023).
  47. Perța-Crișan, S.; Ursachi, C.; Munteanu, F.D. Trends in valorisation of spent cofee grounds: A review. Sci. Tech. Bull. Ser. Chem. Food Sci. Eng. 2019, 16, 31–42. [Google Scholar]
  48. Horgan, F.G.; Floyd, D.; Mundaca, E.A.; Crisol-Martínez, E. Spent Coffee Grounds Applied as a Top-Dressing or Incorporated into the Soil Can Improve Plant Growth While Reducing Slug Herbivory. Agriculture 2023, 13, 257. [Google Scholar] [CrossRef]
  49. Zhi, D.; Li, H.; Nan, W. Nematode communities in the artificially vegetated belt with or without irrigation in the Tengger Desert, China. Eur. J. Soil Biol. 2008, 44, 238–246. [Google Scholar] [CrossRef]
  50. Sylvain, Z.A.; Wall, D.H. Linking soil biodiversity and vegetation: Implications for a changing planet. Am. J. Bot. 2011, 98, 517–527. [Google Scholar] [CrossRef]
  51. Gammoudi, N.; Nagaz, K.; Ferchichi, A. Potential Use of Spent Coffee Grounds and Spent Tea Leaves Extracts in Priming Treatment to Promote In Vitro Early Growth of Salt-and Drought-Stressed Seedlings of Capsicum annuum L. Waste Biomass Valorization 2020, 12, 3341–3353. [Google Scholar] [CrossRef]
  52. Akhtar, M.; Malik, A. Roles of organic soil amendments and soil organisms in the biological control of plant-parasitic nematodes: A review. Bioresour. Technol. 2000, 74, 35–47. [Google Scholar] [CrossRef]
  53. Boutsis, G.; Stamou, G.; Argyropoulou, M. Short term effects of soil disinfection with metham sodium and organic alternatives on nematode communities. Community Ecol. 2011, 12, 161–170. [Google Scholar] [CrossRef]
  54. Monokrousos, N.; Argyropoulou, M.D.; Tzani, K.; Menkissoglou-Spiroudi, U.; Boutsis, G.; D’Addabbo, T.; Ntalli, N. The Effect of Botanicals with Nematicidal Activity on the Structural and Functional Characteristics of the Soil Nematode Community. Agriculture 2021, 11, 326. [Google Scholar] [CrossRef]
  55. Argyropoulou, M.D.; Karmezi, M.; Tsiafouli, M.; Chalkos, D.; Bountla, A.; Vokou, D. Soil Amendments with Spearmint, Peppermint and Rosemary Enhance the Community of Free-Living Nematodes and Improve Soil Quality, While Having Strikingly Different Effects on Plant Growth. Life 2022, 12, 1121. [Google Scholar] [CrossRef] [PubMed]
  56. Theofilidou, A.; Argyropoulou, M.D.; Ntalli, N.; Kekelis, P.; Mourouzidou, S.; Zafeiriou, I.; Tsiropoulos, N.G.; Monokrousos, N. Assessing the Role of Melia azedarach Botanical Nematicide in Enhancing the Structure of the Free-Living Nematode Community. Soil Syst. 2023, 7, 80. [Google Scholar] [CrossRef]
  57. Ferris, H.; Bongers, T. Nematode indicators of organic enrichment. J. Nematol. 2006, 38, 3. [Google Scholar]
  58. Neher, D.A.; Olson, R.K. Nematode communities in soils of four farm cropping management systems. Pedobiologia 1999, 43, 430–438. [Google Scholar]
  59. Ferris, H.; Griffiths, B.S.; Porazinska, D.L.; Powers, T.O.; Wang, K.H.; Tenuta, M. Reflections on plant and soil nematode ecology: Past, present and future. J. Nematol. 2012, 44, 115–126. [Google Scholar]
  60. Gebremikael, M.T.; Steel, H.; Buchan, D.; Bert, W.; De Neve, S. Nematodes enhance plant growth and nutrient uptake under C and N-rich conditions. Sci. Rep. 2016, 6, 32862. [Google Scholar] [CrossRef]
Figure 1. Mean dry biomass of wheat (gr/m2) that was recorded six months after the application (6MAA) of composted coffee waste (CW) at different rates (2%, 4%, and 8%). The result of the one-way ANOVA is indicated on the graph (ns: non-significant; for all cases n = 5).
Agronomy 13 02831 g001
Figure 2. Mean abundance (±SE) of nematode trophic groups ((a): Total Nematodes’ Abundance; (b): Bacterivores’ Abundance; (c): Fungivores’ Abundance; (d): Herbivores’ Abundance; (e): Omnivores/Predators’ Abundance) recorded 3 and 6 Months After Application (MAA) of coffee waste (CW) at different rates. The results of the repeated-measures ANOVA are indicated on each graph (*: p < 0.05; **: p < 0.01; ***: p < 0.001; and ns: p > 0.05), while different letters above columns correspond to statistically significant differences between treatments (Fisher’s LSD post hoc test, for all cases n = 5).
Agronomy 13 02831 g002
Figure 3. Diversity profiles of nematode communities 3 and 6 Months After Application (MAA) of coffee waste (CW) at different rates. For alpha = 0, 1, and 2, the Renyi’s index equals the number of genera, Shannon index, and Simpson index, respectively.
Agronomy 13 02831 g003
Figure 4. Rank abundance graphs for the different treatments 3MAA (a) and 6MAA (b) (CW: composted coffee waste; MAA: months after application). Nematode genera are ranked from the most to the least abundant. The numbers above bars indicate the c–p value of each genus. For all cases n = 5.
Agronomy 13 02831 g004
Figure 5. A nonmetric multidimensional scaling (NMDS) plot showing changes in the genera composition of nematode communities due to time and treatment (CW: composted coffee waste; MAA: months after application). The shorter the distance linking two samples the higher the similarity between them. Different colors and symbols stand for different treatments and samplings, respectively. The central symbol of each polygon is the mean value.
Agronomy 13 02831 g005
Table 1. Chemical analysis of the composted coffee waste (means ± SE, for all cases n = 5).
Variable Variable
pH7.20 ± 0.9Mg (mg/g)1.60 ± 0.1
C (%)45.00 ± 2.1Ca (mg/g)2.00 ± 0.2
N (%)2.98 ± 0.2Na (mg/g)0.80 ± 0.0
C/N15.10 ± 1.1Mn (ppm)0.06 ± 0.0
K (mg/g)3.80 ± 0.4Cu (ppm)0.03 ± 0.0
P (mg/g)11.10 ± 1.9Zn (ppm)0.02 ± 0.0
Table 2. Mean values (±SE) of the Maturity Index (MI), Channel Index (CI), Enrichment Index (EI), Structure Index (SI), Plant Parasitic Index (PPI), and metabolic footprint (MF) recorded 3 and 6 Months After Application (MAA) of coffee waste (CW) at different rates. The results of the repeated-measures ANOVA are indicated (*: p < 0.05; **: p < 0.01; ***: p < 0.001; and ns: p > 0.05), while different letters within each column indicate statistically significant differences between treatments (Fisher’s LSD post hoc test; for all cases n = 5).
TimeTreatmentMICIEISIPPIMF
3MAAControl2.0 ± 0.0 b67.7 ± 11.3 ab51.4 ± 3.7 c16.0 ± 6.1 b3.0 ± 0.223.0 ± 5.5 c
CW-2%1.7 ± 0.1 c30.1 ± 8.1 cd71.7 ± 6.3 b11.8 ± 4.1 b2.9 ± 0.1749.5 ± 109.1 bc
CW-4%1.5 ± 0.1 d9.6 ± 1.4 d88.7 ± 1.7 a25.0 ± 8.7 b2.0 ± 1.21206.1 ± 48.4 ab
CW-8%1.4 ± 0.1 d8.1 ± 2.4 d89.0 ± 3.6 a13.8 ± 4.5 b2.5 ± 1.42185.8 ± 1020.8 a
6MAAControl1.9 ± 0.1 bc36.8 ± 6.1 c63.3 ± 4.2 bc23.5 ± 6.2 b2.9 ± 0.168.9 ± 5.3 c
CW-2%2.3 ± 0.0 a73.4 ± 4.5 a37.0 ± 2.7 d41.4 ± 2.9 a2.9 ± 0.172.8 ± 3.5 c
CW-4%1.8 ± 0.0 bc28.6 ± 5.7 cd69.3 ± 3.5 b26.1 ± 5.4 b3.0 ± 1.155.3 ± 4.9 c
CW-8%1.9 ± 0.1 bc46.4 ± 15.2 bc59.7 ± 7.0 bc17.7 ± 4.0 b3.0 ± 0.1126.1 ± 30.0 c
effectTreatment*********nsns*
Time*********ns**
Tr*Time********ns*
Disclaimer/Publisher’s Note: The statements, opinions and data contained in all publications are solely those of the individual author(s) and contributor(s) and not of MDPI and/or the editor(s). MDPI and/or the editor(s) disclaim responsibility for any injury to people or property resulting from any ideas, methods, instructions or products referred to in the content.

