
Fourfold Increase in Climate Contributions to Grassland Soil Organic Carbon Variabilities and Its Policy Implications

1
Institute of Agricultural Resources and Regional Planning, Chinese Academy of Agricultural Sciences, Beijing 100081, China
2
School of Resources and Environment, Qingdao Agricultural University, Qingdao 266109, China
3
Department Geology, Ghent University, 9000 Gent, Belgium
*
Authors to whom correspondence should be addressed.
Agronomy 2023, 13(10), 2664; https://doi.org/10.3390/agronomy13102664
Submission received: 28 September 2023
/
Revised: 18 October 2023
/
Accepted: 19 October 2023
/
Published: 23 October 2023
(This article belongs to the Special Issue The Impacts of Climate Change and Human Activities on the Structure and Function of Grassland Ecosystems)
Abstract
:Grassland is one of the largest terrestrial ecosystems and contains approximately 20 percent of the world’s soil organic carbon (SOC) stock. A relatively small SOC change can cause large impacts on the global climate. However, the contributions from climatic factors to SOC changes, relative to other natural and anthropogenic factors, remains controversial. Here, we evaluate the relative contributions of climate, landscape, and management factors to SOC variabilities using variance decomposition coupled with generalized additive models and resampled soil data from the original Second National Soil Survey profile locations across the temperate grasslands in northern Inner Mongolia in 2022. Our results indicate that climate contributions increased from 13.7% in the 1980s to 65.5% in 2022, compared to decreased contributions from landscape and management factors. The relative contributions from landscape and management factors decreased from 37.5% and 48.8% in the 1980s, respectively, to 19.2% and 15.4% in 2022. This shows that the climate has shifted from being a minor contributor to a primary controller of grassland SOC variability over the 40 years since the 1980s. We, therefore, argue that future grassland management and policy regimes should become climate-centric, while the current institutional momentum for grassland conservation and restoration should be maintained.

1. Introduction
Soil stores the most carbon (C) in terrestrial ecosystems. The global soil organic C (SOC) storage is estimated as 1550 Pg [1], which is equivalent to 3.3 times the C in the atmosphere (760 Pg) or 4.5 times the C in the living biomass (560 Pg). A relatively small SOC content change can cause large impacts on the atmospheric C dioxide concentrations and, further, on the global climate through the greenhouse effect [2]. As a critical component of the soils, SOC also plays a major role in regulating soil health and other ecosystem services such as biodiversity conservation and food production [3]. Therefore, a clear understanding of the spatiotemporal SOC changes and their driving forces has great importance for C cycling and food security on a global scale [4]. As one of the largest terrestrial ecosystems, grassland accounts for 40.5% of the Earth’s land surface and accommodates an estimated SOC pool of 245 Pg [5], thus playing a vital role in climate change regulation and mitigation.
The characterization and quantification of the SOC trend over a relatively large time interval have received extensive attention in recent years in recognizing the soil’s C sequestration and food security potentials against global warming [1,6,7]. Assessments in China indicate that the SOC storage in the 0–20 cm soil layer in terrestrial ecosystems increased by 3.0 ± 1.7 Pg over the 30 years since the 1980s [8]. Reflected in agriculture and forest soils, estimates suggest that the SOC content increases in the surface layer, ranging between 0.65 g kg−1 and 5.56 g kg−1 [9,10]. However, whether the grasslands in China are losing or gaining soil C remains an open question to debate. According to Xie et al. [11], there were large SOC losses from China’s grasslands at an estimated rate of −178.2 Tg C year−1 during the 1980–2000 period. Using a dual-episode dataset, Xin et al. [12] also suggested that 6.8% of soil C was lost from the grasslands of Inner Mongolia between 1963 and 2007. In contrast, according to the results of Dai et al. [13], a decreasing trend in soil C was not detected in the northern grasslands of China; instead, these grasslands gained soil C between the 1980s and 2010s, despite this being by a small margin (~0.12 Pg).
The spatiotemporal dynamics of SOC in terrestrial ecosystems simultaneously involve multiple factors. Recent research suggests that SOC changes are largely driven by climate (e.g., temperature and precipitation), soil (e.g., texture and moisture content), landscape (e.g., elevation and slope), vegetation, land use, and management practices [14,15,16]. For instance, a significant association between SOC and the landscape context—notably, the slope gradient and aspect ratio—was reported in temperate grasslands [17] and other pastures [18]. Higher SOC levels were also found at higher slope gradients [19]. In addition, evidence from multiple types of grassland shows that human-activity-induced overgrazing and grassland conversion lead to significant SOC losses [20,21]. While the individual SOC driving factors have received much attention recently, much less attention has been paid to SOC dynamic modeling involving multiple factors; systematic studies linking SOC dynamics to both natural and anthropogenic factors are still lacking, especially at the regional scale. Moreover, views over the relative contributions from these factors for driving SOC changes remain controversial. Some researchers suggest that the grassland SOC change is primarily driven by climate change [12], while others argue that anthropogenic factors exert greater influences on SOC. Efforts focusing on SOC driving factors’ relative contributions are still scarce in the current literature.
The search for a meaningful index of the relative contributions from predictor variables in a model has been going on for a long time [22]. To determine the relative contributions, researchers are used to the standardized regression coefficients, the square of which sums to the model’s coefficient of determination (R2) when predictors are uncorrelated. So, the relative contribution from each predictor is proportional to the predictable variance of the response variable [23]. However, in the presence of multicollinearity, squared standardized regression coefficients do not sum to R2 and take on very different meanings. A series of statistically viable and computationally cost-effective approaches [16,24,25] have been proposed in recent years to evaluate the predictor’s relative contribution under multicollinearity, such as multivariate regression trees, random forest, variance partitioning analysis, and the LMG method. These approaches have been used in applications in many parts of the world, ranging from determining the environmental control of plant community structure in central Amazonia [15] to comparing agronomic traits affecting rice yield formation in saline-sodic northeastern Asian environments, and from exploring urban expansion drivers [26] to comparing the roles of plant root and microbial community in regulating soil microbial necromass C accumulation [16].
Models capable of simulating SOC changes have been developed for decades. The latest machine-learning algorithms, such as artificial neural networks and random forests, have also been more and more frequently applied to SOC assessments. Nevertheless, the traditional multiple regression models remain superior in cost-effectiveness and interpretability and still are competent in modeling SOC changes against biotic/abiotic drivers. Here, we evaluate the environmental and anthropogenic factors’ relative contributions for driving SOC changes in the Hulunber grasslands of northern Inner Mongolia, using resampled soil data in 2022 from the original sampling locations of the Second National Soil Survey (NSS2) of the 1980s. The grasslands of Hulunber are a typical representation of the grassland ecosystems in northern China and, more broadly, of the eastern Eurasian Steppe. We hypothesize that SOC variabilities are simultaneously driven by three categories of factors including climate, landscape context, and management practices. Specifically, the objectives of this paper are to: (1) characterize the temporal trend of grassland SOC in Hulunber over the 40 years since the 1980s; (2) develop statistical SOC models by explicitly considering the nonlinear effects of SOC driving factors; and (3) evaluate these factors’ relative contributions to model-accountable SOC variabilities. The findings obtained here can help settle the dispute over the long-term SOC trend in temperate grasslands and shed light on the shifting roles of SOC driving factors in forging the spatial patterns of grassland SOC.
2. Materials and Methods
2.1. Study Area
The research was conducted in Hulunber in northern Inner Mongolia, China (Figure 1). As part of the Eurasian Steppe, Hulunber is located on the major passageway of the Siberian winter monsoon into China. The whole region occupies an area of 2.5 × 10⁵ km2, 29% of which is covered by grassland. A temperate continental monsoon climate prevails in the region. The mean annual temperature (MAT) varies between −3 °C and 3 °C. The accumulative temperature accounts for 1700–2300 degree-days, corresponding to a frost-free period of 85–155 days. Daily annual sunshine duration averages 7.7 h, while the mean annual precipitation (MAP) ranges between 250 and 350 mm. The annual mean potential evapotranspiration (PET) varies from 1050 mm to 1780 mm. The regional dominant soils include Kastanozems, Solonchaks, and Gleysols. Although Hulunber has seen variable changes in grassland SOC during the past few decades, these changes are relatively less prominent than in other areas such as the Loess Plateau and in other land uses such as the cropland. Moreover, this region saw higher climate variability and change than other regions, making it an ideal study area for SOC change attribution.
2.2. Soil Sampling
We revisited all of the 31 typical soil profiles originally sampled in NSS2 [28] in the 1980s during a field campaign in July and August 2022. The identification of the exact profile localities was based on the NSS2 description of the profile’s relative location to local landmarks and roads, assisted by meta-information on topography, vegetation, soil type, etc. Guidance from the local farmers, herders, and the administrative staff was sought whenever possible. Compared with the profile localities separately determined using high-precision topographic maps [29], 24 profiles identified in situ were also found on these maps if a 5 m tolerance was allowed, which indicated an identification accuracy of 77%. At each NSS2 locality, three samples were randomly taken within 5 m of the determined locality using a soil drill (10 cm inner diameter, Type TPLQ-2, Top Yunnong, Hangzhou, China). Sampling depths were kept identical to NSS2 per soil layer. Maximum depth was limited to 100 cm. A composite sample was obtained at each profile locality by mixing the three random samples. Plant roots and gravel were manually removed. The SOC content was measured in the laboratory using the Walkley and Black [30] method, the same as in NSS2. Dichromate and sulphuric acid solutions were used as oxidation agents during the measurement. Heat was applied at 170 °C to accelerate the reaction. A correction factor of 1.1 was adopted to compensate for the incomplete oxidation.
2.3. SOC Covariates
Monthly air temperature, precipitation, and potential evapotranspiration were extracted from the ERA5 reanalysis of land monthly data (https://cds.climate.copernicus.eu/, accessed on 20 May 2022). ERA5 is a state-of-the-art global reanalysis dataset for land applications, which provides a consistent spatiotemporal representation of the global climate system [31]. The accuracy of the ERA5’s average temperature index has been evaluated as comparatively consistent against the station network records in China and higher than other reanalysis datasets such as JRA-55 and NCEP-2 [32]. More importantly, calibration efforts indicate that the ERA5 precipitation data have a higher-than-average accuracy in China’s northern temperate regions that include Hulunber [33]. The spatial resolution of ERA5 in the study area is about 5 km. We derived MAT, MAP, and PET from monthly values of a specific year. We also derived the mean annual aridity index (MAI) from MAP and PET:
In trying to test the legacy climatic effects on SOC [34], the variants of these annual metrics during the last 10 (i.e., MAT10, MAP10, PET10, and MAI10) and 5 years (i.e., MAT5, MAP5, PET5, and MAI5) were also derived.
Elevation was measured in situ per sampling location using a handheld GPS receiver (eTrex 221XL, Garmin, Switzerland). The slope gradient was derived from the Shuttle Radar Topography Mission’s digital elevation data [35]. We classified the grazing intensity in neighboring grasslands of the sampling location into one of the four classes, namely, enclosure-managed (G0), lightly grazed (G1), moderately grazed (G2), and heavily grazed grasslands (G3). As a reference, grasslands with a stocking rate of 0.92 AU ha−1 are regarded as heavily grazed, where 1 AU is defined as 500 kg cattle [36]. The classification was based on our observations of the degree of disturbance by animal feeding and trampling, and of the average distance to access roads and water sources in 2022 [36]. We also applied this classification for the year 1980 using information obtained from the NSS2 reports [28].
2.4. Model Development
We developed multiple regression models to characterize the SOC response to different categories of environmental and anthropogenic factors for the episodes of 1980 and 2022, respectively, using the following approach:
where y represents episode 1980 or 2022, is the regression coefficient, is the intercept, F is the regressor variable, I is the serial number of F, k is the total number of F, and f is a function form used to represent the nonlinear relationship between the regressor F and the response variable SOC.
We fulfilled two implementations of the nonlinear function f. The first implementation used a low-order polynomial function (e.g., the third order: ), while the second implementation employed a cubic spline function (i.e., , where a, b, c, d are coefficients and is the mean of F). We estimated Equation (2) in R using the lm function for the first implementation and the gam function for the second implementation. For model fitting, we started with the full model that included all potential regressors. We then reduced the number of regressors by excluding the most insignificant regressor per step until all remaining regressors were statistically significant. Only the best-fit model was retained for each episode.
We evaluated the performance of the obtained SOC models using the indices of the mean absolute error (MAE), mean absolute percentage error (MAPE), root mean square error (RMSE), coefficient of determination (R2), and Akaike Information Criterion (AIC). Three criteria were considered in selection of these indices, including accuracy (MAE, MAPE, and RMSE), goodness of fit (R2), and model parsimony (AIC).
2.5. Relative Importance
A predictor variable’s percent contribution to the model-accountable variabilities of the response variable is termed the “relative importance” of the specific predictor variable in statistical attribution research [22]. We assessed the relative importance of predictor variables in Equation (2) in accounting for the variabilities of SOC using the LMG approach [37,38]:
where Qi is the relative importance (%) of model regressor i, RSS is the regressor sum of squares, obtained by decomposing the model sum of squares (MSS) into regressor-specific fractions using the analysis of variance (ANOVA) technique, , where TSS is the total sum of squares of the model’s response variable SOC, , j is one of the permutated orderings of all regressors, and N is the total number of the orderings, for a model of n regressors. Essentially, Equation (3) computes the mean RSS:MSS ratio per regressor from the permutated orderings that involve all regressors [38].
To increase the robustness of the relative importance assessment, we repeated the computation procedure of Equation (3) 1000 times using resampled data with replacement, a technique known as bootstrapping [39], and attributed the mean Q to a specific regressor. We also employed the ANOVA method coupled with the least significant difference (LSD) test [40] for multiple comparisons of means. All data processing and analysis tasks were carried out with the R statistical environment version 4.1.3 (https://cran.r-project.org/, accessed on 1 May 2021).
3. Results
3.1. SOC Change
The average SOC content of the resampled grassland soils from the original NSS2 standard-profile locations in Hulunber was measured as being 17.62 g kg−1 in 2022, compared to 17.24 g kg−1 in the 1980s, showing a slight increase of 0.38 g kg−1 between these two episodes (Table 1). Among the 31 samples collected in 2022, 7 samples lacked a corresponding SOC measurement in NSS2. With the remaining 24 samples that allowed paired comparisons, the SOC content in 2022 averaged 19.85 g kg−1, compared to 17.24 g kg−1 in the 1980s, which means an apparent SOC increase of 3.91 g kg−1. In 2022, the grassland soils under moderate (G2) and heavy grazing (G3) conditions contained the highest (22.48 g kg−1) and the lowest SOC (15.94 g kg−1), respectively. In comparison, the soils under grazing-exclusion management (G0) and heavy grazing (G3) were found to have the highest (20.85 g kg−1) and the lowest SOC contents (9.66 g kg−1) in the 1980s. The LSD-test results show that the SOC content in 2022 is not significantly different from that in the 1980s, either compared collectively or per grazing intensity class (Figure 2), despite a large apparent SOC increase of 7.54 g kg−1 under G2.
It is important to note that grasslands consistently under the same (e.g., G1 to G1 and G3 to G3) or slightly higher grazing intensities from the 1980s to 2022 (e.g., G2 to G3 and G0 to G1 in Figure 2c) gained C, whereas grasslands under much higher grazing intensities (e.g., G0 to G3 and G1 to G3) or lower intensities in 2022 (e.g., G2 to G1 and G1 to G0) lost C. This suggests that stable and balanced management regimes over a relatively long period can enhance, or at least sustain, SOC [41] and that radical increases in grazing intensity lead to C losses that cannot be compensated for, even after the grazing intensity has been lowered [42].
3.2. Climate Change
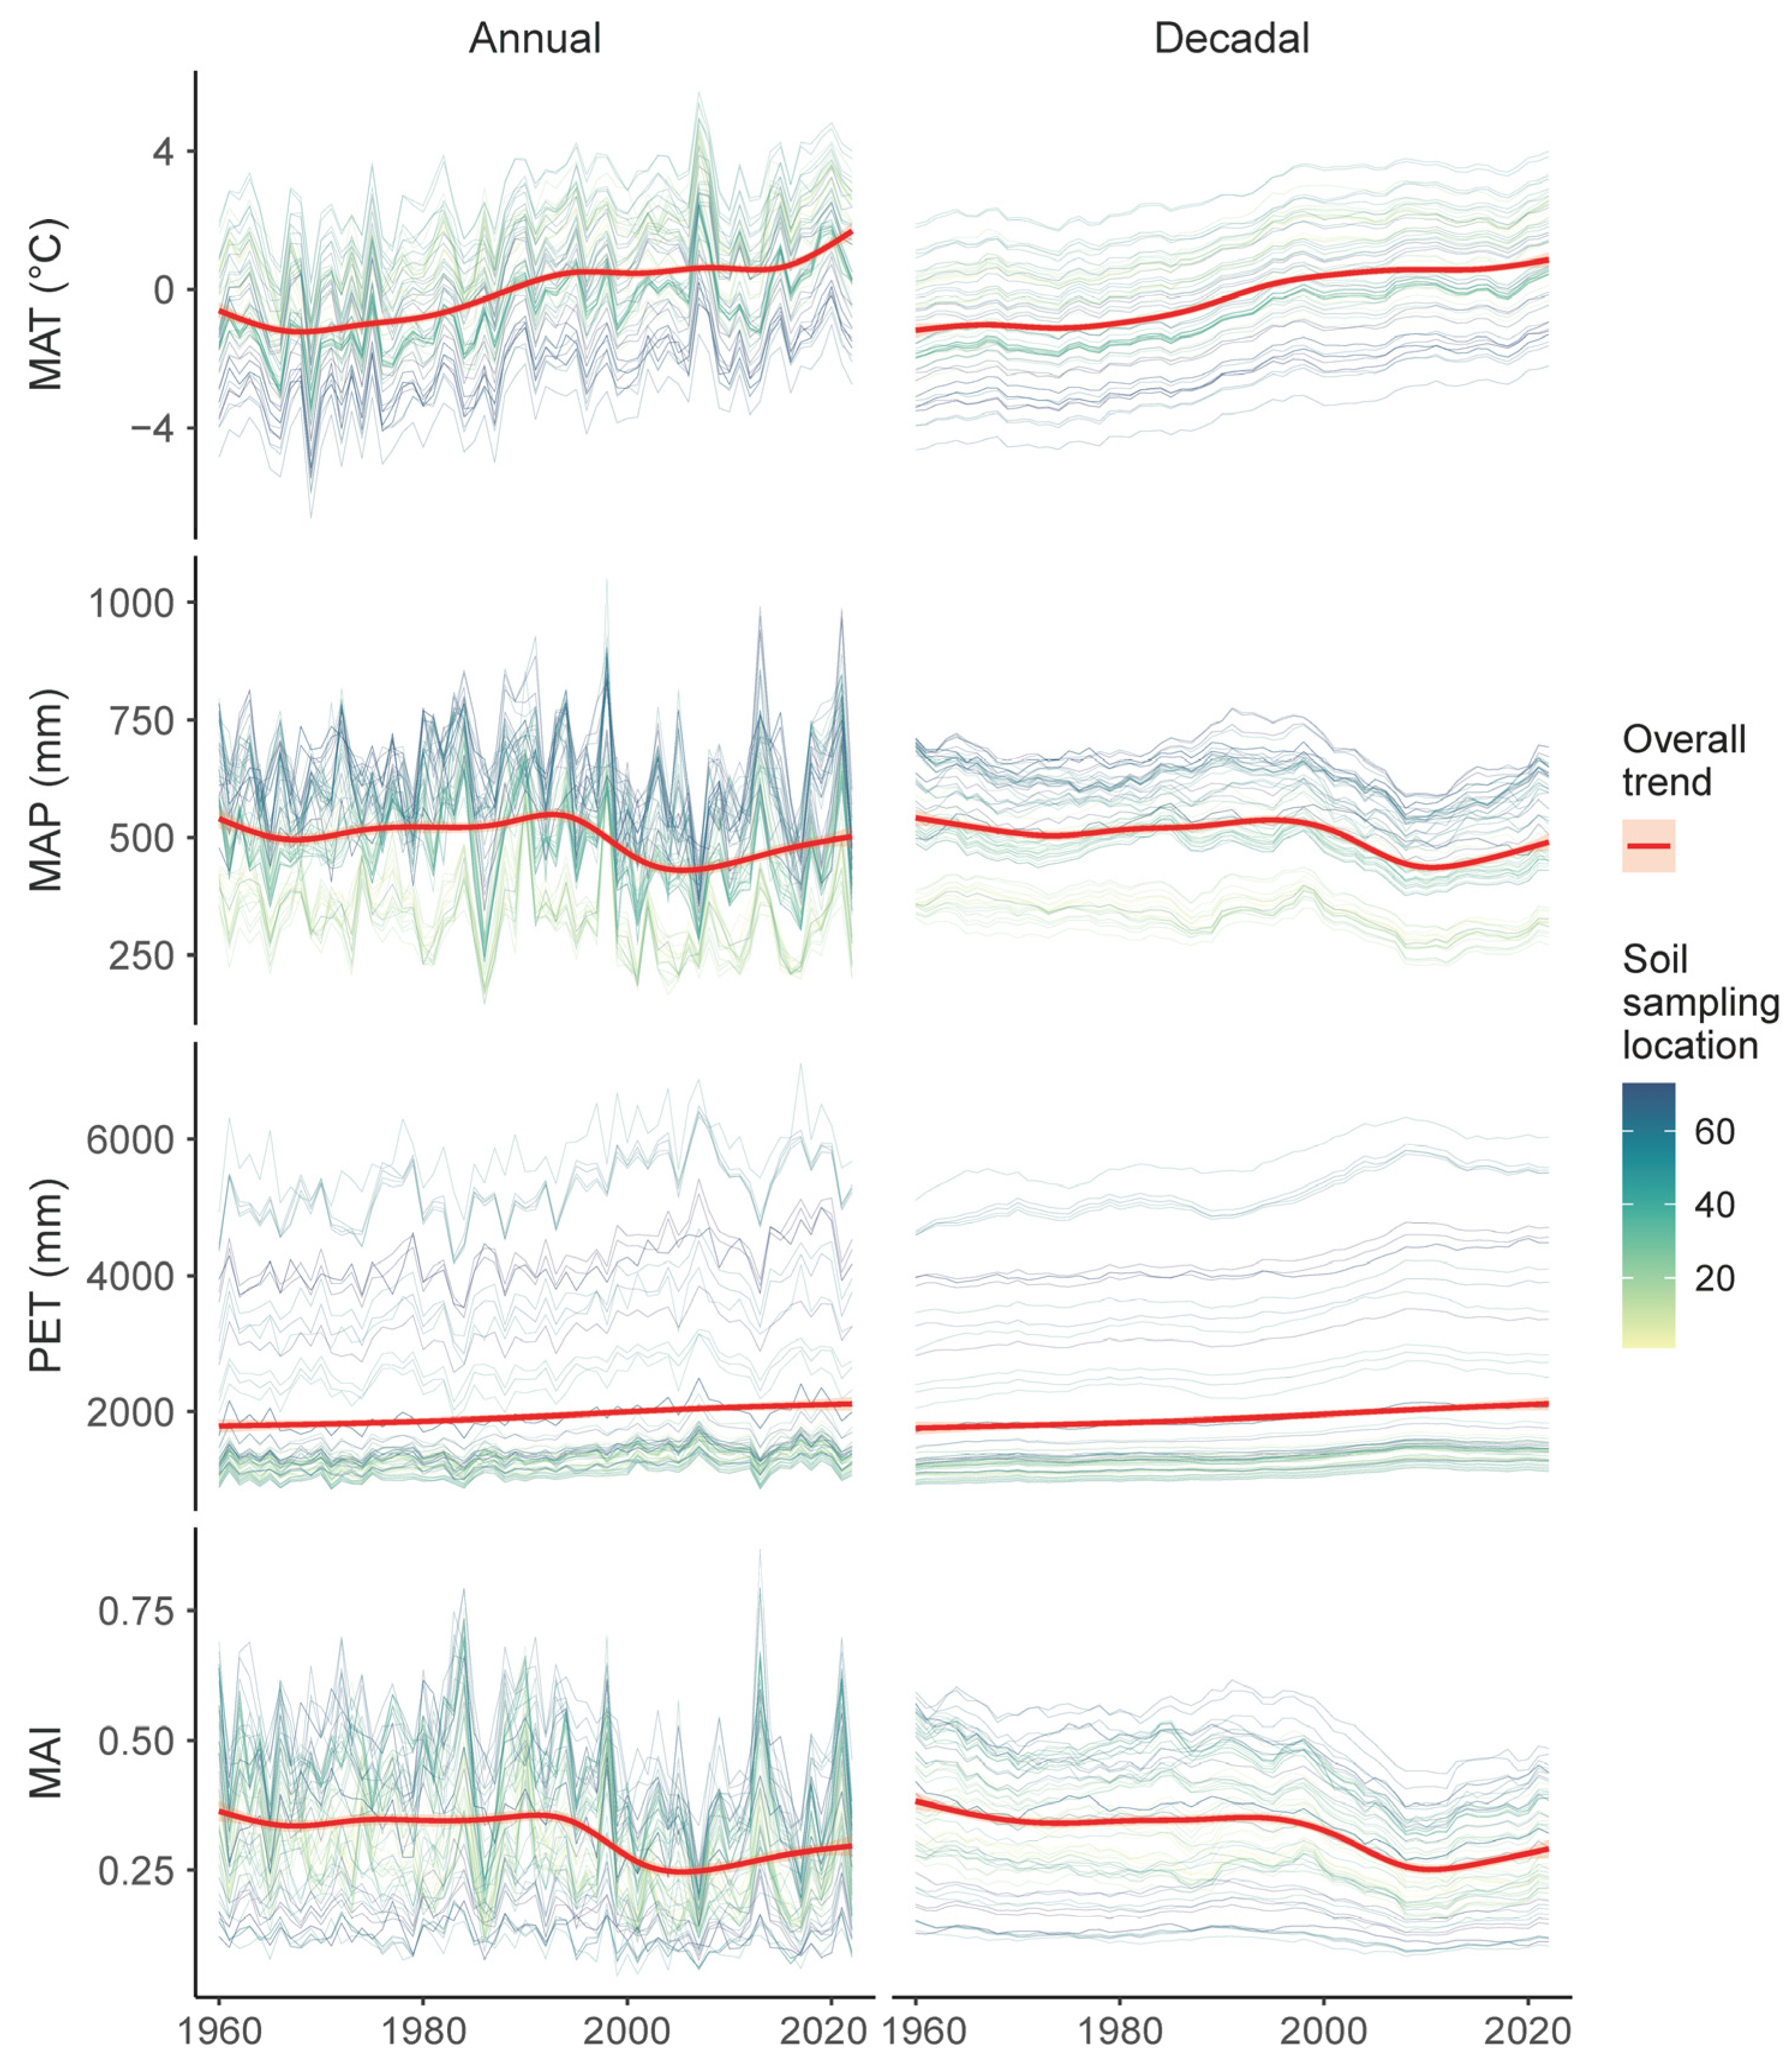
The climate in the study area became warmer and drier during the 1980–2022 period (Figure 3). In terms of decadal means, the average MAT10 at soil sampling locations increased from −0.94 °C during the 1971–1980 decade to 1.05 °C during the 2013–2022 decade, contrasting with a decrease in MAP10 from 515 mm year−1 to 490 mm year−1 for the same decades. Conversely, the average PET10 increased substantially. The average PET10 at soil sampling locations increased from 1839 mm year−1 to 2060 mm year−1. As a result, the average MAI10 decreased from 0.35 to 0.29, showing that the climate in this semi-arid region became drier from the 1980s to 2022.
3.3. SOC Determinants
Statistically significant correlations were found between SOC and all climatic variables except PET and PET-derived indicators (i.e., PET5 and PET10), despite differing signs (Figure 4). A significant correlation was also found between SOC and other soil variables, including bulk density and moisture content. Among the landscape variables tested, a significant correlation was found for elevation but not for the aspect ratio and slope gradient. To our surprise, a significant correlation between SOC and the grassland productivity indicators, including the above- and below-ground biomass (AGB, BGB), was not supported, although grassland SOC is positively associated with vegetation productivity. The correlation analysis confirmed our assumption that legacy climate had strong effects on SOC. Among the climatic variables analyzed, the MAP5- and MAP10-SOC correlation coefficients, for instance, were higher in magnitude than that between MAP and SOC (0.79 and 0.82 versus 0.76, respectively). The SOC also showed stronger correlations with MAI5, MAI10, MAT5, and MAT10 than with MAI and MAT.
3.4. SOC Models
Eight candidate SOC models were obtained by considering the potential covariates identified in the correlation analysis. For each episode, two candidate SOC models employed the polynomial functions to represent the nonlinear SOC responses to climate, landscape, and management variables, while the other two SOC models adopted the spline functions for nonlinearity. A comparison of these models’ prediction and fitting performances, using the indices of MAE, MAPE, RMSE, R2, and AIC (Table S1), reveals that Models #3 and #7 are the best models for episodes 1980 and 2022, respectively, and thus they are adopted in subsequent analyses (Tables S2 and S3). A further robustness test (Figure S1) using the bootstrapped data of 1000 replications [39] confirms that the model predictions not only compare well with the field-observed SOC for both episodes, 1980 and 2022, but also are tightly converged within the value ranges of field SOC observations. Although both models accommodate a similar set of regressors, subtle differences exist. One difference is that the episode 2022 model adopts MAT10 and MAI10, whilst the episode 1980 model adopts MAP and MAI. Another difference is that both elevation and slope gradient are included in the episode 2022 model, however, elevation is not incorporated into the episode 1980 model.
The obtained models confirm that grassland SOC can be accurately modeled using climate, landscape, and management variables at the point scales. The aridity index is incorporated into both the 1980 and 2022 models, showing that the aridity index is a reliable predictor of SOC at either an annual or decadal time scale in this semiarid region. The modeling results also confirm that grazing intensity is an appropriate proxy of management levels in grassland areas. The model coefficient of grazing intensity as a categorical variable can be interpreted as the mean SOC under a specific grazing intensity class when the other regressors (i.e., landscape variables) take the value zero. It is worth noting that correlation and multiple regression are two different statistical tools. Variables that have positive correlations with SOC may end up with negative regression coefficients in a multiple regression environment. It is also possible that multiple regression models incorporate variables that have weak correlations with the SOC over variables that have stronger correlations, due to the so-called suppressor effect [43].
3.5. Relative Importance
The mean relative importance per regressor using the bootstrap evaluation of 1000 replications is given in Figure 5. Additional statistical indices, including the median, standard error, and 95% confidence intervals, are given in Table S4. These results show that MAP and MAI explained 7.18% and 6.48%, respectively, of the model-accounted SOC variabilities for episode 1980, meaning that the climate contributed a summed share of 13.66% to the SOC variabilities that were explained by Model 3 for the 1980s. The results also show that the landscape and management variables contributed 37.53% and 48.81%, respectively, to Model-3-accounted SOC variabilities in the 1980s. Moreover, the evaluation results reveal that MAT10 and MAI10 took a 39.38% and 26.07% share in 2022, respectively, from Model-7-accounted SOC variabilities, collectively making the climate the most important factor (65.45%) for SOC in 2022, compared to 19.15% for the landscape factors and 15.39% for management practices.
4. Discussion
4.1. Northern Temperate Grasslands in China Are C-Neutral
Our results indicate that grassland SOC in the study area in 2022 is not significantly different from that in the 1980s, despite an apparent mean increase of 0.38 g kg−1 (or 0.06% year−1, p > 0.05). This is encouraging because it suggests that temperate grasslands in semiarid northern China may have become C-neutral after many years of conservation efforts both at the national and regional levels. Driven by strong market demand, the grasslands of Inner Mongolia have experienced severe degradation in the past few decades. In response, a range of restoration and conservation programs have been implemented, such as the Natural Grassland Restoration Program and the Returning Grazing Land to Grassland Program [44]. Moreover, a series of institutional reforms have been initiated since 2000, including the Grassland Eco-compensation Program, the Farmer’s Professional Cooperative Law, and so on. Our finding about the grassland’s C neutrality represents important below-ground evidence that confirms that these programs and institutions produced significant and positive effects in degradation mitigation, as previously suggested by above-ground data [45]. However, not all assessments are aligned in this direction.
For example, based on a regular-grid sampling in 2004, Zhou, Hartemink, Shi, Liang, and Lu [10] digitally mapped soil C using random forest as the prediction model and climate and satellite vegetation index data as the covariates, and found that grasslands in North and Northeast China lost C between the 1980s and 2004. The surface SOC content in 2004 was lower than that in the 1980s by 2.8 g kg−1 (or −1.3% year−1). In addition, Wang et al. [46] compared soil samples obtained in 2018 to NSS2 data and found that soil C density in the 0–30 cm layer in North China’s agropastoral ecotone decreased from 4.48 kg C m−2 in the 1980s to 3.60 kg C m−2 in 2018, suggesting a C loss rate of 0.6% year−1. Furthermore, a resampling in 2007–2011 of the 141 profiles that were previously sampled in 1963–1964 [12] suggests that SOC density in all the grassland soil types of Inner Mongolia decreased at an average rate of 0.5% year−1. As one of a few authors who suggested a non-negative SOC trend, Yang, Fang, Ma, Smith, Mohammat, Wang, and Wang [29] found a slight increase of 0.08 kg C m−2 in the SOC density of northern China grasslands based on 275 soil samples of the 1980s and 237 sites in 2001–2005. Many of these previous efforts employed resampled soil data, however, to our knowledge, none attempted to resample the original profiles. Instead, they turned to alternative techniques such as spatial interpolation [10] and area averaging [12]. Difficulties in locating the NSS2 or earlier profiles are immense. On the one hand, our extra effort in locating and sampling the original NSS2 profiles is well rewarded by the improved model performance (Table 2). On the other hand, focusing on a relatively smaller study area leads to higher sampling density and thus higher reliability in our study (Figure S1). Overall, our results deliver a clear reflection of the long-term C trend in the northern temperate grasslands in China over 40 years based on direct measurements.
4.2. Climate, Landscape, and Management Variables Predict Grassland SOC
The modeling and prediction of SOC using climate, landscape, and management variables have been explored by many authors. It has been demonstrated that SOC storage in terrestrial ecosystems is largely controlled by the balance between C inputs from plant production and outputs through decomposition [51]. Various factors can affect SOC levels, such as temperature, precipitation, soil moisture and nutrients, land use change, and land management practices [13,20,34]. In this study, we found positive SOC correlations of MAP (0.76), MAI (0.57), and soil moisture (0.71), and negative SOC correlations of MAT (−0.76) and soil bulk density (−0.66), which is largely in line with the regional SOC patterns in arid environments, as previously found in grasslands in North America [14] and the Eurasian Steppe [52]. We also found moderately positive correlations of elevation (0.49), slope gradient (0.23), and aspect ratio (0.28) with SOC, although the coefficients of the latter two were tested as being insignificant (p > 0.05). This is consistent with previous findings from other dryland areas [53] where the landscape context is especially important in shaping the spatial patterns of SOC, because, in arid regions, the microclimate and soil redistribution through water transportation are often strongly related to landscape parameters such as the slope gradient and aspect ratio [17,18]. Furthermore, land management practices were found, in previous research, to increase grassland SOC due to increased productivity under, e.g., nitrogen fertilization and mowing [21,22,54]. Although land management was treated as a categorical variable (i.e., grazing intensity class) in this study and thus not included in the correlation analysis, it was confirmed as an important SOC predictor by the models developed subsequently.
The SOC models developed here not only robustly reproduced the variability of SOC at the regional scale (Figure S1) but also compared superiorly to the models found in the recent literature that have a similar model structure (Table 2). The comparison shows that Models 3 and 7 of this study ranked first and second against the other five models based on prediction accuracy (MAE, MAPE, and RMSE) and goodness of fit (R2) indices. Using data from an extensive national survey of English grasslands, for instance, Manning, de Vries, Tallowin, Smith, Mortimer, Pilgrim, Harrison, Wright, Quirk, Benson, Shipley, Cornelissen, Kattge, Bönisch, Wirth, Bardgett, and Wilsey [47] showed that surface soil C stocks can be predicted at both national and regional scales from plant traits and simple measures of soil and climatic conditions. In a more recent study, Zhang, Liu, Zhao, Li, Zhao, Li, Chen, Chen, Han, and Huang [17] assessed how topography and grazing influenced the distribution of SOC in the grasslands of northern China using soil parameters. They found strong additional model predictability by including topographic factors in the model. Similar to our efforts, these authors endeavored to represent the nonlinear SOC response to respective predictors using, e.g., quadratic functions [47] or a GAM structure [17]. Methodologically speaking, although it appears appealing to include all possible predictor variables at once, it has never been practical [26]. Our approach, that groups factors into a few categories, has been effective and successful, given the performance tests and comparisons discussed above. However, using a limited selection of parameters is a double-edged sword. While the selection served the purpose of this research, the selection also confined the model’s suitability, in SOC prediction, to these specific predictors. Therefore, involving other categories of factors, especially those easy to obtain and of higher spatial/temporal resolution, is hopefully a promising future direction. These may include soil parameters, such as texture, moisture, microbial biomass, and C:N:P stoichiometry [55,56], and plant traits and productivity proxies, such as AGB, BGB, and NDVI [23,57]. Moreover, in recognizing the lack of interaction-handling mechanisms [40] in our modeling framework, it is desirable to explicitly consider the interactions between predictor variables, especially when a categorical variable is involved, in future model development. Additionally, the models developed here are point-based, meaning that the models are possibly biased to SOC variabilities only characterizable based on the point patterns. Thus, the adoption of spatial SOC proxies, especially those from remote sensing, may represent a plausible pathway to model performance improvements.
We obtained mixed results in the legacy effects of climate on SOC. The models developed here accommodate legacy climate indicators for the episode of 2022 but not for the episode of 1980, suggesting that the agreement of spatial patterns between the legacy climate at the decadal scale and the SOC measurements is more prominent for the episode of 2022 than for 1980, and that the climate’s ability in characterizing the spatial variabilities in grassland SOC is increasingly associated with longer-term climate trends. This may be explained by the general dynamics of SOC and the climate in the study area. The SOC in agroecosystems in China, including grassland [12] and cropland, experienced marked declines since the 1960s due to land use change, climate change, and mismanagement. However, this decline was slowed, halted, and, in some areas, reversed after the 1990s [8,11]. Although this altered SOC trend was mostly attributed to large-scale ecological restoration programs and improved management [9,10], the climate dynamics at the soil sampling location scales provide extra insights. Identified as major SOC drivers, the annual means of precipitation and aridity index (MAP and MAI) showed gentle declining trends in 1980 (Figure 6), largely in agreement with the historical SOC trend before the 1990s. In the post-1990s period, although the temperature increases in terms of the decadal means (MAT10) showed little difference from the pre-1990s period, the aridity index (MAI10), on the contrary, displayed an opposite trend, indicating that average climate at the grassland soil sampling sites became wetter during the 2010–2020 period, reverting from a steady drying trend before 2000 (Figure 6). This wetting trend is beneficial to SOC accumulations via enhanced C inputs from plant production and soil microbial activities [34], which leads to a better agreement between SOC and the decadal-scale climate in 2022.
4.3. Climate-Attributable SOC Variabilities Increased Fourfold over 40 Years
Our results indicate that the relative importance of climatic variables in explaining the model-accountable grassland SOC variabilities increased by 378%, contrasting with the decreased relative importance values for landscape and management of 49% and 68%, respectively, during the 1980s–2022 period. This shows that climate has become the primary control of SOC spatial variability in 2022, compared to minor contributions from landscape and management (Figure 5). The obtained relative importance values can be interpreted as predictor-specific contributions to SOC spatial variabilities that are explained by the regression model [15]. The reason why the relative importance reflects the spatial but not the temporal variability of SOC in this study is that the models developed here are episode-specific, meaning that a single model only captures the spatial variability and that multiple models are needed if temporal variability is to be captured, which was not an aim of this study.
The grasslands in Hulunber have seen marked changes over the past 40 years. On the one hand, shifts in grassland management regimes in the pre- versus post-2000 periods have greatly relaxed the limitations of grassland exploitation on SOC. Driven by market demand, overgrazing in the Inner Mongolia grasslands, including those of Hulunber, caused widespread degradation and large SOC losses [21] between 1980 and 2000. Following environmental legislations and the implementation of ecological conservation and restoration programs [44], 54% of the overgrazed grasslands were transformed into managed grasslands, such as rotational pastures, during the first decade in the twenty-first century alone [58]. As a result, mismanagement has dropped from being the primary control of grassland SOC variabilities to a minor contributor over the 40 years from 1980 to 2022. Moreover, livestock under free grazing were observed to feed more in lowland than upland areas [59], giving rise to a spatial pattern of higher SOC in higher elevation and/or higher slope positions [19]. This pattern had been largely weakened as livestock grazing was increasingly managed by grazing plans after 2000, pushing the importance of landscape contexts in driving SOC variabilities to drop by nearly 50%. On the other hand, the climate in the study area became warmer and drier between 1980 and 2022, as shown previously. This means that the SOC decomposition potential tended to increase from the pre- to post-2000 periods under a warming trend of 0.4 °C decade−1 in Hulunber, while the SOC accumulation potential tended to decrease due to the detrimental effects of the observed trend of aridity index (−0.03 decade−1) on vegetation production as C input into the soils. As a result, the climate jumped from being a minor driver of grassland SOC variabilities in the 1980s to the primary controller in 2022.
4.4. Policy and Management Implications
The implications of our results are threefold. Firstly, the focus of future grassland conservation and restoration programs should be more aligned with the long-term climate trends, given the increasing importance of the climate in shaping grassland ecosystem services, such as the C sequestration characterized in this study. However, at local scales, production activities such as livestock grazing and rotation should be guided by short-term climate variabilities and grassland status. From the perspective of natural versus anthropogenic factors, the reducing importance of the latter suggests that the future grassland management policy needs to be inclined towards natural factors rather than anthropogenic factors, meaning that the focus of future conservation and restoration efforts should be climate-centric.
Secondly, building climate-smart thinking into the future grassland management paradigm has paramount significance in guiding, planning, and running conservation and restoration programs. It is also the key to transforming grassland policies to being climate-centric. This can be carried out by fostering climate awareness, climate adaptation, and climate smartness among the stakeholders of the grassland industry step by step. Among them, climate adaptation is the most critical step where government assistance is needed, e.g., for collecting and feeding climatic and vegetation status information to herder families and training these families to properly apply such information in household-level grazing planning. Evidence has shown that education is, by itself, a valid adaptation measure [60]. Evidence has also shown that improved grazing management is a low-cost and high-C-gain option in grassland adaptation to climate change [61]. Moreover, government assistance is also needed in the selection and management of available climate-resilient germplasm resources. Recent research indicated that, for example, winter-hardy, indigenous species of alfalfa may provide both adaptation and mitigation benefits for northern grasslands in China [62,63]. In this context, the most important implication of our results is that climate adaptation is currently a more important and, thus, a more demanding task than climate mitigation, suggesting that the focus of grassland management efforts, including ecological restoration programs, should aim to make the entire grassland–livestock system more climate-resilient. Persistently large-scale climate change mitigation can only be fulfilled based on a climate-resilient grassland ecosystem.
Thirdly, restoring many of the grassland’s ecosystem services, including C sequestration and climate change mitigation, needs long-term efforts. As our results indicate, the legacy effects of the climate are increasingly involved in both the processes of C loss and accumulation. In addition, the SOC effects of management practices are based on soil processes that operate over decadal or longer timescales [64]. It is, therefore, improper and harmful to expect significant SOC effects in grassland ecosystems in the short term. It is also important to incorporate a long-term mentality into the top-level planning and decision-making for the sustainable use and management of the grassland ecosystem.
5. Conclusions
We provide modeling evidence in this study that the spatial variability in grassland SOC is primarily controlled by climate and that anthropogenic influences have only minor effects on SOC variability through management practices, while the contributions from landscape factors are between the two. In comparison, climate and management had a minor versus major role in controlling the SOC spatial variability in the northern temperate grasslands in China 40 years ago, although no significant SOC trend was detected for this period. We also show, through our results, that SOC variabilities are increasingly associated with longer-term climate trends, meaning the legacy effects of climate on SOC variabilities have become stronger since the 1980s. Therefore, we argue that future grassland policies should become climate-centric, while the current management and institutional momentum on grassland conservation should be maintained and continued.
Supplementary Materials
The following supporting information can be downloaded at: https://www.mdpi.com/article/10.3390/agronomy13102664/s1, Table S1: Comparison of the mean absolute error (MAE), mean absolute percentage error (MAPE), root mean square error (RMSE), determination coefficient (R2), and the Akaike Information Criterion (AIC) of candidate SOC models; Table S2: SOC model coefficients for episode 1980; Table S3: SOC model coefficients for episode 2022; Table S4: The mean, median, standard error, and lower and upper limits of the 95% confidence interval of the SOC covariates’ relative importance in explaining the SOC variabilities based on a bootstrap evaluation of 1000 replications. Different letters in parentheses indicate significant differences at p < 0.05; Figure S1: Comparison between the field-observed and model-predicted SOC contents. Each color line represents one model prediction using bootstrapping (N = 1000).
Author Contributions
Conceptualization, L.X. and L.Y.; Data curation, W.X. and X.W.; Formal analysis, W.X., L.X. and X.W.; Funding acquisition, L.X.; Investigation, W.X., X.W. and Y.Y.; Methodology, L.Y.; Project administration, Y.N.; Resources, Y.N.; Software, W.X. and Y.Y.; Supervision, L.X. and L.Y.; Validation, Y.N.; Visualization, L.Y.; Writing—original draft, W.X.; Writing—review and editing, L.X. and L.Y. All authors have read and agreed to the published version of the manuscript.
Funding
This research was funded by the National Key Research and Development Program of China, grant number 2021YFD1300500; the Commercialization of Scientific and Technological Achievements Program of Inner Mongolia Autonomous Region, grant number 2021CG0038; and the China Agriculture Research System, grant number CARS-34.
Data Availability Statement
The data analyzed in this study are either included in the paper and the Supplementary Materials or available on reasonable request to the corresponding authors.
Conflicts of Interest
The authors declare no conflict of interest.
References
- Lal, R. Soil carbon sequestration impacts on global climate change and food security. Science 2004, 304, 1623–1627. [Google Scholar] [CrossRef] [PubMed]
- Gruba, P.; Socha, J. Exploring the effects of dominant forest tree species, soil texture, altitude, and pH-H2O on soil carbon stocks using generalized additive models. For. Ecol. Manag. 2019, 447, 105–114. [Google Scholar] [CrossRef]
- Beillouin, D.; Corbeels, M.; Demenois, J.; Berre, D.; Boyer, A.; Fallot, A.; Feder, F.; Cardinael, R. A global meta-analysis of soil organic carbon in the Anthropocene. Nat. Commun. 2023, 14, 3700. [Google Scholar] [CrossRef] [PubMed]
- Breulmann, M.; Boettger, T.; Buscot, F.; Gruendling, R.; Schulz, E. Carbon storage potential in size-density fractions from semi-natural grassland ecosystems with different productivities over varying soil depths. Sci. Total Environ. 2016, 545–546, 30–39. [Google Scholar] [CrossRef] [PubMed]
- IPCC. Land Use, Land-Use Change, and Forestry; Watson, R.T., Noble, I.R., Bolin, B., Ravindranath, N.H., Verardo, D.J., Dokken, D.J., Eds.; Cambridge University Press: Cambridge, UK, 2000; p. 377. [Google Scholar]
- Ye, L. Editorial: Enhancing food production system resilience for food security facing a changing environment. Front. Sustain. Food Syst. 2023, 7, 1204098. [Google Scholar] [CrossRef]
- Ye, L.-M.; Malingreau, J.-P.; Tang, H.-J.; Van Ranst, E. The breakfast imperative: The changing context of global food security. J. Integr. Agric. 2016, 15, 1179–1185. [Google Scholar] [CrossRef]
- Xu, L.; Yu, G.; He, N. Increased soil organic carbon storage in Chinese terrestrial ecosystems from the 1980s to the 2010s. J. Geogr. Sci. 2019, 29, 49–66. [Google Scholar] [CrossRef]
- Han, D.; Wiesmeier, M.; Conant, R.T.; Kuhnel, A.; Sun, Z.; Kogel-Knabner, I.; Hou, R.; Cong, P.; Liang, R.; Ouyang, Z. Large soil organic carbon increase due to improved agronomic management in the North China Plain from 1980s to 2010s. Glob. Chang. Biol. 2018, 24, 987–1000. [Google Scholar] [CrossRef]
- Zhou, Y.; Hartemink, A.E.; Shi, Z.; Liang, Z.; Lu, Y. Land use and climate change effects on soil organic carbon in North and Northeast China. Sci. Total Environ. 2019, 647, 1230–1238. [Google Scholar] [CrossRef]
- Xie, Z.; Zhu, J.; Liu, G.; Cadisch, G.; Hasegawa, T.; Chen, C.; Sun, H.; Tang, H.; Zeng, Q. Soil organic carbon stocks in China and changes from 1980s to 2000s. Glob. Chang. Biol. 2007, 13, 1989–2007. [Google Scholar] [CrossRef]
- Xin, X.; Jin, D.; Ge, Y.; Wang, J.; Chen, J.; Qi, J.; Chu, H.; Shao, C.; Murray, P.J.; Zhao, R.; et al. Climate change dominated long-term soil carbon losses of Inner Mongolian grasslands. Glob. Biogeochem. Cycles 2020, 34, e2020GB006559. [Google Scholar] [CrossRef]
- Dai, E.; Huang, Y.; Wu, Z.; Zhao, D. Analysis of spatio-temporal features of a carbon source/sink and its relationship to climatic factors in the Inner Mongolia grassland ecosystem. J. Geogr. Sci. 2016, 26, 297–312. [Google Scholar] [CrossRef]
- Jobbagy, E.G.; Jackson, R.B. The vertical distribution of soil organic carbon and its relation to climate and vegetation. Ecol. Appl. 2000, 10, 423–436. [Google Scholar] [CrossRef]
- Pansonato, M.P.; Costa, F.R.C.; de Castilho, C.V.; Carvalho, F.A.; Zuquim, G. Spatial scale or amplitude of predictors as determinants of the relative importance of environmental factors to plant community structure. Biotropica 2013, 45, 299–307. [Google Scholar] [CrossRef]
- Cai, M.; Zhao, G.; Zhao, B.; Cong, N.; Zheng, Z.; Zhu, J.; Duan, X.; Zhang, Y. Climate warming alters the relative importance of plant root and microbial community in regulating the accumulation of soil microbial necromass carbon in a Tibetan alpine meadow. Glob. Chang. Biol. 2023, 29, 3193–3204. [Google Scholar] [CrossRef]
- Zhang, X.; Liu, M.; Zhao, X.; Li, Y.; Zhao, W.; Li, A.; Chen, S.; Chen, S.; Han, X.; Huang, J. Topography and grazing effects on storage of soil organic carbon and nitrogen in the northern China grasslands. Ecol. Indic. 2018, 93, 45–53. [Google Scholar] [CrossRef]
- Sigua, G.C.; Coleman, S.W. Spatial distribution of soil carbon in pastures with cow-calf operation: Effects of slope aspect and slope position. J. Soils Sediments 2010, 10, 240–247. [Google Scholar] [CrossRef]
- Wei, J.; Xiao, D.; Zhang, X.; Li, X. Topography and land use effects on the spatial variation of soil organic carbon: A case study in a typical small watershed of the black soil region in northeast China. Eurasian Soil Sci. 2011, 41, 39–47. [Google Scholar] [CrossRef]
- Li, W.; Ciais, P.; Guenet, B.; Peng, S.; Chang, J.; Chaplot, V.; Khudyaev, S.; Peregon, A.; Piao, S.; Wang, Y.; et al. Temporal response of soil organic carbon after grassland-related land-use change. Glob. Chang. Biol. 2018, 24, 4731–4746. [Google Scholar] [CrossRef]
- Poeplau, C. Grassland soil organic carbon stocks along management intensity and warming gradients. Grass Forage Sci. 2021, 76, 186–195. [Google Scholar] [CrossRef]
- Johnson, J.W.; Lebreton, J.M. History and use of relative importance indices in organizational research. Organ. Res. Methods 2016, 7, 238–257. [Google Scholar] [CrossRef]
- Zhang, H.; Dong, L.; Yao, X.; Wang, W. Soil fertility shifts the relative importance of saprotrophic and mycorrhizal fungi for maintaining ecosystem stability. Glob. Chang. Biol. 2023, 29, 1206–1216. [Google Scholar] [CrossRef] [PubMed]
- De’ath, G. Multivariate Regression Trees: A new technique for modeling species-environment relationships. Ecology 2002, 83, 1105–1117. [Google Scholar] [CrossRef]
- Ren, S.; Vitasse, Y.; Chen, X.; Peichl, M.; An, S. Assessing the relative importance of sunshine, temperature, precipitation, and spring phenology in regulating leaf senescence timing of herbaceous species in China. Agric. For. Meteorol. 2022, 313, 108770. [Google Scholar] [CrossRef]
- Li, X.; Zhou, W.; Ouyang, Z. Forty years of urban expansion in Beijing: What is the relative importance of physical, socioeconomic, and neighborhood factors? Appl. Geogr. 2013, 38, 1–10. [Google Scholar] [CrossRef]
- ESA. Land Cover CCI Product User Guide Version 2. Technical Report. 2017. Available online: Maps.elie.ucl.ac.be/CCI/viewer/download/ESACCI-LC-Ph2-PUGv2_2.0.pdf (accessed on 1 September 2022).
- Hulunber Prefecture Soil Survey Office. Soils of the Hulunber Prefucture; Nei Mongol People’s Publishing House: Huhhot, China, 1992; p. 230. [Google Scholar]
- Yang, Y.; Fang, J.; Ma, W.; Smith, P.; Mohammat, A.; Wang, S.; Wang, W. Soil carbon stock and its changes in northern China’s grasslands from 1980s to 2000s. Glob. Chang. Biol. 2010, 16, 3036–3047. [Google Scholar] [CrossRef]
- Walkley, A.; Black, I.A. An examination of the Degtjareff Method for determining soil organic matter, and a proposed modification of the chromic acid titration method. Soil Sci. 1934, 37, 29–38. [Google Scholar] [CrossRef]
- Muñoz-Sabater, J.; Dutra, E.; Agustí-Panareda, A.; Albergel, C.; Arduini, G.; Balsamo, G.; Boussetta, S.; Choulga, M.; Harrigan, S.; Hersbach, H.; et al. ERA5-Land: A state-of-the-art global reanalysis dataset for land applications. Earth Syst. Sci. Data 2021, 13, 4349–4383. [Google Scholar] [CrossRef]
- Chai, W.; Huang, Y.; Yang, L.; Quan, H.; Fu, Z. Evaluation of re-analyses over China based on the temporal asymmetry of daily temperature variability. Theor. Appl. Clim. 2021, 147, 753–765. [Google Scholar] [CrossRef]
- Liu, T.; Zhu, X.; Guo, R.; Kun, X.; Zhang, S. Applicability of ERA5 reanalysis of precipitation data in China. Arid Land Geogr. 2022, 45, 66–79. (In Chinese) [Google Scholar]
- Broderick, C.M.; Wilkins, K.; Smith, M.D.; Blair, J.M. Climate legacies determine grassland responses to future rainfall regimes. Glob. Chang. Biol. 2022, 28, 2639–2656. [Google Scholar] [CrossRef] [PubMed]
- Farr, T.G.; Rosen, P.A.; Caro, E.; Crippen, R.; Duren, R.; Hensley, S.; Kobrick, M.; Paller, M.; Rodriguez, E.; Roth, L.; et al. The Shuttle Radar Topography Mission. Rev. Geophys. 2007, 45, RG2004. [Google Scholar] [CrossRef]
- Yan, R.; Zhang, Y.; Wang, M.; Li, R.; Jin, D.; Xin, X.; Li, L. Interannual variation in ecosystem respiration in an Inner Mongolian meadow steppe in response to livestock grazing. Ecol. Indic. 2021, 131, 108121. [Google Scholar] [CrossRef]
- Lindeman, R.H.; Merenda, P.F.; Gold, R.Z. Introduction to Bivariate and Multivariate Analysis; Scott Foresman: Glenview, IL, USA, 1980; p. 444. [Google Scholar]
- Grömping, U. Relative importance for linear regression in R: The package relaimpo. J. Stat. Softw. 2006, 17, 1–27. [Google Scholar] [CrossRef]
- Kulesa, A.; Krzywinski, M.; Blainey, P.; Altman, N. Sampling distributions and the bootstrap. Nat. Meth. 2015, 12, 477–478. [Google Scholar] [CrossRef] [PubMed]
- Welham, S.J.; Gezan, S.A.; Clark, S.J.; Mead, A. Statistical Methods in Biology: Design and Analysis of Experiments and Regression; CRC Press: Boca Raton, FL, USA, 2015; p. 568. [Google Scholar]
- Zhang, Y.J.; Zhang, X.Q.; Wang, X.Y.; Liu, N.; Kan, H.M. Establishing the carrying capacity of the grasslands of China: A review. Rangeland J. 2014, 36, 1–9. [Google Scholar] [CrossRef]
- Piipponen, J.; Jalava, M.; Leeuw, J.; Rizayeva, A.; Godde, C.; Cramer, G.; Herrero, M.; Kummu, M. Global trends in grassland carrying capacity and relative stocking density of livestock. Glob. Chang. Biol. 2022, 28, 3902–3919. [Google Scholar] [CrossRef]
- Watson, D.; Clark, L.A.; Chmielewski, M.; Kotov, R. The value of suppressor effects in explicating the construct validity of symptom measures. Psychol. Assess. 2013, 25, 929–941. [Google Scholar] [CrossRef]
- Robinson, B.E.; Li, P.; Hou, X. Institutional change in social-ecological systems: The evolution of grassland management in Inner Mongolia. Glob. Environ. Chang. 2017, 47, 64–75. [Google Scholar] [CrossRef]
- Chen, H.; Shao, L.; Zhao, M.; Zhang, X.; Zhang, D. Grassland conservation programs, vegetation rehabilitation and spatial dependency in Inner Mongolia, China. Land Use Policy 2017, 64, 429–439. [Google Scholar] [CrossRef]
- Wang, X.; Li, Y.; Gong, X.; Niu, Y.; Chen, Y.; Shi, X.; Li, W.; Liu, J. Changes of soil organic carbon stocks from the 1980s to 2018 in northern China’s agro-pastoral ecotone. Catena 2020, 194, 104722. [Google Scholar] [CrossRef]
- Manning, P.; de Vries, F.T.; Tallowin, J.R.B.; Smith, R.; Mortimer, S.R.; Pilgrim, E.S.; Harrison, K.A.; Wright, D.G.; Quirk, H.; Benson, J.; et al. Simple measures of climate, soil properties and plant traits predict national-scale grassland soil carbon stocks. J. Appl. Ecol. 2015, 52, 1188–1196. [Google Scholar] [CrossRef]
- Smith, K.R.; Waring, B.G. Broad-scale patterns of soil carbon (C) pools and fluxes across semiarid ecosystems are linked to climate and soil texture. Ecosystems 2019, 22, 742–753. [Google Scholar] [CrossRef]
- Wu, Y.; Guo, Z.; Li, Z.; Liang, M.; Tang, Y.; Zhang, J.; Miao, B.; Wang, L.; Liang, C. The main driver of soil organic carbon differs greatly between topsoil and subsoil in a grazing steppe. Ecol. Evol. 2022, 12, e9182. [Google Scholar] [CrossRef]
- Hui, D.; Lee, X.; Huang, Y.; Huang, D.; Hu, L.; Feng, Z.; Cheng, J.; Wang, B.; Ni, J.; Shurkhuu, T. Variation of soil organic carbon and its major constraints in East Central Asia. PLoS ONE 2016, 11, e0150709. [Google Scholar] [CrossRef]
- Tian, H.; Lu, C.; Yang, J.; Banger, K.; Huntzinger, D.N.; Schwalm, C.R.; Michalak, A.M.; Cook, R.; Ciais, P.; Hayes, D.; et al. Global patterns and controls of soil organic carbon dynamics as simulated by multiple terrestrial biosphere models: Current status and future directions. Glob. Biogeochem. Cycles 2015, 29, 775–792. [Google Scholar] [CrossRef]
- Kadono, A.; Funakawa, S.; Kosaki, T. Factors controlling mineralization of soil organic matter in the Eurasian steppe. Soil Biol. Biochem. 2008, 40, 947–955. [Google Scholar] [CrossRef]
- Patton, N.R.; Lohse, K.A.; Seyfried, M.S.; Godsey, S.E.; Parsons, S.B. Topographic controls of soil organic carbon on soil-mantled landscapes. Sci. Rep. 2019, 9, 6390. [Google Scholar] [CrossRef]
- Li, D.; Nie, Y.; Xu, L.; Ye, L. Enclosure in combination with mowing simultaneously promoted grassland biodiversity and biomass productivity. Plants 2022, 11, 2037. [Google Scholar] [CrossRef]
- Xu, L.; Li, D.; Wang, D.; Ye, L.; Nie, Y.; Fang, H.; Xue, W.; Bai, C.; Van Ranst, E. Achieving the dual goals of biomass production and soil rehabilitation with sown pasture on marginal cropland: Evidence from a multi-year field experiment in northeast Inner Mongolia. Front. Plant Sci. 2022, 13, 985864. [Google Scholar] [CrossRef]
- Kerr, D.D.; Ochsner, T.E. Soil organic carbon more strongly related to soil moisture than soil temperature in temperate grasslands. Soil Sci. Soc. Am. J. 2020, 84, 587–596. [Google Scholar] [CrossRef]
- Ye, L.; De Grave, J.; Van Ranst, E.; Xu, L. Calibration of MODIS-derived cropland growing season using the climotransfer function and ground observations. Remote Sens. 2023, 15, 72. [Google Scholar] [CrossRef]
- Kemp, D.R.; Guodong, H.; Xiangyang, H.; Michalk, D.L.; Fujiang, H.; Jianping, W.; Yingjun, Z. Innovative grassland management systems for environmental and livelihood benefits. Proc. Natl. Acad. Sci. USA 2013, 110, 8369–8374. [Google Scholar] [CrossRef] [PubMed]
- Chang, J.; Ciais, P.; Gasser, T.; Smith, P.; Herrero, M.; Havlík, P.; Obersteiner, M.; Guenet, B.; Goll, D.S.; Li, W.; et al. Climate warming from managed grasslands cancels the cooling effect of carbon sinks in sparsely grazed and natural grasslands. Nat. Commun. 2021, 12, 118. [Google Scholar] [CrossRef]
- Ye, L.; Tang, H.; Yang, G.; Van Ranst, E. Adopting higher-yielding varieties to ensure Chinese food security under climate change in 2050. Proc. Environ. Sci. 2015, 29, 281. [Google Scholar] [CrossRef]
- Bai, Y.; Cotrufo, M.F. Grassland soil carbon sequestration: Current understanding, challenges, and solutions. Science 2022, 377, 603–608. [Google Scholar] [CrossRef] [PubMed]
- Xu, L.; Liu, Q.; Nie, Y.; Li, F.; Yang, G.; Tao, Y.; Lv, S.; Wu, X.; Ye, L. A multi-site evaluation of winter hardiness in indigenous alfalfa cultivars in northern China. Atmosphere 2021, 12, 1538. [Google Scholar] [CrossRef]
- Xu, L.; Ye, L.; Nie, Y.; Yang, G.; Xin, X.; Yuan, B.; Yang, X. Sown alfalfa pasture decreases grazing intensity while increasing soil carbon: Experimental observations and DNDC model predictions. Front. Plant Sci. 2022, 13, 1019966. [Google Scholar] [CrossRef]
- Wiesmeier, M.; Urbanski, L.; Hobley, E.; Lang, B.; von Lützow, M.; Marin-Spiotta, E.; van Wesemael, B.; Rabot, E.; Ließ, M.; Garcia-Franco, N.; et al. Soil organic carbon storage as a key function of soils—A review of drivers and indicators at various scales. Geoderma 2019, 333, 149–162. [Google Scholar] [CrossRef]
Figure 1.
The study area as shown by its geographic location (a) and the spatial relationship between the soil sampling locations and the regional grasslands (b). The land cover raster layer is acquired from the European Space Agency’s Climate Change Initiative [27].
Figure 1.
The study area as shown by its geographic location (a) and the spatial relationship between the soil sampling locations and the regional grasslands (b). The land cover raster layer is acquired from the European Space Agency’s Climate Change Initiative [27].
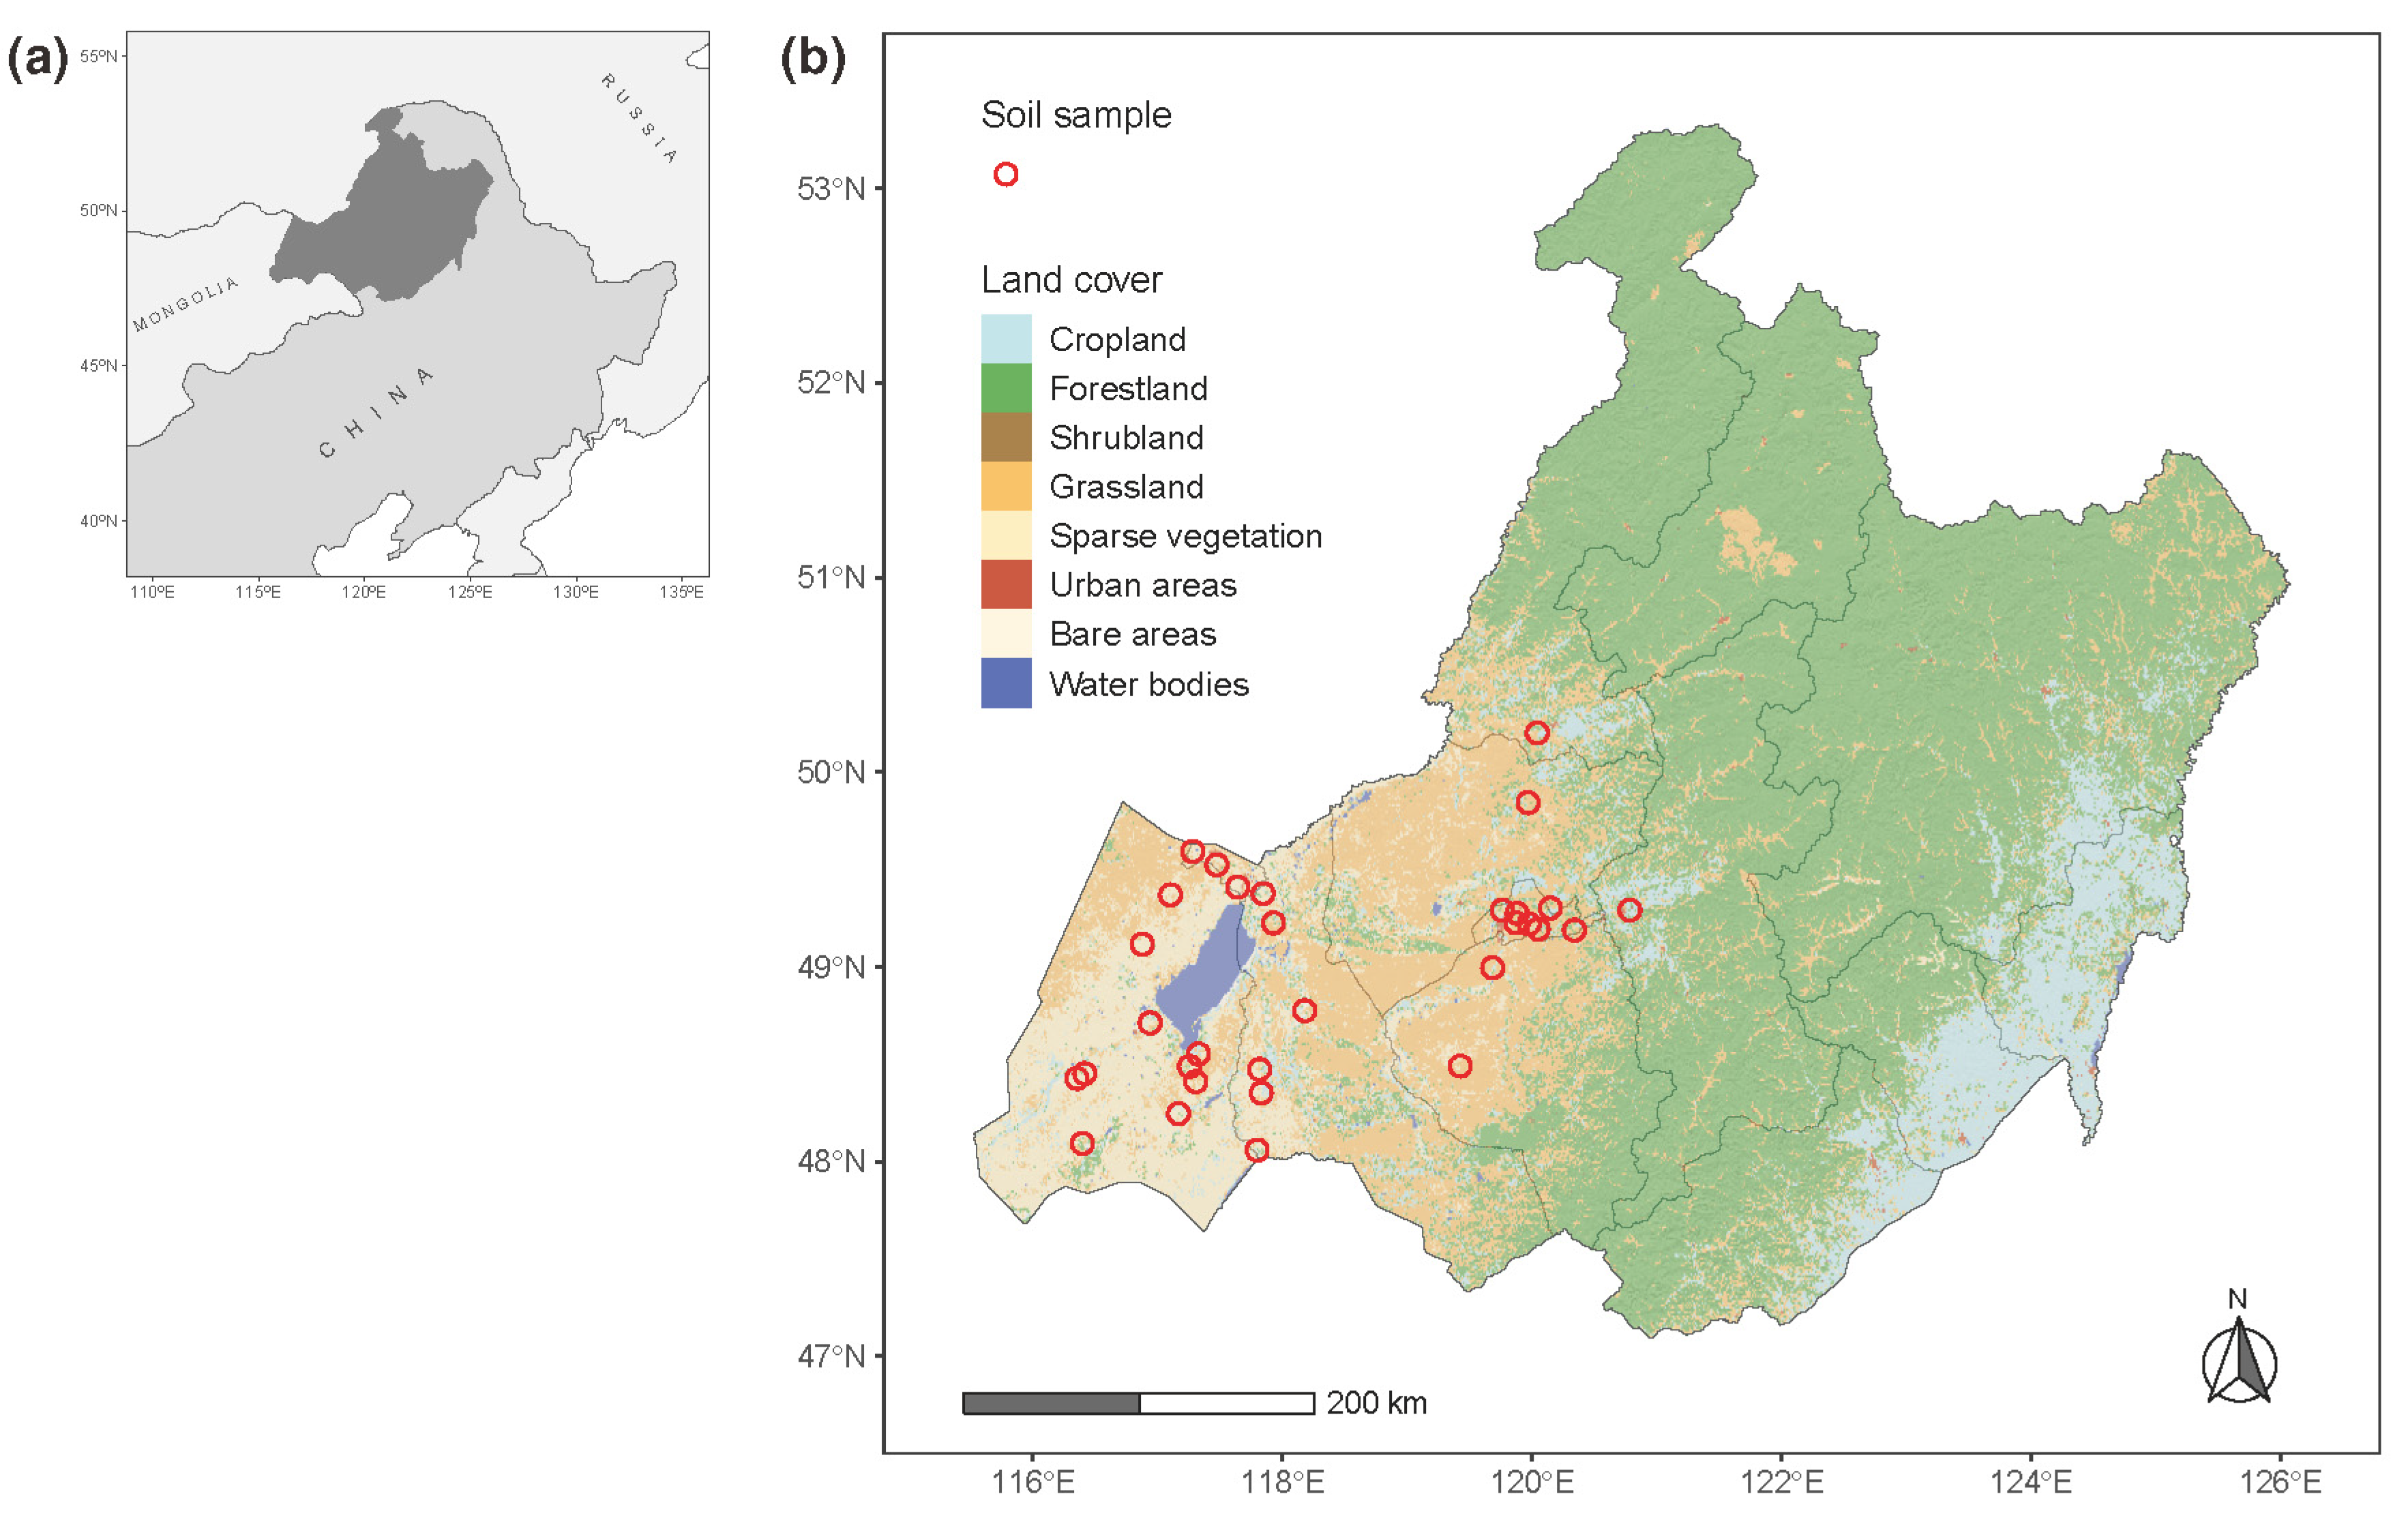
Figure 2.
Soil organic carbon (SOC) content change between the 1980s and 2022. (a) Comparison between the 1980s and 2022; (b) Comparison between the 1980s and 2022 per grazing intensity class; (c) Relationship between SOC change and grazing intensity change between the 1980s and 2022. Different lower-case letters indicate significant differences at p < 0.05. G0, grazing exclusion; G1, light grazing; G2, moderate grazing; G3, heavy grazing.
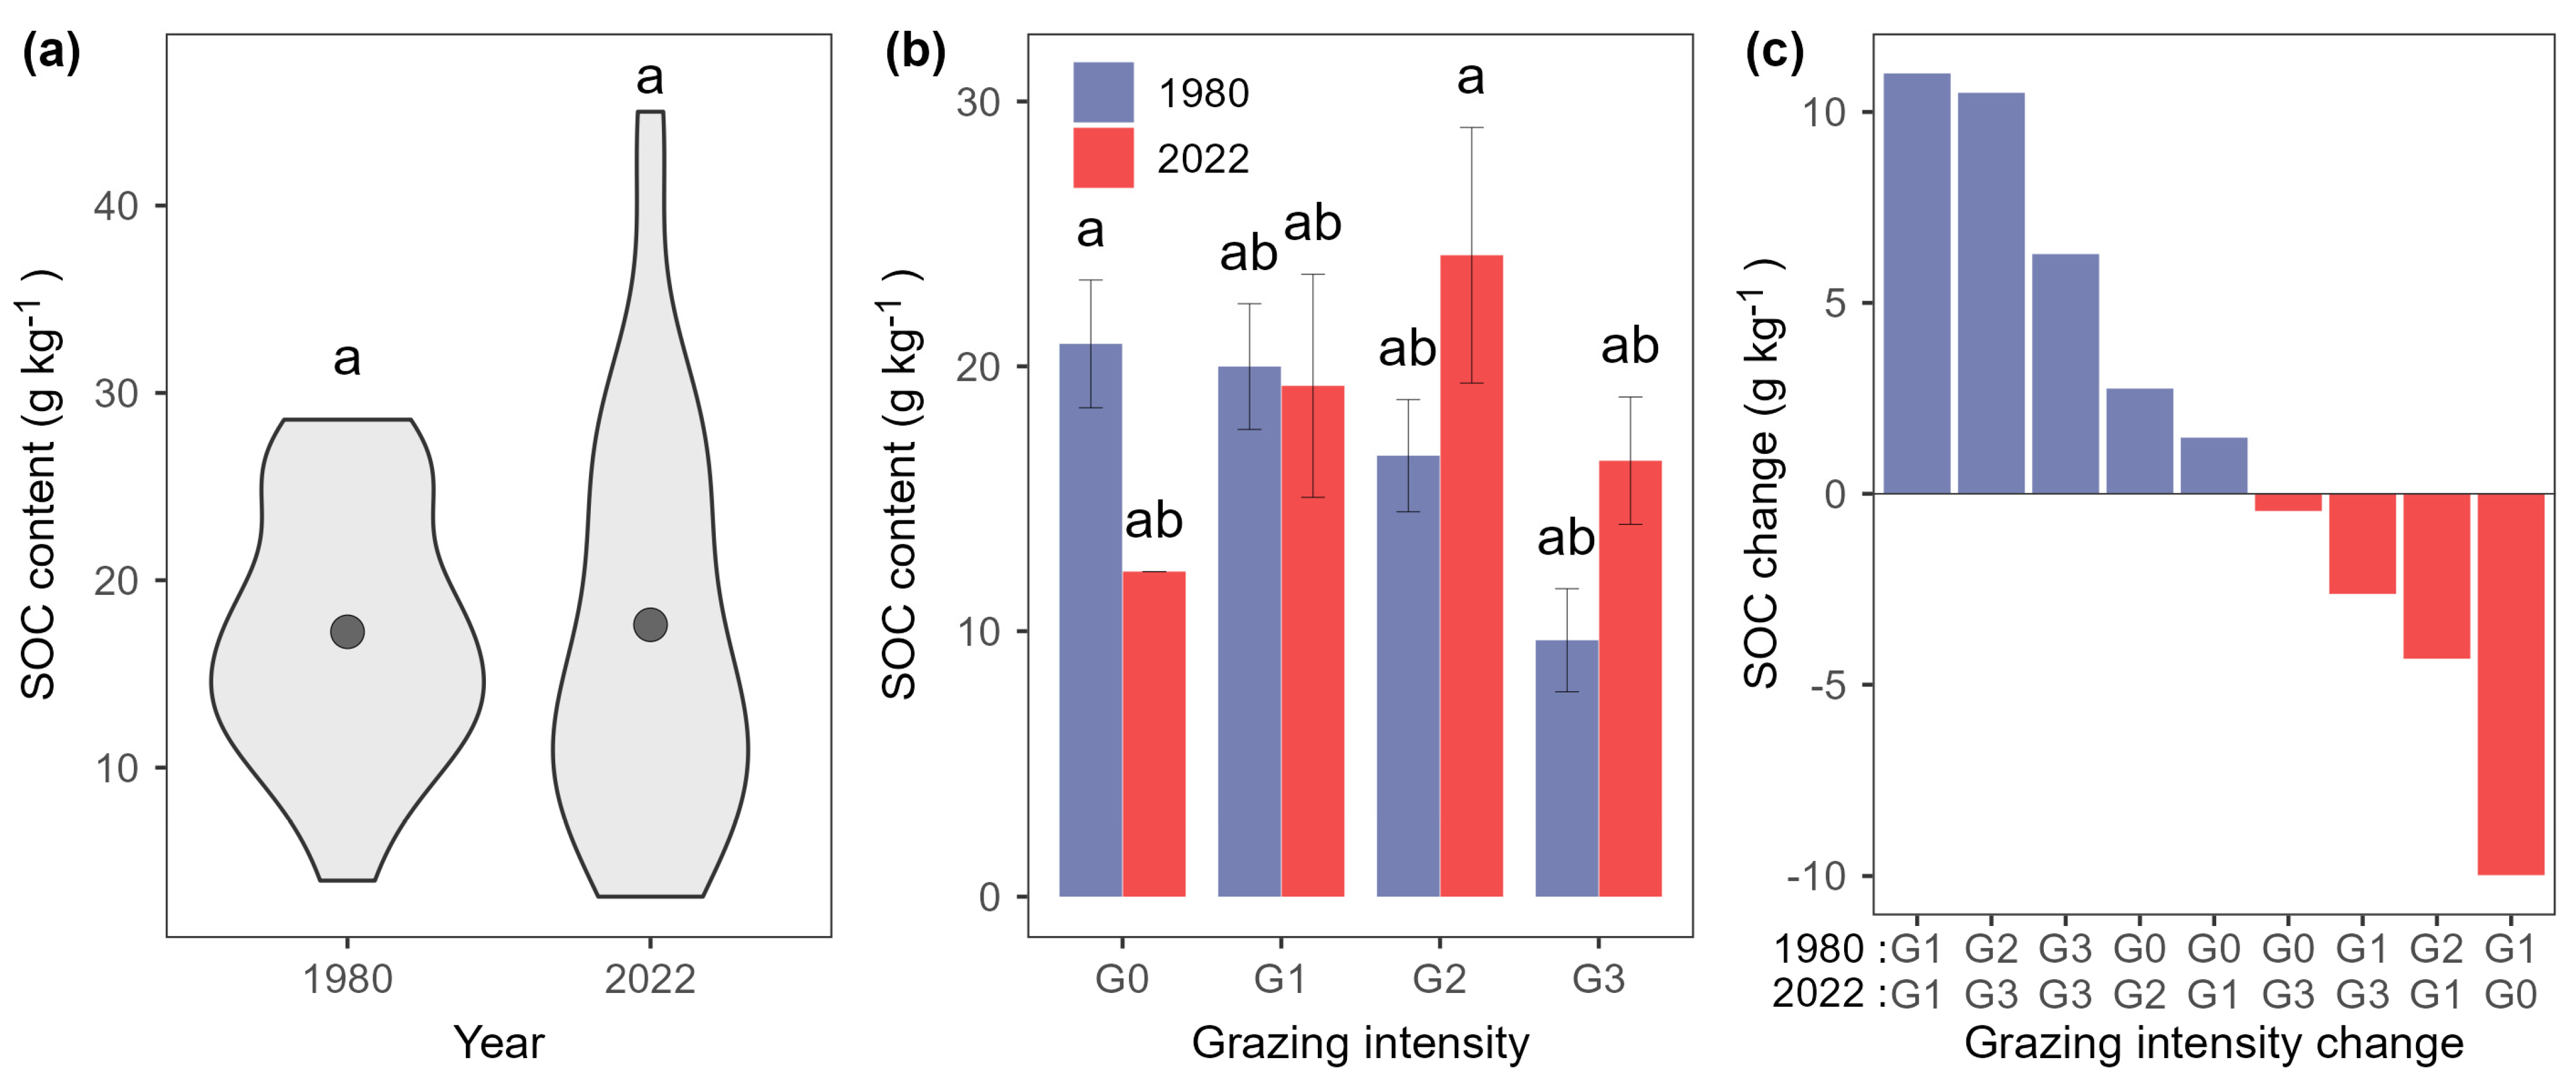
Figure 3.
Comparison of climatic conditions in Hulunber in terms of annual (a,b,e,f,i,j,m,n) and decadal means (c,d,g,h,k,l,o,p) of temperature (a–d), precipitation (e–h), potential evapotranspiration (i–l), and aridity index (m–p) between the 1980s and 2022. Soil sampling locations are marked in (a) for ease of reference.

Figure 4.
Cross correlation between soil organic carbon content (SOC) and soil (including soil bulk density and moisture content), plant (including above- and below-ground biomass), landscape (including elevation and aspect ratio), and climatic variables (including temperature, precipitation, potential evapotranspiration, and aridity index). Past climate of the last 5 and 10 years are also included. The magnitude and sign of the correlation coefficient are represented by the size and color of the filled circles, respectively. Statistically insignificant pairs are crossed out.

Figure 5.
The relative importance of climate, landscape, and management variables in accounting for the SOC variabilities. Different letters in parentheses indicate significant differences at p < 0.05.
Figure 5.
The relative importance of climate, landscape, and management variables in accounting for the SOC variabilities. Different letters in parentheses indicate significant differences at p < 0.05.

Figure 6.
Climate evolution at soil sampling locations in Hulunber from 1960 to 2022. Each thin color line represents a sampling location. The thick, red curve represents the overall trend taking all sampling locations together.
Figure 6.
Climate evolution at soil sampling locations in Hulunber from 1960 to 2022. Each thin color line represents a sampling location. The thick, red curve represents the overall trend taking all sampling locations together.

Table 1.
Grassland soil organic carbon (SOC) content of the 0–30 cm soil layer in the 1980s and 2022 per grazing intensity class. Values are mean ± standard error. Different letters in parentheses indicate significant differences at p < 0.05.
Table 1.
Grassland soil organic carbon (SOC) content of the 0–30 cm soil layer in the 1980s and 2022 per grazing intensity class. Values are mean ± standard error. Different letters in parentheses indicate significant differences at p < 0.05.
| Grazing Intensity | SOC (g kg−1) | Samples | |||
|---|---|---|---|---|---|
| 1980 | 2022 | Change | |||
| G0 | 20.85 ± 2.41 (ab) | 20.31 ± 2.18 (ab) | +0.58 ± 0.76 | 7 | |
| G1 | 19.99 ± 2.37 (a) | 21.24 ± 3.21 (ab) | −0.53 ± 3.89 | 6 | |
| G2 | 16.63 ± 2.12 (ab) | 22.48 ± 5.66 (a) | +7.54 ±5.02 | 6 | |
| G3 | 9.66 ± 1.94 (b) | 15.94 ± 3.58 (ab) | +6.28 ± 3.25 | 5 | |
| Overall | |||||
| Paired | 17.24 ± 1.38 (ab) | 19.85 ± 2.25 (ab) | +3.91 ± 1.81 | 24 | |
| Unpaired | 17.24 ± 1.38 (ab) | 17.62 ± 1.77 (ab) | +0.38 | 31 | |
Table 2.
Model performance comparison between this paper and similar SOC modeling efforts found in the recent literature. Values in parentheses are performance rankings.
Table 2.
Model performance comparison between this paper and similar SOC modeling efforts found in the recent literature. Values in parentheses are performance rankings.
| Source | Location | MAE | MAPE | RMSE | R2 | Overall |
|---|---|---|---|---|---|---|
| g kg−1 | % | g kg−1 | ||||
| This paper (Model 3) | China | 0.96 (1) | 6.41 (2) | 1.20 (2) | 0.92 (2) | (1) |
| This paper (Model 7) | China | 1.49 (3) | 16.05 (4) | 2.07 (5) | 0.93 (1) | (2) |
| Manning et al. [47] | UK | 1.17 (2) | 28.88 (5) | 1.59 (3) | 0.35 (5) | (3) |
| Smith and Waring [48] | USA | 1.68 (5) | 61.51 (7) | 0.95 (1) | 0.57 (3) | (4) |
| Wu et al. [49] | China | 1.62 (4) | 8.86 (3) | 1.66 (4) | 0.18 (6) | (5) |
| Hui et al. [50] | Mongolia | 8.48 (7) | 3.27 (1) | 12.37 (7) | 0.58 (4) | (6) |
| Zhang et al. [17] | China | 2.34 (6) | 30.51 (6) | 3.09 (6) | 0.11 (7) | (7) |
Disclaimer/Publisher’s Note: The statements, opinions and data contained in all publications are solely those of the individual author(s) and contributor(s) and not of MDPI and/or the editor(s). MDPI and/or the editor(s) disclaim responsibility for any injury to people or property resulting from any ideas, methods, instructions or products referred to in the content. |
© 2023 by the authors. Licensee MDPI, Basel, Switzerland. This article is an open access article distributed under the terms and conditions of the Creative Commons Attribution (CC BY) license (https://creativecommons.org/licenses/by/4.0/).
Share and Cite
MDPI and ACS Style
Xue, W.; Xu, L.; Nie, Y.; Wu, X.; Yan, Y.; Ye, L. Fourfold Increase in Climate Contributions to Grassland Soil Organic Carbon Variabilities and Its Policy Implications. Agronomy 2023, 13, 2664. https://doi.org/10.3390/agronomy13102664
AMA Style
Xue W, Xu L, Nie Y, Wu X, Yan Y, Ye L. Fourfold Increase in Climate Contributions to Grassland Soil Organic Carbon Variabilities and Its Policy Implications. Agronomy. 2023; 13(10):2664. https://doi.org/10.3390/agronomy13102664
Chicago/Turabian StyleXue, Wei, Lijun Xu, Yingying Nie, Xinjia Wu, Yidan Yan, and Liming Ye. 2023. "Fourfold Increase in Climate Contributions to Grassland Soil Organic Carbon Variabilities and Its Policy Implications" Agronomy 13, no. 10: 2664. https://doi.org/10.3390/agronomy13102664
Note that from the first issue of 2016, this journal uses article numbers instead of page numbers. See further details here.