Article

Characterizing Root Morphological Traits in 65 Genotypes of Foxtail Millet (Setaria italica L.) from Four Different Ecological Regions in China

1
College of Life Science, Yulin University, Yulin 719000, China
2
The UWA Institute of Agriculture, and School of Agriculture and Environment, The University of Western Australia, Perth, WA 6009, Australia
*
Author to whom correspondence should be addressed.
Agronomy 2022, 12(6), 1472; https://doi.org/10.3390/agronomy12061472
Submission received: 13 April 2022 / Revised: 13 June 2022 / Accepted: 15 June 2022 / Published: 18 June 2022

Abstract

:
As an indispensable grain crop, foxtail millet (Setaria italica L.) is becoming a functional food in China because of its abundant nutrients. However, low rainfall and uneven precipitation limit its growth and production, especially in northwest China. Understanding the root phenotypic characteristics of foxtail millet is critical for utilizing its root characteristics to breed new millet varieties with improved resource-use efficiency and better adaptation to harsh environments. The present study characterized the variability of the root morphological traits at the seedling stage of 65 millet genotypes selected from four ecological regions across seven provinces in China. The plants were assessed after 21 days of growth in the germination pouches, and 48 root and shoot traits were measured. The results showed a large variation among the genotypes in the growth and functional traits. Among the measured traits, root dry mass, maximal root length, root surface area, and root tissue density contributed the most to the principal components. Root surface area ratio and root volume ratio were significantly correlated with root length ratio, respectively, while root length density and root weight density were negatively correlated with root diameter (p < 0.01). Shoot dry mass, root number, root length, root dry mass, and total dry mass were closely correlated with each other. Root length and root surface area in each 5-cm sections decreased from the top to the bottom along the root system. Among the four ecological regions, genotypes from the early maturing area of northwest China had the greatest root length, shoot dry mass, root dry mass, and root density, while those from the early maturing area of northwest China generally had the largest root system, with about 2.2 times more root length and dry weight than those from the early maturing area of northeast China (the shortest root system). The genotypic variability in root traits and correlations among shoot and root traits form a basis for breeding new millet cultivars.

1. Introduction

In the current climate disaster scenarios, seasonal droughts induced by uneven rainfall and rapidly increasing population have highlighted food insecurity problems [1,2,3,4,5]. To cope with the increased population and to alleviate hunger, the global grain yield production must be increased by 70% [6,7]; thus, the increasing demand for food conflicts with the shortage of food [8]. In the face of such a great contradiction between supply and demand, many crops with strong resistance to environmental stress, including foxtail millet, are increasingly being planted and replanted [9]. Foxtail millet (Setaria italica L.), which has evolved from Setaria viridis L., is widely cultivated in the world, with a long history of planting [10], especially in northwest China [11,12]. Its grains are rich in a variety of trace elements and proteins [13], and it is consumed by more than half of the world’s population, especially women and children [14].
The growth of plants is strongly associated with the morphological and physiological characteristics of their roots [15,16,17]. Environmental stresses can cause big changes in the development and form of plant roots, which are the interaction point between plants and soil [18], and they significantly affect many important agronomic traits, including drought tolerance [19]. According to previous reports, at the early growth stage of corn, the grain yield was found to be closely related to the root traits [20]. The root system is the main organ used for obtaining underground resources and plays a key role in water and nutrient absorption [6,8,21,22,23,24,25]. The root is usually the most sensitive organ for sensing and responding to miscellaneous soil stresses, such as soil drought, salinity, waterlogging, and nutritional deficiency [15,26,27,28]. Under abiotic stress, crop yield can be affected by the root phenotype through changes in the metabolic efficiency of soil exploration and the redirection of roots to the soil area with the highest amount of limited resources [29,30,31]. In each crop species, investigating the association of different types of roots with the environment is the first stage of research; this includes studies on the adaptation of crop species with deep roots to drought-prone environments [32]. Adapting to the intrinsic heterogeneity of soil resources, plants can modulate their root phenotype at different comprehensive levels [20], change the relative input of aerial and root biomass at the individual level, and adjust their root structure or make changes at the organ level [21,33]. The root system promotes aerial growth, and the root tip is the most active part of the root system, which is essential for plant yield [34]. Root morphology covers basal characteristics, such as root length, root length density, diameter, surface area, and volume, all of which affect the spatial structure of the root system [35,36]. Root length, surface area, and volume affect the spatial distribution of the roots, while the root diameter is related to intense soil penetration and drought tolerance. The relationship between the size of the aboveground plant parts and the size of the roots (S/R ratio) is critical to the plant water balance. A lower S/R is more beneficial to plants in a water-deficient environment and is an important indicator for evaluating plant drought tolerance [37]. Some researchers have found a correlation between the phenotypic traits and drought resistance [38]. Root system architecture (RSA) is a relatively complex quantitative trait which differs in different environments, and it is difficult to determine the phenotype of underground roots [39,40]. Thus, relatively few studies on millet root traits have been carried out to date. Applying the genetic information of root traits and root structure to the practice of millet breeding is expected to improve its resource efficiency and stress resistance [27].
In millet, a good performance has been shown to be associated with drought resistance, but its yield remains lower than that of other cereals [36]. Research on millet root-structure characteristics would not only improve our knowledge of its agronomic traits, but also enable plant breeders to enhance its tolerance to various stress conditions [35]. The knowledge on root phenotypic diversity and the interrelationships among root traits provides guidance for follow-up research and will make better sense of these traits in order to formulate breeding strategies [41]. It is extremely important to update local millet varieties with improved adaptation to environmental stress and climate changes. However, millet root morphological traits in different ecological regions have not previously been studied. Some early studies proved the practicability of semi-hydroponic phenotypic systems under a wide variety of environments, including the field [42], and significant correlations in root traits were discovered between wheat seedlings grown on moist germination paper and field-planted wheat seedlings [43]. The present study examined the variability of root morphological traits among 65 genotypes of foxtail millet from four ecological regions of China, cultivated in seed germination pouches. The objectives of this study were to (1) assess the variations in root system architecture among a set of millet germplasm and (2) to evaluate root trait correlations among the different ecological regions. The results will provide references for millet breeders.

2. Materials and Methods

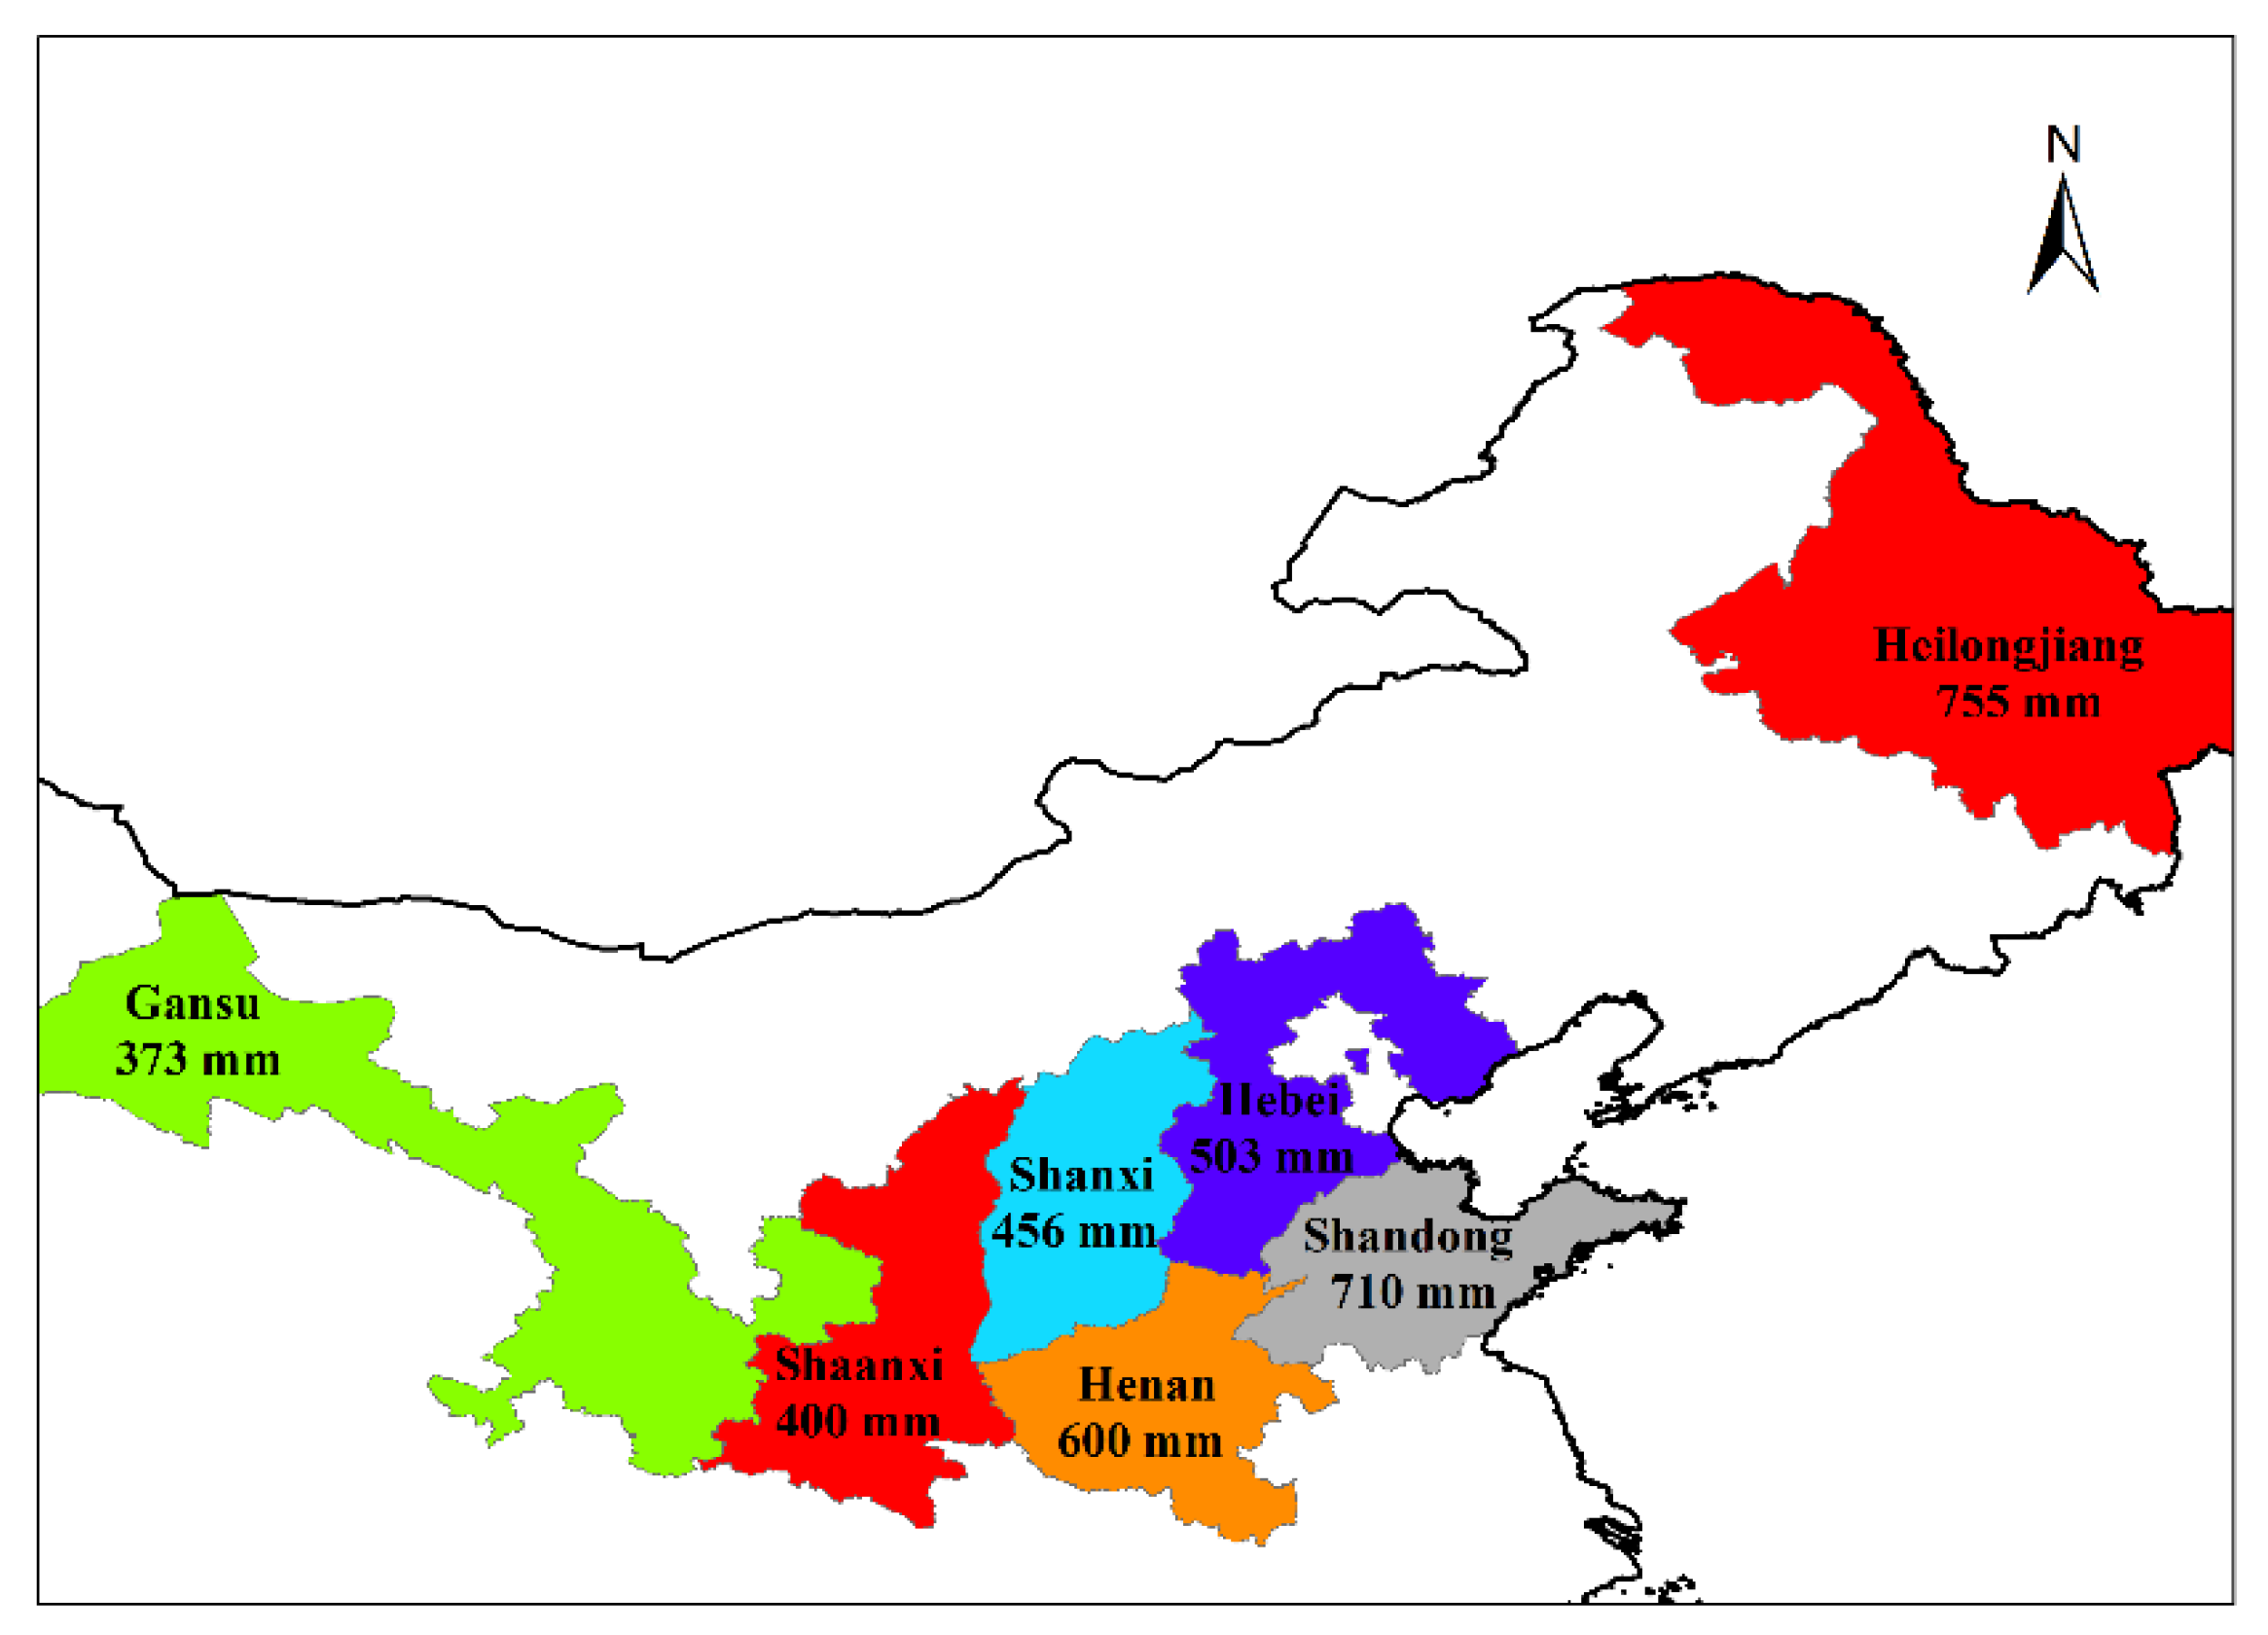
2.1. Plant Materials

Sixty-five millet genotypes were selected from seven provinces (see Figure 1 for the distribution and the average rainfall in 2020) that belong to four millet planting ecological areas in China (Table S1). In the early maturing area of northeast China, the climate is the coldest, with long hours of sunshine during the growing season and low evaporation in the spring. Moreover, the area of the early maturing northwest is characterized by low rainfall with frequent drought seasons, high evaporation in spring, a high amount of wind and sand, and low soil fertility. In the middle and late maturing areas of northwest China, millet is not sensitive to temperature because these areas are characterized by a mild climate, drought, and a long sunshine duration. The summer maturing region is characterized by low latitude, high temperature, and rainy weather, as well as a small temperature difference between day and night and few sunshine hours.

2.2. Plant Culture

An incubator cultivation experiment was implemented from December 2020 to May 2021. Millet seeds were sterilized with 3% NaClO for 20 min and germinated on moist germination paper and kept at 16 °C for 10 h in the dark, after which they were placed at 24 °C, with 30,000 Lx, and an environmental air humidity of 65% for 14 h. The seeds were then cultivated in seed germination pouches (160 × 125 mm2) with 40 mL of distilled water. Four evenly located positions were selected at the groove of the germination paper, and two seeds were planted at each position. The port was sealed with a paper clip to reduce water loss.
Each genotype was cultivated in one pouch, and there were four replications of the pouches per genotype. Ten genotypes were placed on each shelf within an incubator. On the seventh day of the growing season, two leaves were visible; the paper clips were then removed, and four seedlings were established. The rest of the distilled water was poured out, and 40 mL of 25% Hoagland’s nutrient solution was added; the position of the pouches was randomly changed daily. After a week, a fresh nutrient solution replacement was made, and the seedings were harvested on day 21 for the assessments.

2.3. Root Trait Measurements and Calculations

Leaf number, root number, root width, maximal root depth, and maximal root length were measured manually prior to the harvest. The root width, maximal root depth, and maximal root length of each plant were measured using a ruler, and the root angle was measured with a protractor.
Root width is the maximal gap between the primary and the lateral roots, and maximal root depth is the maximal vertical length from the root top to the root tip. Maximal root length is the longest root of a single plant. After manual measurements, the roots were separated from the shoots, and the roots were divided into 5 cm sections from the base for scanning. There were 3 sections in each plant. Subsamples of every 5 cm section in each pouch were placed in distilled water in a plastic tray (22 cm × 31 cm × 2 cm), and they were scanned on a grey scale at 150 dpi using a desktop scanner (Epson Perfection V800, Long Beach, CA, USA). The images were analyzed using the WinRHIZO software (Regent Inc., Quebec, QC, Canada) to determine the length, diameter, surface area, and volume of the roots. The shoot samples were deactivated in a baking oven for 20 min at 105 °C, after which all the root and shoot samples were dried at 80 °C for 48 h, and the dry weights of the roots and shoots were determined.
The first 5 cm layer of roots and the remaining part of the roots of each root system were defined as the “top-root layer” and the “sub-root layer”, correspondingly. The functional traits were calculated by the following formulae:
Root to shoot mass ratio (RSM) = root dry mass/shoot dry mass
Specific root length (SRL) = root length/root dry mass (cm mg−1)
Root growth rate (RGR) = deepest root length per plant/21 days of growth (cm d−1)
Root length density (RLD) = root length/root volume (cm cm−3)
Root weight density (RWD) = root dry mass/root volume (mg cm−3)
Root length ratio (RLR) = top-root length (0–5 cm)/sub-root length (>5 cm)
Root area ratio (RAR) = top-root area (0–5 cm)/sub-root area (>5 cm)
Root volume ratio (RVR) = top-root volume (0–5 cm)/sub-root volume (>5 cm)
Detailed descriptions of the 48 traits, including 17 global traits (three shoot traits and 14 root traits) and 31 local traits, are shown in Table 1.

2.4. Statistical Analysis

The data processing of the 48 traits (Table 1) was performed using Excel 2019. A distribution map with average rainfall in 2020 (Figure 1) was performed in ArcGIS (version 10.8, Environmental Systems Research Institute, Inc, Redlands, CA, USA). A descriptive statistics analysis was performed for minimum, maximum, medium, mean, and standard deviation; one-way analysis of variance (ANOVA, p < 0.05) was carried out with the genotypes as the variables, and the Pearson correlations of 18 traits with CV ≥ 0.2 (p < 0.05) were performed using SPSS Statistics (version 23, IBM, New York, NY, USA). The data of four replications of each genotype were calculated as means and then classified by province and ecological region, respectively. The mean values of root length in three layers and the root dry mass of each province were selected and ordered with the total root length in ascending order; the mean data of each ecological region were processed by the same method. The data of the two groups were used to draw double Y-axis column plots. The root lengths of the different layers and the biomass dry mass were plotted as stacked histograms, and the significant differences were noted. The selected 18 root traits of the genotypes were plotted as box charts (grouped by layer, ecological region, and province). The boxes were based on the median values of the defined traits by the first and third quartiles, and the individual data points that fell outside the whiskers (1.5 times the interquartile range from the median) were considered as outliers. A General Linear Model multivariate analysis was performed for the genotype and ecological region when p < 0.01. The 18 selected traits were used for principal component analysis (PCA) for both the global and the local traits to identify the determinants of the root morphological variability across the genotypes. The PCA comprehensive values were ordered in an ascending order with the ecological regions and drawn into a column plot. Cluster centers of the six identified groups were generated by a dendrogram of the agglomerative hierarchical analysis. All the figures were plotted using Origin Pro 2021b graphing packages (Origin Lab, Northampton, MA, USA).

3. Results

3.1. Variation of Root Phenotypic Characteristics at Seedling Stage

3.1.1. Global Traits
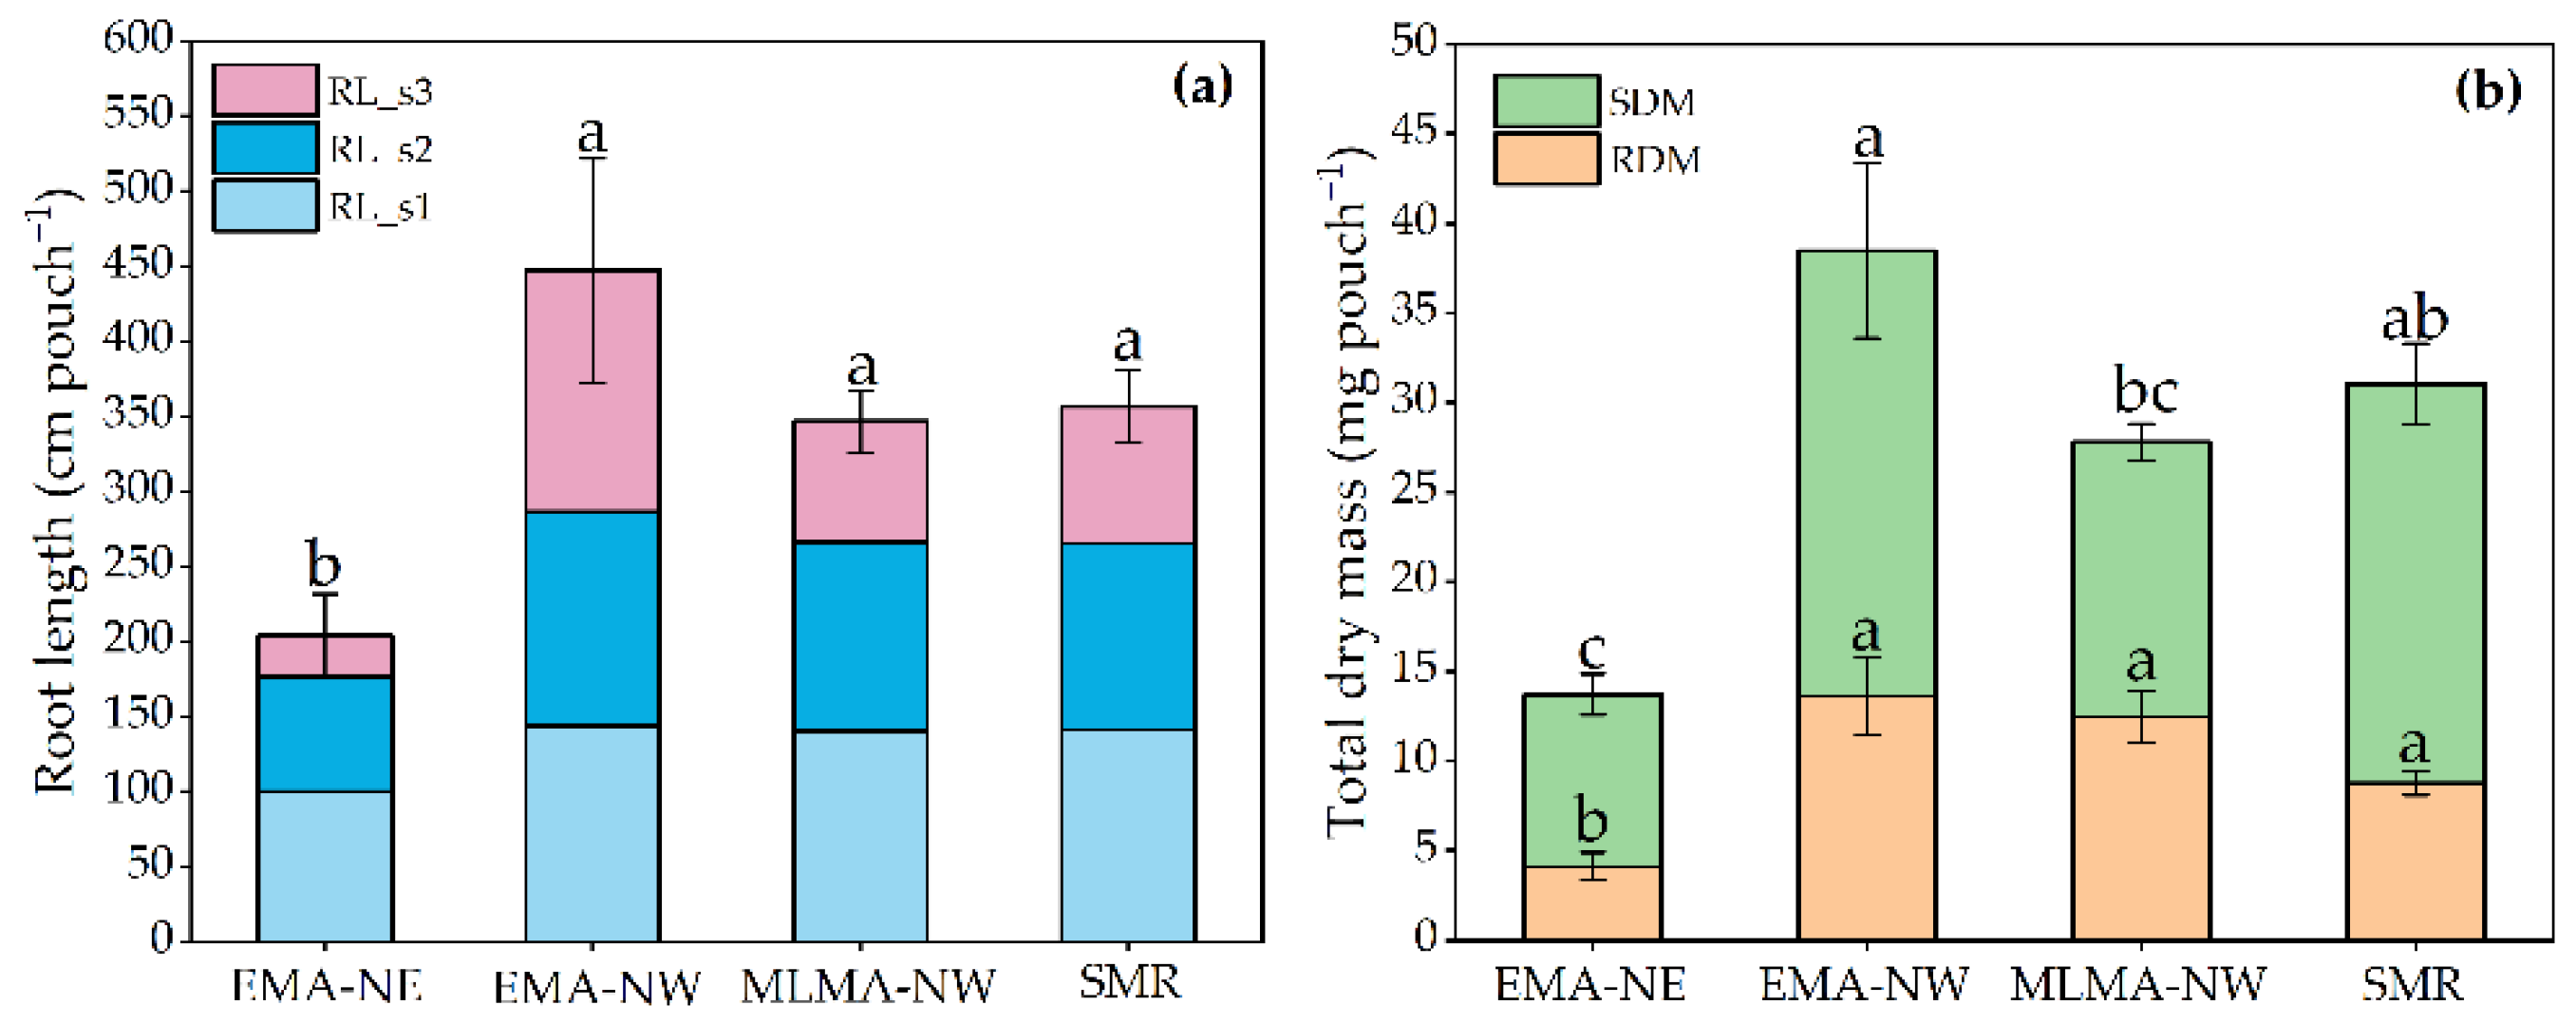
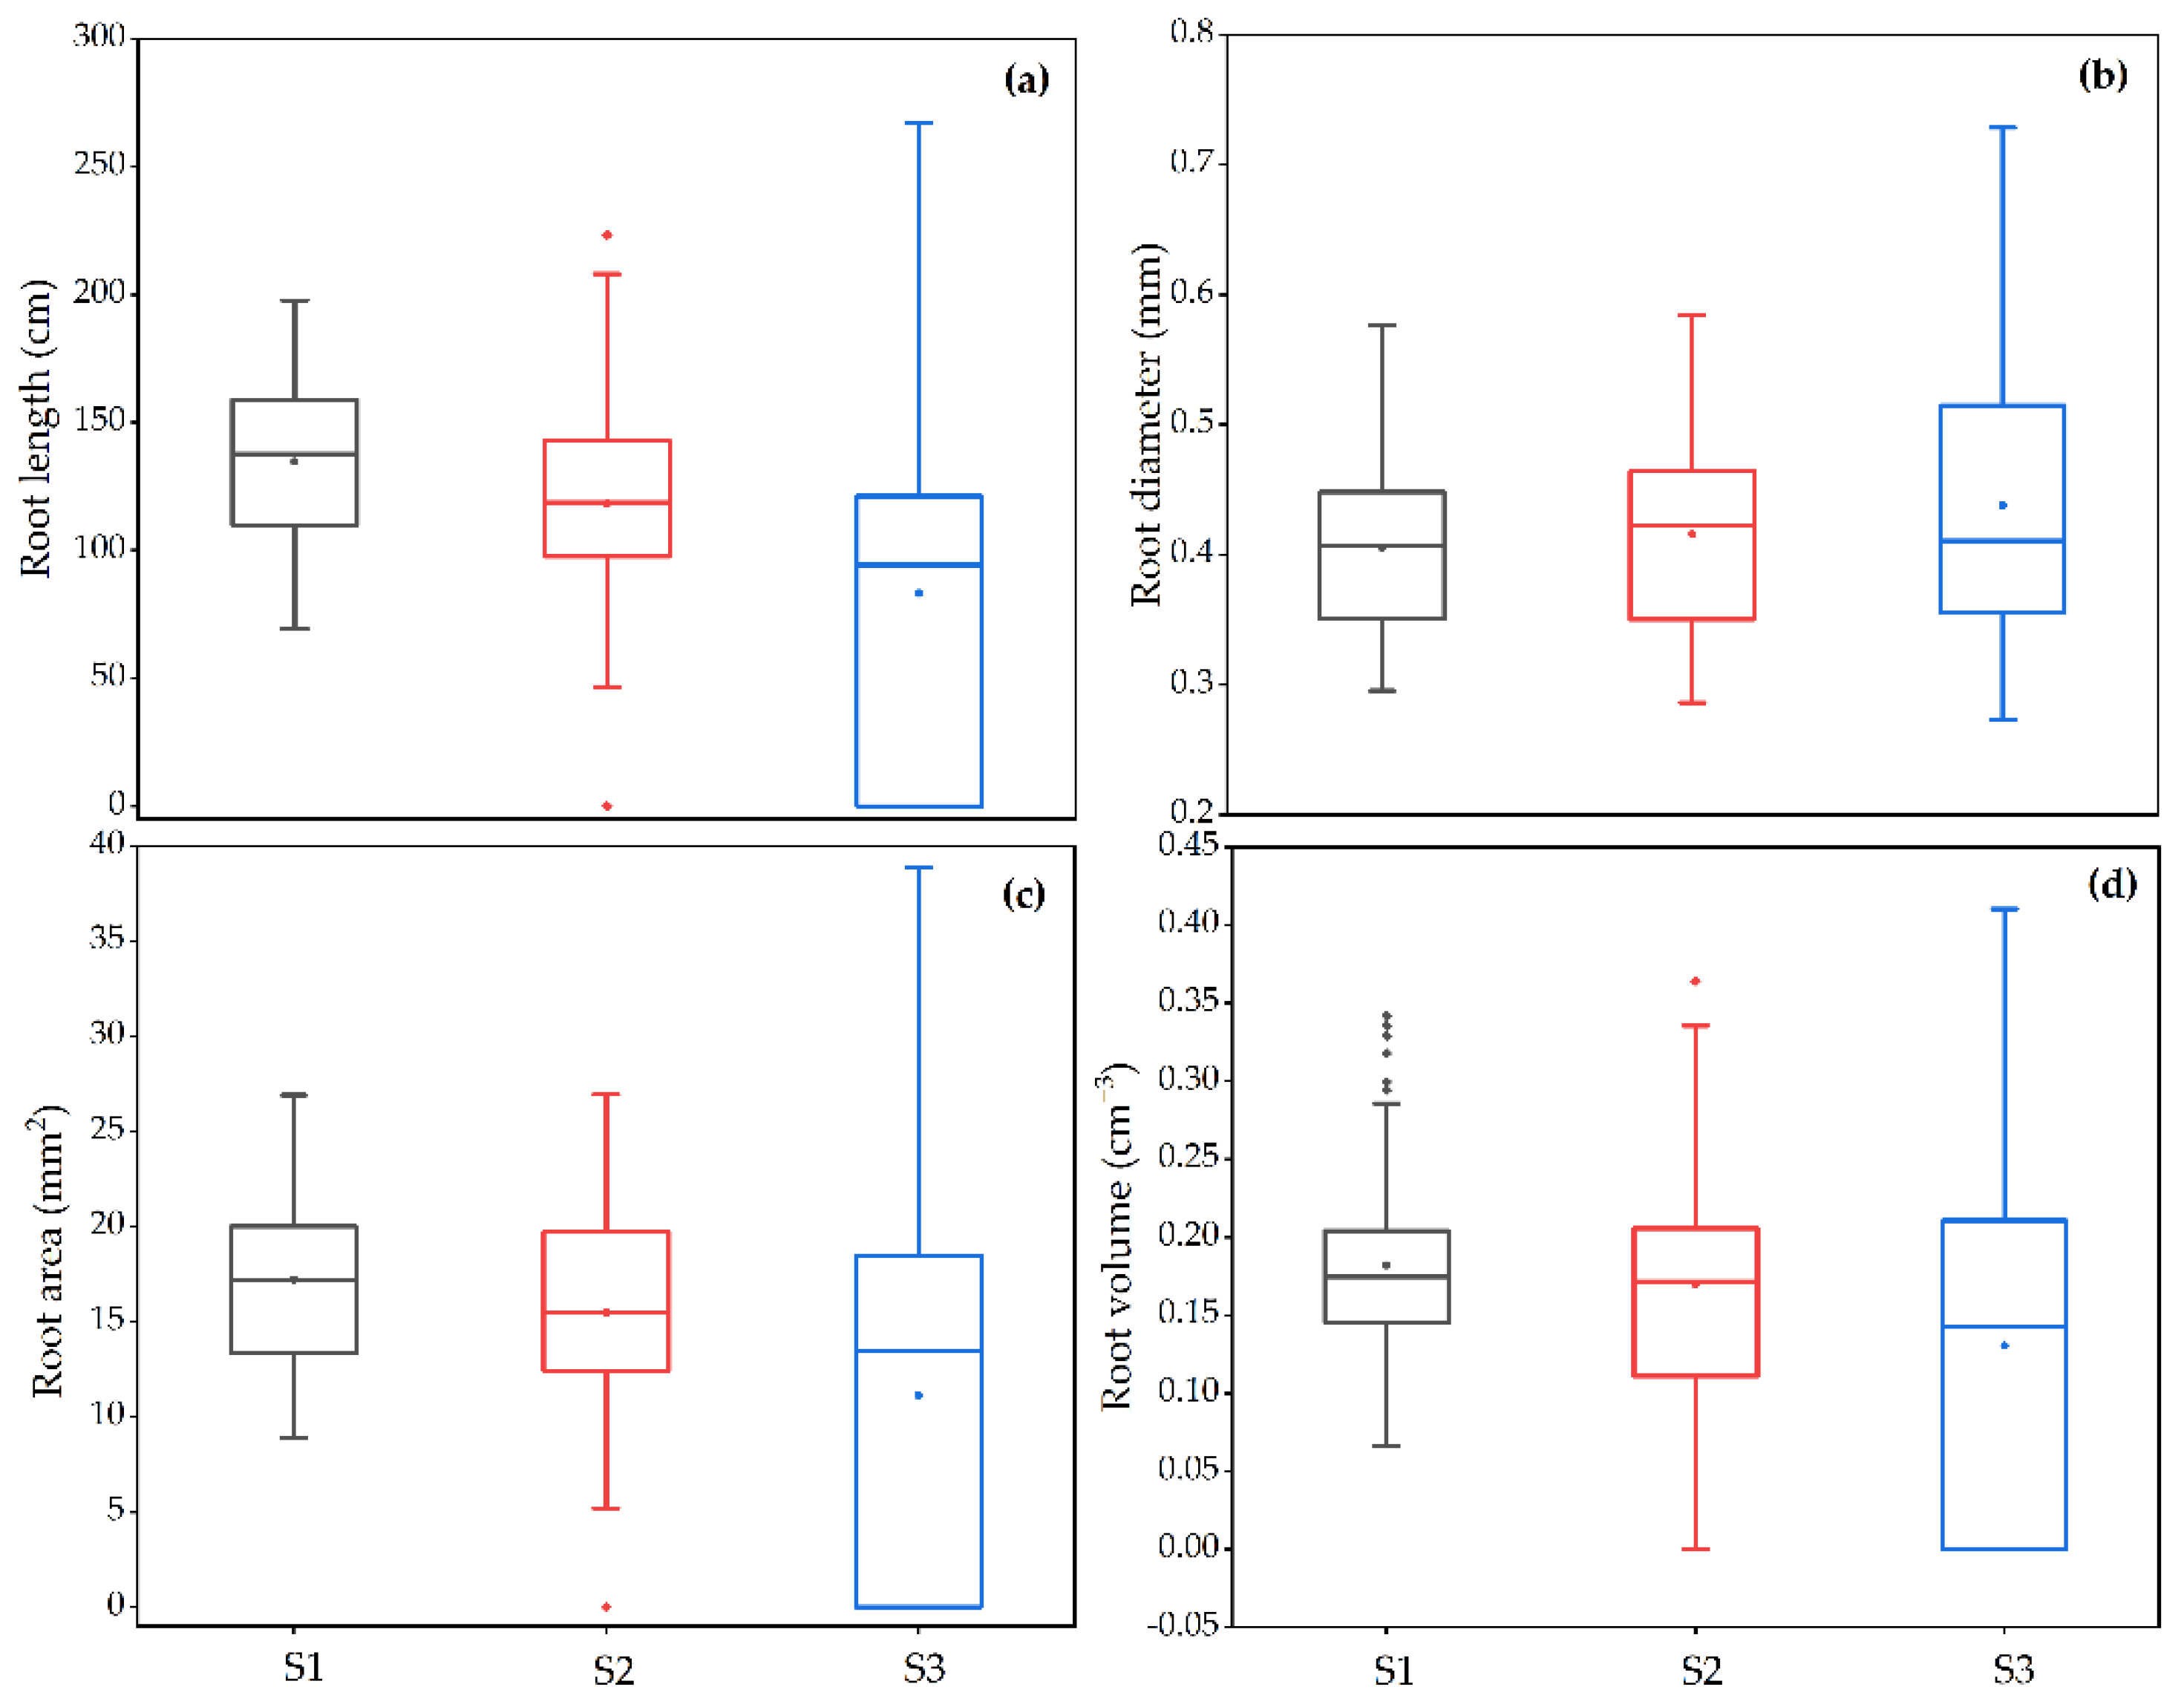
Global traits are important indicators for measuring the changes of root phenotypic characteristics among the 65 genotypes. Most of the traits were significantly different among cultivars (p < 0.05, CV ≥ 0.2; Table 2), such as root diameter (RD, CV = 0.21), maximal root length (MRL, CV = 0.22), root number (RN, CV = 0.23), and leaf number (LN, CV = 0.24).
After 21 days of planting, the total root length (TRL) of 8 genotypes was less than 200 cm; that of 40 genotypes was between 200 and 400 cm; that of 15 genotypes was between 400 and 600 cm; and that of 2 genotypes was greater than 600 cm (Figure 2). Maximal root depth (MRD) was 11.13 cm (18#); root growth rate (RGR) ranged from 0.04 cm per day (33#) to 0.74 cm per day (18#); and root width (RW) ranged from 1.5 cm to 14.5 cm (mean value 7.36 cm).Root length (RL) ranged from 69.4 cm to 779 cm pouch−1 (mean value 338 cm), and total root dry mass (RDM) ranged from 0.1 mg to 32.03 mg (mean value 9.83 mg). YuGu 11 (44#), from the summer maturing region, had the longest RL (778.97 cm), whereas LongGu 26 (#38), from the early maturing area of northeast China, had the shortest RL (69.37 cm). The RDM of Nong 2019 (11#), from the mid-late maturing region in northwest China, was the highest (32.03 mg pouch−1) and that of LongGu 39 (33#), from northeast China, was the lowest (0.1 mg pouch−1). At the same depth among the root layers, the roots varied greatly between genotypes and ecological regions. Among the seven provinces, the genotypes in Heilongjiang and Hebei had the shorter RLs. Gansu and Henan had longer RLs, while Shaanxi and Shanxi had the higher RDM (Figure 2a).
The root system was large in the genotypes from the early maturing area of northwest China (mean value 447 cm pouch−1) and small in the genotypes from the early maturing area of northeast China (mean value 204 cm pouch−1) (Figure 3), the largest one being 2.2 times greater than the smaller. The TDM in the maturing area of northwest China was the highest (mean value 38.5 mg pouch−1) and that in the early maturing area of northeast China was the lowest (mean value 13.7 mg pouch−1). The root length density (RLD) ranged from 383 cm cm−3 to 1469 cm cm−3 (mean value 770.6 cm cm−3). The root length ratio (RLR) ranged from 0.31 to 1.95, showing that there were different root distributions and morphological patterns among the 65 genotypes. The root diameter (RD) ranged from 0.25 mm to 0.66 mm (mean value 0.42 mm). The specific root length (SRL) ranged from 4.0 cm mg−1 (38#, LongGu 26) to 78.3 cm mg−1 (33#, LongGu 39), with a mean value of 38.7 cm mg−1, and the genotypes from the early maturing area of the northwest China genotype had low a SRL (Figure S1).

3.1.2. Local Traits

Some local root traits had a CV value higher than 0.2, and the local traits of the genotypes in Section 1 had lower CV values than those in the other sections (Table 2). The results showed that the RL, RDM, RV, RLD, surface area (RA), and weight density (RWD) of the genotypes in Section 2 and Section 3 were significantly different from those in the other sections, indicating that the difference in the root traits of the different genotypes is closely related to the depth of the root. Affected by the traits in Section 1, the root length ratio (RLR), root surface area ratio (RSAR), and root volume ratio (RVR) were also significantly different in all the local traits.

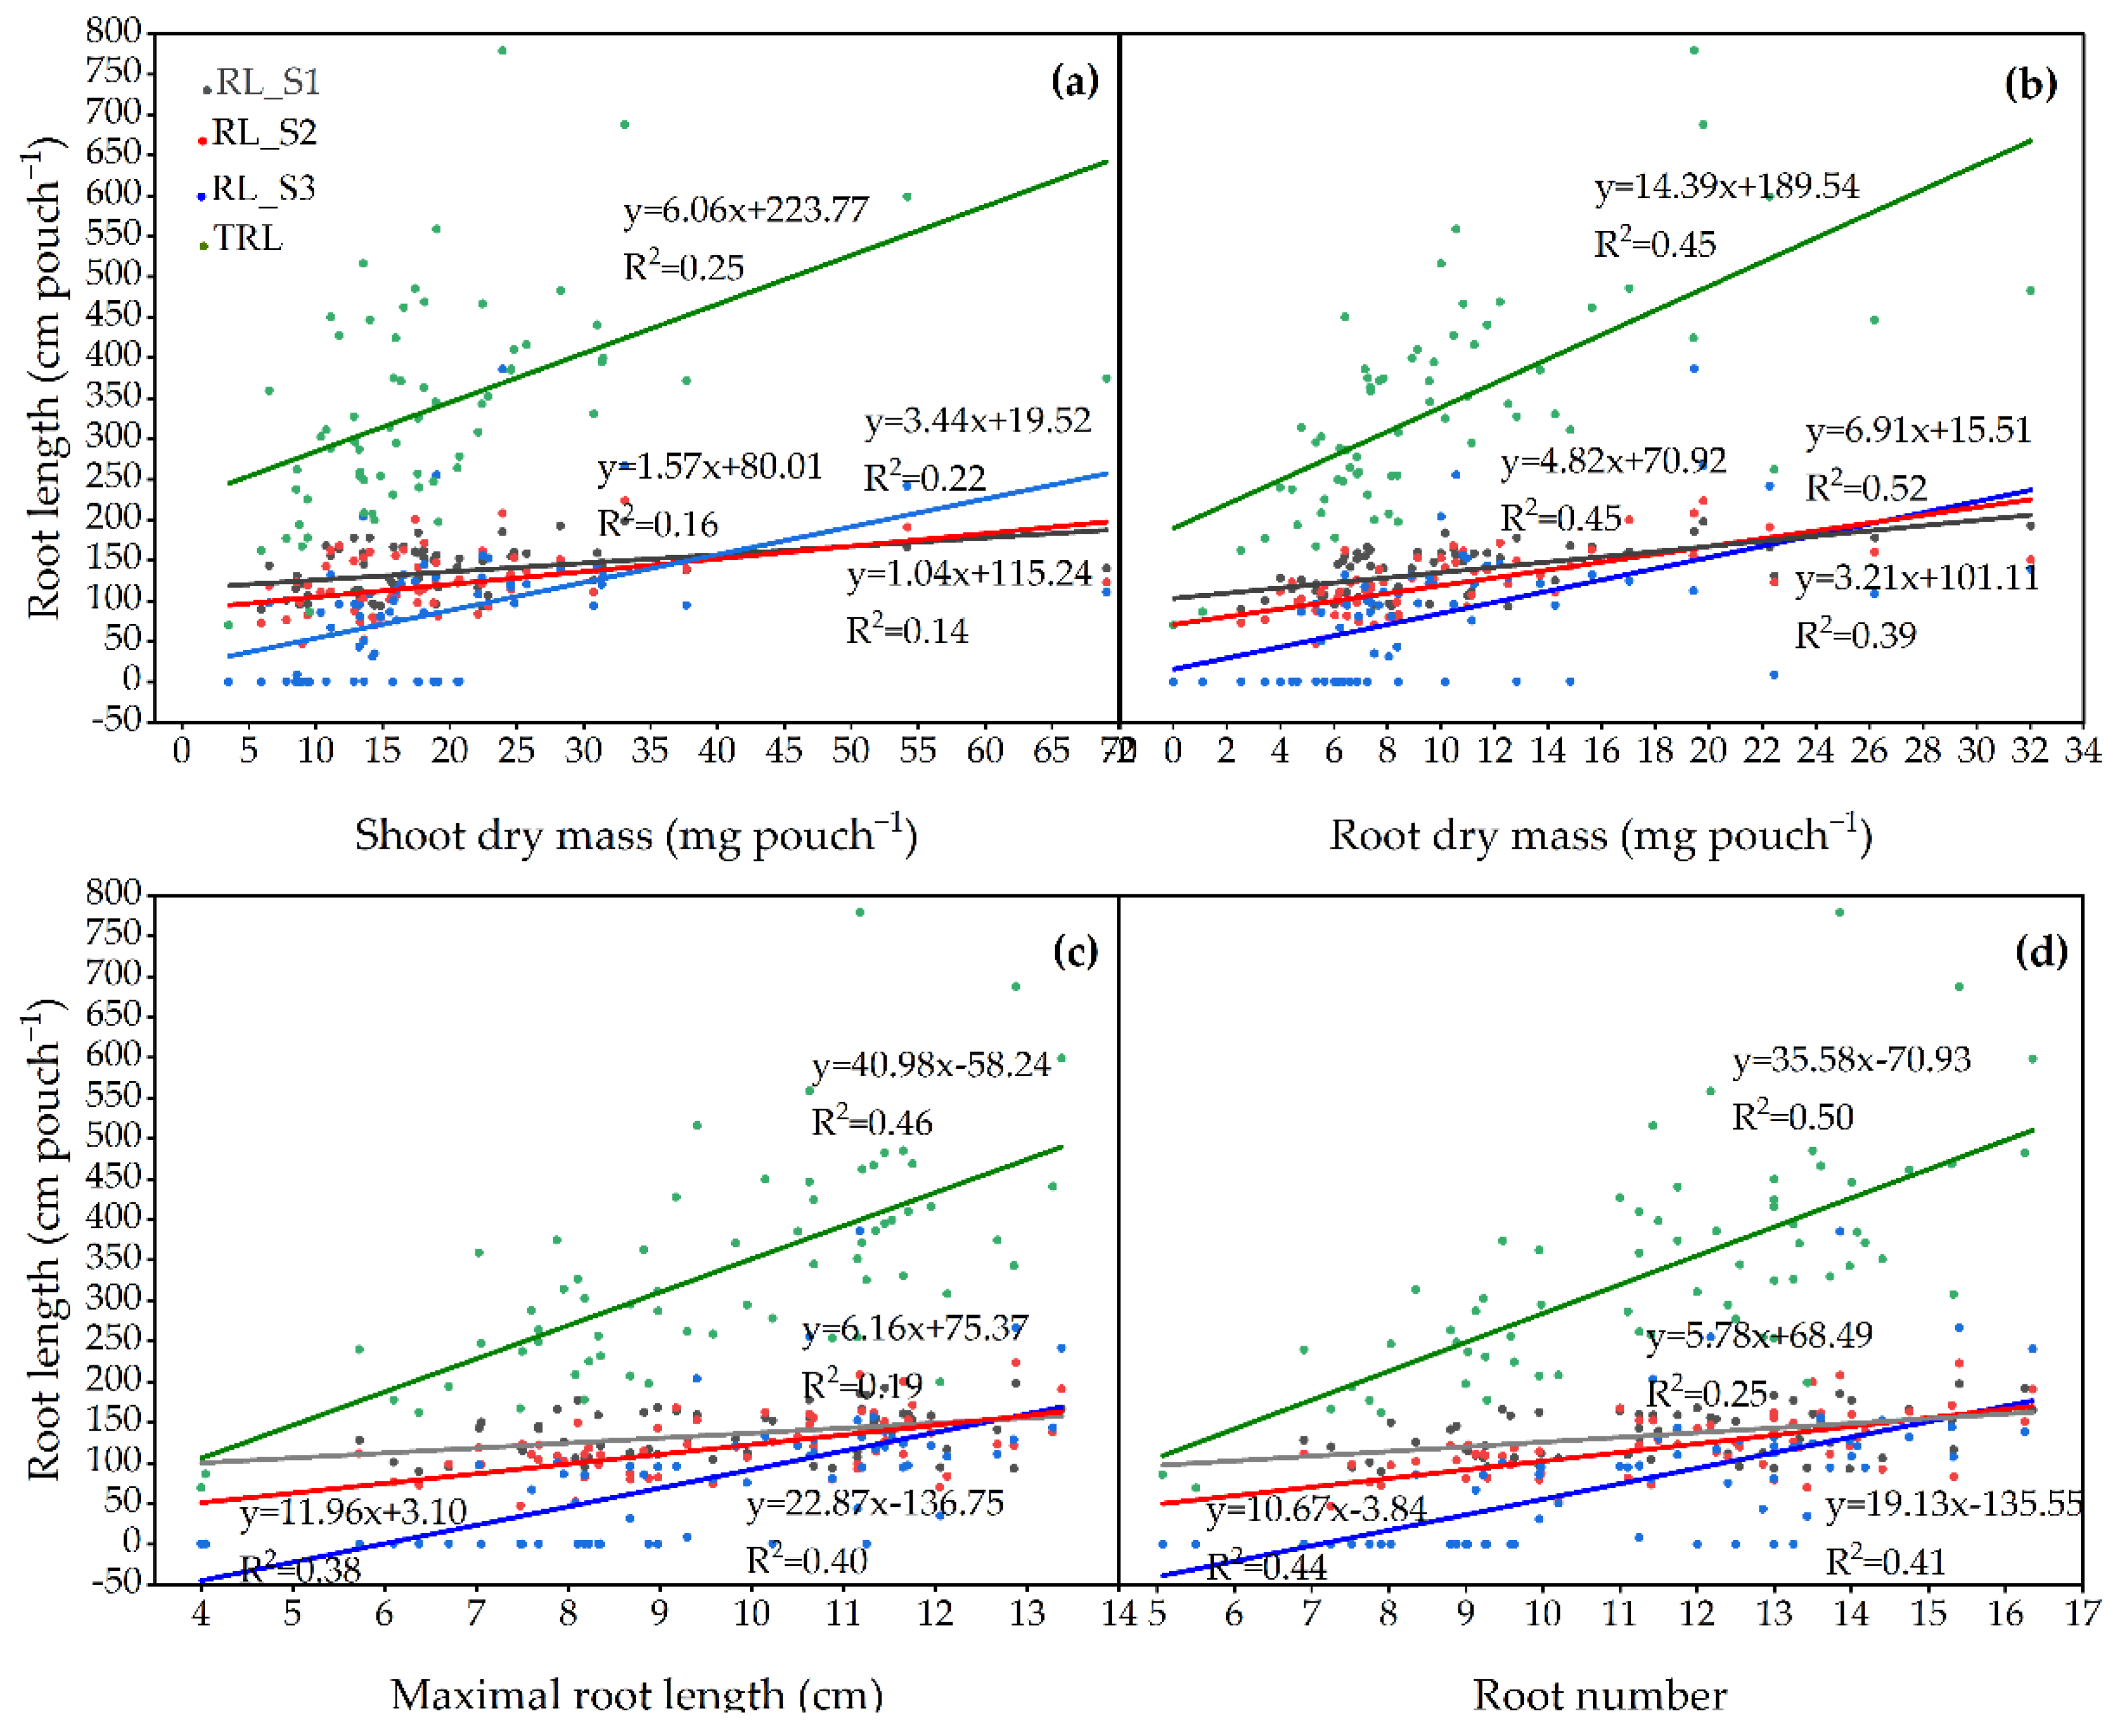
3.2. General Variation and Correlation among Traits

Forty-three traits were significantly different among the 65 genotypes (p < 0.01), and 45 traits had CV values higher than 0.2. Forty-four traits had greater variation (p < 0.05, CV ≥ 0.2) in the global traits of root morphology (Table 2). RL, RA and RV decreased, while RD increased from top to bottom in the three layers (Figure 4). The RLs in the s1 (0–5 cm), s2 (5–10 cm), and s3 layer (>10 cm) were 1345, 118, and 86 cm, respectively (Table 2). The differences in RDM, shoot dry mass (SDM), SRL, and RL were significant among the four ecological regions (Figures S1 and S2), as also shown in the seven provinces (Figure S3).
Out of the 48 investigated traits, 18 traits with higher coefficients of variation (CV ≥ 0.2) were selected to perform the Pearson correlation analysis (Table S2). Sixteen traits were correlated with each other (p < 0.01). RL was strongly correlated with SDM (R2 = 0.25, p < 0.01, Figure 5a), RDM (R2 = 0.45, p < 0.01, Figure 5b), MRL (R2 = 0.46, p < 0.01, Figure 5c), and root number (RN) (R2 = 0.5, p < 0.01, Figure 5d). The RL in each layer also had significant correlations with SDM, RDM, MRD, and RN (p < 0.01, Figure 5). The root length ratio (RLR) was positively correlated with the root surface area ratio (RSAR) (R2 = 0.96, p < 0.01, Figure 6a) and the root volume ratio (RVR) (R2 = 0.81, p < 0.01, Figure 6b). RD was negatively correlated with RLD (R2 = 0.86, p < 0.01, Figure 6c) and RWD (R2 = 0.54, p < 0.01, Figure 6d). RDM was positively correlated with RSR (R2 = 0.46, p < 0.01, Figure S4a) and TDM (R2 = 0.47, p < 0.01, Figure S4b).

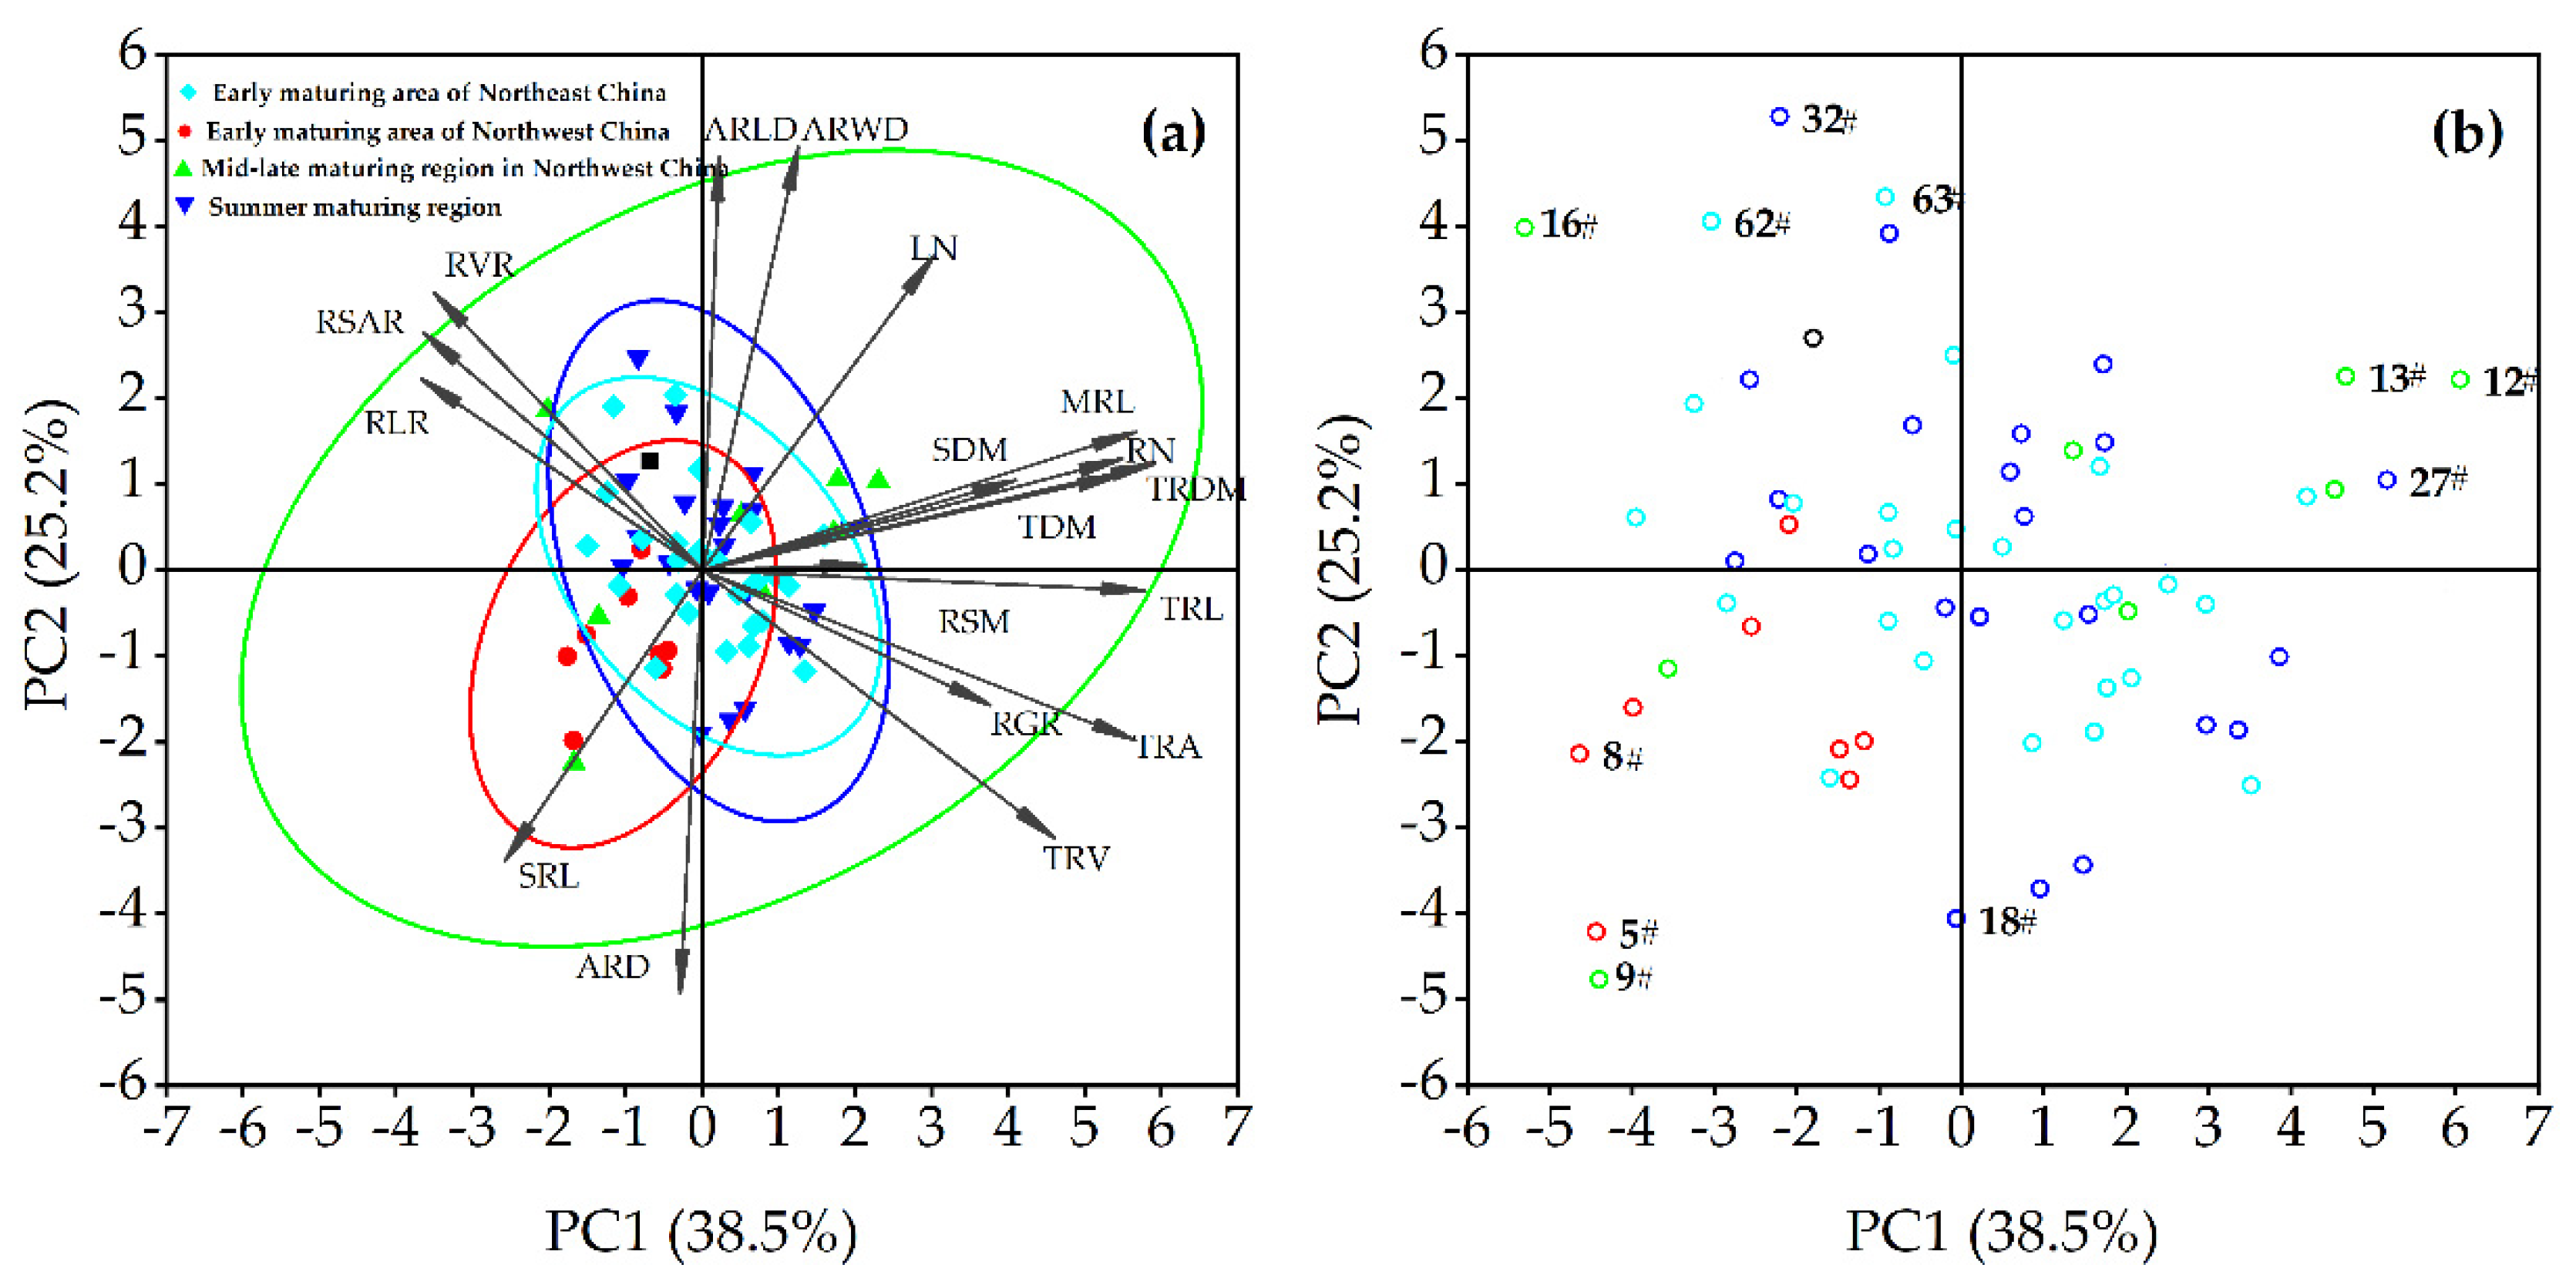
3.3. Principal Component Analysis of Selected Traits

A principal component analysis (PCA) of the 18 selected traits (p < 0.05, CV ≥ 0.2) was performed (Figure 7a), and it revealed that four principal components have eigenvalues greater than 1, which captured 86.6% of the variability (Table 3). Among the global traits, SDM, MRL, RN, RDM, and TDM were strongly associated with the ecological regions; meanwhile, RLR, RSAR, and RVR were strongly affected by the ecological regions (Figure 7a). Four traits, namely MRL, TRDM, RA, and root tissue density (RTD), made the greatest contribution to the PCA. In PC1 and PC2 of the PCA, the marginal cultivars had larger deviations from the mean values; they possibly had special traits and will be used for further research (Figure 7b). The PCA of seven local traits on the top layer accounted for 59.7% for PC, and the sub-layer accounted for 50.5% for PC (Figure 8). The composite values of the PCA were arranged from largest to smallest by ecological region (Figure S5); the varieties with higher composite values in each ecological region will be selected for future drought-stress studies.

3.4. Genotypic Population Identification Based on the Selected Traits

Sixty-five millet genotypes with 18 selected traits were separated into three main branches at a rescaled distance of 80, using the Euclidean mean distance method as the mileage pacer trigger (Figure S6). They were further separated into six groups when a rescaled distance of 60 was used. Group 1 included three groups with almost half of the genotypes (32 genotypes, 49.2%); group 2 included three groups of 17 genotypes (26.2%); group 3 included only one group with two cultivars (10# and 11#); group 4 included two groups with nine genotypes; and group 5 included two groups of four cultivars and one (20#) genotype, followed by group 6. The most striking observation to emerge from the data comparison was that the genotypes from the same province or ecological region were not put together in a group.

4. Discussion

Recently, the interest in root structure affecting crop yields to improve food security has been increasing [30,32,44,45]. In many ecosystems, air dehydration precedes soil dehydration [46]. Usually, the shoots of the plant are first exposed to reduce the water potential, after which the environment around the root system becomes increasingly arid [47,48]. In wheat, root biomass has been shown to decrease at high soil temperatures [49], and a deeper and more effective root system has been shown to be essential for absorbing more water from the soil and for significantly increasing wheat yield under drought stress [39,50,51]. Root growth is dynamic and spatially and temporally heterogeneous [52]; therefore, the changes in root structure depend on the environment [42]. The germination and the seedling growth of plants are necessary stages for the growth of plant populations [53,54]. During seedling development, plant functional traits can rapidly respond to altered environments; for example, the depth of the plant roots affects the ability of the ecosystem to recover from drought stress [55]. Deep roots link the deep soil and groundwater to the atmosphere, further affecting the hydrological cycle and climate [40]. Water and nutrient acquisition are closely related to these measured root traits [56] of MRD [57], RL, RDM, and RLD in the three layers [26,44,58]. Therefore, it is very important to study the root system to improve the stress resistance and yield of plants [59].
In the present study, the traits of millet from the four ecological regions showed different performances. Millet cultivars from the early maturing area of northwest China had the greatest RL, RDM, SDM, and TDM (Figure 2). RL is an indicator of a plant’s yield potential [60]. Root size, length, and architecture could improve water uptake, which were associated with increased drought tolerance in crop plants [61,62]. The RL and RDM were about two-fold higher than those in the cultivars from the early maturing area of northeast China. A moderate water deficit can promote the increase in root and shoot dry mass [63]; meanwhile, a plant will pass on the characteristics of a larger root system to the next generation and obtain higher yields [37,64]. The correlation coefficient between the RN and RL of the same root type, as well as among the RL, RV, and RA in hydroponics [65], was high, which is in line with those of previous studies [66]. A strong positive correlation was observed between RLR and the root ratio (RSR and RVR, Figure 6a,b), which illustrated that the root in the top and sub-layers had similar trends of RL, RA, and RV (Figure 4a,c,d). The high correlations between RDM, RSM, and RL indicated that root changes affect the ratio of aboveground and underground biomass, which is an important manifestation of a plant’s response to environmental stress [67].
The root system architecture (RSA) is systematically shaped by the diversity of characteristics of a species and the evolutionary processes [65]. The longer RL and the greater RA indicate that the ability of a root to obtain nitrogen from the soil profile increased [68]. This study came to the same conclusion: millet cultivars from the early maturing area of northwest China had the largest RL among all the regions (Figure 3), which was significantly positively correlated with RA (R = 0.901, p < 0.01, Table S2). SRL reflects the absorption capacity of roots per unit of biomass input and is also a measure of root thickness, and thus, it is considered to be one of the most important traits affecting the exploitation and uptake of water and nutrients, taking into account the economic cost of root establishment [69,70,71]. In a field experiment, it was found that genotypes with lower SRL, from a 0–60 cm depth, produced higher yields, suggesting that thicker roots in the topsoil represent a favorable feature for obtaining deep water in soil [72,73]. Millet cultivars from the early maturing area of northwest China had low SRL (Figure S1c), which could be associated with high yield. Future studies will validate these genotypes in the field conditions.
Root diameter is a powerful predictor of penetration strength in hard soils, and greater RD may result in greater hydraulic conductivity [74]. A comparison of the findings with those of other studies confirms that RD was negatively correlated with root density (RLD and RWD, Figure 6c,d). The cultivars from different ecological regions showed some variation, reflecting the potential for their ecological and climatic linkage and the need for further research. Mild water stress can expand the root system and improve RWD and RLD. The development of longer roots and higher dry weights in the upper soil saves irrigation water [63]. Moreover, water deficiency leads to the redistribution of carbon during root growth, as well as a decrease in RLD in the topsoil layer, but an increase in RL. Thus, RLD is the key factor for assessing the amount of nutrients and water absorbed by the root system per unit volume and is an important symbol of the drought-tolerant varieties [75]. Drought treatments can increase the density of roots in deep soil; however, the pearl millet with deep roots cannot grow well in a moist environment [37,76].
Because the growth of a field plant is irreversible, the root morphology and topological structure encode traits derived from “morphological memory” and provide clues to unlock the secrets of the plant–environment interaction [30,77,78]. The exploration of 65 millet genotypes at the seedling stage did not allow us to classify them by root diameter due to the smaller differences in this factor. However, there are still some limitations in transforming the phenotype data obtained from hydroponic systems at the early stage into field conditions in the breeding programs. Modern root imaging technology and root modeling simulations could provide efficient tools to assist in root phenotyping studies in different environments.

5. Conclusions

The root system morphological traits of foxtail millet at the seedling stage from different ecological regions differed significantly. Millet cultivars from the early maturing area of northwest China had the largest root systems (root length, shoot dry mass, root dry mass, and root density), while those from the early maturing area of northeast China had the smallest root systems. The outcomes of this study will facilitate our follow-up studies on the response of millet to drought and other abiotic stresses for improved grain yield under field conditions.

Supplementary Materials

The following supporting information can be downloaded at: https://www.mdpi.com/article/10.3390/agronomy12061472/s1, Figure S1: Variations of root and shoot phenotypes among the 4 ecological regions, Figure S2: Variations of root phenotypic among the 4 ecological regions, Figure S3: Variations of root and shoot phenotypes traits in the 7 provinces, Figure S4: Linear fitting of root phenotypes, Figure S5: Comprehensive values of 18 selected traits, Figure S6: Dendrogram of agglomerative hierarchical clustering (AHC) of 18 selected root traits, Table S1: Cultivar, origin, seed provider, ecological region of 65 millet genotypes, Table S2: Pearson’s correlation matrix for 18 selected traits of 65 millet genotypes.

Author Contributions

Conceptualization, J.Y. and Y.C.; methodology, X.Y., J.Y. and Y.C.; software, X.Y.; formal analysis, Q.T.; data curation, X.Y. and Q.T.; writing—original draft preparation, X.Y. and Q.T.; writing—review and editing, Y.C. and J.Y.; supervision, J.Y.; funding acquisition, J.Y. All authors have read and agreed to the published version of the manuscript.

Funding

This research was funded by the National Natural Science Foundation of China, 31960223; the Key Research and Development Program of Shaanxi Province, 2021NY-101; and the Science and Technology Program of the Yulin Science and Technology Bureau, CXY-2020-100.

Data Availability Statement

Not applicable.

Acknowledgments

We gratefully acknowledge Ling Qin of Shandong Academy of Agricultural Sciences; Zhijiang Li of Heilongjiang Academy of Agricultural Sciences; Miao Jing of Yulin Academy of Agricultural Sciences, who provided seed materials for this study. We also acknowledge Rui Liu, Mengjia Zhang, Zexu Zhou, and Yu Li for their assistance with sample measurement.

Conflicts of Interest

The authors declare no conflict of interest.

References

  1. Puccio, G.; Ingraffia, R.; Giambalvo, D.; Amato, G.; Frenda, A.S. Morphological and physiological root traits and their relationship with nitrogen uptake in wheat varieties released from 1915 to 2013. Agronomy 2021, 11, 1149. [Google Scholar] [CrossRef]
  2. Liu, M.; Qiao, Z.; Zhang, S.; Wang, Y.; Lu, P. Response of broomcorn millet (Panicum miliaceum L.) genotypes from semiarid regions of China to salt stress. Crop. J. 2015, 3, 57–66. [Google Scholar] [CrossRef] [Green Version]
  3. Zhang, M.; Yang, L.; Hao, R.; Bai, X.; Wang, Y.; Yu, X. Drought-tolerant plant growth-promoting rhizobacteria isolated from jujube (Ziziphus jujuba) and their potential to enhance drought tolerance. Plant Soil 2020, 452, 423–440. [Google Scholar] [CrossRef]
  4. Das, R.R.; Vinayan, M.T.; Seetharam, K.; Patel, M.; Phagna, R.K.; Singh, S.B.; Shahi, J.P.; Sarma, A.; Barua, N.S.; Babu, R.; et al. Genetic gains with genomic versus phenotypic selection for drought and waterlogging tolerance in tropical maize (Zea mays L.). Crop. J. 2021, 9, 1438–1448. [Google Scholar] [CrossRef]
  5. Yan, J.; Liu, P. Does complex soil enhance grain yield under cropping system? Agronomy 2021, 11, 1502. [Google Scholar] [CrossRef]
  6. Saenz Rodriguez, M.N.; Cassab, G.I. Primary root and mesocotyl elongation in maize seedlings: Two organs with antagonistic growth below the soil surface. Plants 2021, 10, 1274. [Google Scholar] [CrossRef] [PubMed]
  7. Al Azzawi, T.N.I.; Khan, M.; Hussain, A.; Shahid, M.; Imran, Q.M.; Mun, B.G.; Lee, S.U.; Yun, B.W. Evaluation of Iraqi rice cultivars for their tolerance to drought stress. Agronomy 2020, 10, 1782. [Google Scholar] [CrossRef]
  8. Burridge, J.D.; Rangarajan, H.; Lynch, J.P. Comparative phenomics of annual grain legume root architecture. Crop. Sci. 2020, 60, 2574–2593. [Google Scholar] [CrossRef]
  9. Ramirez-Villegas, J.; Molero Milan, A.; Alexandrov, N.; Asseng, S.; Challinor, A.J.; Crossa, J.; van Eeuwijk, F.; Ghanem, M.E.; Grenier, C.; Heinemann, A.B.; et al. CGIAR modeling approaches for resource-constrained scenarios: I. Accelerating crop breeding for a changing climate. Crop. Sci. 2020, 60, 547–567. [Google Scholar] [CrossRef] [Green Version]
  10. Zhang, W.; Zhi, H.; Tang, S.; Zhang, H.; Sui, Y.; Jia, G.; Wu, C.; Diao, X. Identification of no pollen 1 provides a candidate gene for heterosis utilization in foxtail millet (Setaria italica L.). Crop. J. 2021, 9, 1309–1319. [Google Scholar] [CrossRef]
  11. Yang, Y.; Jia, G.; Deng, L.; Qin, L.; Chen, E.; Cong, X.; Zou, R.; Wang, H.; Zhang, H.; Liu, B.; et al. Genetic variation of yellow pigment and its components in foxtail millet (Setaria italica (L.) P. Beauv.) from different eco-regions in China. J. Integr. Agric. 2017, 16, 2459–2469. [Google Scholar] [CrossRef] [Green Version]
  12. Krishnamurthy, L.; Upadhyaya, H.D.; Kashiwagi, J.; Purushothaman, R.; Dwivedi, S.L.; Vadez, V. Variation in drought tolerance components and their interrelationships in the core collection of foxtail millet (Setaria italica) germplasm. Crop. Pasture Sci. 2016, 67, 834–846. [Google Scholar] [CrossRef] [Green Version]
  13. Niu, X.; Song, L.; Xiao, Y.; Ge, W. Drought tolerant plant growth promoting rhizobacteria associated with foxtail millet in a semi-arid agroecosystem and their potential in alleviating drought stress. Front. Microbiol. 2018, 8, 2580. [Google Scholar] [CrossRef] [PubMed]
  14. Upadhyaya, H.D.; Ramesh, S.; Sharma, S.; Singh, S.K.; Varshney, S.K.; Sarma, N.D.R.K.; Ravishankar, C.R.; Narasimhudu, Y.; Reddy, V.G.; Sahrawat, K.L.; et al. Genetic diversity for grain nutrients contents in a core collection of finger millet (Eleusine coracana (L.) Gaertn.) germplasm. Field Crops Res. 2011, 121, 42–52. [Google Scholar] [CrossRef] [Green Version]
  15. Zhang, M.; Mo, Z.; Liao, J.; Pan, S.; Chen, X.; Zheng, L.; Luo, X.; Wang, Z. Lodging resistance related to root traits for mechanized wet-seeding of two super rice cultivars. Rice Sci. 2021, 28, 200–208. [Google Scholar]
  16. Wan, X.; Chen, X.; Huang, Z.; Han, Y.; Chen, H. Contribution of root traits to variations in soil microbial biomass and community composition. Plant Soil 2021, 460, 483–495. [Google Scholar] [CrossRef]
  17. Sun, J.; Meyer, W.; Cross, J.; Huang, B.R. Growth and physiological traits of canopy and root systems associated with drought resistance in tall fescue. Crop. Sci. 2013, 53, 575–584. [Google Scholar] [CrossRef]
  18. Nadeem, F.; Ahmad, Z.; Ul Hassan, M.; Wang, R.F.; Diao, X.M.; Li, X.X. Adaptation of foxtail millet (Setaria italica L.) to abiotic stresses: A special perspective of responses to nitrogen and phosphate limitations. Front. Plant Sci. 2020, 11, 187. [Google Scholar] [CrossRef]
  19. Jahanzad, E.; Sadeghpour, A.; Hoseini, M.B.; Barker, A.V.; Hashemi, M.; Keshavarz Afshar, R. Competition, nitrogen use efficiency, and productivity of millet–soybean intercropping in semiarid conditions. Crop. Sci. 2015, 55, 2842–2851. [Google Scholar] [CrossRef]
  20. Moussa, A.A.; Mandozai, A.; Jin, Y.; Qu, J.; Zhang, Q.; Zhao, H.; Anwari, G.; Khalifa, M.A.S.; Lamboro, A.; Noman, M.; et al. Genome wide association screening and verification of potential genes associated with root architectural traits in maize (Zea mays L.) at multiple seedling stages. BMC Genom. 2021, 22, 558. [Google Scholar] [CrossRef] [PubMed]
  21. Ye, Z.; Wang, J.; Wang, W.; Zhang, T.; Li, J. Effects of root phenotypic changes on the deep rooting of populus euphratica seedlings under drought stresses. Peer J. 2019, 7, e6513. [Google Scholar] [CrossRef] [PubMed] [Green Version]
  22. Kengkanna, J.; Jakaew, P.; Amawan, S.; Busener, N.; Bucksch, A.; Saengwilai, P. Phenotypic variation of cassava root traits and their responses to drought. Appl. Plant Sci. 2019, 7, e01238. [Google Scholar] [CrossRef] [PubMed] [Green Version]
  23. Azab, O.; Al-Doss, A.; Alshahrani, T.; El-Hendawy, S.; Zakri, A.M.; Abd-ElGawad, A.M. Root system architecture plasticity of bread wheat in response to oxidative burst under extended osmotic stress. Plants 2021, 10, 939. [Google Scholar] [CrossRef] [PubMed]
  24. Chen, R.; Xiong, X.; Cheng, W. Root characteristics of spring wheat under drip irrigation and their relationship with aboveground biomass and yield. Sci. Rep. 2021, 11, 4913. [Google Scholar] [CrossRef] [PubMed]
  25. Nakhforoosh, A.; Nagel, K.A.; Fiorani, F.; Bodner, G. Deep soil exploration vs. topsoil exploitation: Distinctive rooting strategies between wheat landraces and wild relatives. Plant Soil 2021, 459, 397–421. [Google Scholar] [CrossRef]
  26. Chen, Y.; Palta, J.; Prasad, P.V.V.; Siddique, K.H.M. Phenotypic variability in bread wheat root systems at the early vegetative stage. BMC Plant Biol. 2020, 20, 185. [Google Scholar] [CrossRef]
  27. Jia, Z.; Liu, Y.; Gruber, B.D.; Neumann, K.; Kilian, B.; Graner, A.; Wiren, N. Genetic dissection of root system architectural traits in spring barley. Front. Plant Sci. 2019, 10, 400. [Google Scholar] [CrossRef]
  28. Zohreh; Siadat, S.A.; Abdolmehdi, B.; Abdollah; Masoud, H. Interactive effects of drought stress and chitosan application on physiological characteristics and essential oil yield of Thymus daenensis celak. Crop. J. 2017, 5, 407–415. [Google Scholar]
  29. Strock, C.F.; Burridge, J.; Massas, A.S.F.; Beaver, J.; Beebe, S.; Camilo, S.A.; Fourie, D.; Jochua, C.; Miguel, M.; Miklas, P.N.; et al. Seedling root architecture and its relationship with seed yield across diverse environments in Phaseolus vulgaris. Field Crops Res. 2019, 237, 53–64. [Google Scholar] [CrossRef]
  30. Jochua, C.; Strock, C.; Lynch, J. Root phenotypic diversity in common bean (Phaseolus vulgaris L.) reveals contrasting strategies for soil resource acquisition among gene pools and races. Crop. Sci. 2020, 60, 3261–3277. [Google Scholar] [CrossRef]
  31. Pan, J.; Li, Z.; Wang, Q.; Guan, Y.; Li, X.; Huangfu, Y.; Meng, F.; Li, J.; Dai, S.; Liu, W. Phosphoproteomic profiling reveals early salt responsive mechanisms in two foxtail millet cultivars. Front. Plant Sci. 2021, 12, 1934. [Google Scholar] [CrossRef] [PubMed]
  32. Falk, K.G.; Jubery, T.Z.; O’Rourke, J.A.; Singh, A.; Sarkar, S.; Ganapathysubramanian, B.; Singh, A.K. Soybean root system architecture trait study through genotypic, phenotypic, and shape based clusters. Plant Phen. 2020, 2020, 1925495. [Google Scholar] [CrossRef] [PubMed]
  33. Fraudentali, I.; Rodrigues-Pousada, R.A.; Volpini, A.; Tavladoraki, P.; Angelini, R.; Cona, A. Stress triggered long distance communication leads to phenotypic plasticity: The case of the early root protoxylem maturation induced by leaf wounding in arabidopsis. Plants 2018, 7, 107. [Google Scholar] [CrossRef] [Green Version]
  34. Fang, C.; Zhang, H.; Wan, J.; Wu, Y.; Li, K.; Jin, C.; Chen, W.; Wang, S.; Wang, W.; Zhang, H.; et al. Control of leaf senescence by an MeOH-Jasmonates cascade that is epigenetically regulated by OsSRT1 in rice. Mol. Plant 2016, 9, 1366–1378. [Google Scholar] [CrossRef] [Green Version]
  35. Danakumara, T.; Kumari, J.; Singh, A.K.; Sinha, S.K.; Pradhan, A.K.; Sharma, S.; Jha, S.K.; Bansal, R.; Kumar, S.; Jha, G.K.; et al. Genetic dissection of seedling root system architectural traits in a diverse panel of hexaploid wheat through multi -locus genome wide association mapping for improving drought tolerance. Int. J. Mol. Sci. 2021, 22, 7188. [Google Scholar] [CrossRef] [PubMed]
  36. Ndour, P.M.S.; Barry, C.M.; Tine, D.; De la Fuente Cantó, C.; Gueye, M.; Barakat, M.; Ortet, P.; Achouak, W.; Ndoye, I.; Sine, B.; et al. Pearl millet genotype impacts microbial diversity and enzymatic activities in relation to root adhering soil aggregation. Plant Soil 2021, 464, 109–129. [Google Scholar] [CrossRef]
  37. Grzesiak, M.T.; Hordyńska, N.; Maksymowicz, A.; Grzesiak, S.; Szechyńska-Hebda, M. Variation among spring wheat (Triticum aestivum L.) genotypes in response to the drought stress. II—root system structure. Plants 2019, 8, 584. [Google Scholar] [CrossRef] [Green Version]
  38. Bhargava, S.; Sawant, K.; Tuberosa, R. Drought stress adaptation: Metabolic adjustment and regulation of gene expression. Plant Breed. 2013, 132, 21–32. [Google Scholar] [CrossRef]
  39. Li, C.; Li, L.; Reynolds, M.P.; Wang, J.; Chang, X.; Mao, X.; Jing, R. Recognizing the hidden half in wheat: Root system attributes associated with drought tolerance. J. Exp. Bot. 2021, 72, 5117–5133. [Google Scholar] [CrossRef]
  40. Fan, Y.; Miguez-Macho, G.; Jobbagy, E.G.; Jackson, R.B.; Otero-Casal, C. Hydrologic regulation of plant rooting depth. Proc. Natl. Acad. Sci. USA 2017, 114, 10572–10577. [Google Scholar] [CrossRef] [Green Version]
  41. Chen, L.; Phillips, A.L.; Condon, A.G.; Parry, M.A.; Hu, Y.G. GA-responsive dwarfing gene Rht12 affects the developmental and agronomic traits in common bread wheat. PLoS ONE 2013, 8, e62285. [Google Scholar] [CrossRef] [PubMed] [Green Version]
  42. Chen, Y.L.; Dunbabin, V.M.; Diggle, A.J.; Siddique, K.H.M.; Rengel, Z. Assessing variability in root traits of wild Lupinus angustifolius germplasm: Basis for modelling root system structure. Plant Soil 2012, 354, 141–155. [Google Scholar] [CrossRef]
  43. Watt, M.; Moosavi, S.; Cunningham, S.C.; Kirkegaard, J.A.; Rebetzke, G.J.; Richards, R.A. A rapid, controlled environment seedling root screen for wheat correlates well with rooting depths at vegetative, but not reproductive, stages at two field sites. Ann. Bot. 2013, 112, 447–455. [Google Scholar] [CrossRef] [Green Version]
  44. Wang, J.; Chen, Y.; Zhang, Y.; Zhang, Y.; Ai, Y.; Feng, Y.; Moody, D.; Diggle, A.; Damon, P.; Rengel, Z. Phenotyping and validation of root morphological traits in barley (Hordeum vulgare L.). Agronomy 2021, 11, 1583. [Google Scholar] [CrossRef]
  45. Chen, Y.; Ghanem, M.E.; Siddique, K.H. Characterising root trait variability in chickpea (Cicer arietinum L.) germplasm. J. Exp. Bot. 2017, 68, 1987–1999. [Google Scholar]
  46. Koevoets, I.T.; Venema, J.H.; Elzenga, J.T.M.; Testerink, C. Roots withstanding their environment: Exploiting root system architecture responses to abiotic stress to improve crop tolerance. Front. Plant Sci. 2016, 7, 1335. [Google Scholar] [CrossRef] [PubMed] [Green Version]
  47. Levin, M.; Resnick, N.; Rosianskey, Y.; Kolotilin, I.; Wininger, S.; Lemcoff, J.H.; Cohen, S.; Galili, G.; Koltai, H.; Kapulnik, Y. Transcriptional profiling of Arabidopsis thaliana plants’ response to low relative humidity suggests a shoot–root communication. Plant Sci. 2009, 177, 450–459. [Google Scholar] [CrossRef]
  48. Khan, M.R.; Imran, K.; Zahra, I.; Jens, L.; Naz, A.A. Drought responsive genes expressed predominantly in root tissues are enriched with homotypic cis regulatory clusters in promoters of major cereal crops. Crop. J. 2017, 5, 195–206. [Google Scholar] [CrossRef] [Green Version]
  49. Aidoo, M.K.; Bdolach, E.; Fait, A.; Lazarovitch, N.; Rachmilevitch, S. Tolerance to high soil temperature in foxtail millet (Setaria italica L.) is related to shoot and root growth and metabolism. Plant Physiol. Biochem. 2016, 106, 73–81. [Google Scholar] [CrossRef]
  50. York, L.M.; Galindo-Castaneda, T.; Schussler, J.R.; Lynch, J.P. Evolution of US maize (Zea mays L.) root architectural and anatomical phenes over the past 100 years corresponds to increased tolerance of nitrogen stress. J. Exp. Bot. 2015, 66, 2347–2358. [Google Scholar] [CrossRef] [Green Version]
  51. Talabi, A.O.; Badu-Apraku, B.; Fakorede, M.A.B. Genetic variances and relationship among traits of an early maturing maize population under drought stress and low nitrogen environments. Crop. Sci. 2017, 57, 681–692. [Google Scholar] [CrossRef] [Green Version]
  52. Galkovskyi, T.; Mileyko, Y.; Bucksch, A.; Moore, B.; Symonova, O.; Charles, A.P.; Topp, C.N.; Anjali, S.I.-P.; Zurek, P.R.; Fang, S.Q.; et al. GiA Roots: Software for the high throughput analysis of plant root system architecture. Bio. Med. Central 2012, 12, 116. [Google Scholar] [CrossRef] [Green Version]
  53. Chen, D.; Wang, S.; Cao, B.; Cao, D.; Leng, G.; Li, H.; Yin, L.; Shan, L.; Deng, X. Genotypic variation in growth and physiological response to drought stress and re-watering reveals the critical role of recovery in drought adaptation in maize seedlings. Front. Plant Sci. 2016, 6, 1241. [Google Scholar] [CrossRef] [Green Version]
  54. Mbinda, W.; Masaki, H. Breeding strategies and challenges in the improvement of blast disease resistance in finger millet. Front. Plant Sci. 2021, 11, 2151. [Google Scholar] [CrossRef] [PubMed]
  55. Stanik, N.; Lampei, C.; Rosenthal, G. Drought stress triggers differential survival and functional trait responses in the establishment of arnica montana seedlings. Plant Biol. 2021, 23, 1086–1096. [Google Scholar] [CrossRef] [PubMed]
  56. Passot, S.; Gnacko, F.; Moukouanga, D.; Lucas, M.; Guyomarc’h, S.; Ortega, B.M.; Atkinson, J.A.; Belko, M.N.; Bennett, M.J.; Gantet, P.; et al. Characterization of pearl millet root architecture and anatomy reveals three types of lateral roots. Front. Plant Sci. 2016, 7, 829. [Google Scholar] [CrossRef] [Green Version]
  57. Fujii, K.; Makita, N.; Kamara, M.; Küttim, M.; Sugita, S. Plasticity of pine tree roots to podzolization of boreal sandy soils. Plant Soil 2021, 464, 209–222. [Google Scholar] [CrossRef]
  58. Jonathan, P.L.; Tobias, W. Opportunities and challenges in the subsoil: Pathways to deeper rooted crops. J. Exp. Bot. 2015, 66, 2199–2210. [Google Scholar]
  59. Halder, T.; Liu, H.; Chen, Y.; Yan, G.; Siddique, K.H.M. Identification of candidate genes for root traits using genotype phenotype association analysis of near isogenic lines in hexaploid wheat (Triticum aestivum L.). Int. J. Mol. Sci. 2021, 22, 3579. [Google Scholar] [CrossRef]
  60. Zhang, B.; Liu, X.; Guo, Y.; Jia, X.; Yang, D.; Zhao, Y.; Dai, L.; Kou, S.; Zhang, X.; Hou, D.; et al. Investigation on agronomic characters of dwarf mutant 778 in broomcorn millet (Panicum miliaceum L.) and analysis of its sensitivity to GA. Biocatal. Agric. Biotechnol. 2020, 9, 7–11. [Google Scholar]
  61. Awad, W.; Byrne, P.F.; Reid, S.D.; Comas, L.H.; Haley, S.D. Great plains winter wheat varies for root length and diameter under drought stress. Agron J. 2018, 110, 226–235. [Google Scholar] [CrossRef]
  62. Lopes, M.S.; Reynolds, M.P. Partitioning of assimilates to deeper roots is associated with cooler canopies and increased yield under drought in wheat. Funct. Plant Biol. 2010, 37, 147–156. [Google Scholar] [CrossRef]
  63. Halli, H.M.; Angadi, S.; Kumar, A.; Govindasamy, P.; Madar, R.; El-Ansary, D.O.; Rashwan, M.A.; Abdelmohsen, S.A.M.; Abdelbacki, A.M.M.; Mahmoud, E.A.; et al. Influence of planting and irrigation levels as physical methods on maize root morphological traits, grain yield and water productivity in semi-arid region. Agronomy 2021, 11, 294. [Google Scholar] [CrossRef]
  64. Wasson, A.P.; Richards, R.A.; Chatrath, R.; Misra, S.C.; Prasad, S.V.S.; Rebetzke, G.J.; Watt, M. Traits and selection strategies to improve root systems and water uptake in water-limited wheat crops. J. Exp. Bot. 2012, 63, 3485–3498. [Google Scholar] [CrossRef] [Green Version]
  65. Wang, H.; Sun, H.; Xia, H.; Wu, T.; Li, P.; Xu, C.; Yang, Z. Natural variation and domestication selection of ZmCKX5 with root morphological traits at the seedling stage in maize. Plants 2020, 10, 1. [Google Scholar] [CrossRef]
  66. Huot, C.; Zhou, Y.; Philp, J.N.M.; Denton, M.D. Root depth development in tropical perennial forage grasses is related to root angle, root diameter and leaf area. Plant Soil 2020, 456, 145–158. [Google Scholar] [CrossRef]
  67. Voss-Fels, K.P.; Qian, L.; Parra-Londono, S.; Uptmoor, R.; Frisch, M.; Keeble-Gagnere, G.; Appels, R.; Snowdon, R.J. Linkage drag constrains the roots of modern wheat. Plant Cell Environ. 2017, 40, 717–725. [Google Scholar] [CrossRef]
  68. Lynch, J.P. Steep, cheap and deep: An ideotype to optimize water and N acquisition by maize root systems. Ann. Bot. 2013, 112, 347–357. [Google Scholar] [CrossRef] [Green Version]
  69. Garbowski, M.; Johnston, D.B.; Brown, C.S. Leaf and root traits, but not relationships among traits, vary with ontogeny in seedlings. Plant Soil 2021, 460, 247–261. [Google Scholar] [CrossRef]
  70. Paula, S.; Pausas, J.G. Root traits explain different foraging strategies between resprouting life histories. Oecologia 2011, 165, 321–331. [Google Scholar] [CrossRef] [Green Version]
  71. Ostonen, I.; Puttsepp, U.; Biel, C.; Alberton, O.; Bakker, M.R.; Lohmus, K.; Majdi, H.; Metcalfe, D.; Olsthoorn, A.F.M.; Pronk, A.; et al. Specific root length as an indicator of environmental change. Plant Biosyst. 2007, 141, 426–442. [Google Scholar] [CrossRef]
  72. Atta, B.M.; Tariq, M.; Trethowan, R.M. Relationship between root morphology and grain yield of wheat in north-western NSW, Australia. Aust. J. Crop. Sci. 2013, 7, 2108–2115. [Google Scholar]
  73. Paola, E.C.; Claudia, K.; Michael, A.K.; Feike, A.D. Variation in specific root length among 23 wheat genotypes affects leaf δ13C and yield. Agric. Ecosyst Environ. 2017, 246, 21–29. [Google Scholar]
  74. Schneider, H.M.; Yang, J.T.; Brown, K.M.; Lynch, J.P. Nodal root diameter and node number in maize (Zea mays L.) interact to influence plant growth under nitrogen stress. Plant Direct 2021, 5, e00310. [Google Scholar] [CrossRef] [PubMed]
  75. Faye, A.; Sine, B.; Chopart, J.L.; Grondin, A.; Lucas, M.; Diedhiou, A.G.; Gantet, P.; Cournac, L.; Min, D.; Audebert, A.; et al. Development of a model estimating root length density from root impacts on a soil profile in pearl millet (Pennisetum glaucum (L.) R. Br). application to measure root system response to water stress in field conditions. PLoS ONE 2019, 14, e0214182. [Google Scholar] [CrossRef] [PubMed] [Green Version]
  76. Zegada-Lizarazu, W.; Iijima, M. Deep root water uptake ability and water use efficiency of pearl millet in comparison to other millet species. Plant Prod. Sci. 2015, 8, 454–460. [Google Scholar] [CrossRef]
  77. Chen, X.; Li, Y.; He, R.; Ding, Q. Phenotyping field state wheat root system architecture for root foraging traits in response to environment x management interactions. Sci. Rep. 2018, 8, 2642. [Google Scholar] [CrossRef] [Green Version]
  78. Polania, J.; Rao, I.M.; Cajiao, C.; Grajales, M.; Rivera, M.; Velasquez, F.; Raatz, B.; Beebe, S.E. Shoot and root traits contribute to drought resistance in recombinant inbred lines of MD 23–24 × SEA 5 of common bean. Front. Plant Sci. 2017, 8, 296. [Google Scholar] [CrossRef]
Figure 1. Distribution map of average rainfall of 65 genotypes from 7 provinces in China (2020).
Agronomy 12 01472 g001
Figure 2. Variation of 65 millet genotypes shown by cumulative histograms: (a) root length and root dry mass ordered by seven provinces and (b) root length and root dry mass ordered by four ecological regions. Data were plotted from the lowest to the highest total root length (TRL) value; root lengths for the three sections were plotted in three different colors; RL_S1: root length in Section 1 (0–5 cm, orange bars); RL_S2: root length in Section 2 (5–10 cm, green bars); RL_S3: root length in Section 3 (>10 cm, purple bars). The abbreviations of four ecological regions: early maturing area of northeast China (EMA-NE), early maturing area of northwest China (EMA-NW), mid-late maturing region in northwest China (MLMA-NW), summer maturing region (SMR).
Agronomy 12 01472 g002
Figure 3. Variation of root length and total dry mass in 4 ecological regions: (a) root length in three layers and (b) shoot dry mass and root dry mass. Root data are the means for each ecological region. Root lengths in Section 1 (RL_S1, 0–5 cm), Section 2 (RL_S2, 5–10 cm), Section 3 (RL_S3, >10 cm) ±SE of total root length of all sections are presented. Ecological regions are ordered by the geographic location from north to south. Data are in mean ± SE. Bars of total root length or total root mass folled by different letters are significantly different, respectively (p < 0.05).
Agronomy 12 01472 g003
Figure 4. Variations of root phenotypic in the three root sections: (a) root length, (b) root diameter, (c) root area, and (d) root volume. Boxplots are limited to the first and third quartiles, and the middle line is the median. Four root traits were plotted. Three root sections: s1, 0–5 cm, colored grey; s2, 5–10 cm, colored red; s3 > 10 cm, colored blue.
Agronomy 12 01472 g004
Figure 5. Linear fitting of root phenotypic characteristics: (a) root length vs. shoot dry mass; (b) root length vs. root dry mass; (c) root length vs. maximal root length; (d) root length vs. root number. Total root length (TRL) and root length in three sections (RL_S1, RL_S2, RL_S3) were used in the analysis.
Agronomy 12 01472 g005
Figure 6. Linear fitting of root phenotypic characteristics: (a) root length ratio vs. root surface area ratio; (b) root length ratio vs. root volume ratio; (c) root diameter vs. root length density; (d) root diameter vs. root weight density.
Agronomy 12 01472 g006
Figure 7. Principal component analysis of root and shoot phenotypes in four ecological regions: (a) distribution of 18 selected traits (CVs ≥ 0.2) in principal component 1 and principal component 2 and (b) the distribution of 65 genotypes in principal component 1 and principal component 2. Different ecological regions were colored with different colors, respectively.
Agronomy 12 01472 g007
Figure 8. Principal component analysis of root phenotypes in the top layer (0–5 cm section) and the sub-layer (below 5 cm section): (a) seven root traits in the top layer and (b) seven root traits in the sub-layer, with genotypes presented by ecological regions.
Agronomy 12 01472 g008
Table 1. Description of global traits and local traits in 65 millet genotypes.
TraitsAbbreviationDescriptionUnit
Global traits
Root widthRWMaximum distribution of roots in the horizontal directionCm
Maximal root depthMRDMaximum depth of the root system in the vertical directionCm
Maximal root lengthMRLMaximum length of the seminal or primary rootCm
Root numberRNSeminal and primary root numberNumber
Root dry massRDMTotal root dry mass Mg
Root lengthRLTotal root lengthCm
Root diameter RDAverage root diameter Mm
Root areaRATotal root surface area mm2
Root volumeRVTotal root volumecm3
Root length densityRLDAverage root length densitycm cm−3
Root weight densityRWDAverage root t weight densitymg cm−3
Specific root lengthSRLTotal root length per unit root dry masscm mg−1
Root to shoot dry mass ratioRSMTotal root dry mass divided by the shoot dry mass
Root growth rateRGRAverage daily root growth (based on the longest seminal or primary root growth at 15 days after seed sowing)cm d−1
Root length ratioRLRRoot length in Section 1 (top-root layer) over sub-root layer
Root surface area ratioRSARRoot surface area in Section 1 (top-root layer) over sub-root layer
Root volume ratioRVRRoot volume in Section 1 (top-root layer) over sub-root layer
Leaf numberLNTotal leaf number of each plant
Shoot dry massSDMDry weight of the above-ground partMg
Total dry mass TDMTotal dry mass (sum of root and shoot dry mass)Mg
Local traits
Root dry mass s1RDM_s1Total root dry mass in Section 1Mg
Root dry mass s2RDM_s2Total root dry mass in Section 2 Mg
Root dry mass s3RDM_s3Total root dry mass in Section 3Mg
Root dry mass in sub-root layerRDM_subCombined root dry mass in sub-root layer (s2 and s3)Mg
Root length s1RL_s1Total root length in Section 1Cm
Root length s2RL_s2Total root length in Section 2 Cm
Root length s3RL_s3Total root length in Section 3Cm
Root length in sub-root layerRL_subCombined root length in sub-root layer (s2 and s3)Cm
Root diameter s1RD_s1Average root diameter in Section 1Mm
Root diameter s2RD_s2Average root diameter in Section 2Mm
Root diameter s3RD_s3Average root diameter in Section 3Mm
Root diameter in sub-root layerRD_subAverage root diameter in sub-root layer (s2 and s3)Mm
Root area s1RA_s1Total root surface area in Section 1 mm2
Root area s2RA_s2Total root surface area in Section 2 mm2
Root area s3RA_s3Total root surface area in Section 3 mm2
Root area in sub-root layerRA_subCombined root surface area in sub-root layer (s2 and s3)mm2
Root volume s1RV_s1Total root volume in Section 1 cm3
Root volume s2RV_s2Total root volume in Section 2 cm3
Root volume s3RV_s3Total root volume in Section 3 cm3
Root volume in sub-root layerRV_subCombined root volume in sub-root layer (s2 and s3)cm3
Root length density s1RLD_s1Average root length density in Section 1cm cm−3
Root length density s2RLD_s2Average root length density in Section 2cm cm−3
Root length density s3RLD_s3Average root length density in Section 3cm cm−3
Root length density in sub-root layerRLD_subCombined root length density in sub-root layer (s2 and s3)cm cm−3
Root weight density s1RWD_s1Average root t weight density in Section 1mg cm−3
Root weight density s2RWD_s2Average root t weight density in Section 2mg cm−3
Root weight density s3RWD_s3Average root t weight density in Section 3mg cm−3
Root weight density in sub-root layerRWD_subCombined root weight density in sub-root layer (s2 and s3)mg cm−3
Note: Root Section 1(S1), Section 2(S2) and Section 3(S3) indicate root distribution at 0–5 cm, 6–10 cm and > 10 cm, respectively.
Table 2. Minimum, maximum, mean, medium, standard deviation (SD); coefficient of variations (CV); and p-value of global and local traits in 65 millet genotypes.
TraitsMinimumMaximumMedianMeanSDCVp-Value
Global traits
RW1.514.58.507.363.650.500.000
MRD0.611.13.154.703.070.650.000
MRL4.013.49.839.612.160.220000
RN5.116.411.811.432.600.230.000
RDM0.1032.07.859.836.010.610.000
RL69.4779325338.08137.800.410.000
RD0.250.660.420.420.090.210.000
RA12.684.7542.6343.9117.690.400.000
RV0.101.120.440.480.230.480.000
RLD38314697127706265.670.340.000
RWD0. 753.919.022.5612.380.550.068
SRL4.0078.338.838.7314.050.360.000
RSM0.032.610.530.590.390.660.000
RGR0.040.740.210.310.200.650.000
LN3.0019.0011.311.142.690.240.000
SDM3.5069.116.018.4910.680.580.000
TDM3.5080.925.628.3214.130.500.000
RLR0.311.950.660.800.370.460.001
RSAR0.331.850.590.760.350.460.050
RVR0.341.720.550.720.340.470.001
Local traits
RDM_s10.00116.65.456.002.620.440.000
RDM_s20.0023.82.333.143.701.180.196
RDM_s30.007.330.300.721.171.630.000
RDM_sub0.024.42.483.864.311.120.037
RL_s16920213513530.90.230.000
RL_s20.00235114.711843.00.360.000
RL_s30.0044995.785.7850.990.006
RL_sub0.006601972031160.570.000
RD_s10.300.580.410.410.060.150.000
RD_s20.290.580.420.420.070.170.000
RD_s30.270.730.410.440.110.250.000
RD_sub0.280.630.430.430.080.190.000
RA_s18.3526.9217.217.24.820.280.000
RA_s20.0026.9415.515.46.140.400.000
RA_s30.0042.512.711.39.850.870.000
RA_sub0.0063.5626.0426.714.10.530.000
RV_s10.060.340.180.190.070.370.000
RV_s20.000.360.170.170.080.470.000
RV_s30.000.410.130.130.120.920.000
RV_sub0.000.770.280.300.180.600.000
RLD_s138315038238852880.330.000
RLD_s20.0016027528533570.420.000
RLD_s30.0017464805795190.900.004
RLD_sub32516356917612990.390.000
RWD_s10.00779.5630.6336.318.00.500.000
RWD_s22.4297.115.118.714.60.780.000
RWD_s30.2527.64.826.536.721.030.095
RWD_sub2.4251.910.813.299.460.710.001
Table 3. Principal component analysis (PCA) of 18 selected traits in 65 millet genotypes (p < 0.05, CV ≥ 0.2).
TraitsAbbreviationPC1PC2PC3PC4
Leaf numberLN0.310.71−0.22−0.05
Maximal root length (cm)MRL0.810.36−0.070.18
Root numberRN0.860.290.09−0.06
Root dry mass (mg)RDM0.750.240.53−0.07
Shoot dry mass (mg)SDM0.570.29−0.300.66
Root length (cm)RL0.860.02−0.13−0.09
Root area (mm2)RA0.87−0.350.05−0.03
Root volume (cm3)RV0.73−0.600.20−0.01
Root diameter (mm)RD0.13−0.910.250.13
Root length density (cm cm−3)RLD−0.120.89−0.22−0.17
Root weight density (mg cm−3)RWD0.010.880.38−0.15
Specific root lengthSRL−0.22−0.55−0.71−0.01
Root to shoot dry mass ratioRSM0.26−0.080.82−0.41
Root growth rate (cm d−1)RGR0.55−0.340.430.38
Total dry mass (mg)TDM0.770.33−0.010.48
Root length ratioRLR−0.780.030.390.37
Root surface area ratioRSAR−0.800.140.390.35
Root volume ratioRVR−0.790.250.360.30
Variation proportion
Eigenvalue 6.924.542.611.51
Variability (%) 38.4625.2014.508.40
Cumulative (%) 38.4663.6678.1686.56
Note: Four principal components with eigenvalues >1 were extracted and considered significant.
Publisher’s Note: MDPI stays neutral with regard to jurisdictional claims in published maps and institutional affiliations.

