Article

Analysis of RAZORMIN® as a Biostimulant and Its Effect on the Phytotoxicity Mitigation Caused by Fungicide Azoxystrobin in Pepper

by
Ali Ahmad
1,*,
Eloy Navarro-León
1,
María José Izquierdo-Ramos
1,
Juan José Rios
1,
Begoña Blasco
1,
Iván Navarro-Morillo
2 and
Juan Manuel Ruiz
1,*
1
Department of Plant Physiology, Faculty of Sciences, University of Granada, 18071 Granada, Spain
2
Chief Innovation Officer (CINO) at Atlántica Agrícola, 03400 Villena, Spain
*
Authors to whom correspondence should be addressed.
Agronomy 2022, 12(6), 1418; https://doi.org/10.3390/agronomy12061418
Submission received: 13 May 2022 / Revised: 6 June 2022 / Accepted: 10 June 2022 / Published: 13 June 2022
(This article belongs to the Topic Biostimulants in Agriculture)

Abstract

:
Use of biostimulants for stimulating plant growth and mitigating the negative impacts of biotic and abiotic stresses is a promising strategy to achieve higher crop yields. Fungicides such as azoxystrobin are used to control several pests and fungal diseases in plants but at the cost of altering various physiological processes; thereby, leading to reduced crop yields. The efficiency of the compound RAZORMIN® as a biostimulant product while taking into account its role in plant growth stimulation and fungicide azoxystrobin stress mitigation was evaluated in this study. The efficacy of RAZORMIN® was assessed considering its impact on the stimulation of growth-related physiological processes and stress mitigation mechanism, e.g., reactive oxygen species (ROS) detoxification. Application of RAZORMIN® significantly increased plant growth by improving fresh weight, photosynthetic efficiency, net photosynthesis rate, gas exchange, nitrogen (N) metabolism (with increases in soluble amino acids, foliar N concentration, and N use efficiency), growth hormone concentrations (mainly gibberellins and cytokinins), nutritional status of plants (producing a greater accumulation of phosphorus, potassium, calcium, magnesium, sulfur, zinc, molybdenum, iron, and boron), and sugars concentration. Furthermore, the application of RAZORMIN® on plants under fungicide azoxystrobin stress demonstrated its anti-stress and protective role by stimulating the antioxidant defense system and improving photosynthetic efficiency.

1. Introduction

Crop yield is remarkably affected by the regulation of plant growth. Similarly, negative impacts of environmental stresses are other limiting factors for achieving higher crop yields. Previously, biotic and abiotic stresses have been reported to prevent all crop systems from reaching their yield potential. However, knowledge of the underlying mechanisms and the strategies to mitigate these effects is still limited. Few of the common strategies to minimize the adverse effects of abiotic stresses include optimization of plant growth conditions in terms of the provision of plant growth regulators (PGRs), water, and nutrients. Apart from these conventional approaches to mitigate stresses, use of biostimulants is a relatively new and rapidly emerging approach for regulating plants physiological processes, thereby, positively inducing plant growth, mitigating negative impacts of environmental stresses, and improving crop yield [1,2,3].
Biostimulants, unlike crop fertilizers, are novel agricultural products that regulate plant growth independently of their nutrient content [4]. After years of debate between European institutions, they have finally been included in the new EU regulation on fertilizer products. The new European Fertilizer Products Regulation (FPR) report published on 25 June 2019 recognizes plant biostimulants as a distinct class of agricultural inputs [5]. Furthermore, according to the European Biostimulants Industry Council (EBIC), plant biostimulants “contain substances and/or microorganisms, whose function when applied to plants or the rhizosphere is to stimulate natural processes to enhance nutrient uptake, nutrient efficiency, abiotic stress tolerance and improve crop quality” [6,7]. Similarly, biostimulants are identified as compounds comprising diverse components that promote nutrient uptake, enhance abiotic stress resistance, improve crop yield, and stimulate natural physiological processes [8]. Although the amplitude of biostimulants definition is vast, they have been explicitly recognized as plant growth-promoting and stress-mitigating compounds [4,9,10,11]., Biostimulants have become the focus of attention of many scientists, farmers, and industrial companies around the world because of their promising potential [12,13].
The use of biostimulants with respect to the ontogeny of plants is quite diverse, e.g., they are being applied as seed treatments and foliar sprays on various plant stages such as seed germination and seedling growth, and even on the harvested agricultural products. Similarly, their mechanism of action may involve phosphorus (P) release from soils, activation of nitrogen (N) metabolism, stimulation of root growth, or generic stimulation of soil microbial activity [2]. Previous reports have documented that the application of biostimulants has enhanced various physiological processes including plant nutrient uptake and utilization, photosynthesis, synthesis and concentration of growth hormones (auxins, gibberellins, and cytokinins), germination, and senescence reduction, which, in turn, increase plant production, quality, and post-harvest shelf life of agricultural products. They have also been reported to synthesize osmoprotectants or activate the antioxidant system in order to mitigate the negative effects of abiotic stress on plants. Significant effects of biostimulants have been documented for oxidative, frost, chilling, drought, salinity, heat, chemical, and mechanical stresses [2,3,14,15].
Biostimulants based on amino acids and protein hydrolysates can be regarded as the most widely used biostimulants because of their potential role in the biosynthesis of many non-protein nitrogenous compounds (purines and pyrimidine bases, vitamins, coenzymes, and pigments), in plant growth [16]. In addition, biostimulants might also be characterized for altering various physiological processes in plants, for example, (a) inducing modification of root architecture (i.e., length and number of lateral roots, root density); (b) enhancing biotic and abiotic stress tolerance by synthesis of osmoprotectants and antioxidants; (c) improving nutrient uptake of amino acids capable of functioning as natural chelates that would enhance their bioavailability in the soil; (d) enriching nutrient use efficiency, particularly of N by the stimulating nitrate assimilation that may limit its accumulation in the leaves; (e) and inducing plant hormonal activity [16,17,18,19].
Higher crop production is largely dependent on the control of diseases, especially those caused by fungi, which cause a yield reduction of nearly 20% in major food and cash crops worldwide. Therefore, the use of foliar fungicides is now almost imperative for both disease control and prevention [20,21]. However, use of fungicides may induce alterations in crop physiology. In this regard, among the different types of fungicides, the strobilurin group (e.g., Azoxystrobin) has been found to modify plant physiology through changes in metabolism and growth [22]. Fungicide azoxystrobin is used to control several pests and fungal diseases in plants [23,24,25,26]. Various studies have reported the toxic effects of this fungicide, i.e., negatively regulating different plant physiological processes [20,27,28]. Therefore, use of biostimulants to mitigate fungicide causing phytotoxic effects may be an interesting strategy. Previously, various reports evaluating the effects of different biostimulants on plant growth and stress tolerance including heat, water, cold, and drought have been documented [29,30,31,32] using either a different technology and biostimulant type or a different plant variety [32,33,34,35]. However, studies evaluating the effect of amino acid-based biostimulants on plant physiological processes (i.e., metabolic, photosynthetic, and nutritional efficiency) and against fungicide tolerance are scarce.
Therefore, the objective of this study was to evaluate the efficacy of a commercial amino acid-based biostimulant, RAZORMIN®, developed by the Atlántica Agrícola S.A. company. Specifically, the following two aspects of RAZORMIN® were evaluated:
i.
inducer/promoter of metabolic, photosynthetic, and nutritional efficiency in plants (biostimulant effect);
ii.
inducer/promoter of plant defense responses against fungicide application (abiotic stress tolerance).

2. Materials and Methods

2.1. Plant Material and Growth Conditions

Capsicum annuum cv. Alicum, pepper plants, were used in this study. Plant seeds were sown in forestry trays in a local seed nursery (HortoPlan S.L.; Motril, Granada; 36.76438613357375, −3.5077589471979906). The forestry trays had a cell size of 3 cm × 3 cm × 10 cm, with 100 boxes per tray. Subsequently, seedlings were transplanted after 25 days, into pots sized 13cm × 13cm × 12.5 cm. These pots were filled with peat and were placed in trays (55cm × 40cm × 8.5 cm) that were kept in a growth chamber where 350 μmol m−2 s−1 photosynthetically active radiation (PAR), 22/18 °C temperature (day/night), 60–80% relative humidity, and 14/10-h photoperiod were maintained. Plants were irrigated two times a week with nutritional solution consisting of 2 mM MgSO4·7H2O, 4 mM KNO3, 4 mM Ca(NO3)2·4H2O, 1 mM NaH2PO4·2H2O, 6 mM KH2PO4, 5 μM Fe-chelate (Sequestrene; 138 FeG100), 0.1 μM Na2MoO4·2H2O, 0.25 μM CuSO4·5H2O, 10 μM H3BO3, 1 μM ZnSO4, and 2 μM MnCl2·4H2O throughout the study period.

2.2. RAZORMIN®

RAZORMIN® is an amino acid-based biostimulant product, developed by the Atlántica Agrícola S.L. company. This product is synthesized using molasses as raw material through the fermentation process and has a pH of 4.5. The overall composition of RAZORMIN® is provided in Table 1.

2.3. Experiments and Treatments

2.3.1. Experiment 1: Efficacy of RAZORMIN® as a Biostimulant

Two treatments were used in this experiment: (a) Control without biostimulant application; and (b) RAZORMIN® with applications of biostimulant (RAZORMIN®) at a rate of 3 mL/L with an approximate amount of 10 mL per pot. Each treatment consisted of 12 plants and was done in triplicate. Three foliar applications of RAZORMIN® were carried out with a periodicity of 15 days between each application. The first application was performed 49 days after germination (28 September 2021), whereas second and third applications were carried out on 13 October 2021 and 28 October 2021, respectively. Plant sampling was conducted 7 days after the last application (4 November 2021).

2.3.2. Experiment 2: Efficacy of RAZORMIN® in Reducing the Phytotoxicity of the Fungicide Azoxystrobin

Three treatments were used in this experiment: (a) Control without biostimulant and stress (fungicide) application; (b) Azoxystrobin with foliar application of fungicide (stress); and (c) Azoxystrobin + RAZORMIN® with foliar application of azoxystrobin and RAZORMIN® simultaneously. Each treatment consisted of 12 plants and was performed in triplicate. Fungicide was applied at a rate of 1 mL/L and RAZORMIN® was applied at a rate of 3 mL/L. These applications were carried out 60 days after germination (9 October 2021). Sampling was undertaken 5 days after the respective applications were carried out (14 October 2021).

2.4. Plant Sampling

All plants from each treatment were instantly processed for subsequent analysis after sampling. The plant material was decontaminated by washing with distilled water followed by drying on filter paper. Subsequently, plant fresh weight (FW) was measured using a digital balance (Ohaus Scout® Electronic Balance). Half of the samples either fresh or frozen at −40 °C were used for the analysis of the following parameters: relative growth rate, photosynthetic efficiency, photosynthetic pigments concentration (chlorophyll a, b, and carotenoids), concentration of soluble amino acids, soluble proteins, malondialdehyde (MDA), oxygenated free radicals (superoxide (O2) and hydrogen peroxide (H2O2)), total phenols, flavonoids, and anthocyanins. For all the biochemical assays, plant leaves were crushed in liquid nitrogen with the help of a mortar and pestle, and were used for the respective biochemical assay as described below. In addition, a part of the fresh plant material was lyophilized (Telstar Cryodos-80, Terrassa, Spain) for 30 h for the determination of hormone profile. The other half of the plant material was dried in a forced air oven (DAF-635, RAYPA, Terrassa, Spain) at 70 °C until obtaining a constant weight. The dried material was used to determine the dry weight (DW), and the concentration of essential nutrients.

2.5. Relative Growth Rate (RGR)

The RGR was calculated using the increase in FW of the plants from the time of application of the treatments to the time of sampling using the following equation [36]:
RGR = (ln DWf − ln DWi)/(Tf − Ti)
where T is time (number of days) and the subscripts indicate initial (i) and final sampling (f).

2.6. Analysis of Photosynthetic Efficiency

Parameters for evaluating photosynthetic efficiency were measured by a LICOR 6800 Portable Photosynthesis System infrared gas analyzer (IRGA: LICOR Inc. Lincoln, Nebraska USA). The instrument was warmed up for 30 min followed by its calibration prior to use. Intermediate plant leaves, under optimal growth conditions, were positioned in the measuring cuvettes. The following conditions were maintained in the measuring cuvettes: 400 μmol mol−1 of CO2 concentration, 500 μmol m2 s−1 photosynthetically active radiation (PAR), relative humidity 60%, and a leaf temperature of 30 °C. Stomatal conductance (gsw), transpiration rate (E), and net photosynthetic rate (A) were measured simultaneously. Water use efficiency (WUE) was calculated by dividing the net photosynthetic rate by the corresponding transpiration rate [37]. Photosyn Assistant LICOR software was used for data storage and analysis.

2.7. Determination of Hormone Profile

The cytokinins (CKs: trans-zeatin (tZ) + isopentenial adenine (iP)), gibberellins (GAs: GA1 + GA3 + GA4), and indoleacetic acid (IAA) were analyzed using the methodology of Ghanem et al. [38]. Lyophilized material was used for the determination of hormones. For this, 0.5 mL of cold (−20 °C) methanol/water (80/20, v/v) extraction mixture was used to homogenize 30 mg of lyophilized plant material. The resulting homogenate was centrifuged at 20,000× g for 15 min and re-extracted at 4 °C for 30 min in an additional 0.5 mL of the same extraction solution. The resulting supernatants were passed through the Sep-Pak Plus-C18 cartridge (SepPak Plus, Waters, Milford, CT, USA) followed by an evaporation at 40 °C under vacuum for the removal of interfering lipids and plant pigments. It was then dissolved in 1 mL of methanol/water solution (20/80, v/v) in an ultrasonic bath. A filtration with 13 mm diameter Millex filters with a nylon membrane of 0.22 μm pore size (Millipore, Bedford, MA, USA) was performed. The resulting filtrate was injected, using a heated electrospray ionization interface (HESI), into a U-HPLC-MS system consisting of an Accela Series U-HPLC (ThermoFisher Scientific, Waltham, MA, USA) coupled to an Exact mass spectrometer (ThermoFisher Scientific). Xcalibur version 2.2 software (ThermoFisher Scientific) was used for acquiring the mass spectra. For plant hormone quantification, calibration curves were measured, with a recovery percentage of 92 to 95, for each component analyzed (1, 10, 50, and 100 μg L−1) and corrected for 10 μg L−1 of deuterated internal standards. Recovery percentages ranged from 92 to 95%.

2.8. Determination of Amino Acids and Soluble Proteins

Fresh plant material of 0.5 g was used for the determination of soluble amino acids and protein concentrations. This was further homogenized with 5 mL of 50 mM phosphate buffer pH 7.0. The resulting homogenate was filtered. A 4-layer gauze filter was used for this purpose. The filtrate was then centrifuged for 15 min at 12,360× g. After centrifugation, the supernatant was collected for the quantification of amino acids and soluble proteins. For proteins, 0.1 mL of supernatant was mixed with 5 mL of Coomassie blue and 0.9 mL of 50 mM phosphate buffer pH 7.0. The resulting solution was left at room temperature for 20 min followed by its measurement against an albumin standard curve at a wavelength of 595 nm [39]. The ninhydrin method was used for the quantification of soluble amino acids [40].

2.9. Nutrient Content and Efficiency of Nutrient Utilization

Nutrient content for phosphorus (P), potassium (K), calcium (Ca), magnesium (Mg), sulfur (S), iron (Fe), copper (Cu), manganese (Mn), zinc (Zn), molybdenum (Mo), and boron (B) was determined using ICP-OES. Plant leaves were mineralized according to Wolf [41]. Dried plant roots and leaves (0.2 g) were digested with 69% nitric acid (HNO3) and 30% H2O2 at 300 °C. Subsequently, the analysis of ionic elements was performed with the resulting mineralized product. Total N was determined by mineralizing 0.2 g of dried leaves and roots with 98% sulfuric acid (H2SO4) and 30% H2O2 at a temperature of 300 °C. Afterwards, the mineralized product was used to determine total N concentration using the Berthelot reaction, as described by Krom [42]. Nitrogen utilization efficiency (NUtE), defined as the quotient between biomass production and the amount of nitrogen in the leaves, was calculated employing the equation described by Xu et al. [43].

2.10. Fluorescence Analysis of Chlorophyll a

Fully developed plant leaves, adapted to darkness for half an hour using leaf clips, were used for measuring chlorophyll a fluorescence with Handy PEA Chlorophyll Fluorimeter (Hansatech Ltd., King’s Lynn, Norfolk, UK). The JIP test was performed to analyze OJIP phases that were induced by a 650 nm red light of 3000 µmol photons m−2 s−1 light intensity (Strasser et al. 2000). The photosynthetic activity and energy fluxes studied from the JIP test were performance index (PIABS), fluorescence value at 300 µs (Peak K), ratio of active reaction centers (RC) (RC/ABS), initial fluorescence (Fo), maximum fluorescence (Fm), variable fluorescence (Fv = Fm − Fo), the value 1 − Vj, which indicates electron output primarily from photosystem II (PSII), and maximum quantum product of primary photochemistry (ΦPo = Fv/Fm) [37].

2.11. Photosynthetic Pigments Concentration

The methodology described by Wellburn [44] was adopted to measure the concentration of photosynthetic pigments. Fresh plant material, 0.1 g, was homogenized with 1 mL of methanol followed by a centrifugation at 5000× g for 5 min. Three different wavelengths of 666, 653, and 470 nm were used to record the absorbance. The following formulas were used to calculate chlorophyll a, b, and carotenoid concentrations:
C h l o r o p h y l l   a = 15.65 × A 666   n m     7.34   x × A 653   n m
C h l o r o p h y l l   b = 27.05 × A 653   n m     11.21 × A 666   n m
C a r o t e n o i d s = ( 1000 × A 470   n m     2.86 × C h l   a     129.2 × C h l   b ) / 221

2.12. Determination of the Concentration of Oxidative Stress Indicators (MDA, H2O2 and O2)

The concentration of malondialdehyde (MDA) was determined by homogenizing fresh plant material (0.2 g) with 5 mL of 50 mM buffer (0.07% NaH2PO4·2H2O and 1.6% Na2HPO4·12H2O). The resulting homogenate was centrifuged for 25 min at 20,000× g. One milliliter of supernatant was added to test tubes having 4 mL of 20% trichloroacetic acid containing 0.5% thiobarbituric acid. Subsequently, the mixture was heated for 30 min at 95 °C. The resulting mixture was then cooled in an ice bath followed by its centrifugation for 10 min at 10,000× g. The absorbance of the resulting supernatant was recorded at a wavelength of 532 nm. The concentration of MDA was calculated using the molar extinction coefficient of MDA of 155 mM−1 cm−1 [45,46].
The concentration of hydrogen peroxide (H2O2) was determined colorimetrically [47] by homogenizing the plant material (0.5 g) in acetone. An aliquot of 1 mL was taken from the resulting homogenate and added to 200 µL of 0.1% titanium dioxide in 20% (v:v) H2SO4. Subsequently, a centrifugation for 15 min at 6000× g was performed. The resulting supernatant was analyzed for its yellow color intensity at 415 nm against a standard curve of H2O2.
The concentration of superoxide (O2) was determined according to the method described by Zhongguang and Ming [48]. Fresh plant material of 0.1 g was homogenized with 300 μL of 50 mM phosphate buffer followed by a centrifugation for 15 min at 10,000× g. Subsequently, 250 μL of 50 mM phosphate buffer and 10 mM hydroxylamine were added to an aliquot of 250 μL. The resulting mixture was incubated at 25 °C for 20 min. Afterwards, 180 μL of 17 mM sulfonilic acid and 180 μL of α-1-naphthylamine 7 mM were added to 60 μL of the supernatant followed by an incubation at room temperature for 1h. A standard curve of O2 was prepared from 5 mM sodium nitrite (NaNO2) following the same protocol as described above. Finally, color intensity was recorded at a wavelength of 530 nm against the standard curve of O2.

2.13. Determination of the Concentration of Total Phenols, Flavonoids and Anthocyanins

The concentration of total phenols was determined according to Rivero et al. [49]. Fresh plant material of 0.1 g was homogenized with 0.5 mL of chloroform, 0.5 mL of methanol, and 0.25 mL of 1% NaCl followed by its centrifugation for 10 min at 2000× g. Subsequently, 180 µL of H2O, 240 µL of Na2CO3, and 90 µL of 50% Folin–Ciocalteau reagent were added to the aliquot obtained from methanolic phase after centrifugation. The reaction mixture was shaken and incubated at room temperature for 1 h. Later, absorbance of the solution was recorded at 725 nm.
The concentration of total flavonoid was determined according to Kim et al. [50] with minor modifications. The same extraction procedure as that of phenols was used. After centrifugation, 340 µL of H2O and 26 µL of NaNO2 were added to an 85 µL aliquot of methanolic phase. The resulting reaction mixture was allowed to stand for 5 min in the dark, followed by the addition of 26 µL of AlCl3, imparting a yellowish hue to the sample, and 170 µL of NaOH that imparted a pink color to the solution. The reaction mixture was shaken well and allowed to stand in the dark for 15 min. Samples absorbance was recorded at 415 nm.
The concentration of anthocyanin was determined by the differential pH method of Giusti and Wrolstad [51]. One milliliter of 1% acidified methanol was added to 0.1 g of crushed plant material. A centrifugation for 15 min at 2000× g was carried out. Subsequently, 1 mL of potassium chloride was added to 250 µL of the supernatant followed by its measurement in the spectrophotometer at an absorbance of 460 nm. A quantity of 1 mL of sodium acetate mixed with 250 µL of the supernatant was measured at an absorbance of 710 nm. Calculations were performed according to the following formula:
[ ( ( A 460     A 710 ) × 449.2 × 0.2 × 1000 ) / 26900 ]

2.14. Statistical Analysis

Three repetitions were performed for all the analyses. Analysis of variance was performed using simple ANOVA, with a 95% confidence interval, to statistically evaluate the results. Fisher’s least significant difference (LSD) test at a 95% probability level was performed for comparing the differences between treatment means. Significance levels are represented as: * p < 0.05; ** p < 0.01; *** p < 0.001; NS not significant.

3. Results and Discussion

3.1. Experiment 1: Efficacy of RAZORMIN® as a Biostimulant

Biostimulants’ function and role in plant growth are independent of their nutrient content and are thus considered different from fertilizers, and have also been recognized in the new European FPR [4,5]. Considering the attributes of biostimulants, one of the first characteristics that must define a biostimulant is the absence of phytotoxic effects and, on the contrary, the stimulation of plant growth and productivity.
In this study, plants with RAZORMIN® application were found to have 17% more FW than control (Figure 1), thus fulfilling the first requirement for being a plant biostimulant [1,4], since RAZORMIN® improved plant growth. Similar results of improved growth in pepper plants with the use of seaweed liquid extracts have been reported previously [52]. In addition, a positive relationship between plant growth and use of biostimulants (i.e., legume-derived protein hydrolysate and tropical plant extract) has also been reported previously [53].
In order to relate the stimulation of plant growth with the induction/activation of different physiological processes, carbon metabolism was studied by analyzing photosynthesis parameters and sugars concentration. Various parameters including gsw, A, E, and WUE provided useful information about the development and growth of plants, and a summary of these parameters is presented in Table 2. Application of the biostimulant improved A, with higher and statistically significant values compared to control plants, which would explain the stimulation of plant growth resulted by the application of RAZORMIN®. In addition, application of RAZORMIN® facilitated gas exchange through the stomata, by improving E and gsw, without affecting WUE. Therefore, the improvement of gas exchange by the application of RAZORMIN® would lead to a greater availability of intracellular CO2, which would explain the higher net photosynthesis rate obtained after the application of RAZORMIN®. In short, these results clearly show the inducing effect of RAZORMIN® on carbon metabolism in plants. The induction of carbon metabolism, and especially the synthesis of sugars, is essential for plant growth, since these compounds provide energy and carbon skeletons for the synthesis of essential biomolecules for growth in all parts of the plant, such as amino acids, organic acids, defense compounds of secondary metabolism, and hormones [54]. Previously, lettuce plants have been reported to exhibit improved photosynthetic parameters upon the application of biostimulants, e.g., borage extracts [55], which reinforce the findings in present study. Moreover, an improvement in photosynthetic parameters in lettuce and tomato plants following the application of plant-based protein hydrolysates [56] also support the findings of this study.
With regard to the plant growth, analysis of the hormone profile is essential to explain the biostimulant effect of any compound or prototype applied to plants. Application of RAZORMIN® produced a very significant increase, mainly in the growth hormones tZ and the active gibberellins GA1, GA3, and GA4 (Table 3). An increase in the concentration of IAA was also observed, although this was less significant than the previous findings. With respect to the other cytokinin analyzed (iP), no differences between treatments were found (Table 3). These results suggest a mechanism of action of RAZORMIN®, i.e., that it stimulates the hormones responsible for cell elongation and division (mainly gibberellins and cytokinins) [57], which would explain the improvement in plant growth due to the application of RAZORMIN®.
By comparison, stress hormones, i.e., abscisic acid (ABA), and ethylene and its precursor aminocyclopropane-1-carboxylic acid (ACC), not only indicate the presence of stress but also respond to stress by regulating processes such as leaf abscission, reactive oxygen species (ROS) generation, and senescence. Similarly, jasmonic acid and salicylic acid hormones, although more associated with biotic stresses, also participate in the regulation and/or generation of resistance signals under different abiotic stresses [57]. In this regard, only a significant increase in salicylic acid after RAZORMIN® application was observed in this study, whereas no differences were observed for the hormones ABA, ACC, and jasmonic acid (Table 3). Salicylic acid, a phenolic compound that functions as a hormone under stress conditions, induces antioxidant response in plants [58]. Higher concentrations of this hormone may explain the possible protective effect of the biostimulant RAZORMIN® under stress conditions.
N in plants is one of the major essential nutrients, representing, in general, between 1.5 and 6 percent of dry matter, and is essential in the biochemistry of many non-protein compounds such as hormones, coenzymes, polyamines, secondary metabolites, and photosynthetic pigments. These nutritional and physiological characteristics of N make this nutrient determinant in obtaining optimal yields in most crops [59]. Similarly, amino acids and proteins are also considered essential and effective for determining the N nutritional status of plants [60,61]. Considering the concentration of soluble amino acids, a significant increase in their concentration with respect to the control plants was found upon the application of RAZORMIN® (Table 4). In contrast, the concentration of soluble proteins remained constant in both treatments. The increase in the concentration of amino acids, as observed in the RAZORMIN® treatment, is very beneficial for plant development since these compounds, in addition to being the nitrogenous form of transport and distribution to the growth zones, employ basic functions for plants such as synthesis of structural proteins, pigments, hormones, protective responses to different types of stress, and regulation of N absorption and assimilation [61]. Hence, use of biostimulants that would improve the nitrogen utilization efficiency (NUtE) of plants is greatly needed. Results showed that application of RAZORMIN® caused a higher leaf concentration of total N along with a significant increase in the NUtE (Table 4), which would favor, together with the processes mentioned above (induction of carbon metabolism and increase in the concentration of growth hormones), an increase in plant growth as observed after the application of RAZORMIN® (Figure 1). These findings for increases in N and NUtE following the use of protein hydrolysate-based biostimulants are in accordance with the previous findings in lettuce and tomato plants [56,62].
Plant nutrition is vital for plant growth and reproduction. In plants, macronutrients regulate several physiological processes, cellular signaling, and play important roles in many cellular structures [59,63,64]. The results indicated that the values obtained for macronutrients can be considered normal, with no excess or deficit of any macronutrient that may limit the normal growth of the plants [63]. The beneficial effect observed by the application of the biostimulant RAZORMIN® led to a generalized increase in the content of macronutrients with respect to the control plants (Table 5), so it can be concluded that application of RAZORMIN® substantially improves the nutritional status of macronutrients in pepper plants. Consequently, higher contents of macronutrients may result in improved plant growth and reproduction. These findings are consistent with the results reported previously where use of biostimulants (legume-derived protein hydrolysate) caused an increase in the concentration of macronutrients [65].
Additionally, micronutrients are responsible for modulating several metabolic reactions (i.e., photosynthesis, electron transport, N assimilation, etc.) and are either precursors or activators of various enzyme systems [63]. The content of micronutrients in leaves is presented in Table 6. In general, the values obtained for micronutrients can be considered normal, there being in no case a decisive excess or deficit of any micronutrient that may limit normal plant growth. However, the beneficial effect of the application of RAZORMIN® was observed by the increase in the foliar concentration of the micronutrients Fe, Zn, Mo, and B. Fe is part of the catalytic groups of many redox enzymes of the hemoprotein type, such as cytochromes, peroxidases, and catalases. It is found attached to cysteine thionic groups in other S-Fe proteins, such as sulfoferro-proteins that are key in basic physiological processes including photosynthesis, N assimilation, and S assimilation [63]. Similarly, Zn is an activator of at least 80 enzyme systems and is essential in auxin biosynthesis [63]. Considering the functions of Mo and B, it is reported that B plays basic structural role (integrity of the cell wall) and is also related to the physiological processes such as cell division and elongation, germination, and hormone regulation. Mo is a component of the enzymes nitrogenase, nitrate reductase, and sulfite oxidase, and is crucial for atmospheric N fixation, nitrate assimilation, and SO2 detoxification processes. In addition, it seems to be involved in the formation of the hormone abscisic acid [63,66]. Therefore, it can be implied that RAZORMIN® application improved the nutritional status of plants in terms of micronutrients, thereby stimulating plant growth. The increased nutritional status of plants with the application of different biostimulants has also been reported in okra and geranium plants [67,68].

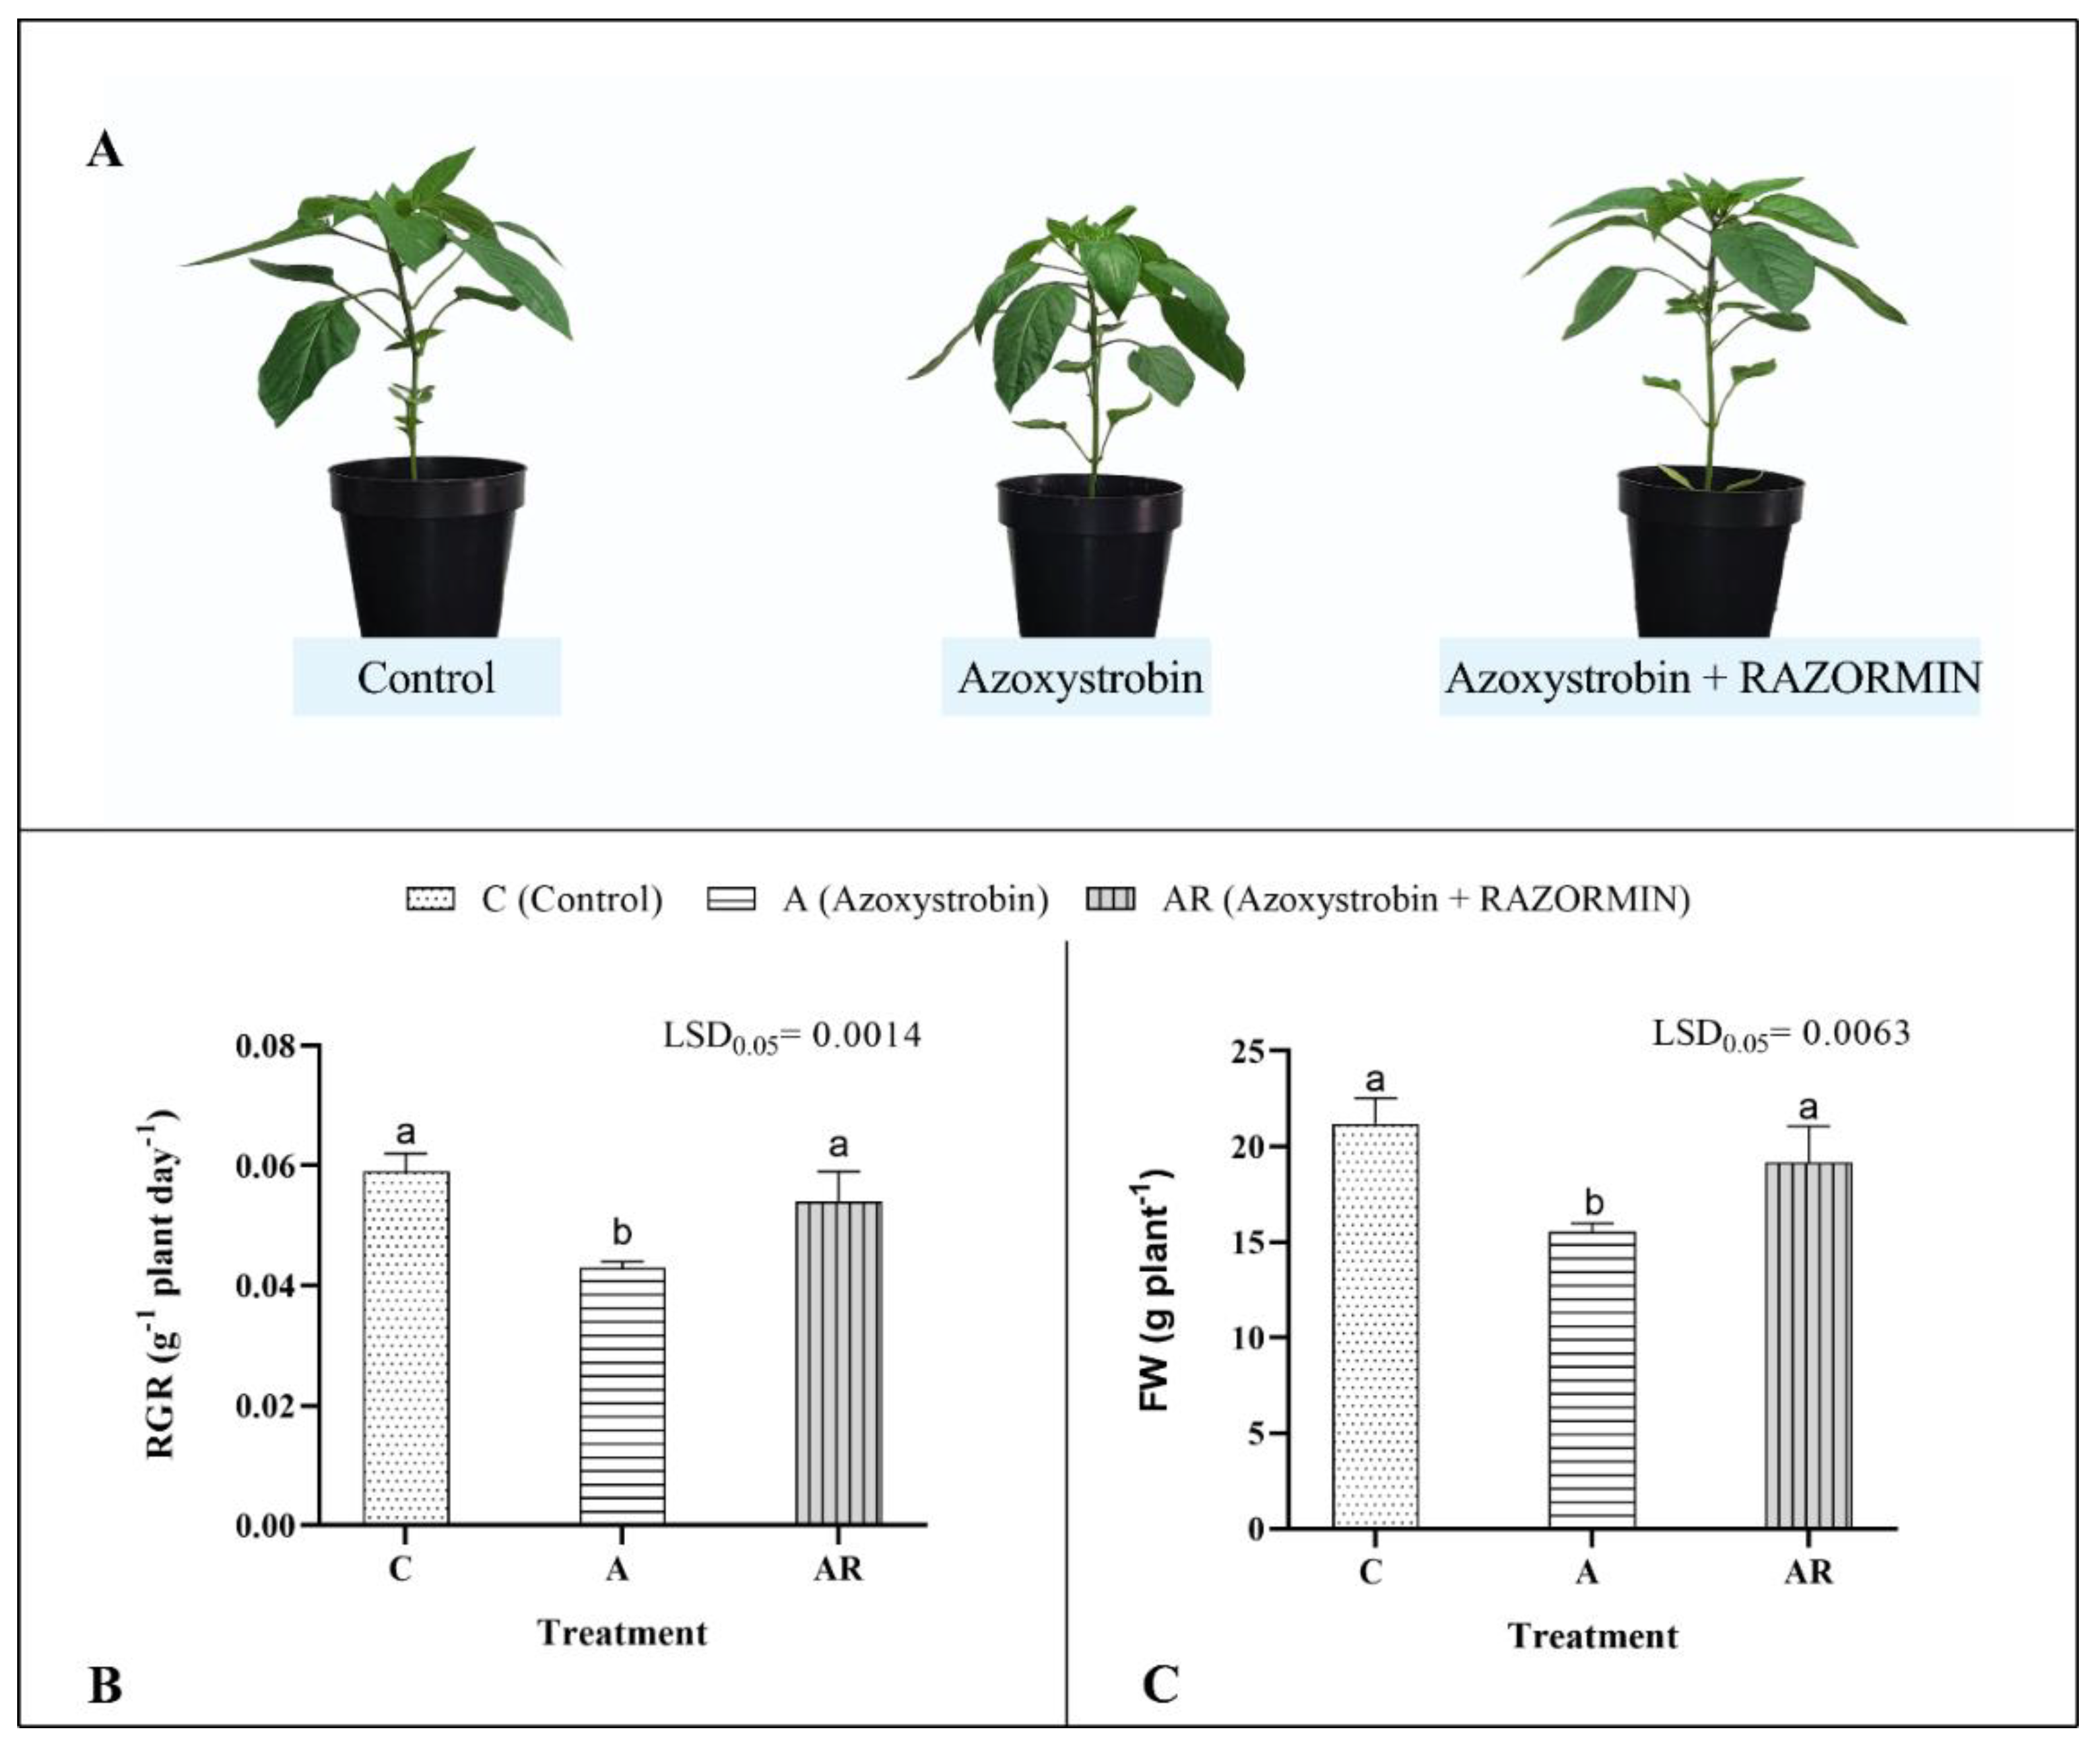
3.2. Experiment 2: Efficacy of RAZORMIN® as a Biostimulant Reducing the Phytotoxicity of the Fungicide Azoxystrobin

The first parameters that reliably define the existence of an abiotic stress are those related to plant growth. Therefore, in this study, growth parameters such as biomass production or growth of the aerial part expressed in fresh biomass and the relative growth rate of the aerial part were analyzed in order to test the influence of the biostimulant RAZORMIN® under azoxystrobin stress. These parameters reliably indicate the growth of plants under different growth conditions, and, therefore, their ability to adapt to such hostile environment. It was observed that the application of the fungicide azoxystrobin produced a significant reduction in biomass production and the relative growth rate of the aerial part, presenting 20% reductions in growth values with respect to the untreated control plants (Figure 2). These results indicate that the application of this fungicide was phytotoxic to pepper plants. On the contrary, the foliar application of the biostimulant RAZORMIN® increased the fresh biomass production and relative growth rate of the aerial part, presenting growth values similar to those of control plants (Figure 2). In short, a clear protective effect of the biostimulant was observed, reducing the phytotoxicity generated by the application of the fungicide.
In order to evaluate the possible effect of the application of the biostimulant RAZORMIN® on pepper plants, subjected to the application of the fungicide azoxystrobin, on the photosynthetic process, different parameters that directly define the photochemical activity, such as chlorophyll a fluorescence, the concentration of photosynthetic pigments and photosynthetic efficiency were studied. The study of these parameters is very interesting because, in addition to indicating the vitality of plants, they provide an estimation of the phytotoxic effect caused by azoxystrobin and possible generation of ROS derived from the existence of failures in the photochemical activity of chloroplasts [20,37,69].
In this study, the Fv/Fm values observed for both treatments were around 0.81, with no statistical differences between any of the treatments (Table 6). These results are logical since Fv/Fm tends to be an index that is more influenced by the existence of environmental stress [37]. Regarding the remainder of the indices indicating plant vitality, there were practically no significant differences between treatments (Table 7), which indicates that the phytotoxic effect observed when applying the fungicide azoxystrobin was not due to a reduction in the photochemical stage of photosynthesis. Previous studies have also reported a decrease in the Fv/Fm ratio in soybean plants upon the application of strobilurin-type fungicides, indicating that strobilurins inhibit photosynthesis directly and may not be directly related to the decrease in intracellular CO2 concentration. This is probably because strobilurins bind to the Qi site of the chloroplast cytochrome bf complex, resulting in a blockage of electron transport between photosystem II (PSII) and photosystem I (PSI) [70].
Like chlorophyll a fluorescence, concentrations of chlorophyll a, b, and carotenoids are indicative of photochemical activity. It was observed that the application of the fungicide azoxystrobin significantly reduced the concentration of chlorophyll a (Table 8). These results confirm those of other studies, since it has been observed that application of this type of fungicide inhibits both the synthesis of the precursor of chlorophylls and delta aminolaevulinic acid, and the activity of protochlorophyllide reductase, leading to a significant reduction in the concentration of photosynthetic pigments [20,70]. The protective effect of RAZORMIN® application reducing the phytotoxic effect of azoxystrobin application was confirmed by the increase in leaf chlorophyll a concentration, with values similar to those of control plants. Finally, with respect to carotenoids, no statistically significant changes were observed in the detoxification effect of RAZORMIN® (Table 8).
When plants begin to experience stress, there is a decrease in leaf water loss through a significant reduction in E, decreasing gsw, and increasing stomatal resistance due to stomata closure. Stomata closure is considered a rapid stress adaptation mechanism and is essential for reducing plant water loss. However, long-term maintenance of this strategy is generally counterproductive as stomata closure reduces intracellular CO2 input, leading to a reduction in photosynthesis (especially the Calvin Cycle), and thus to a lack of the endogenous electron acceptor NADP, which ultimately results in the formation of ROS [71]. In this study, no treatment produced variations in the values of A, which may indicate that the phytotoxic effect of azoxystrobin application was not mainly due to a reduction in photosynthesis (Table 9). However, application of azoxystrobin produced a significant reduction in E and gsw, increasing WUE, which indicates that the application of this fungicide produced a significant stomatal closure. By comparison, the application of the biostimulant RAZORMIN® resulted in the lowest values of E and gsw, and therefore the highest values of WUE (Table 9). Similar results have been reported in barley crop under the application of fungicide and biostimulant where improvement in photosynthetic parameters was observed [72].These minimum values of E and gsw that occurred after the application of RAZORMIN® biostimulant would explain the minimum values in A that were observed in these plants, although without significant differences with respect to control plants. In short, the reduction in transpiration processes derived from stomatal closure in these treatments (azoxystrobin and azoxystrobin + RAZORMIN®), in the long term, may lead to an increase in the formation of ROS, even though they caused an improvement in WUE. Similar results have been reported previously following the application of strobilurin-type fungicides in rice, barley, wheat, and soybean plants [69,70].
Furthermore, the application of this type of fungicide results in an increase in the formation of ROS, mainly O2.− and H2O2, due to the alteration in electron transport, between photosystem II and I, in the chloroplast during the photochemical stage of photosynthesis [22,70]. As an indirect consequence, the application of strobilurins will activate the antioxidant systems of plants in order to avoid or reduce phytotoxic damage generated by the accumulation of ROS. However, the activation of the antioxidant systems in many cases is insufficient to mitigate the phytotoxic effect caused by the application of strobilurin-type fungicides [20,21,22,73].
One of the possible protective effects of biostimulants against stress is the reduction in cellular oxidative damage, and thus membrane lipid peroxidation, by regulating the antioxidant defense and decreasing the level of ROS in plants [3]. Results showed that the plants subjected to the fungicide azoxystrobin had the highest levels of MDA (Table 10), which coincided with the lowest biomass production of the aerial part in this study (Figure 1). In contrast, the application of RAZORMIN® significantly reduced the foliar levels of MDA with concentrations similar to those of control plants. Like MDA, the maximum foliar concentrations of H2O2 and O2.− were observed in plants subjected to the fungicide azoxystrobin. By comparison, the application of RAZORMIN® more significantly reduced the foliar concentrations of these ROS, presenting levels similar to those of control plants (Table 10).
Furthermore, the response of the antioxidant compounds phenols, flavonoids, and anthocyanins, which have the ability to scavenge ROS in the presence of plant stress [74,75], was analyzed (Table 11). The results showed that, in general, the untreated control plants showed the lowest foliar concentrations of total phenols, flavonoids, and anthocyanins. In contrast, RAZORMIN® application, in plants subjected to fungicide azoxystrobin, resulted in the highest concentrations of total phenols, flavonoids, and anthocyanins; specifically, an increase of 372% in the leaf concentration of anthocyanins was observed. Analogous results showing an increased concentration of these antioxidant compounds, following the application of biostimulants, have been reported in pepper and tomato plants [52,76,77].
In short, considering the indicators of oxidative stress and antioxidant compounds, it can be concluded that a beneficial effect of the application of the biostimulant RAZORMIN® in plants to which the fungicide azoxystrobin had been applied was observed. Similarly, the application of RAZORMIN® under these conditions led to a reduction in the formation of ROS, generated by the application of the fungicide azoxystrobin, thus reducing lipid peroxidation by triggering the synthesis of antioxidant compounds such as phenols, flavonoids, and especially anthocyanins.

4. Conclusions

The present study was undertaken to evaluate the efficiency of the compound RAZORMIN® as a biostimulant product while taking into account its role in plant growth stimulation and stress, provoked by the fungicide azoxystrobin, mitigation. This study found the application of biostimulant RAZORMIN® markedly improved the growth of pepper plants by stimulating carbon metabolism, improving the net photosynthesis rate, gas exchange, N metabolism (with increases in soluble amino acids, foliar N concentration, and N use efficiency), growth hormone concentration (especially gibberellins and cytokinins), nutritional status of plants (producing a greater accumulation of macronutrients i.e., Mg, Ca, P, K, and S, and micronutrients i.e., Fe, Zn, Mo, and B), and sugars concentration. Alternatively, the application of the biostimulant RAZORMIN® to plants under fungicide azoxystrobin stress demonstrated a protective role by stimulating the net photosynthesis rate, improved gas exchange efficiency, and antioxidant defense system.
The preliminary results of this study suggest the use of RAZORMIN® as a biostimulant and safener product (against fungicide azoxystrobin), in pepper plants, which may be further exploited for other crops. However, since this study was conducted in a laboratory setting and under controlled conditions, further trials may be necessary to evaluate the efficacy of this product under greenhouse or field conditions.

Author Contributions

Conceptualization, J.M.R. and B.B.; methodology, A.A., E.N.-L. and B.B.; validation, M.J.I.-R., B.B., J.J.R. and J.M.R.; formal analysis, A.A.; investigation, A.A. and E.N.-L.; resources, J.M.R. and I.N.-M.; data curation, A.A. and E.N.-L.; writing—original draft preparation, A.A.; writing—review and editing, B.B. and J.M.R.; visualization, A.A.; supervision, J.M.R. All authors have read and agreed to the published version of the manuscript.

Funding

This work was supported by the PAI program (Plan Andaluz de Investigación, Grupo de Investigación AGR282).

Data Availability Statement

Not applicable.

Acknowledgments

Not applicable.

Conflicts of Interest

The authors declare no conflict of interest. The funders had no role in the design of the study; in the collection, analyses, or interpretation of data; in the writing of the manuscript, or in the decision to publish the results.

References

  1. Brown, P.; Saa, S. Biostimulants in agriculture. Front. Plant Sci. 2015, 6, 671. [Google Scholar] [CrossRef] [PubMed] [Green Version]
  2. Yakhin, O.I.; Lubyanov, A.A.; Yakhin, I.A.; Brown, P.H. Biostimulants in Plant Science: A Global Perspective. Front. Plant Sci. 2017, 7, 2049. [Google Scholar] [CrossRef] [PubMed] [Green Version]
  3. Zulfiqar, F.; Casadesús, A.; Brockman, H.; Munné-Bosch, S. An overview of plant-based natural biostimulants for sustainable horticulture with a particular focus on moringa leaf extracts. Plant Sci. 2020, 295, 110194. [Google Scholar] [CrossRef] [PubMed]
  4. Ricci, M.; Tilbury, L.; Daridon, B.; Sukalac, K. General Principles to Justify Plant Biostimulant Claims. Front. Plant Sci. 2019, 10. [Google Scholar] [CrossRef]
  5. Regulation (EU). Fertilising Products Regulation (FPR) (EU) 2019/1009. Available online: https://eur-lex.europa.eu/eli/reg/2019/1009/oj (accessed on 2 June 2022).
  6. Briglia, N.; Petrozza, A.; Hoeberichts, F.A.; Verhoef, N.; Povero, G. Investigating the Impact of Biostimulants on the Row Crops Corn and Soybean Using High-Efficiency Phenotyping and Next Generation Sequencing. Agronomy 2019, 9, 761. [Google Scholar] [CrossRef] [Green Version]
  7. EBIC. European Biostimulant Industry Council. Available online: https://biostimulants.eu/wp-content/uploads/2019/10/EBIC-Brochure-English.pdf (accessed on 2 June 2022).
  8. Zarzecka, K.; Gugała, M.; Mystkowska, I.; Sikorska, A. Total and True Protein Content in Potato Tubers Depending on Herbicides and Biostimulants. Agronomy 2020, 10, 1106. [Google Scholar] [CrossRef]
  9. De Saeger, J.; Van Praet, S.; Vereecke, D.; Park, J.; Jacques, S.; Han, T.; Depuydt, S. Toward the molecular understanding of the action mechanism of Ascophyllum nodosum extracts on plants. J. Appl. Phycol. 2020, 32, 573–597. [Google Scholar] [CrossRef] [Green Version]
  10. Caradonia, F.; Ronga, D.; Flore, A.; Barbieri, R.; Moulin, L.; Terzi, V.; Francia, E. Biostimulants and cherry rootstock in-creased tomato fruit yield and quality in sustainable farming systems. Ital. J. Agron. 2020, 15, 121–131. [Google Scholar]
  11. Pobereżny, J.; Szczepanek, M.; Wszelaczyńska, E.; Prus, P. The Quality of Carrot after Field Biostimulant Application and after Storage. Sustainability 2020, 12, 1386. [Google Scholar] [CrossRef] [Green Version]
  12. Kocira, S.; Szparaga, A.; Findura, P.; Treder, K. Modification of yield and fiber fractions biosynthesis in Phaseolus vulgaris L. by treatment with biostimulants containing amino acids and seaweed extract. Agronomy 2020, 10, 1338. [Google Scholar] [CrossRef]
  13. Rouphael, Y.; Colla, G. Biostimulants in agriculture. Front. Plant Sci. 2020, 11, 40. [Google Scholar] [CrossRef] [PubMed] [Green Version]
  14. Drobek, M.; Frąc, M.; Cybulska, J. Plant Biostimulants: Importance of the Quality and Yield of Horticultural Crops and the Improvement of Plant Tolerance to Abiotic Stress—A Review. Agronomy 2019, 9, 335. [Google Scholar] [CrossRef] [Green Version]
  15. Hasanuzzaman, M.; Parvin, K.; Bardhan, K.; Nahar, K.; Anee, T.I.; Masud, A.A.C.; Fotopoulos, V. Biostimulants for the Regulation of Reactive Oxygen Species Metabolism in Plants under Abiotic Stress. Cells 2021, 10, 2537. [Google Scholar] [CrossRef] [PubMed]
  16. Francesca, S.; Arena, C.; Hay Mele, B.; Schettini, C.; Ambrosino, P.; Barone, A.; Rigano, M.M. The Use of a Plant-Based Biostimulant Improves Plant Performances and Fruit Quality in Tomato Plants Grown at Elevated Temperatures. Agronomy 2020, 10, 363. [Google Scholar] [CrossRef] [Green Version]
  17. Giordano, M.; El-Nakhel, C.; Caruso, G.; Cozzolino, E.; De Pascale, S.; Kyriacou, M.C.; Colla, G.; Rouphael, Y. Stand-Alone and Combinatorial Effects of Plant-based Biostimulants on the Production and Leaf Quality of Perennial Wall Rocket. Plants 2020, 9, 922. [Google Scholar] [CrossRef]
  18. Van Oosten, M.J.; Pepe, O.; De Pascale, S.; Silletti, S.; Maggio, A. The role of biostimulants and bioeffectors as alleviators of abiotic stress in crop plants. Chem. Biol. Technol. Agric. 2017, 4, 5. [Google Scholar] [CrossRef] [Green Version]
  19. Lucini, L.; Miras-Moreno, B.; Rouphael, Y.; Cardarelli, M.; Colla, G. Combining Molecular Weight Fractionation and Metabolomics to Elucidate the Bioactivity of Vegetal Protein Hydrolysates in Tomato Plants. Front. Plant Sci. 2020, 11, 976. [Google Scholar] [CrossRef]
  20. Petit, A.-N.; Fontaine, F.; Vatsa, P.; Clément, C.; Vaillant-Gaveau, N. Fungicide impacts on photosynthesis in crop plants. Photosynth. Res. 2012, 111, 315–326. [Google Scholar] [CrossRef]
  21. Junqueira, V.B.; Müller, C.; Rodrigues, A.A.; Amaral, T.S.; Batista, P.F.; Silva, A.A.; Costa, A.C. Do fungicides affect the physiology, reproductive development and productivity of healthy soybean plants? Pestic. Biochem. Physiol. 2021, 172, 104754. [Google Scholar] [CrossRef]
  22. Amaro, A.C.E.; Baron, D.; Ono, E.O.; Rodrigues, J.D. Physiological effects of strobilurin and carboxamides on plants: An overview. Acta Physiol. Plant. 2020, 42, 4. [Google Scholar] [CrossRef]
  23. Basha, C.J.; Soniya, M.; Ganiger, P.C. Field evaluation of fungicides against powdery mildew of chilli (Capsicum annuum L.). Int. J. Plant Prot. 2017, 10, 329–332. [Google Scholar] [CrossRef]
  24. Karkanis, A.; Bilalis, D.; Efthimiadou, A.; Katsenios, N. Effects of field bindweed (Convolvulus arvensis L.) and powdery mildew [Leveillula taurica (Lev.) Arn.] on pepper growth and yield–Short communication. Hortic. Sci. 2012, 39, 135–138. [Google Scholar] [CrossRef] [Green Version]
  25. Madhavan, S.; Adhipathi, P.; Velazhahan, R.; Paranidharan, V.; Karthikeyan, M. Management of chilli (Capsicum annuum) anthracnose using fungicides and biocontrol agents. Indian Phytopathol. 2017, 70, 86–90. [Google Scholar] [CrossRef] [Green Version]
  26. Kharkwal, M.; Mishra, J.; Prasad, R. In vitro evaluation of different fungicides in inhibiting the mycelia growth of Colle-totrichum capsici causing Anthracnose of chili. J. Pharmacogn. Phytochem. 2020, 9, 919–921. [Google Scholar]
  27. Ahiladevi, P.; Prakasm, V. Effect of Azoxystrobin 25 SC on the biochemical parameters of chilli (Capsicum annuum L.). Karnataka J. Agric. Sci. 2014, 27, 355–356. [Google Scholar]
  28. Gullino, M.L.; Minuto, A.; Gilardi, G.; Garibaldi, A. Efficacy of azoxystrobin and other strobilurins against Fusarium wilts of carnation, cyclamen and Paris daisy. Crop Prot. 2002, 21, 57–61. [Google Scholar] [CrossRef]
  29. Mahajan, N.S.; Mishra, M.; Tamhane, V.A.; Gupta, V.S.; Giri, A.P. Stress inducible proteomic changes in Capsicum annuum leaves. Plant Physiol. Biochem. 2014, 74, 212–217. [Google Scholar] [CrossRef]
  30. Kong, X.-M.; Zhou, Q.; Luo, F.; Wei, B.-D.; Wang, Y.-J.; Sun, H.-J.; Zhao, Y.-B.; Ji, S.-J. Transcriptome analysis of harvested bell peppers (Capsicum annuum L.) in response to cold stress. Plant Physiol. Biochem. 2019, 139, 314–324. [Google Scholar] [CrossRef]
  31. Wang, H.; Liu, Z.; Luo, S.; Li, J.; Zhang, J.; Li, L.; Xie, J. 5-Aminolevulinic acid and hydrogen sulphide alleviate chilling stress in pepper (Capsicum annuum L.) seedlings by enhancing chlorophyll synthesis pathway. Plant Physiol. Biochem. 2021, 167, 567–576. [Google Scholar] [CrossRef]
  32. Agliassa, C.; Mannino, G.; Molino, D.; Cavalletto, S.; Contartese, V.; Bertea, C.M.; Secchi, F. A new protein hydroly-sate-based biostimulant applied by fertigation promotes relief from drought stress in Capsicum annuum L. Plant Physiol. Biochem. 2021, 166, 1076–1086. [Google Scholar] [CrossRef]
  33. Tort, N.; Turkyilmaz, B. Physiological Effects of Captan Fungicide on Pepper (Capsicum annuum L.) Plant. Pak. J. Biol. Sci. 2003, 6, 2026–2029. [Google Scholar] [CrossRef] [Green Version]
  34. Barrajón-Catalán, E.; Álvarez-Martínez, F.J.; Borrás, F.; Pérez, D.; Herrero, N.; Ruiz, J.J.; Micol, V. Metabolomic analysis of the effects of a commercial complex biostimulant on pepper crops. Food Chem. 2020, 310, 125818. [Google Scholar] [CrossRef]
  35. Parađiković, N.; Teklić, T.; Zeljković, S.; Lisjak, M.; Špoljarević, M. Biostimulants research in some horticultural plant species—A review. Food Energy Secur. 2019, 8, e00162. [Google Scholar] [CrossRef]
  36. Bellaloui, N.; Brown, P.H. Cultivar differences in boron uptake and distribution in celery (Apium graveolens), tomato (Lycopersicon esculentum) and wheat (Triticum aestivum). Plant Soil 1998, 198, 153–158. [Google Scholar] [CrossRef]
  37. Strasser, R.J.; Srivastava, A.; Tsimilli-Michael, M. The fluorescence transient as a tool to characterize and screen photo-synthetic samples. In Probing Photosynthesis: Mechanisms, Regulation and Adaptation; CRC Press: Boca Raton, FL, USA, 2000; pp. 445–483. [Google Scholar]
  38. Ghanem, M.E.; Albacete, A.; Martínez-Andújar, C.; Acosta, M.; Romero-Aranda, R.; Dodd, I.C.; Lutts, S.; Pérez-Alfocea, F. Hormonal changes during salinity-induced leaf senescence in tomato (Solanum lycopersicum L.). J. Exp. Bot. 2008, 59, 3039–3050. [Google Scholar] [CrossRef] [PubMed] [Green Version]
  39. Bradford, M.M. A rapid and sensitive method for the quantitation of microgram quantities of protein utilizing the principle of protein-dye binding. Anal. Biochem. 1976, 72, 248–254. [Google Scholar] [CrossRef]
  40. Yemm, E.; Cocking, E.; Ricketts, R. The determination of amino-acids with ninhydrin. Analyst 1955, 80, 209–214. [Google Scholar] [CrossRef]
  41. Wolf, B. A comprehensive system of leaf analyses and its use for diagnosing crop nutrient status. Commun. Soil Sci. Plant Anal. 1982, 13, 1035–1059. [Google Scholar] [CrossRef]
  42. Krom, M.D. Spectrophotometric determination of ammonia: A study of a modified Berthelot reaction using salicylate and dichloroisocyanurate. Analyst 1980, 105, 305–316. [Google Scholar] [CrossRef]
  43. Xu, G.; Fan, X.; Miller, A.J. Plant Nitrogen Assimilation and Use Efficiency. Annu. Rev. Plant Biol. 2012, 63, 153–182. [Google Scholar] [CrossRef] [Green Version]
  44. Wellburn, A.R. The Spectral Determination of Chlorophylls a and b, as well as Total Carotenoids, Using Various Solvents with Spectrophotometers of Different Resolution. J. Plant Physiol. 1994, 144, 307–313. [Google Scholar] [CrossRef]
  45. Fu, J.; Huang, B. Involvement of antioxidants and lipid peroxidation in the adaptation of two cool-season grasses to lo-calized drought stress. Environ. Exp. Bot. 2001, 45, 105–114. [Google Scholar] [CrossRef]
  46. Heath, R.L.; Packer, L. Photoperoxidation in isolated chloroplasts: I. Kinetics and stoichiometry of fatty acid peroxidation. Arch. Biochem. Biophys. 1968, 125, 189–198. [Google Scholar] [CrossRef]
  47. Mukherjee, S.P.; Choudhuri, M.A. Implications of water stress-induced changes in the levels of endogenous ascorbic acid and hydrogen peroxide in Vigna seedlings. Physiol. Plant. 1983, 58, 166–170. [Google Scholar] [CrossRef]
  48. Zhongguang, L.; Ming, G. Improvement of measurement method for superoxide anion radical in plant. Acta Bot. Yunnanica 2005, 27, 211–216. [Google Scholar]
  49. Rivero, R.M.; Ruiz, J.M.; García, P.C.; López-Lefebre, L.R.; Sánchez, E.; Romero, L. Resistance to cold and heat stress: Accumulation of phenolic compounds in tomato and watermelon plants. Plant Sci. 2001, 160, 315–321. [Google Scholar] [CrossRef]
  50. Kim, D.-O.; Jeong, S.W.; Lee, C.Y. Antioxidant capacity of phenolic phytochemicals from various cultivars of plums. Food Chem. 2003, 81, 321–326. [Google Scholar] [CrossRef]
  51. Giusti, M.M.; Wrolstad, R.E. Characterization and Measurement of Anthocyanins by UV-Visible Spectroscopy. Curr. Protoc. Food Anal. Chem. 2001, F1.2.1–F1.2.13. [Google Scholar] [CrossRef]
  52. Ashour, M.; Hassan, S.M.; Elshobary, M.E.; Ammar, G.A.; Gaber, A.; Alsanie, W.F.; Mansour, A.T.; El-Shenody, R. Impact of commercial seaweed liquid extract (TAM®) biostimulant and its bioactive molecules on Growth and Antioxidant Activities of Hot Pepper (Capsicum annuum). Plants 2021, 10, 1045. [Google Scholar] [CrossRef]
  53. Di Mola, I.; Ottaiano, L.; Cozzolino, E.; Senatore, M.; Giordano, M.; El-Nakhel, C.; Sacco, A.; Rouphael, Y.; Colla, G.; Mori, M. Plant-Based Biostimulants Influence the Agronomical, Physiological, and Qualitative Responses of Baby Rocket Leaves under Diverse Nitrogen Conditions. Plants 2019, 8, 522. [Google Scholar] [CrossRef] [PubMed] [Green Version]
  54. Cho, M.-H.; Park, H.L.; Hahn, T.-R. Engineering leaf carbon metabolism to improve plant productivity. Plant Biotechnol. Rep. 2015, 9, 1–10. [Google Scholar] [CrossRef]
  55. Bulgari, R.; Morgutti, S.; Cocetta, G.; Negrini, N.; Farris, S.; Calcante, A.; Spinardi, A.; Ferrari, E.; Mignani, I.; Oberti, R.; et al. Evaluation of Borage Extracts as Potential Biostimulant Using a Phenomic, Agronomic, Physiological, and Biochemical Approach. Front. Plant Sci. 2017, 8, 935. [Google Scholar] [CrossRef] [PubMed]
  56. Choi, S.; Colla, G.; Cardarelli, M.; Kim, H.-J. Effects of Plant-Derived Protein Hydrolysates on Yield, Quality, and Nitrogen Use Efficiency of Greenhouse Grown Lettuce and Tomato. Agronomy 2022, 12, 1018. [Google Scholar] [CrossRef]
  57. Khan, N.; Bano, A.; Ali, S.; Babar, M.A. Crosstalk amongst phytohormones from planta and PGPR under biotic and abiotic stresses. Plant Growth Regul. 2020, 90, 189–203. [Google Scholar] [CrossRef]
  58. Boudet, A.-M. Evolution and current status of research in phenolic compounds. Phytochemistry 2007, 68, 2722–2735. [Google Scholar] [CrossRef] [PubMed]
  59. De Bang, T.C.; Husted, S.; Laursen, K.H.; Persson, D.P.; Schjoerring, J.K. The molecular–physiological functions of mineral macronutrients and their consequences for deficiency symptoms in plants. New Phytol. 2021, 229, 2446–2469. [Google Scholar] [CrossRef] [PubMed]
  60. Iqbal, A.; Qiang, D.; Zhun, W.; Xiangru, W.; Huiping, G.; Hengheng, Z.; Nianchang, P.; Xiling, Z.; Meizhen, S. Growth and nitrogen metabolism are associated with nitrogen-use efficiency in cotton genotypes. Plant Physiol. Biochem. 2020, 149, 61–74. [Google Scholar] [CrossRef]
  61. Congreves, K.A.; Otchere, O.; Ferland, D.; Farzadfar, S.; Williams, S.; Arcand, M.M. Nitrogen Use Efficiency Definitions of Today and Tomorrow. Front. Plant Sci. 2021, 12, 637108. [Google Scholar] [CrossRef]
  62. Colla, G.; Rouphael, Y.; Canaguier, R.; Svecova, E.; Cardarelli, M. Biostimulant action of a plant-derived protein hydrol-ysate produced through enzymatic hydrolysis. Front. Plant Sci. 2014, 5, 448. [Google Scholar] [CrossRef] [Green Version]
  63. Epstein, E.; Bloom, A. Mineral Nutrition of Plants: Principles and Perspectives, 2nd ed.; Sinauer Associates Inc.: Sunderland, UK, 2005; Volume 2005. [Google Scholar]
  64. Maathuis, F.J.M. Physiological functions of mineral macronutrients. Curr. Opin. Plant Biol. 2009, 12, 250–258. [Google Scholar] [CrossRef]
  65. Rouphael, Y.; Giordano, M.; Cardarelli, M.; Cozzolino, E.; Mori, M.; Kyriacou, M.C.; Bonini, P.; Colla, G. Plant-and sea-weed-based extracts increase yield but differentially modulate nutritional quality of greenhouse spinach through biostimulant action. Agronomy 2018, 8, 126. [Google Scholar] [CrossRef] [Green Version]
  66. Hänsch, R.; Mendel, R.R. Physiological functions of mineral micronutrients (Cu, Zn, Mn, Fe, Ni, Mo, B, Cl). Curr. Opin. Plant Biol. 2009, 12, 259–266. [Google Scholar] [CrossRef] [PubMed]
  67. Ali, E.; Hassan, F.; Elgimabi, M. Improving the growth, yield and volatile oil content of Pelargonium graveolens L. Herit by foliar application with moringa leaf extract through motivating physiological and biochemical parameters. S. Afr. J. Bot. 2018, 119, 383–389. [Google Scholar] [CrossRef]
  68. Abdalla, M.M. The potential of Moringa oleifera extract as a biostimulant in enhancing the growth, biochemical and hormonal contents in rocket (Eruca vesicaria subsp. sativa) plants. Int. J. Plant Physiol. Biochem. 2013, 5, 42–49. [Google Scholar] [CrossRef]
  69. Debona, D.; Nascimento, K.; Gomes, J.; Aucique-Perez, C.; Rodrigues, F. Physiological changes promoted by a strobilurin fungicide in the rice-Bipolaris oryzae interaction. Pestic. Biochem. Physiol. 2016, 130, 8–16. [Google Scholar] [CrossRef] [PubMed]
  70. Nason, M.A.; Farrar, J.; Bartlett, D. Strobilurin fungicides induce changes in photosynthetic gas exchange that do not improve water use efficiency of plants grown under conditions of water stress. Pest Manag. Sci. 2007, 63, 1191–1200. [Google Scholar] [CrossRef] [PubMed]
  71. Yadav, S.; Atri, N. Reactive Oxygen Species and Response of the Calvin–Benson Cycle: An Overview. In Reactive Oxygen Species in Plants: Boon or Bane-Revisiting the Role of ROS; John Wiley & Sons Ltd.: Oxford, UK, 2017; p. 157. [Google Scholar]
  72. Jalakas, P.; Tulva, I.; Kangor, T.; Sooväli, P.; Rasulov, B.; Tamm, Ü.; Koppel, M.; Kollist, H.; Merilo, E. Gas exchange-yield relationships of malting barley genotypes treated with fungicides and biostimulants. Eur. J. Agron. 2018, 99, 129–137. [Google Scholar] [CrossRef]
  73. Shahid, M.; Ahmed, B.; Zaidi, A.; Khan, M.S. Toxicity of fungicides to Pisum sativum: A study of oxidative damage, growth suppression, cellular death and morpho-anatomical changes. RSC Adv. 2018, 8, 38483–38498. [Google Scholar] [CrossRef] [Green Version]
  74. Mayer, A.; Harel, E. Phenoloxidases and their significance in fruit and vegetables. Food Enzymol. 1991, 1, 373–398. [Google Scholar]
  75. Havaux, M. Carotenoids as membrane stabilizers in chloroplasts. Trends Plant Sci. 1998, 3, 147–151. [Google Scholar] [CrossRef]
  76. Parađiković, N.; Vinković, T.; Vinković Vrček, I.; Žuntar, I.; Bojić, M.; Medić-Šarić, M. Effect of natural biostimulants on yield and nutritional quality: An example of sweet yellow pepper (Capsicum annuum L.) plants. J. Sci. Food Agric. 2011, 91, 2146–2152. [Google Scholar] [CrossRef] [PubMed]
  77. Klokić, I.; Koleška, I.; Hasanagić, D.; Murtić, S.; Bosančić, B.; Todorović, V. Biostimulants’ influence on tomato fruit char-acteristics at conventional and low-input NPK regime. Acta Agric. Scand. Sect. B Soil Plant Sci. 2020, 70, 233–240. [Google Scholar]
Figure 1. Improved plant growth upon the application of biostimulant RAZORMIN®. (A) Plant with and without biostimulant RAZORMIN® treatment. (B) Fresh weight (FW) of plants with and without biostimulant RAZORMIN® treatment. All the data values represent means ± SD, (n = 9). Fisher’s least-significance test (LSD; p = 0.05) was undertaken to analyze the differences between the means. Different letters indicate significantly different values.
Agronomy 12 01418 g001
Figure 2. Effect of the biostimulant RAZORMIN® application on pepper plants subjected to the application of the fungicide Azoxystrobin: phenotypic appearance of the plants (A), relative growth rate of the aerial part (B), and production of fresh biomass of the aerial part (C). Abbreviations; RGR: relative growth rate; FW: fresh weight. All the data values represent means ± SD, (n = 9). Fisher’s least-significance test (LSD; p = 0.05) was undertaken to analyze the differences between the means. Different letters indicate significantly different values.
Agronomy 12 01418 g002
Table 1. Constituents of RAZORMIN® presented by the manufacturer on the product label. Percentage is presented with respect to 1.24 kg net mass and 1 L product volume.
ProductPercentage
Free amino acids7% w/w
Polysaccharides3% w/w
Total nitrogen (N)4% w/w
Organic nitrogen (N)2.1% w/w
Nitric nitrogen (N)0.9% w/w
Ammoniacal nitrogen (N)1% w/w
Phosphorous pentoxide (P2O5) water soluble4% w/w
Potassium oxide (K2O) water soluble3% w/w
Iron (Fe) water soluble0.4% w/w
Manganese (Mn) water-soluble0.1% w/w
Boron (B) water-soluble0.1% w/w
Zinc (Zn) soluble in water0.085% w/w
Copper (Cu) water-soluble0.02% w/w
Molybdenum (Mo) water-soluble0.01% w/w
Table 2. Effect of the biostimulant RAZORMIN® application on photosynthesis and foliar concentration of soluble sugars in pepper plants.
TreatmentsA
(µmol m⁻2 s⁻1)
E
(mmol m⁻2 s⁻1)
gsw
(mmol m⁻2 s⁻1)
WUESoluble Sugars
(µg g⁻1 FW)
Control3.10 ± 1.080.38 ± 0.0825.72 ± 5.547.90 ± 1.2355.19 ± 3.50
RAZORMIN®4.89 ± 0.750.55 ± 0.0538.94 ± 3.238.81 ± 0.7883.22 ± 6.88
p-value****NS**
LSD0.051.600.117.841.7812.37
Abbreviations; A: net photosynthetic rate; E: transpiration rate; gsw: stomatal conductance; WUE: water use efficiency. All the data values represent means ± SD (n = 9). Fisher’s least-significance test (LSD; p = 0.05) was undertaken to analyze the differences between the means representing levels of significance as: p > 0.05: NS (not significant), p < 0.05 (*), and p < 0.01 (**).
Table 3. Effect of the biostimulant RAZORMIN® application on hormone profile (ng g−1 DW) in pepper plants.
HormonesControlRAZORMIN®p-Value
IAA0.96 ± 0.091.11 ± 0.08*
tZ357.2 ± 8.95399.2 ± 8.44***
iP0.42 ± 0.060.47 ± 0.09NS
GA10.15 ± 0.010.36 ± 0.01***
GA30.06 ± 0.010.14 ± 0.01***
GA40.17 ± 0.01 0.25 ± 0.02 ***
ABA73.95 ± 4.7177.50 ± 2.25NS
ACC19.76 ± 0.7120.11 ± 0.96NS
JA542.9 ± 8.58539.6 ± 8.53NS
SA4033 ± 63.764373 ± 64.39***
Abbreviations; IAA: indoleacetic acid; tZ: trans-zeatin; iP: isopentenial adenine; GA: gibberellins; ABA: abscisic acid; ACC: 1-aminocyclopropane 1-carboxylic acid; JA: jasmonic acid; SA: salicylic acid. All the data values represent means ± SD (n = 9). Fisher’s least-significance test (LSD; p = 0.05) was undertaken to analyze the differences between the means representing levels of significance as: p > 0.05: NS (not significant), p < 0.05 (*) and p < 0.001 (***).
Table 4. Effect of RAZORMIN® application on foliar concentration of amino acids and soluble proteins, total nitrogen (N), and N utilization efficiency (NUtE).
TreatmentsSoluble Amino Acids
(mg g⁻1 FW)
Soluble Proteins
(mg g⁻1 FW)
N
(mg g−1 DW)
NUtE
(g2 DW mg−1 N)
Control2.04 ± 0.100.68 ± 0.0261.36 ± 4.720.16 ± 0.01
RAZORMIN®3.25 ± 0.140.69 ± 0.0267.00 ± 4.800.21 ± 0.02
p-Value**NS*****
LSD0.050.170.034.750.01
All the data values represent means ± SD (n = 9). Fisher’s least-significance test (LSD; p = 0.05) was undertaken to analyze the differences between the means representing levels of significance as: p > 0.05: NS (not significant), p < 0.01 (**), and p < 0.001 (***).
Table 5. Effect of the biostimulant RAZORMIN® application on the foliar content of macronutrients.
TreatmentsP
(mg g−1 DW)
K
(mg g−1 DW)
Ca
(mg g−1 DW)
Mg
(mg g−1 DW)
S
(mg g−1 DW)
Control5.59 ± 0.7931.88 ± 2.0519.62 ± 1.476.82 ± 0.364.52 ± 0.19
RAZORMIN®6.58 ± 0.1835.28 ± 0.5321.95 ± 0.397.87 ± 0.435.20 ± 0.21
p-value******
LSD0.051.303.392.430.900.45
All the data values represent means ± SD (n = 9). Fisher’s least-significance test (LSD; p = 0.05) was undertaken to analyze the differences between the means representing levels of significance as: p > 0.05: NS (not significant), p < 0.05 (*), and p < 0.01 (**).
Table 6. Effect of the biostimulant RAZORMIN® application on foliar content of micronutrients.
TreatmentsFe
(µg g−1 DW)
Cu
(µg g−1 DW)
Mn
(µg g−1 DW)
Zn
(µg g−1 DW)
Mo
(µg g−1 DW)
B
(µg g−1 DW)
Control180.35 ± 18.51 16.66 ± 0.8946.39 ± 3.4549.75 ± 4.121.88 ± 0.1929.99 ± 2.90
RAZORMIN®234.62 ± 24.38 17.00 ± 1.4842.49 ± 2.2757.35 ± 3.442.39 ± 0.0942.06 ± 1.68
p-value**NSNS*******
LSD0.0549.072.766.628.600.325.37
All the data values represent means ± SD (n = 9). Fisher’s least-significance test (LSD; p = 0.05) was undertaken to analyze the differences between the means representing levels of significance as: p > 0.05: NS (not significant), p < 0.01 (**), and p < 0.001 (***).
Table 7. Effect of the application of biostimulant RAZORMIN® on some parameters of chlorophyll a fluorescence in pepper plants subjected to the fungicide Azoxystrobin.
TreatmentsFv/FmRC/ABSPIABS1 − Vj
Control0.815 ± 0.001 a 0.81 ± 0.09 a7.48 ± 1.84 a0.67 ± 0.03 a
Azoxystrobin0.814 ± 0.004 a0.83 ± 0.07 a7.44 ± 1.35 a0.67 ± 0.02 a
Azoxystrobin + RAZORMIN®0.814 ± 0.008 a0.80 ± 0.05 a7.52 ± 1.06 a0.68 ± 0.02 a
p-valueNSNSNSNS
LSD0.050.0060.081.780.02
Abbreviations; Fv/Fm: maximum quantum product of primary photochemistry; RC/ABS: ratio of active reaction centers; PIABS: performance index; 1 − Vj: electron output primarily from photosystem II. All the data values represent means ± SD, (n = 9). Fisher’s least-significance test (LSD; p = 0.05) was undertaken to analyze the differences between the means representing levels of significance as: p > 0.05: NS (not significant). Different letters indicate significantly different values.
Table 8. Effect of the application of biostimulant RAZORMIN® on the leaf concentration of photosynthetic pigments in pepper plants subjected to the fungicide Azoxystrobin.
TreatmentsChl a
(mg g−1 FW)
Chl b
(mg g−1 FW)
Carotenoids
(mg g−1 FW)
Control0.56 ± 0.01 a 0.31 ± 0.01 a0.37 ± 0.01 a
Azoxystrobin0.50 ± 0.02 b0.29 ± 0.01 a0.35 ± 0.02 a
Azoxystrobin + RAZORMIN® 0.56 ± 0.01 a0.30 ± 0.01 a0.37± 0.01 a
p-Value*NSNS
LSD0.050.050.030.04
All the data values represent means ± SD, (n = 9). Fisher’s least-significance test (LSD; p = 0.05) was undertaken to analyze the differences between the means representing levels of significance as: p > 0.05; NS (not significant) and p < 0.05 (*). Different letters indicate significantly different values.
Table 9. Effect of the application of biostimulant RAZORMIN® on photosynthetic efficiency in pepper plants subjected to the fungicide azoxystrobin.
TreatmentsA
(µmol m⁻2 s⁻1)
E
(mmol m⁻2 s⁻1)
gsw
(mmol m⁻2 s⁻1)
WUE
Control8.61 ± 1.45 a1.09 ± 0.20 a 81.43 ± 11.57 a 7.94 ± 1.11 b
Azoxystrobin7.81 ± 0.88 a0.61 ± 0.14 b42.01 ± 9.89 b13.04 ± 1.42 a
Azoxystrobin + RAZORMIN®7.13 ± 0.95 a0.48 ± 0.09 b34.15 ± 6.61 b14.91 ± 0.99 a
p-ValueNS*******
LSD0.052.230.3019.142.37
Abbreviations; A: net photosynthetic rate; E: transpiration rate; gsw: stomatal conductance; WUE: water use efficiency. All the data values represent means ± SD, (n = 9). Fisher’s least-significance test (LSD; p = 0.05) was undertaken to analyze the differences between the means representing levels of significance as: p > 0.05: NS (not significant), p < 0.01 (**), and p < 0.001 (***). Different letters indicate significantly different values.
Table 10. Effect of the application of biostimulant RAZORMIN® on some oxidative stress indicators in pepper plants subjected to the fungicide Azoxystrobin.
TreatmentsMDA
(µM g−1 FW)
H2O2
(µg g−1 FW)
O2
(µg g−1 FW)
Control1.27 ± 0.21 b 54.44 ± 2.17 b 4.50 ± 0.06 b
Azoxystrobin2.87 ± 0.28 a88.06 ± 1.38 a6.10 ± 0.04 a
Azoxystrobin + RAZORMIN®1.35 ± 0.14 b60.36 ± 2.56 b5.09 ± 0.13 b
p-value********
LSD0.050.424.180.49
All the data values represent means ± SD, (n = 9). Fisher’s least-significance test (LSD; p = 0.05) was undertaken to analyze the differences between the means representing levels of significance as: p < 0.01 (**) and p < 0.001 (***). Different letters indicate significantly different values.
Table 11. Effect of the application of the biostimulant RAZORMIN® on some antioxidant compounds in pepper plants subjected to the fungicide Azoxystrobin.
TreatmentsTotal Phenols
(mg g−1 FW)
Flavonoids
(mg g−1 FW)
Anthocyanins
(mg g−1 FW)
Control23.60 ± 0.92 c 19.67 ± 0.29 b2.98 ± 0.22 b
Azoxystrobin26.99 ± 0.99 b21.01 ± 0.86 b1.47 ± 0.16 c
Azoxystrobin + RAZORMIN® 33.00 ± 0.56 a25.73 ± 0.89 a6.95 ± 0.52 a
p-Value*********
LSD0.051.681.380.68
All the data values represent means ± SD, (n = 9). Fisher’s least-significance test (LSD; p = 0.05) was undertaken to analyze the differences between the means representing levels of significance as: p < 0.001 (***). Different letters indicate significantly different values.
Publisher’s Note: MDPI stays neutral with regard to jurisdictional claims in published maps and institutional affiliations.

