Article

Effects of Green Manure Combined with Phosphate Fertilizer on Movement of Soil Organic Carbon Fractions in Tropical Sown Pasture

1
Tropical Crops Genetic Resources Institute, Chinese Academy of Tropical Agricultural Sciences/Key Laboratory of Crop Gene Resources and Germplasm Enhancement in Southern China, Ministry of Agriculture & Rural Affairs, Haikou 571101, China
2
College of Tropical Crops, Hainan University, Haikou 570228, China
*
Authors to whom correspondence should be addressed.
These authors contributed equally to this work.
Agronomy 2022, 12(5), 1101; https://doi.org/10.3390/agronomy12051101
Submission received: 2 April 2022 / Revised: 26 April 2022 / Accepted: 29 April 2022 / Published: 30 April 2022

Abstract

:
The application of green manure is a common way to increase the soil’s level of total organic carbon (TOC) and its fractions. However, the amount of green manure to apply and how the combined application of phosphate fertilizer affects the movement of TOC, and of its fractions, is still unclear. We conducted a column experiment with two treatments of phosphate fertilizer (with and without) and green manure (0, low amount level, high amount level). The longitudinal movement distance and accumulation amount of each organic carbon fraction were investigated after 14 days and 28 days. The results indicated that green manure, phosphate fertilizer, and incubation time affected the movement of the soil organic carbon fractions by affecting the initial quality of the green manure (TOC, cellulose, and lignin content), as well as the changes in quality. Green manure significantly increased the accumulation amount of the organic carbon fractions in the soil, and the high-level input of green manure increased the movement distance and accumulation amount of the organic carbon fractions; phosphorus fertilizer did not have a significant effect on the movement distance of the organic carbon fractions, but it did significantly affect accumulation amount. The 28-day incubation period increased the movement distance and the accumulation amount of the organic carbon fractions, with the exception of the particulate organic carbon (POC), compared to the 14-day incubation period. Taken together, these findings suggest that the high-level of input of green manure combined with the application of P fertilizer is beneficial for increasing the movement of the organic carbon fractions to the depth of the soil, and promotes their accumulation, which is an important agronomic management strategy for improving soil acidity in tropical regions.

1. Introduction

The soil organic carbon (SOC) pool is the largest carbon pool in the terrestrial ecosystem, and its carbon storage is five times that of the plant carbon pool and four times that of the atmospheric carbon pool [1]. To improve soil health and to help mitigate climate change, the amount of soil organic matter should be maintained or increased in the long term [2,3]. The SOC pool can be divided into the active soil organic carbon (ASOC) pool and the inert soil organic carbon (ISOC) pool, according to the differences in the carbon pool functions, such as the turnover rate, biochemical properties, and size of the reserves [4]. It is easy for ASOC to mineralize, decompose, and transform, and it has a short cycle in soil, making it able to reflect the dynamic changes in soil organic carbon more sensitively and to reflect the current soil fertility status directly [5,6,7]. Although ASOC usually only accounts for a small part of SOC, it can reflect small changes in soil more sensitively than other types. Active soil organic carbon can participate in the biochemical processes of soil directly and is also an important substrate for soil microorganisms, and a driving force for soil nutrients [8]. It is crucial for maintaining the carbon pool balance and soil biochemical fertility. ASOC fractions mainly include light fraction organic carbon (LFOC), particulate organic carbon (POC), microbial biomass carbon (MBC), and dissolved organic carbon (DOC), etc [9]. ISOC is relatively stable in soil, guaranteeing soil carbon storage. It is a relatively difficult and stable part of the soil organic carbon pool and mainly includes lignin, humus, polyphenols, and protected polysaccharides; the higher its content, the more conducive it is to SOC accumulation. ISOC fractions mainly include heavy fraction organic carbon (HFOC) and mineral-bound organic carbon (MOC), among others.
Green manure is a nutrient-complete source of biological fertilizer. Many studies have shown that planting green manure can improve the physical, chemical, and biological properties of soil; change the diversity and community composition of soil microorganisms; alleviate the shortage of fertilizer resources; and save on the costs of fertilizer input [10,11,12,13,14]. Additionally, it can also effectively increase the organic carbon pool in the soil [15,16]. It is also an important alternative source of fertilizer for the current ‘Chemical Fertilizer Zero Increase’ plan and for the soil organic matter improvement plan, both of which are of great significance to the sustainable development of agriculture. Bharali et al. found that green manure significantly increased both high active organic carbon and high inert organic carbon [17].
Agricultural land occupies about 35% to 37% of the earth’s land [18,19]. It is susceptible to changes in soil organic carbon caused by natural or anthropogenic factors. Therefore, the movement and transformation of sown pasture SOC has always attracted attention. However, how does returning green manure to the field affect the process of the movement of SOC? What factors affect the movement distance and accumulation amount of ASOC and ISOC? In this study, a soil column cultivation experiment was carried out to clarify the movement distance and accumulation amount of the SOC fractions and to provide a theoretical basis and reference for the return of green manure to the field to increase SOC.

2. Materials and Methods

2.1. Soil and Amendments

Soil was collected at a depth of 0–15 cm (cultivated soil) from the Forage Trial Station of Tropical Crop Genetic Resources, Chinese Academy of Tropical Agricultural Sciences, Danzhou City, Hainan Province, China (19°30′ N, 109°30′ E; Alt. 149 m). The soil was laterite. The soil was thoroughly mixed and air-dried, and it was then sieved (<2 mm). The basic properties of the soil are shown in Table 1.
Green manure (Stylosanthes guianensis) was collected directly from the fields at the same station. The green manure was dried at 70 °C and finely ground (<2 mm). This material was chosen because it is a commonly used soil-improving green manure in the tropics China. The chemical properties of the green manure are outlined in Table 1.

2.2. Column Incubation Experiment

The incubation experiment consisted of three green manure addition treatments: control: 0, low amount level: 58.8 g (10 t ha−1), and high amount level: 235.2 g (40 t ha−1), and two phosphate fertilizer levels (1.048 g (100 kg ha−1) and 0 g (without)) with three replicates, creating a total of six treatments (Table 2). Calcium superphosphate (with 16–18% phosphorus) was used as a phosphate fertilizer in this experiment.
Soil columns [20] were reconstructed using topsoil collected at depths of 0–15 cm (Figure 1). Wax columns (10 cm in diameter and 25 cm high) were used as the test rig. The fertilizer was placed into nylon net bags and then placed on the top of soil (Figure 1). The wax column was filled with 1554 g soil 5 times; then, the wax column was put into the tray, deionized water was added to the tray, and a capillary action was used to make the soil column absorb the water evenly until the soil’s water content reached 36.8% (according to the pre-experiment, this takes about 48 h). Then, the filter paper under the wax column was removed, and both ends were sealed with plastic wrap and rubber bands to prevent water loss. The wax column was placed vertically in a constant temperature incubator at 30 °C (simulating a similar temperature to that in the field), and it was equilibrated in the dark for 48 h. Then, it was taken out of the incubator, and fertilizer packaged in nylon bags was spread evenly on the filter paper above the soil column. The column was then sealed again with plastic wrap, and it was cultivated in a constant temperature incubator at 30 °C in the dark.

2.3. Soil and Green Manure Sampling

The soil columns were destructively harvested after 14 d and 28 d of incubation. Each column was sectioned into 75 2 mm layers, creating a total of 36 columns with 2700 soil samples. Samples were oven-dried at 40 °C and were well mixed to ensure homogeneity before chemical analysis.
The green manure bags were removed at 14 and 28 days after placement. After removal from the wax columns, green manure bags were dried at 65 °C to constant weight, and weights were recorded. After drying, biomass from the green manure bags was crushed and sieved.

2.4. Chemical Analyses

The soil TOC was measured using the acid dichromate wet oxidation method [21]. Total nitrogen (TN) was measured using the Kjeldahl method [22]. The soil LFOC and HFOC were measured using the improved method of Han et al. [23]. The soil POC and MOC were measured using the improved method of Cambardella and Elliott and Shen [24,25].
An external heating-potassium dichromate oxidation method [21] and acid-detergent fiber methods [26] were used to assess TOC, cellulose, and lignin, respectively, for each green manure sample. Here, we used the initial TOC, cellulose, and lignin of green manure to represent the quality of green manure, and the difference of sampling in different periods was used as their decomposition amount, indicating the change of green manure (Figure 2).

2.5. Statistical Analysis

As the data were not normally distributed (the Kolmogorov–Smirnov test), a generalized linear model (GLIMMIX procedure) was applied to quantify the effects of the incubation time (D), green manure (GM), and P fertilizer (P) on the movement distance and accumulation amount of the organic carbon fractions (Table 3). The model is y = D + GM + P + D × GM + D × P + GM × P + D × GM × P + Γ + ε, where Γ is the random effect of the replicate and ε is the model error. All the data were analyzed using SAS software (SAS 9.4, SAS Institute Inc., Cary, NC, USA). The H0 rejection level was set to p < 0.05.
Structural equation modelling (SEM) was utilized to estimate the movement distance and accumulation amount of the organic carbon fractions in response to the incubation time, green manure, and P fertilizer, based on the hypothesis that incubation time, green manure, and P fertilizer have the potential to directly alter the movement distance and accumulation amount of the organic carbon fractions, as well as indirectly by changing the initial quality and by changing the green manure content [27]. We used the Chi-square (χ2) test to judge the fit of the model, with good fit being achieved when 0 ≤ χ2/df ≤ 2 and 0.05 < p ≤ 1 [28]. The SEM results were calculated using AMOS 21 [29].

3. Results

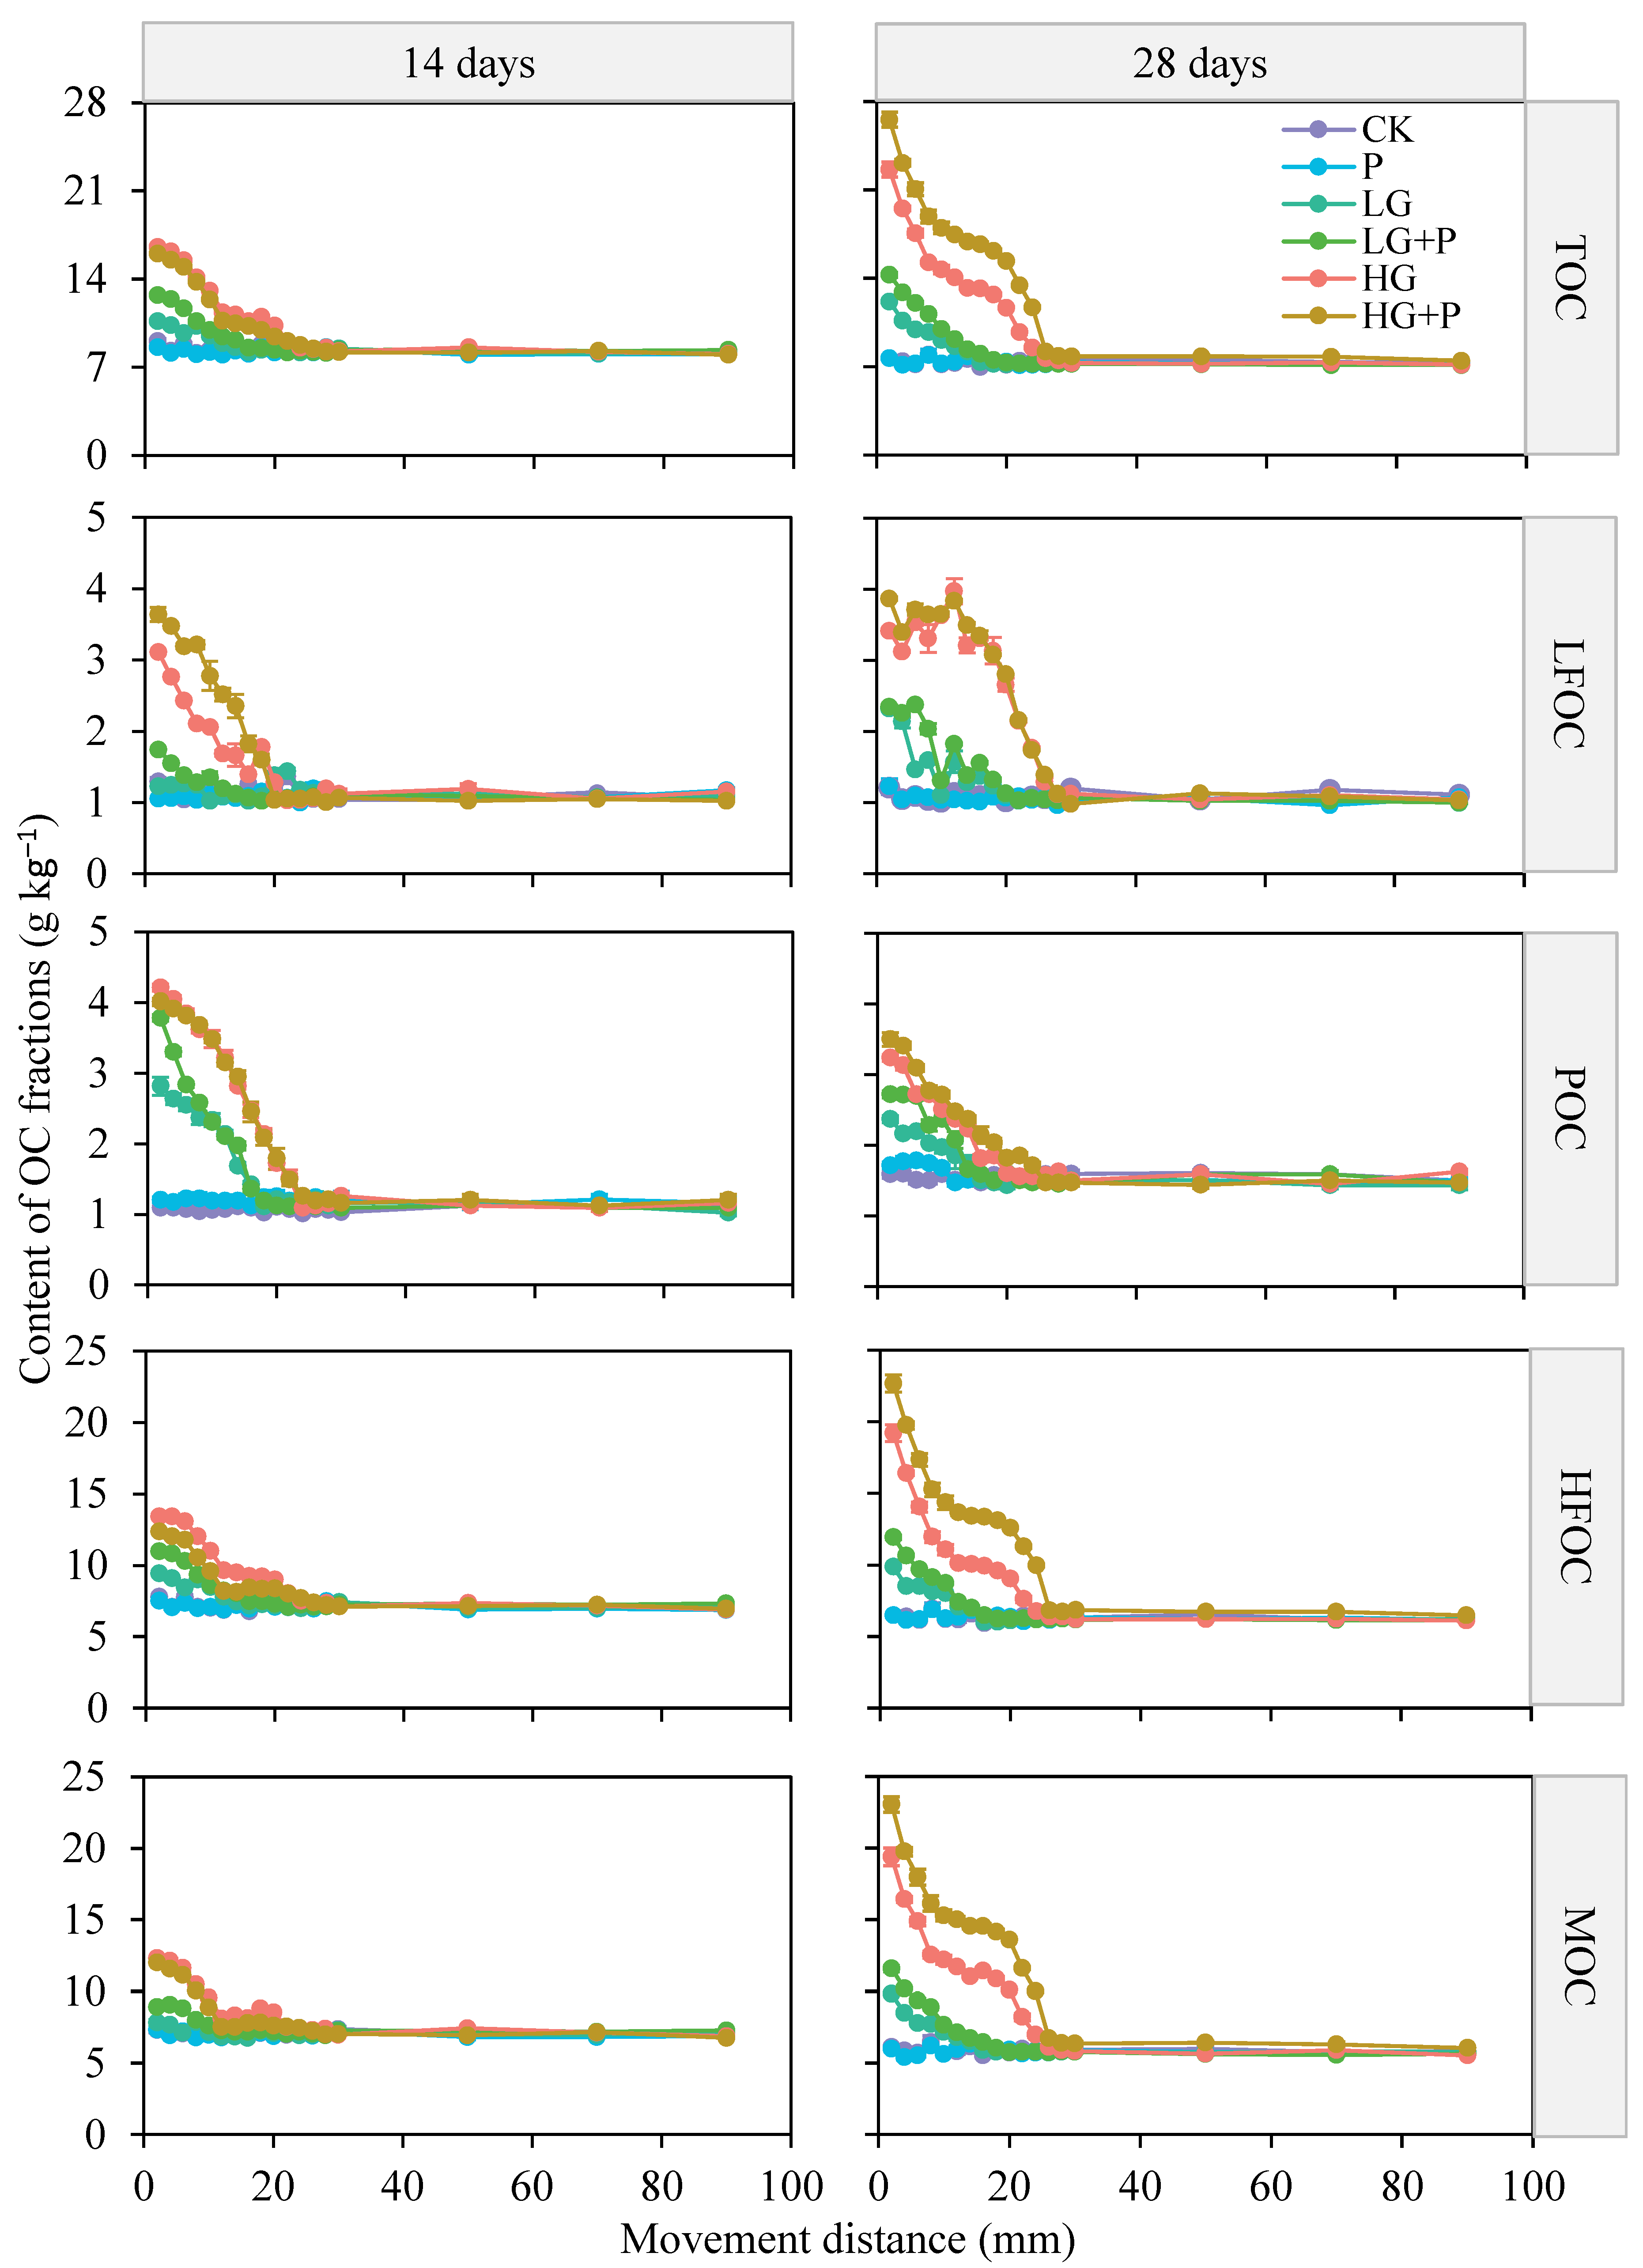
3.1. Dynamic Characteristics of Soil OC Fraction Movement

The movement dynamics of soil organic carbon fractions showed that as the incubation time increased, the content of soil organic carbon fractions (with the exception of POC) increased cumulatively, and the accumulation amount of each OC fraction after 28 days was higher than that after 14 days. The results indicated that the incubation time had a great influence on the movement of the soil OC fractions. Additionally, the accumulation amount OC fractions decreased as the movement distance became longer; the final movement distance was limited, and there were differences in the movement distance between the different treatments (Table 3 and Figure 3).

3.2. Movement Distance of OC Fractions

The movement distances of the soil TOC, LFOC, and MOC were significantly affected by the incubation time, green manure, and their interaction, while the POC was affected by GM and the interaction of GM and the incubation time; the HFOC was only affected by green manure. However, the P fertilizer did not have a significant effect on the movement distance of the OC fractions (Table 3).
The incubation time only had a significant effect on the movement distance of TOC in the LG + P treatment (p < 0.05), and no significant differences were observed in the other treatments (p > 0.05; Figure 4a). The P fertilizer did not have a significant effect on the movement distance of the soil OC fractions at either 14 or 28 days (Figure 4). However, we found that the high green manure treatment significantly promoted the downward movement of the TOC, LFOC, and HFOC at 14 days and 28 days (all p < 0.05; Figure 4a,b,d). The high green manure treatment had no effect on the movement distance of the POC at 14 days (p > 0.05), while it significantly increased the movement distance at 28 days (p < 0.05; Figure 4c). The movement distance of the MOC in the LG + P treatment was not significantly different from that of the HG and HG + P treatments (p > 0.05). However, in the treatments in which only green manure was applied, the HG treatment effectively increased the movement distance of the MOC (p < 0.05; Figure 4e).

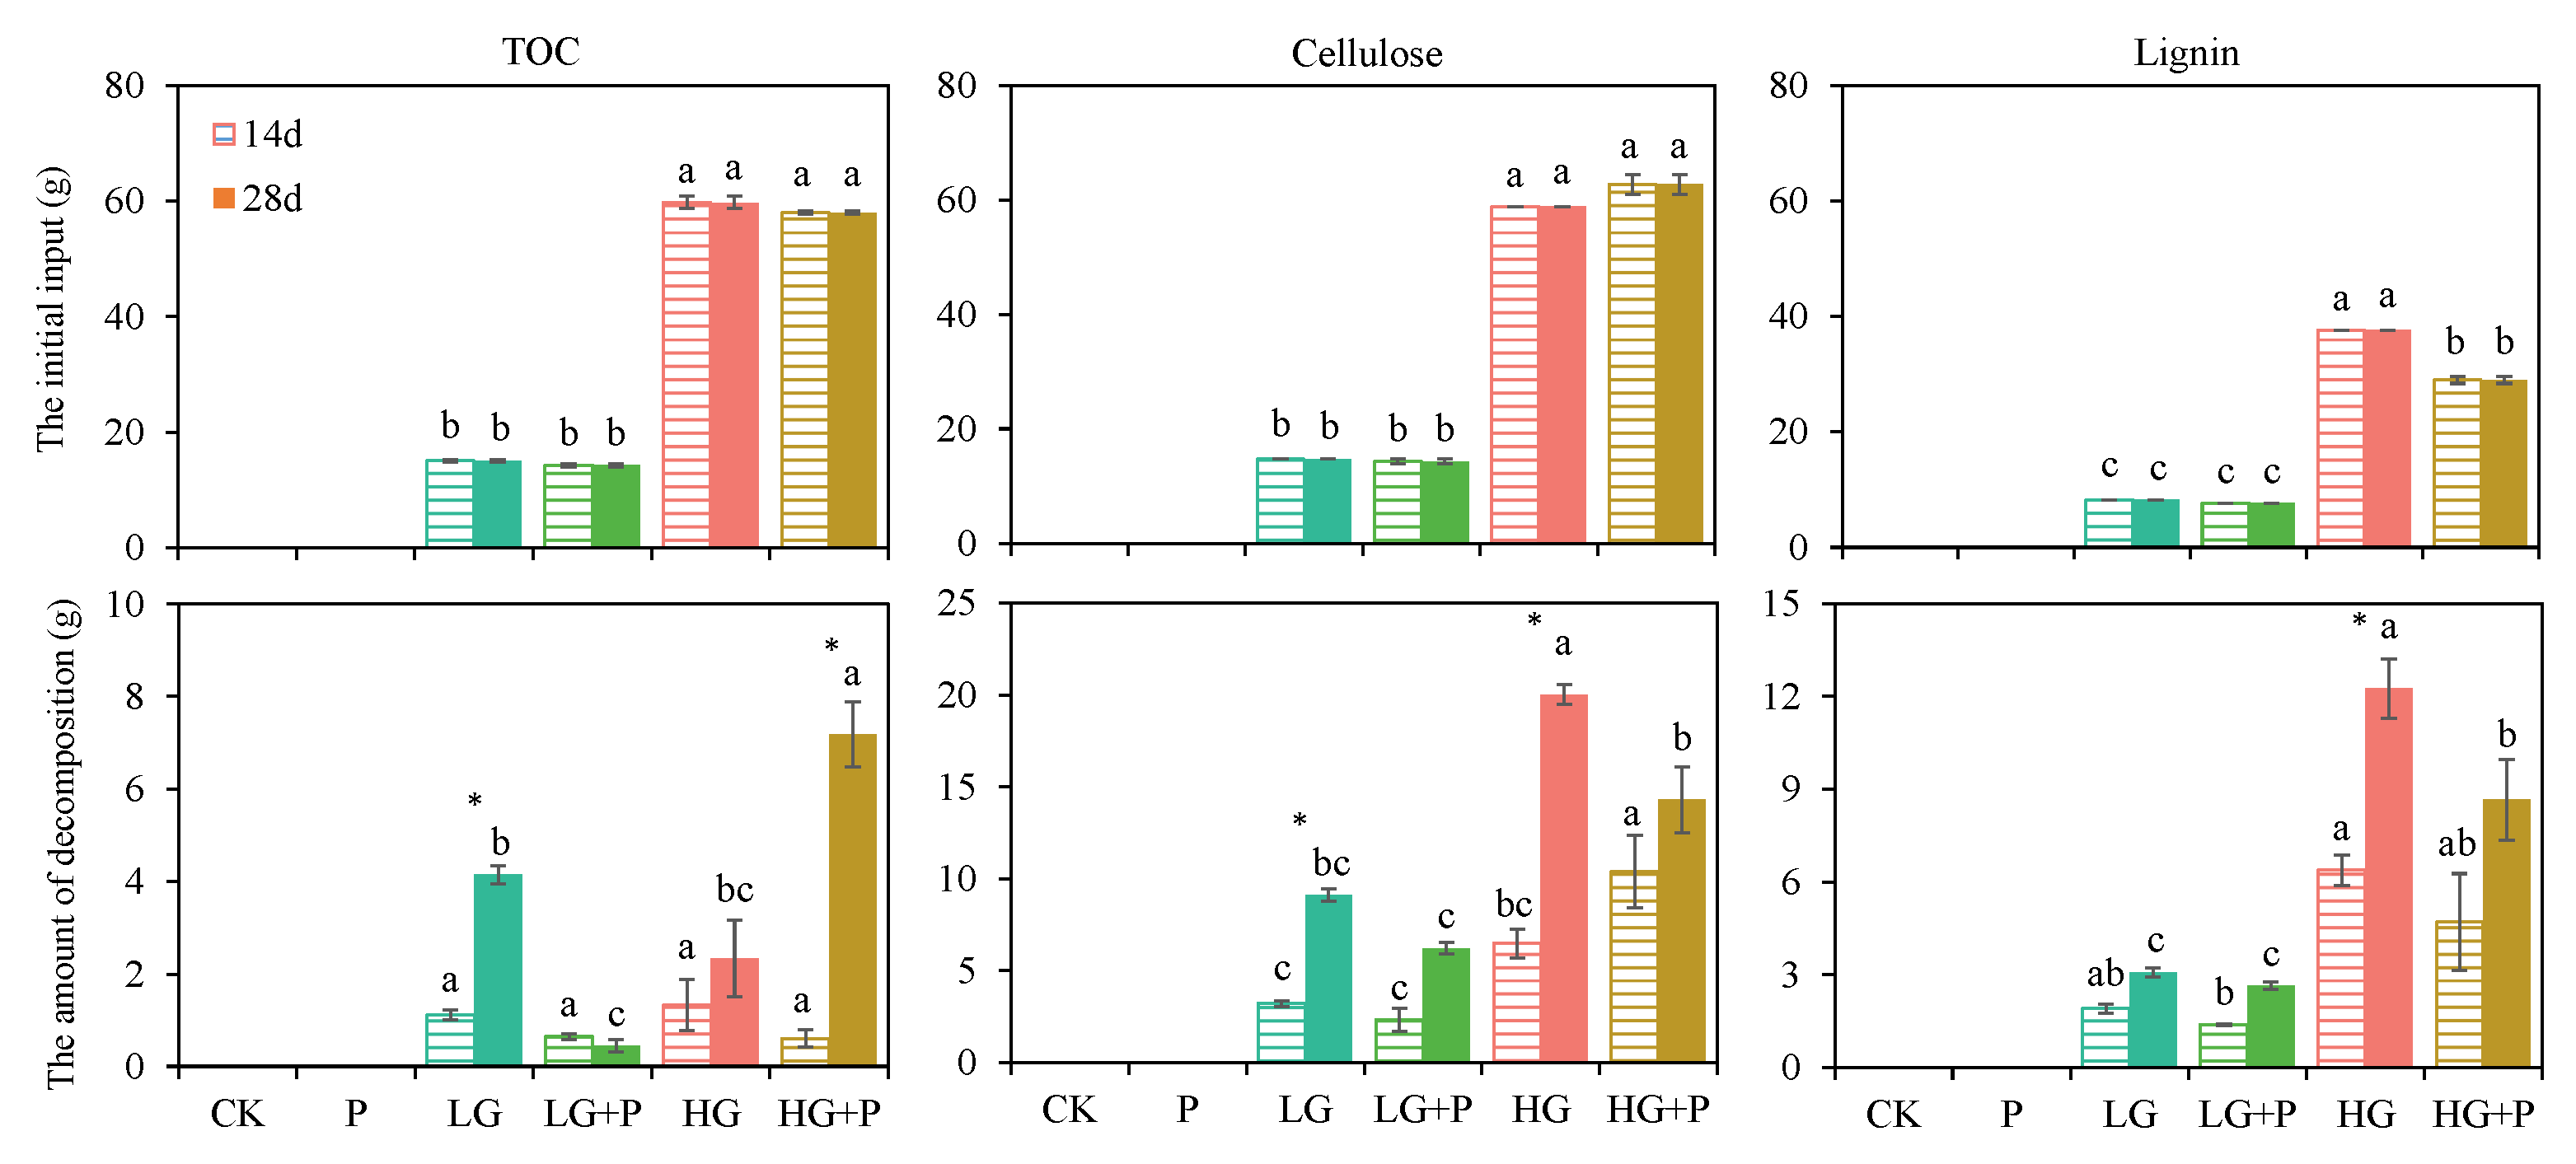
3.3. Accumulation Amount of OC Fractions

The accumulation amount of the soil TOC, LFOC, HFOC, and MOC was significantly affected by the incubation time, P fertilizer, green manure, and their interaction, while the POC was not affected by the interactions of incubation time and P fertilizer, nor the interactions between three of them (Table 3).
Increasing the incubation time significantly increased the accumulation amount of the TOC and HFOC in the LG + P, HG, and HG + P treatments, but this did not have a significant effect on the LG treatment. However, in each treatment, the incubation time had a negative effect on the accumulation amount of the POC (Figure 4h).
The accumulation amount of each organic carbon fraction increased significantly under both the HG and HG + P treatments (Figure 4f–j). However, the effect of the P fertilizer on the accumulation amount of the organic carbon fractions was regulated by the organic carbon fractions and the incubation time. After 14 days, the application of P fertilizer had no significant effect on the accumulation amount of the TOC and HFOC. However, after 28 days, the effect of the P fertilizer was significant, and the accumulation amount of the TOC and HFOC resulting from the LG + P and HG + P treatments was higher than those in the LG and HG treatments. After 14 days, under the HG treatment, the application of P fertilizer significantly increased the accumulation amount of the LFOC, while under the LG treatment, the P fertilizer had no significant (Figure 4g). On the contrary, after 28 days, the LG + P treatment significantly increased the accumulation amount of the LFOC, while in the high green manure treatment, the P fertilizer had no significant effect (Figure 4g). At 14 and 28 days, the combinations of green manure with or without P fertilizer did not have a significant effect on the accumulation amount of the POC.
At 14 days, the combined application of P fertilizer had no significant effect on the accumulation amount of the MOC under both the low and high green manure treatments. However, at 28 days, the P fertilizer significantly promoted the amount of MOC accumulation.

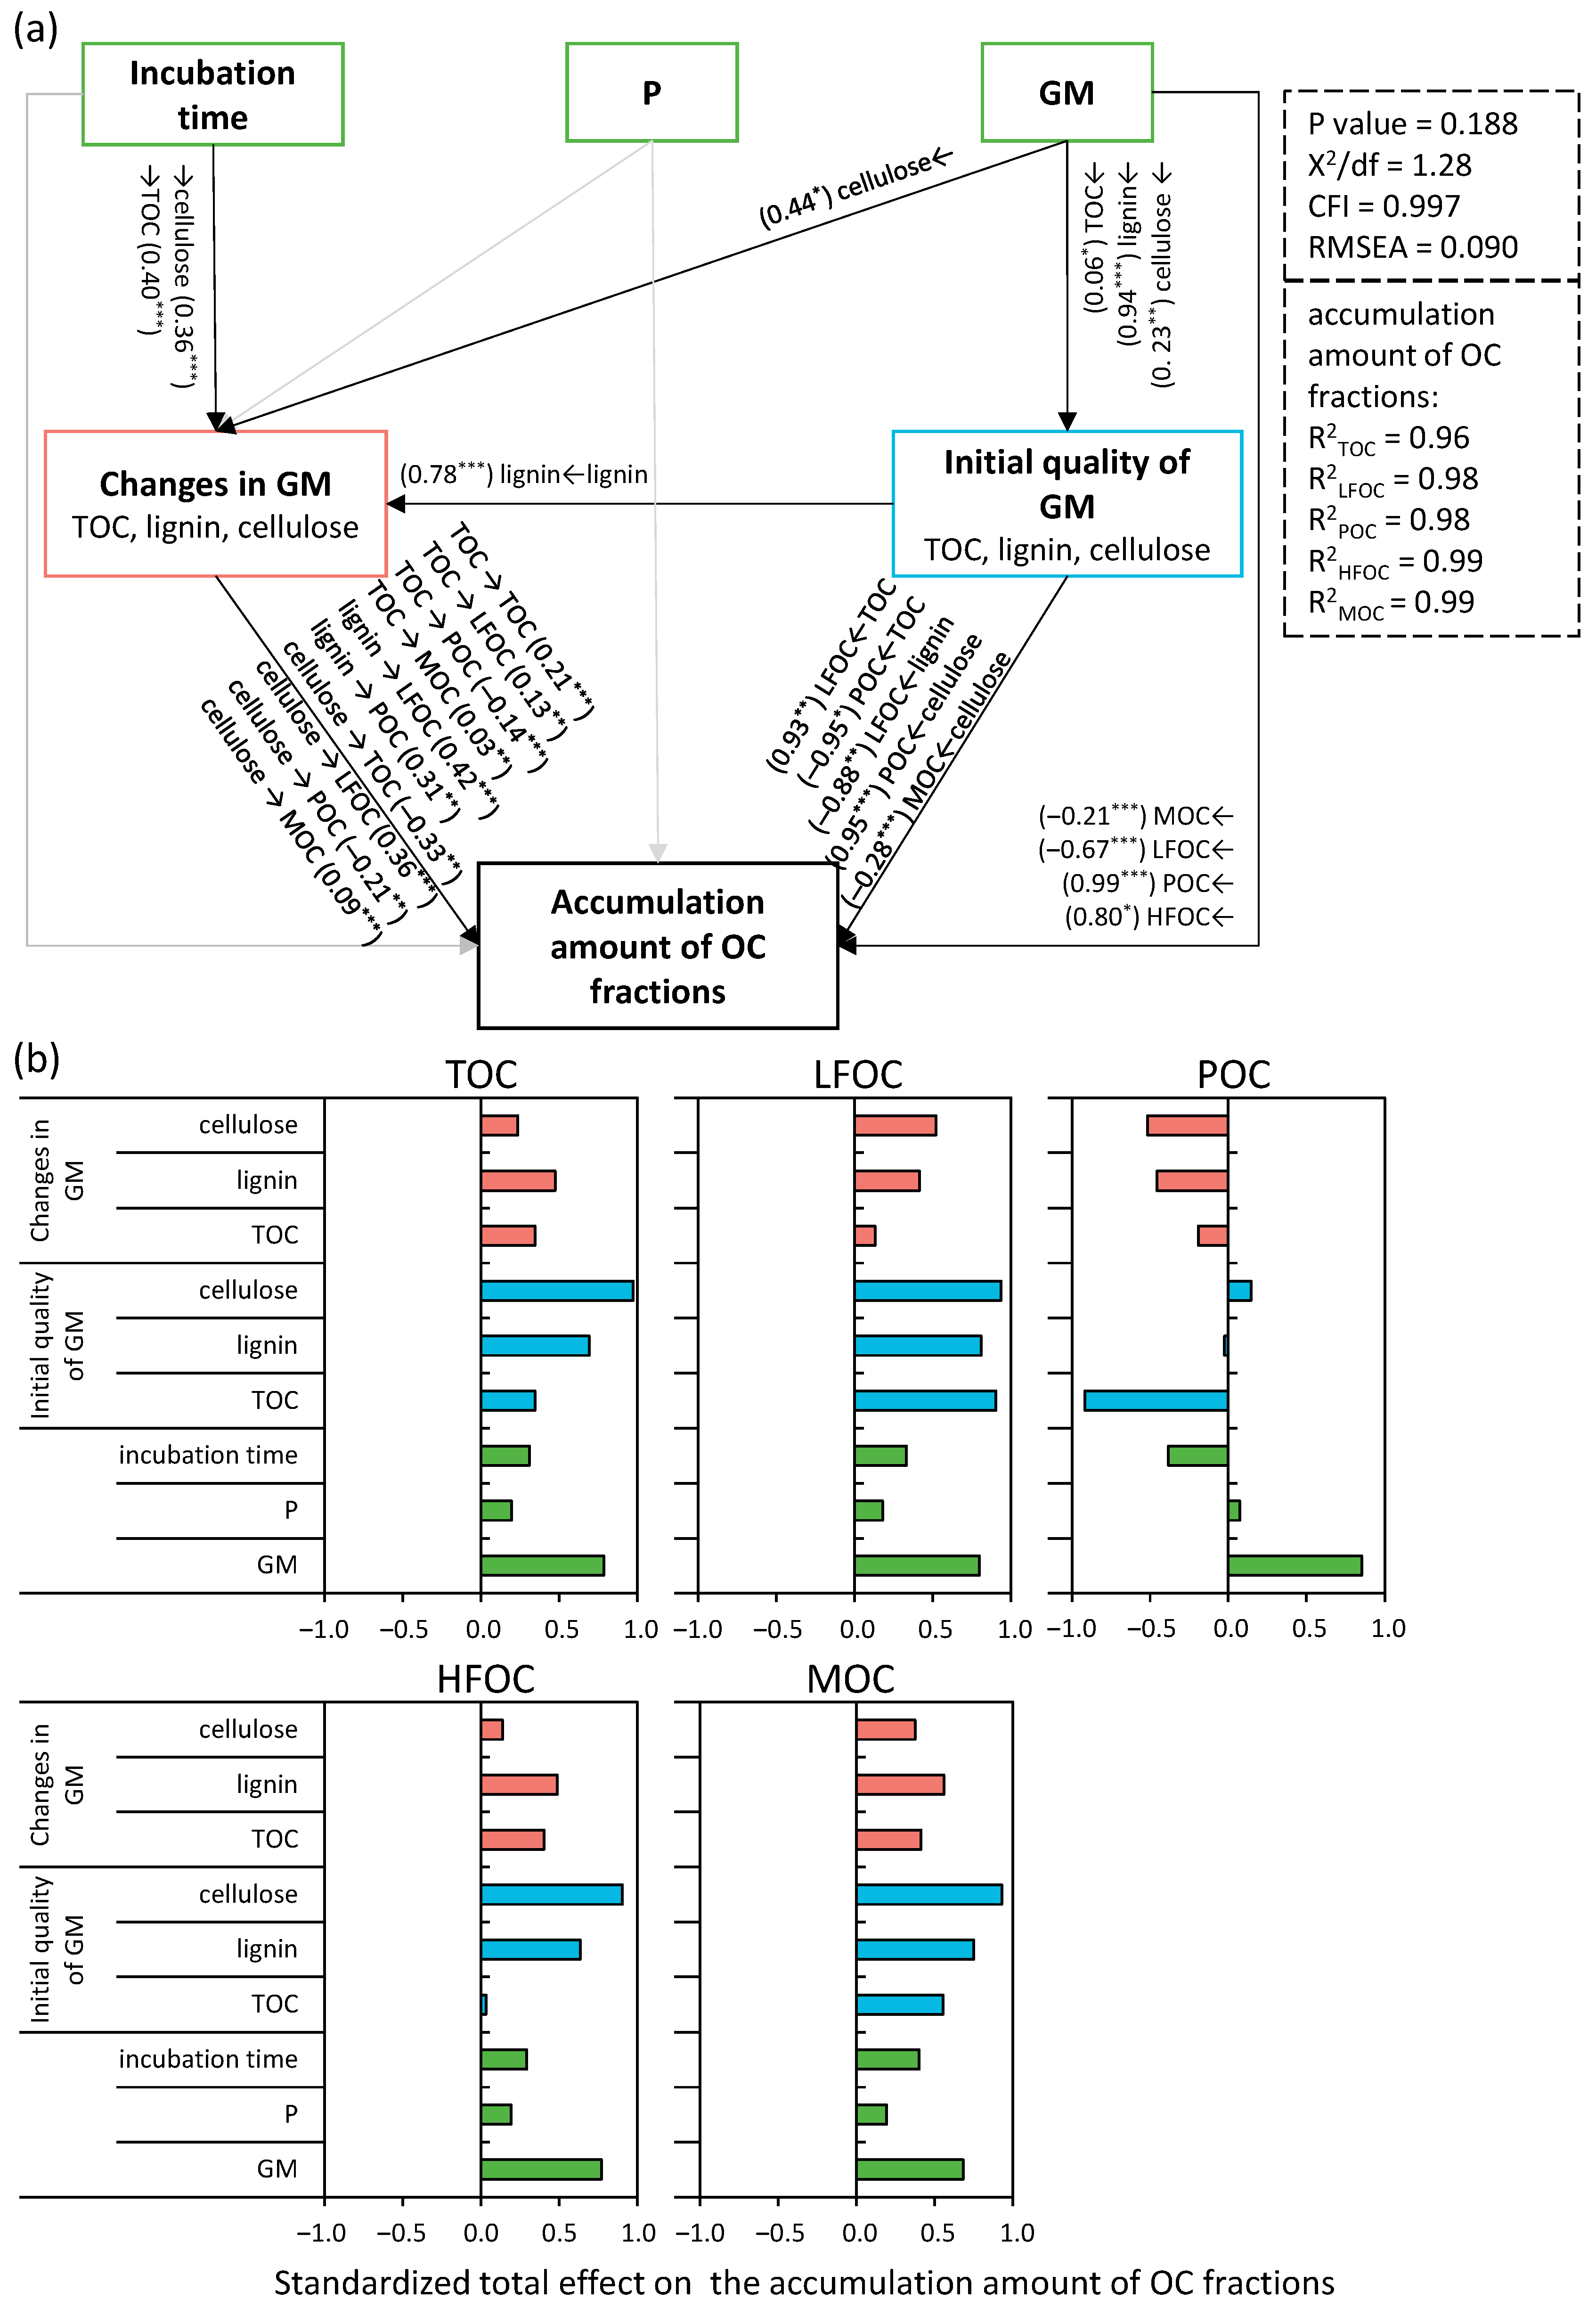
3.4. Structural Equation Modelling for Movement Distance and Accumulation Amount of OC Fractions

We found that incubation time affects the movement distance of the OC fractions by affecting the changes in the green manure quality. The direct effect and total effect value of P fertilizer on the movement distance of the OC fractions were small. Green manure treatment affected the movement distance and accumulation amount of the OC fractions by affecting the initial quality and the quality changes of green manure (Figure 5 and Figure 6).
Green manure and incubation time have positive direct effects on the movement distance of the soil TOC, with standardized path coefficients (SPCs) of 0.92 (p < 0.001) and 0.40 (p < 0.01). Green manure affected the movement distance of the soil TOC by affecting the initial amount of lignin (0.94, p < 0.001); the incubation time affected the movement distance of the soil TOC by affecting the decomposition of the TOC in the green manure (0.40, p < 0.01). The total effect of green manure on the movement distance of the TOC was 0.98, while the initial lignin and cellulose content of the green manure had negative effects on the movement distance of the soil TOC, with a total effect of −0.44 and −0.23, respectively.
Green manure and the incubation time have significant positive direct effects on the movement distance of the LFOC, with SPCs of 0.95 (p < 0.001) and 0.13 (p < 0.01), respectively. The incubation time affects the movement distance of the LFOC by affecting the changes of TOC (0.40, p < 0.01) and cellulose (0.36, p < 0.001) of the green manure. The total effect of green manure on the movement distance of the TOC was 0.90, and the initial TOC, lignin, and cellulose contents in the green manure all had negative effects on the movement distance of the LFOC, with total effects of −0.18, −0.50, and −0.80, respectively. The total effect of the incubation time on the LFOC’s movement distance was 0.29, while the total effect of the cellulose changes in the green manure on the movement distance of the LFOC was 0.30.
The green manure had significant positive direct effects on the movement distance of the POC, with an SPC of 0.99 (p < 0.001), and by affecting the initial amount of organic carbon (0.06, p < 0.05) and lignin (0.94, p < 0.001) in green manure, it indirectly affected the movement distance of the POC, with SPCs of −0.93 (p < 0.001) and 0.66 (p < 0.05), respectively. The incubation time indirectly affected the movement distance of the POC by affecting the TOC changes in the green manure (0.40, p < 0.01). The total effect of the green manure on the movement distance of the POC was 0.95, while the initial TOC content, lignin content, and cellulose content in the green manure had negative effects on the movement distance of the POC, with total effects of −0.94, −0.66, and −0.71, respectively.
The direct and indirect effects of the incubation time and the P fertilizer treatments on the movement distance of the HFOC were small. The direct effect of the green manure treatments on the movement distance of the HFOC was 0.98 (p < 0.001), and they affected the movement distance of the HFOC by affecting the initial amount (0.94, p < 0.001) and the changes (0.78, p < 0.001), respectively. The total effect of the green manure on the movement distance of the HFOC was 0.97, and the total effect of the initial TOC content and lignin content in green manure on the movement distance of the HFOC were 0.66 and −0.49, respectively.
The total effect of the green manure on the movement distance of the MOC was 0.91, and both the initial amount of cellulose and the TOC of the green manure had a negative effect on the movement distance of the MOC, with total effects of −0.70 and −0.57, respectively (Figure 5b).
We found that the incubation time affected the accumulation amount of soil OC fractions by affecting quality changes in the green manure. The direct effect and total effect of P fertilizer on the accumulation amount of soil OC fractions were small, while the green manure treatments affected the accumulation amount of soil OC fractions by affecting the initial quality and the quality changes in the green manure.
The green manure and incubation time affected the accumulation amount of TOC in the soil by affecting the changes in the cellulose in the green manure (0.44, p < 0.05; 0.36, p < 0.001). In addition, the incubation time affected the accumulation amount of TOC in the soil by affecting the changes in the TOC of the green manure (0.40, p < 0.001) (Figure 6a). The incubation time, green manure, and P fertilizer, as well as the initial quality and the quality changes in the green manure, all promoted the accumulation amount of TOC in the soil (Figure 6b).
The direct effect of green manure on the accumulation amount of LFOC was −0.67 (p < 0.001). The incubation time affected the accumulation amount of LFOC by affecting the changes in the TOC (0.40, p < 0.001) and cellulose (0.36, p < 0.001) of the green manure. The green manure affected the changes lignin (0.78, p < 0.001) by affecting the initial lignin quality (0.94, p < 0.001), and it then affected the accumulation amount of LFOC (0.42, p < 0.001). On the other hand, green manure affected the accumulation amount of LFOC by affecting the initial quality of lignin (0.94, p < 0.001) and TOC (0.06, p < 0.05) in the green manure. The incubation time, green manure, and P fertilizer, as well as the initial quality and the changes in the green manure, all promoted the accumulation amount of LFOC (Figure 6b).
The direct effect of green manure on the accumulation amount of POC was 0.99 (p < 0.001), and it indirectly affected the accumulation amount of POC by affecting the initial TOC (0.06, p < 0.05) and cellulose (0.23, p < 0.01) in green manure. On the other hand, the green manure affected the changes in the lignin (0.78, p < 0.001) by affecting the initial lignin (0.94, p < 0.001), and it then affected the accumulation amount of POC (0.31, p < 0.01). The incubation time indirectly affected the accumulation amount of POC (−0.14, p < 0.001) by affecting the changes of TOC in the green manure (0.40, p < 0.001). The total effect of the incubation time and the green manure on the accumulation amount of POC was −0.38 and 0.85, respectively, while the total effect of the initial TOC content in the green manure on the accumulation amount of POC was −0.92; moreover, the initial lignin and cellulose contents had little effect on the accumulation amount of POC. The changes of quality in the green manure had a negative total effect on the accumulation amount of POC (Figure 6b).
The direct and indirect effects of the incubation time and P treatments on the accumulation amount of HFOC were small, and the direct effect of the green manure on the accumulation amount of HFOC was 0.80 (p < 0.05). The incubation time, green manure, P fertilizer, and initial quality and changes in the green manure all promoted the accumulation amount of HFOC (Figure 6b).
The direct effect of the green manure on the accumulation amount of MOC was −0.21 (p < 0.001), and it indirectly affected the accumulation amount of MOC (−0.28, p < 0.001) by affecting the initial cellulose content (0.23, p < 0.01). The incubation time indirectly affected the accumulation amount of MOC (0.03, p < 0.01) by affecting the changes in the TOC of the green manure (0.40, p < 0.001). The incubation time and green manure jointly affected the accumulation amount of MOC by affecting the changes of cellulose in the green manure (0.36, p < 0.001; 0.44, p < 0.05). The incubation time, green manure, P fertilizer, and initial quality, and the changes in the green manure, all promoted accumulation amount of MOC (Figure 6b).

3.5. The Movement Distance and Accumulation Amount of Total Nitrogen

The movement migration dynamics of the soil TN showed that as the incubation time increased, the content of the TN increased cumulatively, and the accumulation amount of TN after 28 days was higher than that after 14 days. The results indicated that the incubation time had a great influence on the movement of the soil TN. Additionally, the accumulation amount of TN decreased as the movement distance became longer; the final movement distance was limited, and there were differences in the movement migration distance between the different treatments (Table 3 and Figure 7).
The incubation time, the interaction between P fertilizer and green manure, and the interaction of the three factors all had significant effects on the movement distance and accumulation amount of soil TN (Table 3). During the first 14-day incubation period, the effects of green manure and P fertilizer had no effect on the movement distance and accumulation amount of soil TN (Figure 7). During the 28-day incubation period, the movement distance and accumulation amount were higher in LG and HG + P treatment than that in the LG + P and HG treatment.

4. Discussion

Globally, the application of organic fertilizers has increased organic carbon stocks. However, this increased effect is related to many factors, including environmental factors such as the soil temperature, humidity, and pH, as well as biological factors such as the quality and quantity of exogenous organic matter input, enzyme activity, and microbial diversity. Additionally, these factors lead to large differences in the increased soil organic carbon storage [30,31,32]. In order to explore the effect of returning green manure to the field on the movement of soil organic carbon fractions, this study conducted a soil column cultivation experiment, controlled the environmental conditions to ensure that they were consistent, and ensured that only the input amount of green manure and the application of inorganic P fertilizer were different.

4.1. Effects of Green Manure on the Movement Distance of Soil Organic Carbon Fractions

In the study, the maximum movement distance of the organic carbon fractions reached 30 mm, and we found that the movement distance of the organic carbon fractions was affected by the initial quality and the changes in the green manure, such as those in the TOC, lignin, and cellulose content (Figure 5). However, we found that the movement distance of the POC and HFOC in the study was not affected by the incubation time, and there was no significant difference in the movement distance between 14 and 28 days (Figure 3 and Table 3). This shows that POC and HFOC complete rapid movement in the first 14 days and that green manure combined with P fertilizer has no significant effect on the movement distance of the OC fractions. Additionally, green manure, regardless of whether it was combined with P fertilizer or not, had no significant effect on the movement distance of the OC fractions. Additionally, we found that after 14 days of incubation, the movement distance of each OC fraction in the low green manure treatment group was significantly different (Figure S1), while in the high green manure treatment group, no significant differences in the movement distance of each OC fraction were observed. After 28 days of incubation, no significant differences in the movement distances of each OC fraction were observed, regardless of whether the high or low green manure had been applied. This indicated that each OC fraction, including the active and inert OC fraction, has a difference movement distance after 14 days but that it can move the same distance within 28 days.
In addition, the movement distance of the POC was smaller after the 28-day incubation time, and the difference was significant under the HG + P treatment (Figure S1). This indicates that HG + P treatment had a greater impact on the movement distance of the POC.
The movement distance of TN was linearly positively correlated with the movement distance of TOC and MOC at a high amount green manure treatment, but it was linearly positively correlated with LHOC at both a low and high amount green manure treatment (Figure S3). It shows that the movement distance of soil TN is not consistent with the movement distance of soil OC fractions. This may be caused by the different activities of C- and N-related enzymes [33].

4.2. Effects of Green Manure on the Accumulation Amount of the Soil Organic Carbon Fractions

Increasing the amount of biomass in soil through green manures (preferably legumes) or crop residues is known to increase the accumulation of organic carbon in soil, and it is an important practice for carbon sequestration in soils in tropical and subtropical regions [34]. As one of the most common organic fertilizers, green manure can not only improve the physical and chemical properties of soil, but it can also increase the organic carbon content in soil, especially active organic carbon [35]. In this study, it was found that with the application of low and high levels of green manure, the active organic carbon content and inert organic carbon content in the soil were significantly increased with or without the application of P fertilizer. Additionally, this is consistent with the study of Bharali et al., in which green manure significantly increased both the highly active organic carbon and highly inert organic carbon [17]. Leguminous green manure mainly builds an active carbon pool in shallow soil, while grass-based green manure mainly builds an active carbon pool in deep soil [36]. In this study, it was found that the content of the organic carbon fractions was affected by the amount of green manure the was applied, the application of P fertilizer, and the incubation time. The accumulation amount of OC fractions increased as the incubation time increased [37]. In this study, the accumulation amount of TOC, LFOC, HFOC, and MOC increased as the incubation time increased, but the accumulation amount of POC decreased as the incubation time increased. This shows that the POC is more active under green manure treatment and that it may be quickly transformed or utilized by microorganisms. The LFOC increased significantly, and the amount increased as the incubation days increased. This is consistent with the findings of Ma and Huang, in which green manure from Chinese vetch can increase the active organic carbon content in soil by an average of 15% [38]. Similarly, green manure also significantly increases the activated carbon pool of the corn–pea planting system [8]. Cover tillage management significantly increases the organic matter content in topsoil [39]. However, these results may be different under different climatic conditions or in different soil types. Other studies have shown no changes in organic carbon sequestration under cover crop systems [40].
Phosphorus fertilizer, which promotes the accumulation of total organic carbon and inert organic carbon (HFOC and MOC) in soil in the low and high levels of green manures, was applied, but the most significant effect was found at the 28th day of incubation, indicating that the movement effect caused by green manure combined with inorganic fertilizers on the TOC and inert organic carbon in soil is affected by the incubation time; however, the effect on active organic carbon has no regularity, indicating that active organic carbon is more sensitive to the changes in the environment and is volatile. The active carbon pools are characterized by fast turnover (low mean residual time) and are known to be highly sensitive to agricultural management. They make up the food web of soil; therefore, their content largely affects the nutrient cycling that maintains soil quality and agricultural productivity [41]. Green manure combined with inorganic fertilizer can significantly increase the total organic carbon content in soil, and the proportion of inorganic fertilizer applied has no significant effect on the total organic carbon content in soil, but the combined application of 60% inorganic fertilizer can significantly increase the active carbon content in soil [42]. Ma and Huang also found that the TOC in soil increased by 8% on average, and the active organic carbon content increased by 15% on average under each treatment of green manure composed of Chinese vetch and nitrogen fertilizer [38].
In contrast, the inert or passive carbon pool is part of the TOC that is slowly altered by microbial activity [43]; therefore, it plays an important role in the accumulation of organic carbon stocks [44]. Song et al. found that green manure composed of Chinese vetch + straw significantly increased and promoted the accumulation of inert forms of carbon such as aromatic carbon in two paddy soil aggregates [45]. It is more conducive to improving the stability of organic matter, and it has great application potential in actual agricultural production. We found that the accumulation amount of POC and HFOC was significantly higher than that of LFOC and MOC after 14 days of incubation at both high and low levels of green manure treatments, while the inert organic carbon accumulation amount (HFOC and MOC) was significantly higher than the active organic carbon (LFOC and POC) after 28 days of incubation. When low levels of green manure were applied, no significant differences were observed in the accumulation amount between the active organic carbon in the LFOC and POC, and no significant differences were observed in the accumulation amount between the inert organic carbon in the HFOC and MOC. However, when high levels of green manure were applied, the accumulation amount of LFOC was significantly higher than that of POC, and the accumulation amount of MOC was significantly higher than that of HFOC (Figure S2), indicating that a higher amount of green manure would affect the accumulation amount of soil-active and inert organic carbon fractions.
In addition, the movement of elements in the soil is also affected by the activity of enzymes [33]. Wang et al. found that the treatments of green manure and phosphate fertilizer can significantly increase the accumulation amount of inorganic phosphorus fractions in the soil [46]. We found that the accumulation amount of TN was linearly positively correlated with the accumulation amount of TOC and HFOC at high amount green manure treatment, but it was linearly positively correlated with the accumulation amount of LHOC and MOC and linearly negatively correlated with the accumulation amount of POC at both low and high amount green manure treatments (Figure S3). This shows that the accumulation amount of soil TN is not consistent with the accumulation amount of soil OC fractions, which is affected by the amount of green manure and the types of OC fractions.

5. Conclusions

Our laboratory incubation study indicated that the addition of green manure to soil can significantly increase the movement distance and accumulation amount of the TOC and organic carbon fractions in soil, including the LFOC, POC, HFOC, and MOC, by affecting the initial quality and the quality changes in green manure. However, P fertilizer had no effect on the movement distance of the TOC and organic carbon fractions in soil but affected their accumulation amount. The incubation time increases the movement distance and accumulation amount of soil organic carbon fractions. However, the POC results were opposite to those of the other organic carbon fractions, and despite the higher activity of POC, the differences in its movement distance were not observed, and the accumulation amount decreased after 28 days. These findings suggest that green manure can effectively increase the contents of organic carbon fractions in soil. Appropriately increasing the amount of green manure and increasing the incubation time can increase the accumulated amount of organic carbon fractions in the deep soil. However, we still need to verify this in the field.

Supplementary Materials

The following supporting information can be downloaded at: https://www.mdpi.com/article/10.3390/agronomy12051101/s1, Figure S1: the final movement distance of soil organic carbon fractions at 14 and 28 days. The vertical bands represent standard error (n = 3), the lowercase letter indicates that the soil organic carbon fractions are significantly different at the 0.05 level at 14 days, and the capital letter indicates that the soil organic carbon fractions are significantly different at the 0.05 level at 28 days; Figure S2: the final movement accumulation amount of the soil organic carbon fractions at 14 and 28 days. Vertical bands represent the standard error (n = 3), the lowercase letter indicates that soil organic carbon fractions are significantly different at the 0.05 level at 14 days, and the capital letter indicates that the soil organic carbon fractions are significantly different at the 0.05 level at 28 days. Figure S3: the relationship between the movement distance and the accumulation amount of soil total nitrogen and soil organic carbon fractions. The solid line and dotted line indicate that there is a significant correlation and there is no correlation between the two variables, respectively. R2 is the fitness of the equation, and the p value indicates the correlation between the two variables.

Author Contributions

D.H. and H.H. designed the research and revised the manuscript. A.H., R.H. and G.L. performed the experiments and analyzed the data. A.H. and R.H. wrote the manuscript. All authors have read and agreed to the published version of the manuscript.

Funding

This work was supported by Hainan Province Natural Science Foundation of China (2019CXTD415, 322QN394), the China Agriculture Research System of MOF and MARA (CARS-22), and the Central Public-interest Scientific Institution Basal Research Fund for Chinese Academy of Tropical Agricultural Science (No. 1630032022025).

Data Availability Statement

Not applicable.

Acknowledgments

The authors are grateful to Lihua Zou for her help in laboratory sample analysis.

Conflicts of Interest

The authors declare no conflict of interest.

References

  1. German, D.P.; Chacon, S.S.; Allison, S.D. Substrate concentration and enzyme allocation can affect rates of microbial decomposition. Ecology 2011, 92, 1471–1480. [Google Scholar] [CrossRef] [PubMed]
  2. Yang, X.; Meng, J.; Lan, Y.; Chen, W.F.; Yang, T.X.; Yuan, J.; Liu, S.; Han, J. Effects of maize stover and its biochar on soil CO2 emissions and labile organic carbon fractions in Northeast China. Agric. Ecosyst. Environ. 2017, 240, 24–31. [Google Scholar] [CrossRef]
  3. Audette, Y.; Congreves, K.A.; Schneider, K.; Zaro, G.C.; Nunes, A.L.P.; Zhang, H.J.; Voroney, R.P. The effect of agroecosystem management on the distribution of C functional groups in soil organic matter: A review. Biol. Fertil. Soils 2021, 57, 881–894. [Google Scholar] [CrossRef]
  4. Smith, P.; Smith, J.U.; Powlson, D.S.; McGill, W.B.; Arah, J.R.M.; Chertov, O.G.; Coleman, K.; Franko, U.; Frolking, S.; Jenkinson, D.S.; et al. A comparison of the performance of nine soil organic matter models using datasets from seven long-term experiments. Geoderma 1997, 81, 153–225. [Google Scholar] [CrossRef]
  5. Needelman, B.A.; Wander, M.M.; Bollero, G.A.; Boast, C.W.; Sims, G.K.; Bullock, D.G. Interaction of Tillage and Soil Texture Biologically Active Soil Organic Matter in Illinois. Soil Sci. Soc. Am. J. 1999, 63, 1326–1334. [Google Scholar] [CrossRef]
  6. Ramírez, P.B.; Fuentes-Alburquenque, S.; Díez, B.; Vargas, I.; Bonilla, G.A. Soil microbial community responses to labile organic carbon fractions in relation to soil type and land use along a climate gradient. Soil Biol. Biochem. 2020, 141, 107692. [Google Scholar] [CrossRef]
  7. Hu, K.; Zhang, H.X.; Guo, L.M.; Wu, F.Y.; Zhou, B.Q.; Xing, S.H.; Mao, Y.L. Effects of tobacco stalk biochar-based fertilizer on the organic carbon fractions and microbial community structure of adlay soil. Chin. J. Eco-Agric. 2021, 29, 1592–1603. [Google Scholar]
  8. Ansari, M.A.; Choudhury, B.U.; Layek, J.; Das, A.; Lal, R.; Mishra, V.K. Green manuring and crop residue management: Effect on soil organic carbon stock, aggregation, and system productivity in the foothills of Eastern Himalaya (India). Soil Tillage Res. 2022, 218, 105318. [Google Scholar] [CrossRef]
  9. Li, J.; Wen, Y.C.; Li, X.H.; Li, Y.T.; Yang, X.D.; Lin, Z.; Song, Z.Z.; Cooper, J.M.; Zhao, B.Q. Soil labile organic carbon fractions and soil organic carbon stocks as affected by long-term organic and mineral fertilization regimes in the North China Plain. Soil Tillage Res. 2018, 175, 281–290. [Google Scholar] [CrossRef] [Green Version]
  10. Li, Z.Q.; Wang, J.H.; Zhang, X. A review on the research of decom position and nutrients release of green manure. Soils Fertil. Sci. China 2017, 240, 8–16. [Google Scholar]
  11. Abdelsalam, N.R.; Kandil, E.E.; Al-Msari, M.A.F.; Al-Jaddadi, M.A.M.; Ali, H.M.; Salem, M.Z.M.; Elshikh, M.S. Effect of foliar application of NPK nanoparticle fertilization on yield and genotoxicity in wheat (Triticum aestivum L.). Sci. Total Environ. 2019, 653, 1128–1139. [Google Scholar] [CrossRef] [PubMed]
  12. He, H.B.; Li, W.X.; Zhang, Y.W.; Cheng, J.K.; Jia, X.Y.; Li, S.; Yang, H.R.; Chen, B.M.; Xin, G.R. Effects of Italian ryegrass residues as green manure on soil properties and bacterial communities under an Italian ryegrass (Lolium multiflorum L.)-rice (Oryza sativa L.) rotation. Soil Tillage Res. 2020, 196, 104487. [Google Scholar] [CrossRef]
  13. Kandil, E.E.; Abdelsalam, N.R.; EL Aziz, A.A.A.; Ali, H.M.; Siddiqui, M.H. Efficacy of Nanofertilizer, Fulvic Acid and Boron Fertilizer on Sugar Beet (Beta vulgaris L.) Yield and Quality. Sugar Tech 2020, 22, 782–791. [Google Scholar] [CrossRef]
  14. Kandil, E.E.; Abdelsalam, N.R.; Mansour, M.A.; Ali, H.M.; Siddiqui, M.H. Potentials of organic manure and potassium forms on maize (Zea mays L.) growth and production. Sci. Rep. 2020, 10, 8752. [Google Scholar] [CrossRef]
  15. Marshall, C.B.; Lynch, D.H. No-Till Green Manure Termination Influences Soil Organic Carbon Distribution and Dynamics. Agron. J. 2018, 110, 2098–2106. [Google Scholar] [CrossRef] [Green Version]
  16. Liu, W.; Geng, M.J.; Qin, Z.G.; Zhang, Z.; Lu, J.M.; Lu, J.W.; Cao, W.D. Effects of co-incorporation of green manure planting and rice straw on soil organic carbon pool and soil enzyme activity in a mono-rice cropping system. Trans. Chin. Soc. Agric. Eng. 2020, 36, 125–133. [Google Scholar]
  17. Bharali, A.; Baruah, K.K.; Bhattacharyya, P.; Gorh, D. Integrated nutrient management in wheat grown in a northeast India soil: Impacts on soil organic carbon fractions in relation to grain yield. Soil Tillage Res. 2017, 168, 81–91. [Google Scholar] [CrossRef]
  18. Smith, P.; Martino, D.; Cai, Z.; Gwary, D.; Smith, J. Greenhouse gas mitigation in agriculture. Philos. Trans. R. Soc. Lond. Ser. B Biol. Sci. 2008, 363, 789–813. [Google Scholar] [CrossRef] [Green Version]
  19. Lal, R.; Delgado, J.A.; Groffman, P.M.; Millar, N.; Dell, C.; Rotz, A. Management to mitigate and adapt to climate change. J. Soil Water Conserv. 2011, 66, 276–285. [Google Scholar] [CrossRef] [Green Version]
  20. Schiedung, M.; Bellè, S.-L.; Sigmund, G.; Kalbitz, K.; Abiven, S. Vertical mobility of pyrogenic organic matter in soils: A column experiment. Biogeosciences 2020, 17, 6457–6474. [Google Scholar] [CrossRef]
  21. Nelson, D.W. Total Carbon, Organic Carbon, and Organic Matter; Soil Science Society of America, Inc., American Society of Agronomy, Inc.: Madison, WI, USA, 1996. [Google Scholar]
  22. Pruden, G.; Powlson, D.S.; Jenkinson, D.S. The measurement of15N in soil and plant material. Nutr. Cycl. Agroecosyst. 1985, 6, 205–218. [Google Scholar] [CrossRef]
  23. Han, X.; Wang, S.; Veneman, P.L.M.; Xing, B. Change of Organic Carbon Content and Its Fractions in Black Soil under Long-Term Application of Chemical Fertilizers and Recycled Organic Manure. Commun. Soil Sci. Plant Anal. 2006, 37, 1127–1137. [Google Scholar] [CrossRef]
  24. Cambardella, C.A.; Elliott, E.T. Carbon and Nitrogen Distribution in Aggregates from Cultivated and Native Grassland Soils. Soil Sci. Soc. Am. J. 1993, 57, 1071–1076. [Google Scholar] [CrossRef] [Green Version]
  25. Shen, Y.; Fu, W.L.; Lan, J.C.; Cheng, H.; Zhang, S.Q.; Wu, L.Z. Distribution characteristics of soil particulate organic carbon and mineral-associated organic carbon of different land use in karst mountain. Res. Soil Water Conserv. 2012, 6, 1–6. [Google Scholar]
  26. Rowland, A.P.; Roberts, J.D. Lignin and cellulose fractionation in decomposition studies using acid-detergent fibre methods. Commun. Soil Sci. Plant Anal. 1994, 25, 269–277. [Google Scholar] [CrossRef]
  27. Hu, A.; Chang, S.H.; Chen, X.J.; Hou, F.J.; Nan, Z.B. Temporal heterogeneity has no effect on the direction of succession in abandoned croplands in a semiarid area of northwest China. Land Degrad. Dev. 2021, 32, 91–100. [Google Scholar] [CrossRef]
  28. Grace, J.B. Structural Equation Modeling and Natural Systems; Cambridge University Press: Cambridge, UK, 2006. [Google Scholar] [CrossRef]
  29. Arbuckle, J. IBM SPSS Amos 19 User’s Guide; Amos Development Corporation: Crawfordville, FL, USA, 2010. [Google Scholar]
  30. Kamran, M.; Huang, L.; Nie, J.; Geng, M.J.; Lu, Y.H.; Liao, Y.L.; Zhou, F.L.; Xu, Y.H. Effect of reduced mineral fertilization (NPK) combined with green manure on aggregate stability and soil organic carbon fractions in a fluvo-aquic paddy soil. Soil Tillage Res. 2021, 211, 105005. [Google Scholar] [CrossRef]
  31. Gross, A.; Glaser, B. Meta-analysis on how manure application changes soil organic carbon storage. Sci. Rep. 2021, 11, 5516. [Google Scholar] [CrossRef]
  32. Guan, S.; Liu, S.-J.; Liu, R.-Y.; Zhang, J.-J.; Ren, J.; Cai, H.-G.; Lin, X.-X. Soil organic carbon associated with aggregate-size and density fractions in a Mollisol amended with charred and uncharred maize straw. J. Integr. Agric. 2019, 18, 1496–1507. [Google Scholar] [CrossRef]
  33. Zou, W.; Chen, S.; Huan, H.; Huang, D.; Liu, G.; Chen, G.; Lesueurd, D. Effects of mixed application of green manure with phosphate fertilizer on soil enzyme activity at a manure microsite. Agrochimica 2020, 64, 81–94. [Google Scholar] [CrossRef]
  34. Nandan, R.; Singh, V.; Singh, S.S.; Kumar, V.; Hazra, K.K.; Nath, C.P.; Poonia, S.; Malik, R.K.; Bhattacharyya, R.; McDonald, A. Impact of conservation tillage in rice–based cropping systems on soil aggregation, carbon pools and nutrients. Geoderma 2019, 340, 104–114. [Google Scholar] [CrossRef] [PubMed]
  35. Timofeeva, Y.; Purtova, L.; Emelyanov, A.; Burdukovskii, M.; Kiseleva, I.; Sidorenko, M. Contents, distribution, and fractionation of soil organic carbon and trace elements in soils under a green manure application. Soil Water Res. 2020, 16, 50–58. [Google Scholar] [CrossRef]
  36. Hassan, A.; Ijaz, S.S.; Lal, R.; Ali, S.; Hussain, Q.; Ansar, M.; Khattak, R.H.; Baloch, M.S. Depth Distribution of Soil Organic Carbon Fractions in Relation to Tillage and Cropping Sequences in Some Dry Lands of Punjab, Pakistan. Land Degrad. Dev. 2016, 27, 1175–1185. [Google Scholar] [CrossRef]
  37. Ma, L.; Yang, L.-Z.; Xia, L.-Z.; Shen, M.-X.; Yin, S.-X.; Li, Y.-D. Long-Term Effects of Inorganic and Organic Amendments on Organic Carbon in a Paddy Soil of the Taihu Lake Region, China. Pedosphere 2011, 21, 186–196. [Google Scholar] [CrossRef]
  38. Ma, Y.Q.; Huang, G.Q. Effects of combined application of Chinese milk vetch (Astragalus sinicus L.) and nitrogen fertilizer on paddy soil carbon pool. Chin. J. Ecol. 2019, 38, 129–135. [Google Scholar]
  39. Toosi, E.R.; Kravchenko, A.N.; Mao, J.; Quigley, M.Y.; Rivers, M.L. Effects of management and pore characteristics on organic matter composition of macroaggregates: Evidence from characterization of organic matter and imaging. Eur. J. Soil Sci. 2017, 68, 200–211. [Google Scholar] [CrossRef]
  40. Rorick, J.D.; Kladivko, E.J. Cereal rye cover crop effects on soil carbon and physical properties in southeastern Indiana. J. Soil Water Conserv. 2017, 72, 260–265. [Google Scholar] [CrossRef] [Green Version]
  41. Almagro, M.; Ruiz-Navarro, A.; Díaz-Pereira, E.; Albaladejo, J.; Martínez-Mena, M. Plant residue chemical quality modulates the soil microbial response related to decomposition and soil organic carbon and nitrogen stabilization in a rainfed Mediterranean agroecosystem. Soil Biol. Biochem. 2021, 156, 108198. [Google Scholar] [CrossRef]
  42. Li, Z.Q.; Zhang, X.; Wang, J.H.; Cao, K.; Xu, C.X.; Cao, W.D. Effect of chemical fertilizer reduction with return of Chinese milk vetch (Astragalus sinicus L.) on soil labile organic carbon and carbon conversion enzyme activities. Plant Nutr. Fertil. Sci. 2019, 25, 525–534. [Google Scholar]
  43. Chen, A.; Wang, Z.; Lin, Y.; Wang, X.; Li, Y.; Zhang, Y.; Tao, Z.; Gao, Q.; Tang, G. Temporal variation of soil organic carbon pools along a chronosequence of reforested land in Southwest China. Catena 2020, 194, 104650. [Google Scholar] [CrossRef]
  44. Jat, H.S.; Datta, A.; Choudhary, M.; Sharma, P.C.; Yadav, A.K.; Choudhary, V.; Vishu, G.M.; Jat, M.L.; McDonald, A. Climate Smart Agriculture practices improve soil organic carbon pools, biological properties and crop productivity in cereal-based systems of North-West India. Catena 2019, 181, 104059. [Google Scholar] [CrossRef]
  45. Song, J.; Huang, J.; Gao, J.-S.; Wang, Y.-N.; Wu, C.-X.; Bai, L.-Y.; Zeng, X.-B. Effects of green manure planted in winter and straw returning on soil aggregates and organic matter functional groups in double cropping rice area. Chin. J. Appl. Ecol. 2021, 32, 564–570. [Google Scholar]
  46. Wang, Y.; Huang, J.; Huan, H.; Huang, D.; Liu, G.; Lesueur, D.; Hong, J.; Dong, R. Phosphate fertilizer addition increases the movement distance and content of the acid soil inorganic phosphorus fractions at green manure microsites. Agrochimica 2020, 64, 397–412. [Google Scholar] [CrossRef]
Figure 1. The incubation column design with a reconstructed soil profile.
Agronomy 12 01101 g001
Figure 2. The input amount and decomposition amount of the total organic carbon, cellulose, and lignin of green manure in each treatment. The vertical bands represent the standard error (n = 3), control (CK), single P fertilizer (P), a low amount of green manure (LG), a high amount of green manure (HG), a low amount of green manure mixed with P fertilizer (LG + P), and a high amount of green manure mixed with P fertilizer (HG + P). The asterisk indicates that each index is significantly different at 0.05 level between the two incubation times, while the lowercase letter indicates that different treatments are significantly different at the 0.05 level at the same incubation time.
Agronomy 12 01101 g002
Figure 3. The movement dynamics of soil organic carbon fraction contents at 14 ((left) column) and 28 ((right) column) days of the soil column test. The vertical bands represent the standard error (n = 3), control (CK), single P fertilizer (P), a low amount of green manure (LG), a low amount of green manure mixed with P fertilizer (LG + P), a high amount of green manure (HG), and a high amount of green manure mixed with P fertilizer (HG + P).
Agronomy 12 01101 g003
Figure 4. The final movement distance (ae) and accumulation amount (fj) of soil organic carbon fractions at 14 and 28 days. Vertical bands represent the standard error (n = 3), control (CK), single P fertilizer (P), a low amount of green manure (LG), a low amount of green manure mixed with P fertilizer (LG + P), a high amount of green manure (HG), and a high amount of green manure mixed with P fertilizer (HG + P). The asterisk indicates that each index is significantly different at the 0.05 level between the two incubation times, while the lowercase letters indicate that different treatments are significantly different at the 0.05 level at the same incubation time.
Agronomy 12 01101 g004
Figure 5. A structural equation model describing the effects of incubation time, P fertilizer, and green manure on movement distance of OC fractions (a) and standardized total effects (STE, the sum of direct and indirect effects from each variable from the SEM on movement distance) of the OC fractions (b). The numbers labelling the arrows are the standardized path coefficients and indicate the strength of the relationships. No line between the two variables indicates no significant correlation. The significance levels of each predictor are * p < 0.05, ** p < 0.01, and *** p < 0.001.
Agronomy 12 01101 g005
Figure 6. A structural equation model describing the effects of incubation time, P fertilizer, and green manure on the accumulation amount of OC fractions (a), and the standardized total effects (STE, the sum of direct and indirect effects from each variable from the SEM on accumulation amount) of the OC fractions (b). The numbers labelling the arrows are the standardized path coefficients and indicate the strength of the relationships. No line between two variables indicates no significant correlation. The significance levels of each predictor are * p < 0.05, ** p < 0.01, and *** p < 0.001.
Agronomy 12 01101 g006
Figure 7. The migration movement dynamics of soil total nitrogen content at 14 (a) and 28 (b) days. The final migration movement distance (c) and accumulation amount (d) of the soil total nitrogen at 14 and 28 days. Vertical bands represent the standard error (n = 3), control (CK), single P fertilizer (P), a low amount of green manure (LG), a low amount of green manure mixed with P fertilizer (LG + P), a high amount of green manure (HG), and a high amount of green manure mixed with P fertilizer (HG + P). The asterisk indicates that each index is significantly different at the 0.05 level between the two incubation times, while the lowercase letters indicate that different treatments are significantly different at the 0.05 level at the same incubation time.
Agronomy 12 01101 g007
Table 1. Physical-chemical properties of the tested soil and green manure.
SoilGreen Manure
pH5.6 ± 0.1TOC (g kg−1)249.8 ± 2.5
TOC (g kg−1)7.7 ± 0.2Cellulose content (%)25 ± 0.4
LFOC (g kg−1)1.25 ± 0.13Lignin content (%)14 ± 0.4
POC (g kg−1)6.5 ± 0.1
HFOC (g kg−1)0.34 ± 0.02
MOC (g kg−1)7.4 ± 0.4
Bulk density (g cm−3)1.32 ± 0.12
Table 2. The fertilization treatments in the experiment.
TreatmentsGreen Manure (g)Phosphate Fertilizer (g)
Control (CK)00
Phosphate fertilizer (P)01.048
Low level green manure (LG)58.80
LG + P58.81.048
High level green manure (HG)235.20
HG + P235.21.048
Table 3. The effect of the incubation time (D), P fertilizer (P), green manure (GM), and their interactions on the movement distance and accumulation amount OC fractions (TOC, LFOC, POC, HFOC, and MOC) and total nitrogen (TN) (F and p; * p < 0.05, ** p < 0.01, and *** p < 0.001).
VariablesTOCTNLFOCPOCHFOCMOC
Movement Distance
D19.6 ***65.3 ***149.3 ***3.92.217.4 ***
P3.62.60.20.31.20.9
GM2083.9 ***0.4727.4 ***509.3 ***687.8 ***150.7 ***
D × P1.60.9001.20
D × GM4.9 *0.737.9 ***3.9 *1.54.4 *
P × GM0.910.8 **0.20.30.72
D × P × GM0.710.1 **0.61.221
R2adjust0.990.790.980.970.980.9
Accumulation Amount
D572.4 ***110.7 ***942.4 ***285.6 ***291.4 ***789.5 ***
P87.8 ***5.375.3 ***10.6 **54.0 ***62.2 ***
GM2009.3 ***0.23111.5 ***704.5 ***1086.2 ***1298.5 ***
D × P73.5 ***1.85.1 *1.577.5 ***66.9 ***
D × GM391.3 ***1.1415.2 ***95.9 ***234.5 ***491.9 ***
P × GM29.2 ***10.0 **25.4 ***3.6 *18.3 ***24.6 ***
D × P × GM65.2 ***8.1 *13.4 ***1.772.2 ***57.9 ***
R2adjust0.990.850.990.980.990.99
Publisher’s Note: MDPI stays neutral with regard to jurisdictional claims in published maps and institutional affiliations.

