Article

Seasonal Dynamics of Soil Bacterial Community under Long-Term Abandoned Cropland in Boreal Climate

1
Department of Soil Biology and Biochemistry, Dokuchaev Soil Science Institute, Pyzhyovskiy Lane 7 Building 2, 119017 Moscow, Russia
2
All-Russian Research Institute of Agricultural Microbiology (ARRIAM), Podbelsky Chausse 3, Pushkin 8, 196608 Saint-Petersburg, Russia
*
Author to whom correspondence should be addressed.
Agronomy 2022, 12(2), 519; https://doi.org/10.3390/agronomy12020519
Submission received: 14 January 2022 / Revised: 17 February 2022 / Accepted: 18 February 2022 / Published: 19 February 2022

Abstract

:
The collapse of collective farming in Russia after 1990 led to the abandonment of 23% of the agricultural area. Microbial biomass is a transit pool between fresh and soil organic matter; therefore, structural changes in soil microbial community determine the carbon cycle processes caused by self-restoration of arable lands after abandonment. Here, we assessed the influence of monthly changes in moisture and temperature on the bacterial community structure and abundance in Retisols under long-term abandoned cropland. Two periods with pronounced differences in bacterial properties were revealed: the growing period from March to September and the dormant period from October to February. The growing period was characterized by higher bacterial abundance and diversity compared to the dormant period. The relative abundances of the bacterial community dominants (Alpha-, Gamma- and Deltaproteobacteria, subgroup 6 of phylum Acidobacteria) did not change significantly over the year, either in total or active communities. The relative abundances of Bacteroidetes and Verrucomicrobia increased in the growing period, whereas Actinobacteria and Chloroflexi were more abundant in the dormant period. The microbial gene abundances positively correlated with soil and air temperature, but not with soil moisture. Thus, the seasonal dynamics of soil microbial communities are closely related to soil temperature and should be considered when assessing carbon cycles in abandoned lands.

1. Introduction

The collapse of collective farming in Russia after 1990 led to the abandonment of more than 45 million hectares of arable lands [1,2,3]. About 40 million hectares remain abandoned [4], undergoing self-restoration and developing toward natural ecosystems [5]. Abandoned lands are now occupied by natural vegetation and accumulate carbon in both soil and plant biomass [2]. The total carbon sink for bioclimatic zones of middle and southern taigas is 38.5 ± 9.5 Mt C/year [2]. Microbial biomass is a transit pool between fresh and soil (transformed) organic matter; therefore, the process of carbon sequestration is closely related to the activity and functioning of soil microbial communities [6,7,8]. Microbial community structure also determines the temperature sensitivity (Q10) of soil organic matter decomposition [9].
Seasonal dynamics of soil microbial communities are an important part of soil function. Exact factors determining seasonal dynamics of microorganisms in soil vary between bioclimatic zones and can be related to climate (temperature and moisture regime) and soil parameters (carbon and nutrient contents, pH and particle size distribution) [10,11,12]. Plant root exudates and derivatives are also important drivers of microbial growth and activity [13]. The dynamics of root exudation depend on the relationship between plant development and weather, varying with season and feeding back to soil microbial activity. Therefore, seasonal changes in both temperature and moisture indirectly control microbial activity in soils through the regulation of plant activity.
The boreal climate is characterized by long, cold winters and short, mild summers [14]. An important aspect of boreal ecosystems is prolonged (4–5 months) snow cover. In such climatic conditions, the amount of root exudation is maximal in spring, during the most active period of plant growth [15,16,17]. Input of available organic matter into soil also takes place in autumn in the form of plant litter. Seasonal dynamics of soil microbial communities in boreal climates with pronounced annual changes in environmental conditions, especially contrasting temperature regimes, have previously been studied in forests and alpine meadows [18,19]. Retisols, or sod-podzolic soils, which are formed in boreal climates, occupy large areas in northern Eurasia and North America [20]. In comparison with other soils of Eurasia, Retisols are characterized by moderate microbial biomass and activity [21,22,23] but a considerable contribution of microbial biomass to total organic carbon [24,25]. Biological processes in Retisols occur during long periods of relatively low temperatures and excessive moisture [26]. For Retisols under abandoned croplands, the information regarding seasonal dynamics of soil microorganisms is scarce. The soil-forming processes of such soils differ from those of soils under natural or agricultural ecosystems [27,28].
Soil microbial communities consist of a broad range of organisms in different physiological states: active, potentially active, dormant or dead [29,30]. Most soil microorganisms are dormant due to the low availability of nutrient substrates, whereas microbial activity mostly occurs in hot spots related to plant activity [29]. When considering microbial dynamics in soil, changes not only in total, but also active microbial communities must be assessed. DNA is universally present in both active and inactive microorganisms and can be stored in soil for extended periods of time, even in dormant microbes or as extracellular DNA [31,32,33]. Such DNA reflects total microbial communities in the soil [29,34,35]. In contrast to DNA, extracellular RNA is unstable in soil environments [36], and the RNA content in dormant cells is usually extremely low [29]. Since the amount of RNA per cell is proportional to the metabolic activity of microorganisms [37], RNA-based approaches provide information on the potentially active parts of microbial communities [24].
The aim of this research was to investigate how seasonal changes in moisture and temperature influence the total and active bacterial community structure and abundance in long-term abandoned Retisols. For this purpose, we collected monthly soil samples from the surface and subsurface horizons of an abandoned Retisol and analyzed soil bacterial communities using RT-PCR and Illumina MiSeq amplicon sequencing. We hypothesized that changes in bacterial abundance would follow temperature and moisture variations because of their pronounced influence on the state of vegetation cover in boreal climatic conditions and that the highest bacterial abundance would be observed in periods with the highest temperatures and most plant activity. Additionally, we expected to find a prominent difference in bacterial community structures between periods with different temperature and moisture conditions. We aimed to determine the optimal sampling time for the most complete microbiome characterization of abandoned Retisols.

2. Materials and Methods

2.1. Study Site and Sampling Workflow

Soil under abandoned cropland was sampled from the long-term ecological research site “Eldigino”, located in Moscow district (N: 56°08′01.7″, E: 37°48′07.3″). The average annual air temperature is 3.0–3.5 °C, the effective temperature sum is 1900–2100 °C, the average frost-free period is 125–130 days, and the annual precipitation is 550–600 mm. The average temperatures of the coldest (January) and hottest (June) months are −9.2 and +18.4 °C, respectively. Snow cover was on the sampling site in March 2017 (15–20 cm) and from November 2017 (5–10 cm) to February 2018 (50–57 cm).
The sampling site was 20 m wide and 40 m long. Soil was classified as Eutric Albic Retisol [38], according to the world reference base (WRB) classification [20]. The full profile description is as follows: P, old arable horizon, 0–32 cm; BEL, subeluvial horizon, 32–40 cm; BT1, textural horizon, 40–50 cm; BT2, textural horizon, 50–67 cm; BC, 67–130 cm [39]. Plant cover comprises a secondary herbaceous community with the following dominant species (in June): Vicia sativa, Equisetum arvense, Ranunculus acris, Sonchus arvensis, Lactuca serriola, Poa pratensis, Taraxacum officinale, Trifolium pratense, Phleum pratense and Vicia cracca. Vegetation development started in late March 2017 (seed germination under snow cover) and lasted from April to late September. October was considered the beginning of the non-growing period.
Soil samples from 5 sampling points were collected at the end of each month from March 2017 to February 2018 using a soil sampling tube (5 cm diameter). The sampling points were located 3–5 m from each other on the transect, from west to east along the long side of the study site. The sampling depths were picked according to the distribution of soil horizons (10 cm corresponding to the upper old arable organic horizon, P (0–32 cm); 55 cm for the lower mineral horizon, BT2). In total, 120 soil samples were collected (5 points × 2 depths × 12 months). Samples for DNA and RNA extraction were stored in an ultra-low-temperature freezer at −70 °C. Moisture content was gravimetrically measured for all soil samples by weighing before and after heating at 105 °C for 5 h. Soil and air temperatures were measured using a Vantage Pro2 automatic stationary meteorological station near the sampling sites at depths of 10 and 55 cm.

2.2. Labile Carbon and Nitrogen Determination

Labile (water-extractable organic) C and N compounds were extracted using 0.05 M K2SO4, according to the method described in [40]. A total of 5 g of the upper horizon sample and 1 g of the mineral horizon sample were used for the extraction. Water-extractable organic C (WEOC) and N (WEON) was determined using a TOC-V CPN (Shimadzu) automatic analyzer.

2.3. DNA and RNA Extraction

RNeasy PowerSoil Total RNA Kit and RNeasy PowerSoil DNA Elution Kit (Qiagen, Hilden, Germany) were used for simultaneous DNA and RNA extraction. The extraction was performed according to the manufacturer’s instructions from 2 g of soil. DNA concentration in the extracts was estimated by a Qubit 3 fluorometer (Life Technologies, Carlsbad, CA, USA) using a Qubit dsDNA HS Assay Kit (Molecular Probes/Life Technologies, Carlsbad, CA, USA).

2.4. RNA Treatment and Reverse Transcription

After extraction, RNA was treated with RNase-free DNase I (50 U/µL) (Thermo Fisher Scientific, Waltham, MA, USA). We added 8 µL of RNA extract, 1 µL of buffer and 1 U of DNase I. The reaction mix was then heated to 37 °C for 30 min. For the deactivation of DNase, 1 µL of EDTA was added to the reaction mix, followed by heating at 65 °C for 10 min.
The extracted soil RNA was reverse transcribed using an MMLV RT kit (Evrogen, Moscow, Russia) according to the manufacturer’s instructions. For the reaction, 6 μL of RNA matrix and 3 μL of random (dN)10-primer (concentration, 20 μM) were carefully mixed in a sterile tube. The mix was heated for 2 min at 70 °C and transferred to ice. We added 11 μL of previously prepared mix (4 μL of 5× buffer, 2 μL of dNTP mix (concentration, 10 μM each), 2 μL of DTT (concentration, 20 μM) and 3 μL of MMLV revertase). To prevent probe degradation, 0.5 μL of RiboLock was added to 20 μL of the previously prepared mix. The final mix was incubated for 30–60 min at 37–42 °C for reverse transcription. To stop the reaction, the final mix was heated for 10 min at 70 °C.

2.5. Quantitative PCR Analysis

In order to quantify soil microorganisms, ribosomal gene abundance was estimated using a quantitative polymerase chain reaction (qPCR). We used the following primers: Eub338f/Eub518r for 16S ribosomal genes of bacteria [41] and 915f/1059r for 16S ribosomal genes of Archaea [42]. The qPCR mix contained 10 μL of 2× concentrated master mix (BioMaster HS-qPCR SYBR Blue (Biolabmix, Novosibirsk, Russia)), 0.5–0.8 μM of each primer and 1 μL of DNA template in a total volume of 20 μL. qPCR was performed in a C1000 thermal cycler with a CFX96 real-time system (Bio-Rad Laboratories, Hercules, CA, USA). PCR thermal conditions for both bacterial and archaeal 16S rRNA were 3 min at 95 °C, followed by 49 cycles of 95 °C for 10 s, 50 °C for 10 s and 72 °C for 20 s, followed by melting curve analysis after the last cycle. Standards for qPCR were prepared by cloning the target fragment on plasmid. The target fragments were from Escherichia coli for bacterial 16S rRNA genes and strain FG-07 Halobacterium salinarum for archaeal 16S rRNA genes. Standards for the reaction were used in concentrations ranging from 103 to 109 gene copy number/μL. The efficiencies of the qPCR were 82–101%, and the coefficients of determination (R2) were >0.90 for all the standard curves.

2.6. Sequencing of 16S rRNA Gene Libraries

High-throughput sequencing of the 16S rRNA gene libraries was performed for extracted DNA and for the reverse-transcribed RNA (cDNA). Samples were sequenced from two horizons in 5 replicates for each sampling time, excluding the samples collected in January 2018 and other samples with low DNA concentrations (less than 0.2 µg g−1 dry soil). For the lower horizon (55 cm depth), we only performed sequencing for samples collected from March to September due to the low DNA concentrations of the other samples. In total, 85 DNA and 85 cDNA samples were sequenced in Evrogen, Russia. The variable regions V3-V4 of 16S rRNA genes were amplified out using the Illumina protocol and 16S metagenomic sequencing library preparation, using primers 341F and 805R. After amplification, the libraries were purified and equimolarly mixed with a SequalPrep™ normalization plate kit. Libraries were sequenced in two separate runs by Illumina MiSeq with 2 × 250 bp paired reads using a MiSeq v2 reagent kit (500 cycles). In total, 2,367,648 sequences of the 16S rRNA gene were obtained (4091 to 55,165 sequences per sample). From the gene transcript library, 3,186,156 sequences of the 16S rRNA gene were obtained (6813 to 122,563 sequences per sample).

2.7. Processing of 16S rRNA Gene Data

Sequence data were separately processed for the two libraries, 16S rRNA genes and transcripts, using QIIME 1.9 [43]. Trimming was carried out using Trimmomatic [44], and forward and reverse reads were merged using the fastq-join algorithm [45]. We checked for chimeras using the VSEARCH algorithm [46]. OTU picking was performed using a close-reference picking algorithm based on 97% sequence similarity with the SILVA database, version 132, 2018 (https://www.arb-silva.de/download/archive/qiime, accessed on 28 November 2019). Singletons (OTUs containing only one sequence) and 16S rRNA sequences of chloroplasts and mitochondria were removed. For the 16S rRNA gene library, data were normalized to 4091 sequences per sample; 7 samples with a lower number of sequences were excluded from the analysis. For 16S rRNA gene transcript libraries, data were normalized to 6813 sequences per sample, and 18 samples with a lower number of sequences were excluded from the analysis.
To estimate total diversity of prokaryotic communities, α-diversity indices were calculated (Shannon, PD whole tree, Chao1 and number of observed OTUs). β-diversity analysis was performed using weighted UniFrac [47]. Based on weighted UniFrac distances, non-metric multidimensional scaling (NMDS) was carried out to construct diagrams of similarity in prokaryotic community structures. β-diversity diagrams were drawn separately for all samples and for upper and lower horizons.
Taxonomic structures of prokaryotic communities were visualized based on both 16S rRNA genes and gene transcripts using heatmaps. Only taxa (classes) with an abundance of more than 0.5% in at least one sample were used for heatmaps.

2.8. Statistical Analyses

A multiple t-test was performed to test for significant (p < 0.05) differences in gene copy numbers and diversity indices for bacteria and archaea. Pearson correlations between microbiological, physical and chemical characteristics were calculated in STATISTICA 10.0.

3. Results

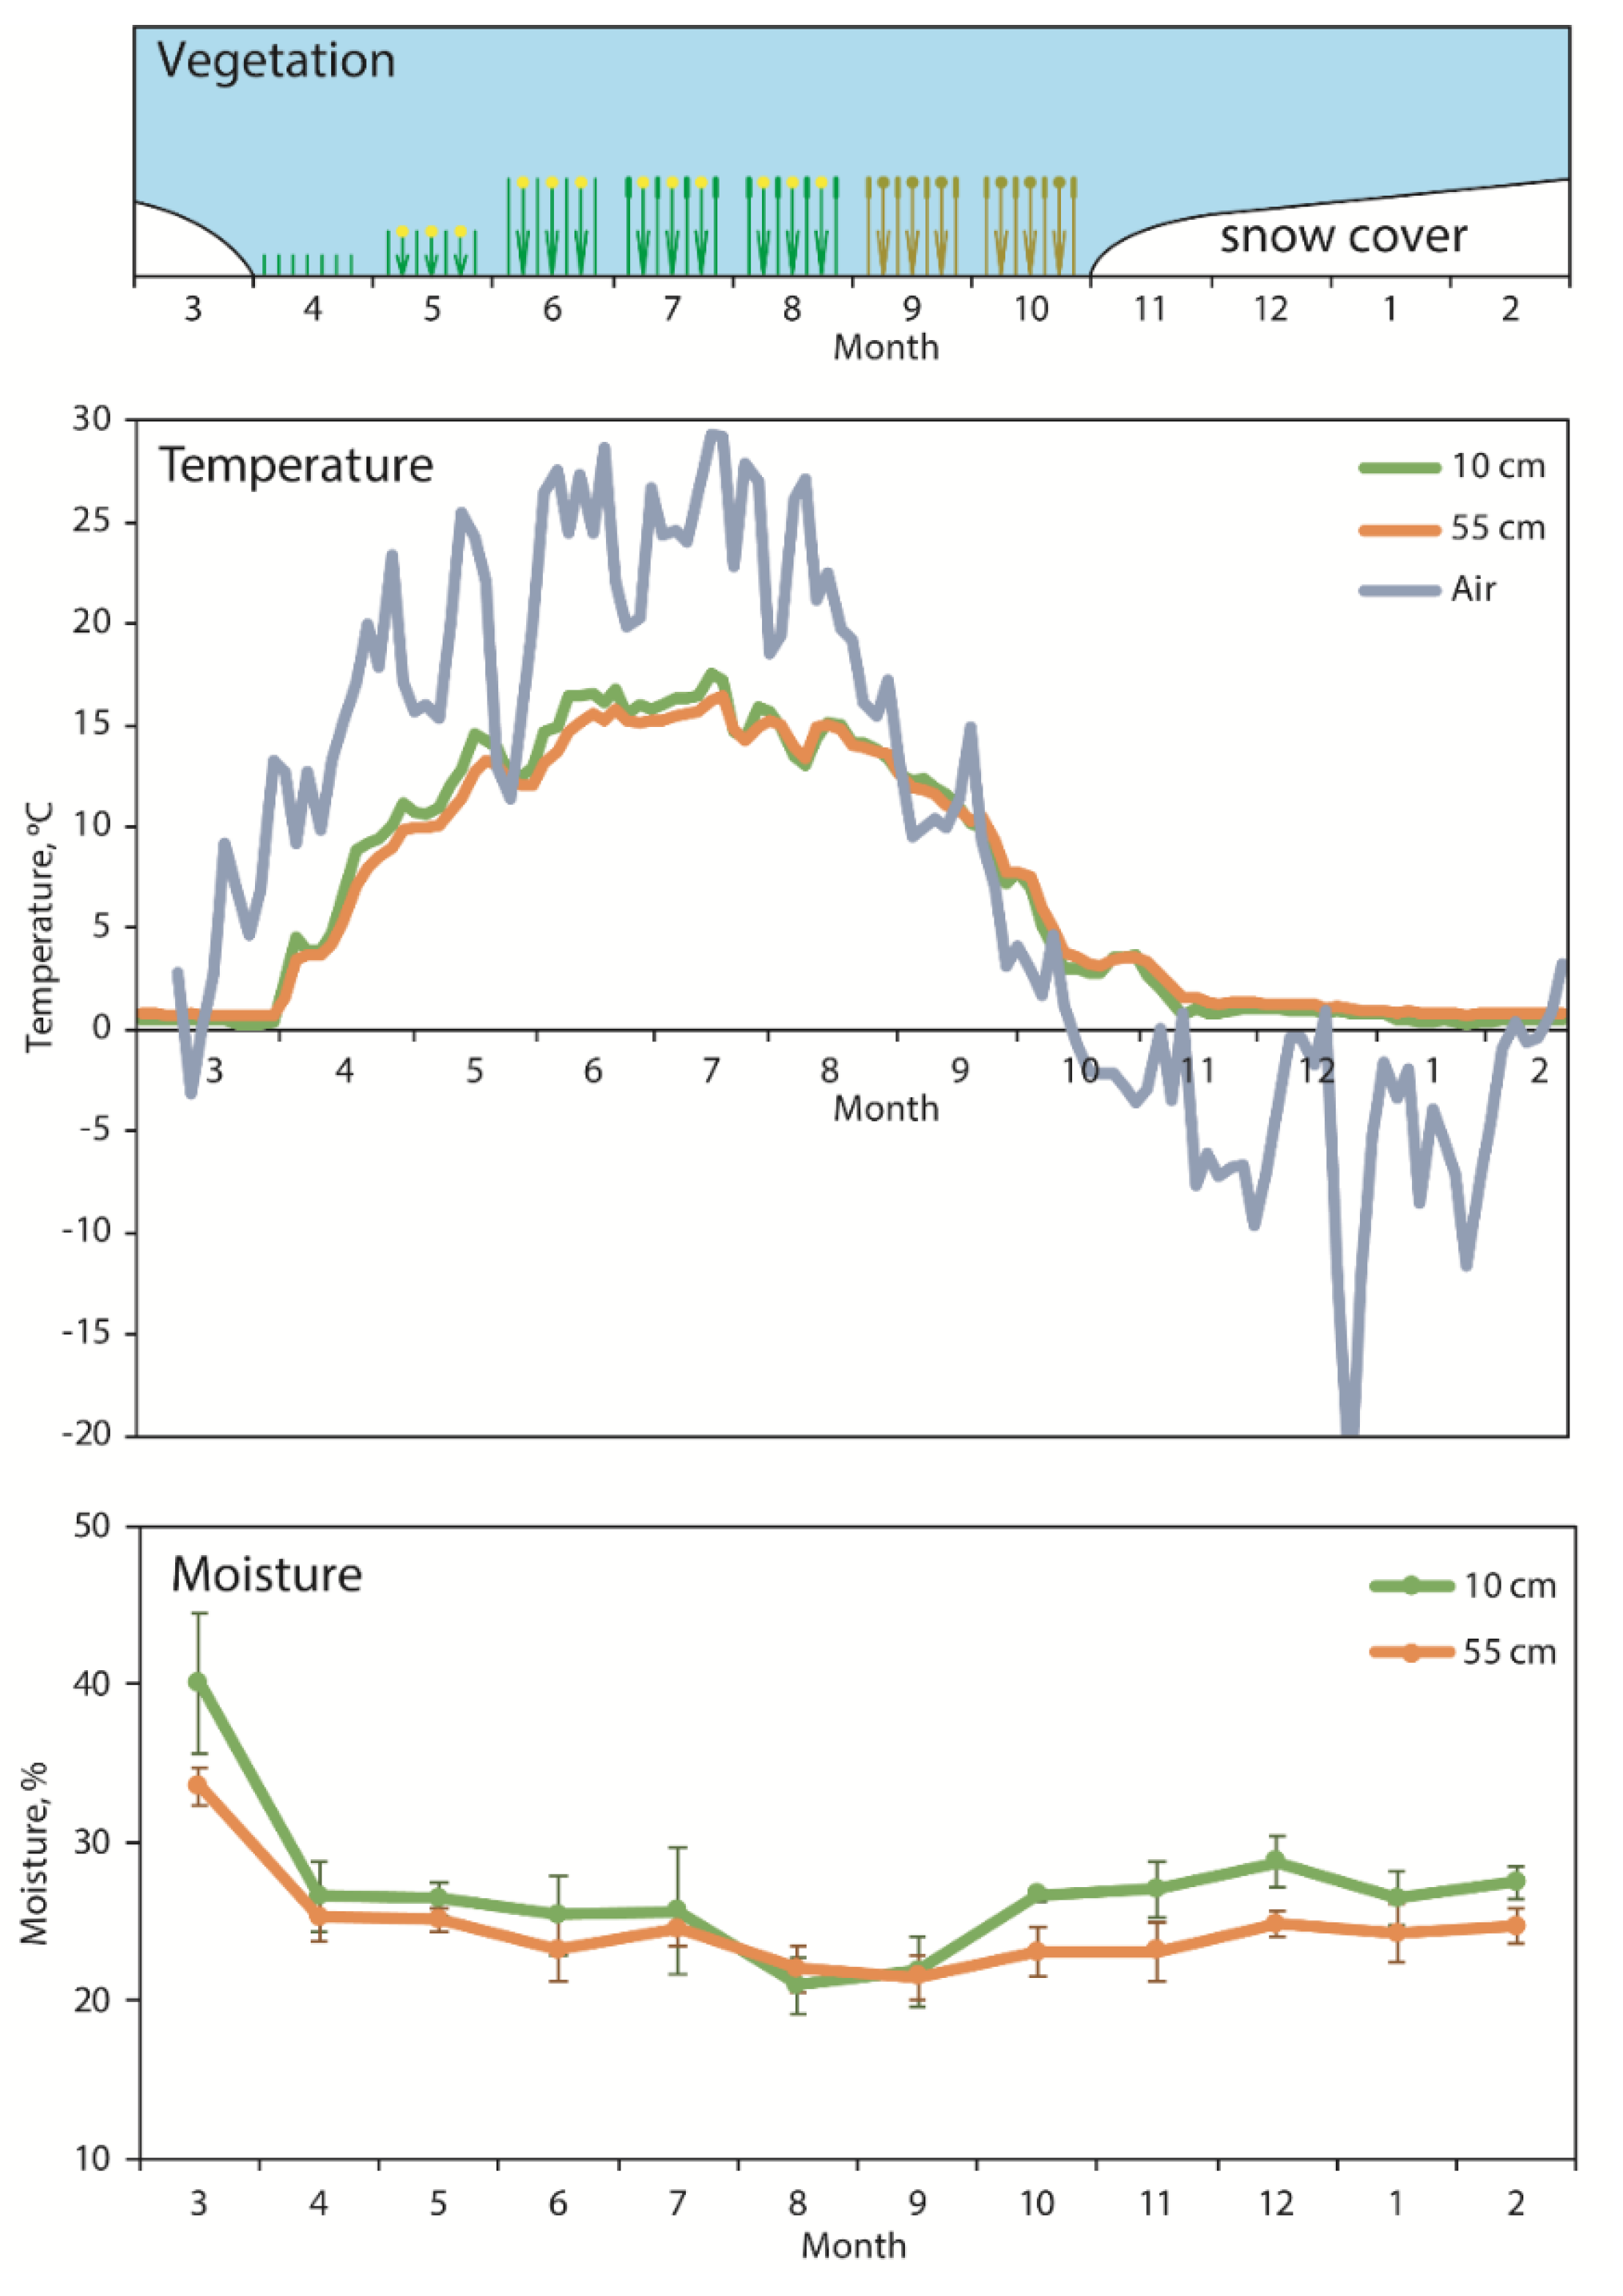
3.1. Dynamics of Soil Moisture and Temperature

The moisture contents of the soil horizons varied from 18.9% to 45.5%, with the maximum in March, during active snowmelt, and the minimum in August (Figure 1). Throughout the year, samples of the upper soil horizon were characterized by higher moisture content compared to samples of the lower soil horizon. Snow cover was observed from November to March (in March 2017 and from November 2017 to February 2018).
Soil temperature dynamics followed changes in air temperature, with some delay, from spring to late autumn. In the studied period, the minimal air temperature was −22.7 °C (in January), and the maximal air temperature was +29.3 °C (in July). Soil temperature was stable during winter and did not fall below 0 °C due to the absence of prolonged frosts before the formation of snow cover. The temperature of both soil horizons was minimal (0.5–2 °C) from November to March. A significant increase in soil temperature was observed from mid-April (0.5 °C) to late May (14.6 °C). In early June, a local cooling was noted (12.3 °C). The maximum soil temperature (15–17.2 °C) was detected from the end of June to the beginning of August, and then a gradual decrease in temperature to the minimum was observed. Temperature fluctuations in the surface horizon were stronger than those in the lower horizon.

3.2. Seasonal Changes in Soil DNA Yields, WEOC and WEON

The contents of WEOC in the upper horizons varied from 7.26 × 10⁻³% to 3.23 × 10⁻²% of soil dry weight throughout the year (Supplementary Table S1). In the lower horizons, the variation was less pronounced (from 1.76 × 10⁻³% to 6.82 × 10⁻³% of soil dry weight). A similar variation pattern was observed for WEON concentration (from 2.36 × 10⁻⁴% to 3.84 × 10⁻³% in the upper horizons and from 2.76 × 10⁻⁵% to 6.03 × 10⁻⁴% in the lower horizons). The highest amounts of WEOC and WEON were observed in June and October and from February to April. WEOC and WEON concentrations were lowest in May, June, August and December.
In the upper soil horizon, DNA yields varied from 37 to 114 µg g−1 dry soil from March to September. In the lower horizon, DNA yields were lower than 20 µg g−1 dry soil from March to September. For the period from October to February, DNA yields were below the detection limit (less than 0.5 µg g−1 dry soil) (Figure 2).

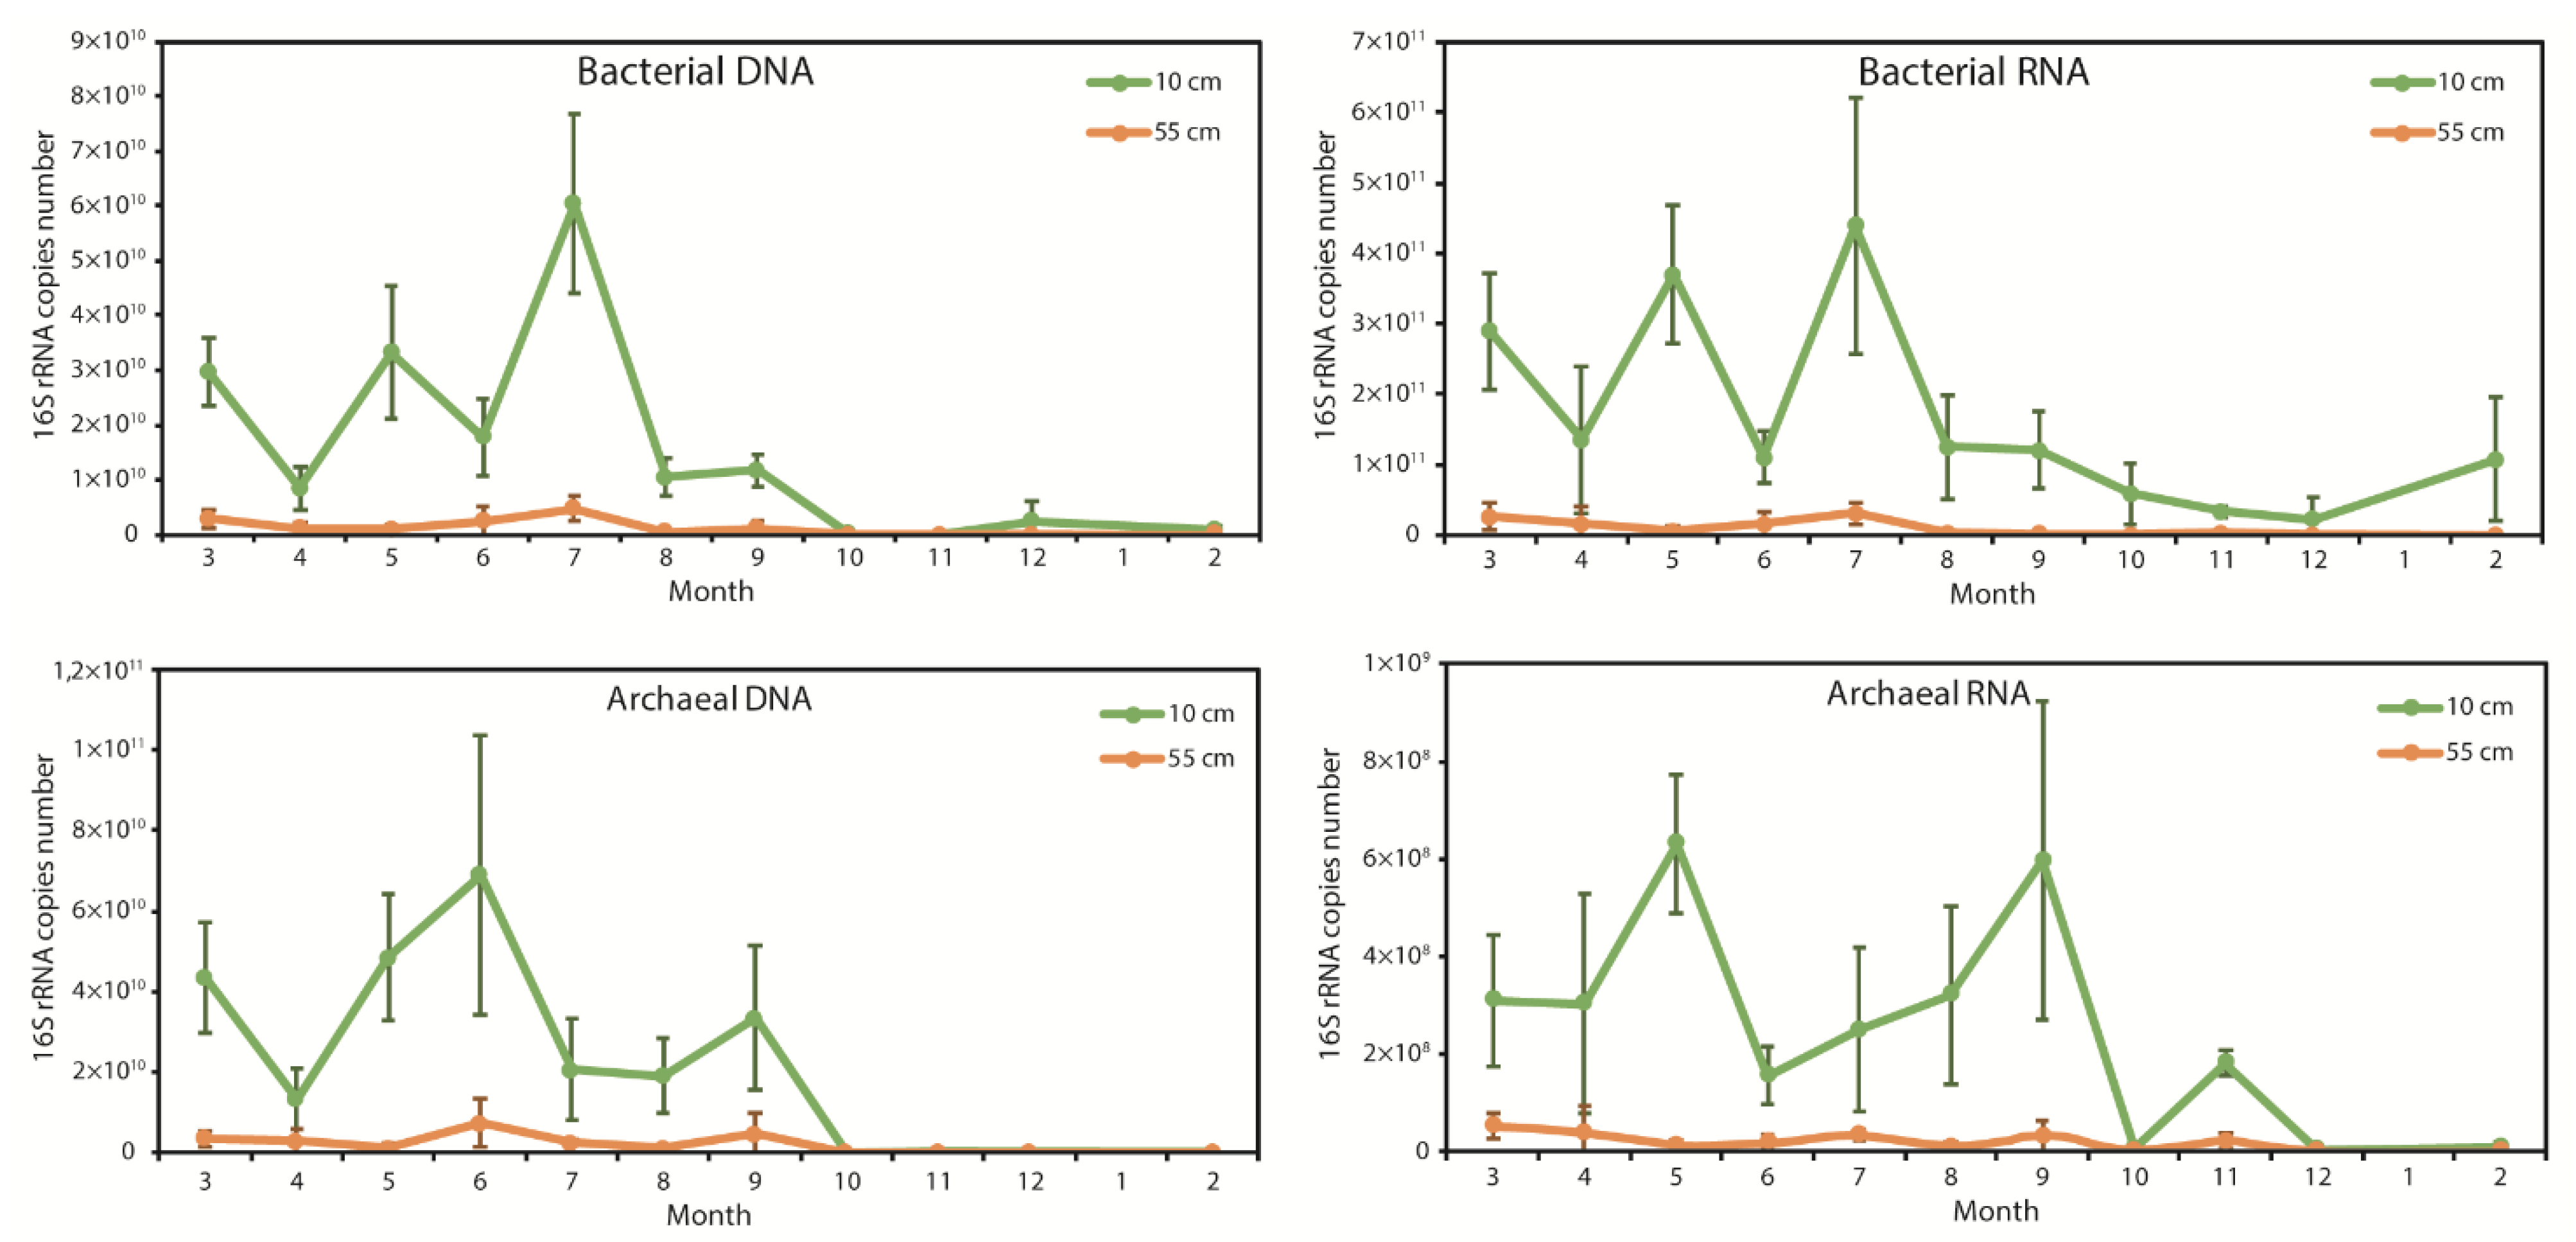
3.3. Seasonal Changes of Bacterial and Archaeal 16S rRNA Gene Copies in Total Soil DNA and RNA

Bacterial 16S rRNA gene copy numbers in DNA extracts varied slightly in the period from March to September and decreased by two orders of magnitude in October (Figure 3). The copy number of 16S rRNA gene transcripts in cDNA followed similar trends, with a decrease in October. The proportions of bacterial 16S rRNA gene abundance in DNA extracts and reverse-transcribed RNA extracts were the same (approximately 10:1 cDNA:DNA for bacteria and 1:100 for archaea) for all months, except October and November. Little variation was observed in the abundance of archaeal 16S rRNA gene copies from March to September, although it dropped significantly (by four orders of magnitude) in October and was relatively low for the whole winter period.
For depths of 10 and 55 cm, all studied gene abundances in DNA and reverse-transcribed RNA extracts positively correlated with DNA yields (Supplementary Tables S2 and S3). For the upper horizons, the abundances of bacterial 16S genes and gene transcripts positively correlated with both soil and air temperature; the correlation coefficients were higher for air temperature (Pearson correlation coefficients of 0.59 and 0.55 for genes and gene transcripts, respectively) than for soil temperature (0.448 and 0.431 for genes and gene transcripts, respectively). The abundance of archaeal 16S gene copies also correlated positively with soil and air temperatures.

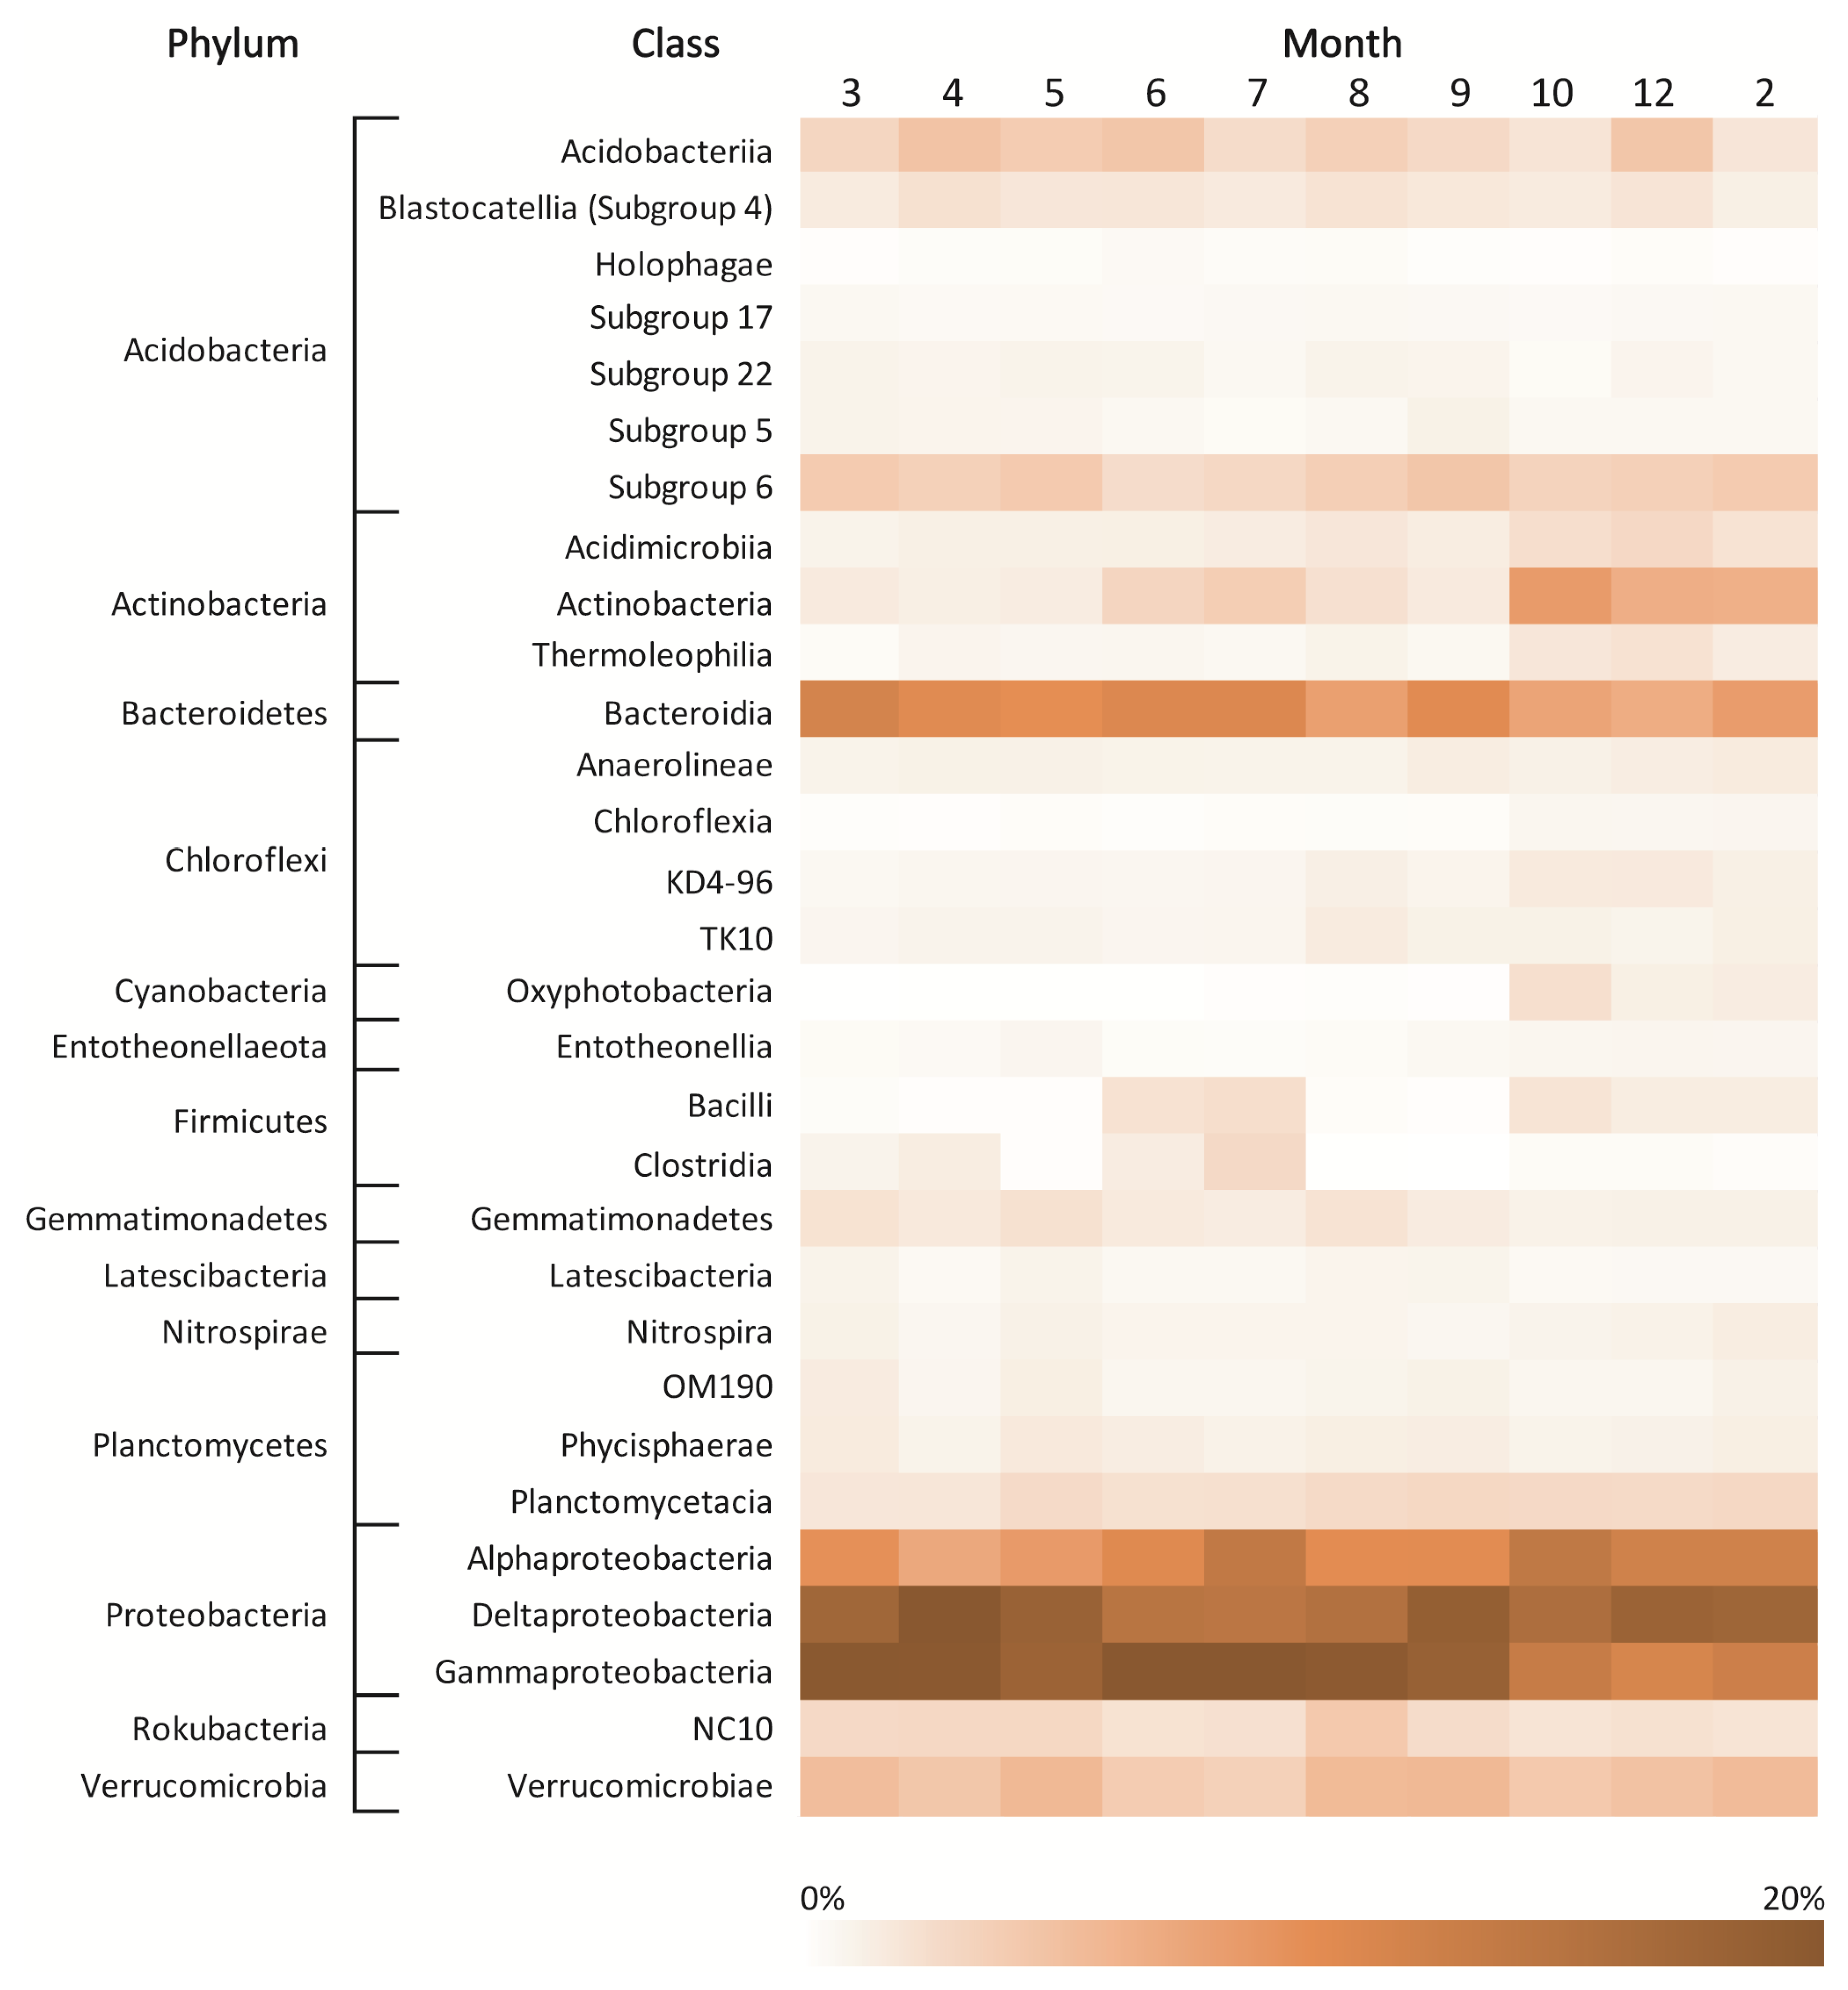
3.4. Taxonomic Structure of Bacterial Communities

In the upper horizon, Alphaproteobacteria (up to 19%), subgroup 6 of the phylum Acidobacteria (up to 19%), Gammaproteobacteria (up to 15%) and Deltaproteobacteria (up to 8%) were the dominant classes in the bacterial community, and their abundances changed slightly throughout the year (Figure 4 and Figure 5). The bacterial community of the lower horizon was predominated by the following classes: Acidobacteriia (up to 29%), AD3 of the phylum Chloroflexi (up to 23%), Gemmatimonadetes (up to 16%), Alphaproteobacteria (up to 11%) and Gammaproteobacteria (up to 11%) (Supplementary Figure S1).
In the upper horizon, Proteobacteria also dominated the active part of the bacterial communities for all months (Gammaproteobacteria (up to 23%), Deltaproteobacteria (up to 23%) and Alphaproteobacteria (up to 15%)). However, the relative abundances of subgroup 6 of the phylum Acidobacteria were lower compared to those in the total bacterial communities; conversely, the abundance of Bacteroidia was higher (up to 12%) and did not change during the studied period. In the lower horizon, dominant classes in the total and active bacterial communities were similar: Acidobacteriia (up to 28%), Gammaproteobacteria (up to 27%), Alphaproteobacteria (up to 17%), Gemmatimonadetes (up to 11%) and Deltaproteobacteria (up to 14%) (Supplementary Figure S2).
In the upper horizon, for both the active and total bacterial communities, we observed a difference in the relative abundances of several classes between the growing (March to September) and non-growing periods (October to February). In the non-growing season, there was an increase in the relative abundances of classes Thermoleophilia, Actinobacteria, Acidimicrobia of phylum Actinobacteria and class KD4-96 of phylum Chloroflexi. Some seasonal changes in relative abundances were observed only in the DNA-based library: an increase in class MB-A2-108 of phylum Actinobacteria and a decrease in Bacteroidetes (class Bacteroidia), Acidobacteria (class Blastocatellia) and Verrucomicrobia (class Verrucomicrobiae). In the active bacterial communities, the relative abundances of class Oxyphotobacteria of phylum Cyanobacteria were higher during the non-growing season. This class was also found in the DNA-based sequencing dataset, but its abundance was lower than 0.1%.

3.5. Changes of α- and β-Diversity Indices throughout the Year

We observed little difference in the α-diversity indices of the total bacterial communities from March to September in the upper horizons (Supplementary Table S4). In the non-growing season (from October to February), the α-diversity of the total bacterial community of the upper horizon decreased significantly. However, for the active part of the bacterial communities, no significant differences were found for any α-diversity index between different months throughout the year (Supplementary Table S5). α-diversity indices of the active bacterial communities were higher than those of the total communities. Compared to the other α-diversity indices, the Shannon index was the most stable throughout the season.
Depth was the major factor influencing the dissimilarity of bacterial communities in Retisols throughout the season (Figure 6). A pronounced discrepancy between microbial communities of the two sampling depths was also observed for WEOC/WEON, DNA yields, 16S gene abundances and α-diversity indices.
For the upper horizon, bacterial communities of samples collected in the non-growing period (October, December and February) were clustered separately from those collected from March to September (Figure 6).

4. Discussion

4.1. Physical and Chemical Factors Affecting Dynamics of Soil Microbial Communities

Contrary to our expectations, no correlation was found between soil moisture and bacterial and archaeal 16S rRNA gene copy numbers in either DNA or RNA datasets. This may be explained by small variations in moisture content in soil horizons throughout the season. Soil moisture in the studied plots varied little throughout the season, except in March, when the moisture content was relatively high after the snow melt. In previous studies, soil moisture was found to be one of the major factors affecting prokaryotic communities in soils under different land uses [11]. Our study reveals that soil moisture does not play an important role in determining the structure and abundance of soil prokaryotic communities in boreal climates compared to arid and subtropical soils [12,48,49].
The positive correlation between 16S bacterial gene copy numbers and soil and air temperature was revealed in this study. For the upper horizons, a positive correlation between temperature and DNA yields was observed. Previous studies showed that temperature affects the rates of microbiological processes directly through regulation of the physiological state of microbes [50] and indirectly through its influence on plant conditions and root exudation [51]. DNA yields and soil microbial biomass generally decrease with a decrease in temperature and the cessation of plant vegetation [11,15,52,53]. The stronger response of soil microbial properties to air temperature than to soil temperature may be evidence of the indirect influence of temperature on prokaryotic communities, i.e., through regulation of plant activity. Lower microbial activity in soils during the winter period was previously observed for soils under subalpine forests [54] and in floodplains [55]; however, in alpine meadows and arctic tundra sites, microbial biomass was found to be highest in the non-growing period, with temperatures below zero [18,56]. The high microbial growth activity, measured by 16S and 18S rRNA gene copy numbers, was observed during the late snowmelt period of the winter season in the soil of a temperate deciduous forest soil [16]. A winter peak of fungal activity was also observed in the plant litter of a temperate coniferous forest [57].
WEOC and WEON contents did not correlate with the copy numbers of ribosomal genes of soil microorganisms. This lack of correlation could be explained by excessive temporal variability in the WEOC and WEON contents in soil compared to soil DNA content, which is considered a steady soil parameter [13]. The observed dynamics of WEOC and WEON may be a result of a combination of two processes: water-extractable organic matter output by the plant community and its consumption by the microbial community. The spring increase in dissolved organic matter (DOM) was previously observed in other soils under temperate climatic conditions [16,58]. The autumn peak in WEOC and WEON contents could be explained by plant litter decomposition.

4.2. Seasonal Dynamics of Soil Bacterial Community Structure

Exact patterns of seasonal changes in soil prokaryotic communities in the boreal climate are still unclear. The dynamics of biological activity and taxonomic structure differ significantly among previously studied soils. In our study, two periods had contrasting soil microbial properties. However, slight changes in 16S rRNA gene abundances and taxonomic structure were observed both in growing and non-growing periods. This indicates that the activity of microbiological processes in soils formed under boreal climate conditions should be estimated both in summer and winter months. The importance of season-dependent sampling has also been highlighted in other studies [11,59,60]. According to our findings, winter sampling is important for the detailed estimation of bacterial community structure, whereas the highest microbial abundance, with slight variations, was observed in the whole period with active vegetation.
For the upper horizon, we observed several differences in soil bacterial community composition between two periods: from March to September (growing season) and from October to February (non-growing season). In the upper horizon, DNA yields, 16S rRNA gene copy abundances and bacterial α-diversity were significantly lower in the non-growing season. Bacterial community structures also differed between the two periods, according to NMDS metrics. However, the dominant classes of prokaryotic communities in two horizons did not change significantly throughout the year. Alpha-, Gamma- and Deltaproteobacteria; subgroup 6 of phylum Acidobacteria; and Bacteroidia can be considered core classes of the bacterial community of the upper horizon in the studied Retisol.
The relative abundances of some classes significantly differed for growing and non-growing seasons. Several uncultured bacteria of order Cytophagales, the abundance of which was reduced in the non-growing season, were previously found in a wide variety of ecosystems: different soils, decaying plant material, activated sludge, marine environments and gut microbial communities [61]. Bacteroidia are known as copiotrophs, and their abundance positively correlates with soil organic matter content [62,63]. Bacteroidia were found to be related to cellulose degradation [64] and capable of bioremediation of soils contaminated by petroleum hydrocarbons [65]. Their higher abundance in the growing season could be explained by plant exudates and litter input. However, in the active part of the bacterial community, Bacteroidia dominated throughout the year and did not decrease in the non-growing season.
The cultivable representatives of Acidobacteria (class Blastocatellia, families Blastocatellaceae and Pyrinomonadaceae) were also more abundant in the growing season in the total bacterial community, whereas in the active part of the community, their abundances were relatively low throughout the year. These representatives are mostly thermophiles and have previously been found in hot environments [66,67]. We suggest that their abundance in the total bacterial community was reduced in the non-growing season due to low temperatures.
Bacteria of phylum Verrucomicrobia (class Verrucomicrobiae) were previously found to be related to plant activity [68,69,70]. In buried soils, where plant influence was absolutely excluded, the abundance of Verrucomicrobia was found to be low [71]. In the studied soil, their higher abundances in the growing season could also be linked to plant activity.
The abundances of some classes increased in the non-growing season, most belonging to phylum Actinobacteria and previously found in soils (class Actinobacteria: Streptomyces, Arthrobacter, Blastococcus, Nakamurella and Intrasporangium) or cold environments (classes MB-A2-108 and Thermoleophilia). Throughout the year, uncultured actinobacteria of class MB-A2-108 were present in samples of the upper and lower horizons; this class was previously found in the glacier forelands of China [72] and may be psychrophilic. Bacteria of the class Thermoleophilia are typical habitants of soils of various biomes, and they were previously found in relatively high abundance in Antarctic soils [73], hot deserts [74] and soils in Algerian forests [75]. Representatives of class Thermoleophilia are considered mostly mesophilic, psychrotolerant [76] and resistant to water limitation [77]. Bacteria of the family Gaiellaceae were found to be more enriched in the drillosphere than the bulk soil under a no-till wheat cropping system [78].
An increase in abundance of some taxa in the non-growing period could be explained by both a reduction in abundances of dominant taxa and the growth of psychrophilic or psychrotolerant bacteria. Our findings are consistent with previously observed differences in structures of winter and summer microbial communities of alpine meadows [79]. According to the seasonal changes in soil metatranscriptomes in coniferous forests, no significant difference existed in soil microbial community structure, although the enzymatic activity and functioning of the community differed between summer and winter [80].

5. Conclusions

Two periods could be distinguished in terms of the dynamics of the bacterial communities in the Retisol under long-term abandoned cropland under boreal climatic conditions. The growing season, from March to September, was characterized by higher bacterial α-diversity and increased abundances of bacteria and archaea. From October to February, bacterial diversity and abundance in the upper horizon decreased significantly. In this dormant period, the abundances of psychrophilic and psychrotolerant bacteria increased. The abundance of dominant bacterial classes in the upper horizon changed little throughout the year. Moisture variation throughout the year did not significantly alter bacterial communities, but the abundances of bacterial 16S genes and transcript copies correlated positively with both soil and air temperature. Thus, the seasonal dynamics of bacterial composition in Retisols is mostly driven by temperature and should be considered for comparative analysis of microbial properties.

Supplementary Materials

The following supporting information can be downloaded at: www.mdpi.com/article/10.3390/agronomy12020519/s1, Figure S1. Heatmap of relative abundances of different classes in the total bacterial communities in the lower soil horizon throughout the season; Figure S2. Heatmap of relative abundances of different classes in the active bacterial communities in the lower soil horizon throughout the season; Table S1. Water-extractable organic carbon and nitrogen contents in two soil horizons; Table S2. Pearson correlations between estimated physical and microbiological parameters in upper horizons of studied soil (for entire year). Pairwise deletion of missing data. * p < 0.050. ** p < 0.01 and *** p < 0.001; Table S3. Pearson correlations between estimated physical and microbiological parameters in lower horizons of studied soil (for all year). Pairwise deletion of missing data. * p < 0.050. ** p < 0.01 and *** p < 0.001; Table S4. α-diversity indices estimated for prokaryotic communities using the analysis of 16S rRNA gene library for upper and lower horizons; Table S5. α-diversity indices for prokaryotic communities using the analysis of 16S rRNA gene transcripts library for upper and lower horizons.

Author Contributions

Conceptualization, T.C.; methodology, A.Z. (Alena Zhelezova) and T.C.; software, A.Z. (Aleksei Zverev) and T.C.; validation, M.S. and O.K.; formal analysis, A.Z. (Alena Zhelezova), A.T. and N.K.; investigation, D.N., A.T. and N.K.; resources, T.C. and O.K.; data curation, A.Z. (Alena Zhelezova) and A.Z. (Aleksei Zverev); writing—original draft preparation, A.Z. (Alena Zhelezova); writing—review and editing, T.C., D.N. and M.S.; visualization, T.C.; supervision, M.S.; project administration, A.T., O.K. and M.S.; funding acquisition, M.S. All authors have read and agreed to the published version of the manuscript.

Funding

This study was supported by the Russian Science Foundation, project no. 21-76-10025.

Institutional Review Board Statement

Not applicable.

Informed Consent Statement

Not applicable.

Data Availability Statement

The raw sequencing data (16S rRNA gene libraries) are deposited in NCBI database (https://www.ncbi.nlm.nih.gov/bioproject/PRJNA806755, accessed on 15 February 2022).

Acknowledgments

The authors are grateful to technical assistants who maintained the weather station on the territory and helped with sampling.

Conflicts of Interest

The authors declare no conflict of interest. The funders had no role in the design of the study; in the collection, analyses, or interpretation of data; in the writing of the manuscript, or in the decision to publish the results.

References

  1. Henebry, G.M. Carbon in idle croplands. Nature 2009, 457, 1089–1090. [Google Scholar] [CrossRef] [PubMed]
  2. Kurganova, I.; Lopes de Gerenyu, V.; Kuzyakov, Y. Large-scale carbon sequestration in post-agrogenic ecosystems in Russia and Kazakhstan. Catena 2015, 133, 461–466. [Google Scholar] [CrossRef]
  3. Kurganova, I.; Lopes de Gerenyu, V.; Six, J.; Kuzyakov, Y. Carbon cost of collective farming collapse in Russia. Glob. Chang. Biol. 2014, 20, 938–947. [Google Scholar] [CrossRef] [PubMed]
  4. ROSSTAT. Regions of Russia, Socio-Economic Indicators. Retrieved from Russian Federal Service of State Statistics Website. Available online: www.gks.ru (accessed on 10 January 2022).
  5. Kalinina, O.; Goryachkin, S.V.; Lyuri, D.I.; Giani, L. Post-agrogenic development of vegetation, soils, and carbon stocks under self-restoration in different climatic zones of European Russia. Catena 2015, 129, 18–29. [Google Scholar] [CrossRef]
  6. Tardy, V.; Spor, A.; Mathieu, O.; Lévèque, J.; Terrat, S.; Plassart, P.; Regnier, T.; Bardgett, R.D.; van der Putten, W.H.; Roggero, P.P.; et al. Shifts in microbial diversity through land use intensity as drivers of carbon mineralization in soil. Soil Biol. Biochem. 2015, 90, 204–213. [Google Scholar] [CrossRef]
  7. Semenov, V.M.; Pautova, N.B.; Lebedeva, T.N.; Khromychkina, D.P. Plant Residues Decomposition and Formation of Active Organic Matter in the Soil of the Incubation Experiments. Eurasian Soil Sci. 2019, 52, 1183–1194. [Google Scholar] [CrossRef]
  8. Liang, C.; Schimel, J.P.; Jastrow, J.D. The importance of anabolism in microbial control over soil carbon storage. Nat. Microbiol. 2017, 2, 17105. [Google Scholar] [CrossRef] [PubMed]
  9. Li, H.; Yang, S.; Semenov, M.V.; Yao, F.; Ye, J.; Bu, R.; Ma, R.; Lin, J.; Kurganova, I.; Wang, X.; et al. Temperature sensitivity of SOM decomposition is linked with a K-selected microbial community. Glob. Chang. Biol. 2021, 27, 2763–2779. [Google Scholar] [CrossRef]
  10. Waldrop, M.P.; Firestone, M.K. Seasonal dynamics of microbial community composition and function in oak canopy and open grassland soils. Microb. Ecol. 2006, 52, 470–479. [Google Scholar] [CrossRef]
  11. Lauber, C.L.; Ramirez, K.S.; Aanderud, Z.; Lennon, J.; Fierer, N. Temporal variability in soil microbial communities across land-use types. ISME J. 2013, 7, 1641–1650. [Google Scholar] [CrossRef]
  12. Lacerda-Júnior, G.V.; Noronha, M.F.; Cabral, L.; Delforno, T.P.; de Sousa, S.T.P.; Fernandes-Júnior, P.I.; Melo, I.S.; Oliveira, V.M. Land Use and Seasonal Effects on the Soil Microbiome of a Brazilian Dry Forest. Front. Microbiol. 2019, 10, 648. [Google Scholar] [CrossRef] [PubMed] [Green Version]
  13. Kuzyakov, Y.; Blagodatskaya, E. Microbial hotspots and hot moments in soil: Concept & review. Soil Biol. Biochem. 2015, 83, 184–199. [Google Scholar] [CrossRef]
  14. Chapin, F.S.; Matson, P.A.; Vitousek, P.M. Principles of Terrestrial Ecosystem Ecology; Springer: New York, NY, USA, 2011; ISBN 978-1-4419-9503-2. [Google Scholar]
  15. Medeiros, P.M.; Fernandes, M.F.; Dick, R.P.; Simoneit, B.R.T. Seasonal variations in sugar contents and microbial community in a ryegrass soil. Chemosphere 2006, 65, 832–839. [Google Scholar] [CrossRef]
  16. Isobe, K.; Oka, H.; Watanabe, T.; Tateno, R.; Urakawa, R.; Liang, C.; Senoo, K.; Shibata, H. High soil microbial activity in the winter season enhances nitrogen cycling in a cool-temperate deciduous forest. Soil Biol. Biochem. 2018, 124, 90–100. [Google Scholar] [CrossRef]
  17. Xu, Z.; Dai, X.; Chai, X. Effect of different carbon sources on denitrification performance, microbial community structure and denitrification genes. Sci. Total Environ. 2018, 634, 195–204. [Google Scholar] [CrossRef] [PubMed]
  18. Xu, B.; Wang, J.; Wu, N.; Wu, Y.; Shi, F. Seasonal and interannual dynamics of soil microbial biomass and available nitrogen in an alpine meadow in the eastern part of Qinghai-Tibet Plateau, China. Biogeosciences 2018, 15, 567–579. [Google Scholar] [CrossRef] [Green Version]
  19. Žifčáková, L.; Větrovský, T.; Howe, A.; Baldrian, P. Microbial activity in forest soil reflects the changes in ecosystem properties between summer and winter. Environ. Microbiol. 2016, 18, 288–301. [Google Scholar] [CrossRef] [PubMed]
  20. IUSS Working Group WRB. World Reference Base for Soil Resources 2014. International Soil Classification System for Naming Soils and Creating Legends for Soil Maps; IUSS Working Group WRB: Rome, Italy, 2014; ISBN 9789251083697. [Google Scholar]
  21. Ananyeva, N.D.; Susyan, E.A.; Chernova, O.V.; Chernov, I.Y.; Makarova, O.L. The ratio of fungi and bacteria in the biomass of different types of soil determined by selective inhibition. Microbiology 2006, 75, 702–707. [Google Scholar] [CrossRef]
  22. Ananyeva, N.D.; Susyan, E.A.; Ryzhova, I.M.; Bocharnikova, E.O.; Stolnikova, E.V. Microbial biomass carbon and the microbial carbon dioxide production by soddy-podzolic soils in postagrogenic biogeocenoses and in native spruce forests of the southern taiga (Kostroma oblast). Eurasian Soil Sci. 2009, 42, 1029–1037. [Google Scholar] [CrossRef]
  23. Sazonov, S.N.; Manucharova, N.A.; Gorlenko, M.V.; Umarov, M.M. Natural restoration of the microbiological properties of soddy-podzolic soil of fallow land. Eurasian Soil Sci. 2005, 38, 511–515. [Google Scholar]
  24. Loeppmann, S.; Semenov, M.; Kuzyakov, Y.; Blagodatskaya, E. Shift from dormancy to microbial growth revealed by RNA:DNA ratio. Ecol. Indic. 2018, 85, 603–612. [Google Scholar] [CrossRef]
  25. Ananyeva, N.D.; Susyan, E.A.; Chernova, O.V.; Wirth, S. Microbial respiration activities of soils from different climatic regions of European Russia. Eur. J. Soil Biol. 2008, 44, 147–157. [Google Scholar] [CrossRef]
  26. Dobrovol’skaya, T.G.; Zvyagintsev, D.G.; Chernov, I.Y.; Golovchenko, A.V.; Zenova, G.M.; Lysak, L.V.; Manucharova, N.A.; Marfenina, O.E.; Polyanskaya, L.M.; Stepanov, A.L.; et al. The role of microorganisms in the ecological functions of soils. Eurasian Soil Sci. 2015, 48, 959–967. [Google Scholar] [CrossRef]
  27. Lednev, A.V.; Dmitriev, A.V. Overgrowing of fallow soddy podzolic soils as a factor of modern pedogenesis. Russ. Agric. Sci. 2017, 43, 482–485. [Google Scholar] [CrossRef]
  28. Telesnina, V.M.; Zhukov, M.A. The Influence of Agricultural Land Use on the Dynamics of Biological Cycling and Soil Properties in the Course of Postagrogenic Succession (Kostroma Oblast). Eurasian Soil Sci. 2019, 52, 1122–1136. [Google Scholar] [CrossRef]
  29. Blagodatskaya, E.; Kuzyakov, Y. Active microorganisms in soil: Critical review of estimation criteria and approaches. Soil Biol. Biochem. 2013, 67, 192–211. [Google Scholar] [CrossRef]
  30. Blazewicz, S.J.; Barnard, R.L.; Daly, R.A.; Firestone, M.K. Evaluating rRNA as an indicator of microbial activity in environmental communities: Limitations and uses. ISME J. 2013, 7, 2061–2068. [Google Scholar] [CrossRef] [Green Version]
  31. Bowsher, A.W.; Kearns, P.J.; Shade, A. 16S rRNA/rRNA Gene Ratios and Cell Activity Staining Reveal Consistent Patterns of Microbial Activity in Plant-Associated Soil. mSystems 2019, 4, e00003-19. [Google Scholar] [CrossRef] [PubMed] [Green Version]
  32. Carini, P.; Marsden, P.J.; Leff, J.W.; Morgan, E.E.; Strickland, M.S.; Fierer, N. Relic DNA is abundant in soil and obscures estimates of soil microbial diversity. Nat. Microbiol. 2016, 2, 16242. [Google Scholar] [CrossRef]
  33. Levy-Booth, D.J.; Campbell, R.G.; Gulden, R.H.; Hart, M.M.; Powell, J.R.; Klironomos, J.N.; Pauls, K.P.; Swanton, C.J.; Trevors, J.T.; Dunfield, K.E. Cycling of extracellular DNA in the soil environment. Soil Biol. Biochem. 2007, 39, 2977–2991. [Google Scholar] [CrossRef]
  34. Semenov, M.; Blagodatskaya, E.; Stepanov, A.; Kuzyakov, Y. DNA-based determination of soil microbial biomass in alkaline and carbonaceous soils of semi-arid climate. J. Arid Environ. 2018, 150, 54–61. [Google Scholar] [CrossRef]
  35. Anderson, T.H.; Martens, R. DNA determinations during growth of soil microbial biomasses. Soil Biol. Biochem. 2013, 57, 487–495. [Google Scholar] [CrossRef]
  36. Wang, Y.; Hayatsu, M.; Fujii, T. Extraction of Bacterial RNA from Soil: Challenges and Solutions. Microbes Environ. 2012, 27, 111–121. [Google Scholar] [CrossRef] [PubMed] [Green Version]
  37. Mills, H.J.; Martinez, R.J.; Story, S.; Sobecky, P. Identification of Members of the Metabolically Active Microbial Populations Associated with Beggiatoa Species Mat Communities from Gulf of Mexico Cold-Seep Sediments. Appl. Environ. Microbiol. 2004, 70, 5447–5458. [Google Scholar] [CrossRef] [Green Version]
  38. Skvortsova, E.B.; Shein, E.V.; Abrosimov, K.N.; Romanenko, K.A.; Yudina, A.V.; Klyueva, V.V.; Khaidapova, D.D.; Rogov, V.V. The Impact of Multiple Freeze–Thaw Cycles on the Microstructure of Aggregates from a Soddy-Podzolic Soil: A Microtomographic Analysis. Eurasian Soil Sci. 2018, 51, 190–198. [Google Scholar] [CrossRef]
  39. Nikitin, D.A.; Chernov, T.V.; Zhelezova, A.D.; Tkhakakhova, A.K.; Nikitina, S.A.; Semenov, M.V.; Xenofontova, N.A.; Kutovaya, O.V. Seasonal Dynamics of Microbial Biomass in Soddy-Podzolic Soil. Eurasian Soil Sci. 2019, 52, 1414–1421. [Google Scholar] [CrossRef]
  40. Makarov, M.I.; Shuleva, M.S.; Malysheva, T.I.; Menyailo, O.V. Solubility of the labile forms of soil carbon and nitrogen in K2SO4 of different concentrations. Eurasian Soil Sci. 2013, 46, 369–374. [Google Scholar] [CrossRef]
  41. Fierer, N.; Jackson, J.A.; Vilgalys, R.; Jacksson, R.B. Assessment of soil microbial community structure by use of taxon-specific quantitative PCR assays. Appl. Environ. Microbiol. 2005, 71, 4117. [Google Scholar] [CrossRef] [Green Version]
  42. Yu, Y.; Lee, C.; Hwang, S. Analysis of community structures in anaerobic processes using a quantitative real-time PCR method. Water Sci. Technol. 2005, 52, 85–91. [Google Scholar] [CrossRef]
  43. Caporaso, J.G.; Kuczynski, J.; Stombaugh, J.; Bittinger, K.; Bushman, F.D.; Costello, E.K.; Fierer, N.; Peña, A.G.; Goodrich, K.; Gordon, J.I.; et al. QIIME allows analysis of high-throughput community sequencing data. Nat. Methods 2010, 7, 335–336. [Google Scholar] [CrossRef] [Green Version]
  44. Bolger, A.M.; Lohse, M.; Usadel, B. Trimmomatic: A flexible trimmer for Illumina sequence data. Bioinformatics 2014, 30, 2114–2120. [Google Scholar] [CrossRef] [Green Version]
  45. Aronesty, E. Comparison of Sequencing Utility Programs. Open Bioinforma. J. 2013, 7, 1–8. [Google Scholar] [CrossRef]
  46. Quince, C.; Nichols, B.; Rognes, T.; Flouri, T.; Mahé, F. VSEARCH: A versatile open source tool for metagenomics. PeerJ 2016, 4, e2584. [Google Scholar] [CrossRef]
  47. Lozupone, C.; Lladser, M.E.; Knights, D.; Stombaugh, J.; Knight, R. UniFrac: An effective distance metric for microbial community comparison. ISME J. 2011, 5, 169–172. [Google Scholar] [CrossRef] [Green Version]
  48. Wu, H.; Xiong, D.; Xiao, L.; Zhang, S.; Yuan, Y.; Su, Z.; Zhang, B.; Yang, D. Effects of vegetation coverage and seasonal change on soil microbial biomass and community structure in the dry-hot valley region. J. Mt. Sci. 2018, 15, 1546–1558. [Google Scholar] [CrossRef]
  49. Devi, N.B.; Yadava, P.S. Seasonal dynamics in soil microbial biomass C, N and P in a mixed-oak forest ecosystem of Manipur, North-east India. Appl. Soil Ecol. 2006, 31, 220–227. [Google Scholar] [CrossRef]
  50. Price, P.B.; Sowers, T. Temperature dependence of metabolic rates for microbial growth, maintenance, and survival. Proc. Natl. Acad. Sci. USA 2004, 101, 4631–4636. [Google Scholar] [CrossRef] [PubMed] [Green Version]
  51. Regan, K.M.; Nunan, N.; Boeddinghaus, R.S.; Baumgartner, V.; Berner, D.; Boch, S.; Oelmann, Y.; Overmann, J.; Prati, D.; Schloter, M.; et al. Seasonal controls on grassland microbial biogeography: Are they governed by plants, abiotic properties or both? Soil Biol. Biochem. 2014, 71, 21–30. [Google Scholar] [CrossRef]
  52. Rasche, F.; Knapp, D.; Kaiser, C.; Koranda, M.; Kitzler, B.; Zechmeister-Boltenstern, S.; Richter, A.; Sessitsch, A. Seasonality and resource availability control bacterial and archaeal communities in soils of a temperate beech forest. ISME J. 2011, 5, 389–402. [Google Scholar] [CrossRef] [PubMed] [Green Version]
  53. Baldrian, P. Microbial activity and the dynamics of ecosystem processes in forest soils. Curr. Opin. Microbiol. 2017, 37, 128–134. [Google Scholar] [CrossRef]
  54. Lipson, D.A. Relationships between temperature responses and bacterial community structure along seasonal and altitudinal gradients. FEMS Microbiol. Ecol. 2007, 59, 418–427. [Google Scholar] [CrossRef]
  55. Moche, M.; Gutknecht, J.; Schulz, E.; Langer, U.; Rinklebe, J. Monthly dynamics of microbial community structure and their controlling factors in three floodplain soils. Soil Biol. Biochem. 2015, 90, 169–178. [Google Scholar] [CrossRef]
  56. Edwards, K.A.; Jefferies, R.L. Inter-annual and seasonal dynamics of soil microbial biomass and nutrients in wet and dry low-Arctic sedge meadows. Soil Biol. Biochem. 2013, 57, 83–90. [Google Scholar] [CrossRef]
  57. Vořiškova, J.; Brabcová, V.; Cajthaml, T.; Baldrian, P. Seasonal dynamics of fungal communities in a temperate oak forest soil. New Phytol. 2014, 201, 269–278. [Google Scholar] [CrossRef]
  58. Xu, R.; Zhang, K.; Liu, P.; Han, H.; Zhao, S.; Kakade, A.; Khan, A.; Du, D.; Li, X. Lignin depolymerization and utilization by bacteria. Bioresour. Technol. 2018, 269, 557–566. [Google Scholar] [CrossRef]
  59. Landesman, W.J.; Freedman, Z.B.; Nelson, D.M. Seasonal, sub-seasonal and diurnal variation of soil bacterial community composition in a temperate deciduous forest. FEMS Microbiol. Ecol. 2019, 95, fiz002. [Google Scholar] [CrossRef] [Green Version]
  60. Shigyo, N.; Umeki, K.; Hirao, T. Seasonal dynamics of soil fungal and bacterial communities in cool-temperate montane forests. Front. Microbiol. 2019, 10, 1944. [Google Scholar] [CrossRef] [Green Version]
  61. Thomas, F.; Hehemann, J.H.; Rebuffet, E.; Czjzek, M.; Michel, G. Environmental and gut Bacteroidetes: The food connection. Front. Microbiol. 2011, 2, 93. [Google Scholar] [CrossRef] [Green Version]
  62. Uroz, S.; Ioannidis, P.; Lengelle, J.; Cébron, A.; Morin, E.; Buée, M.; Martin, F. Functional assays and metagenomic analyses reveals differences between the microbial communities inhabiting the soil horizons of a Norway spruce plantation. PLoS ONE 2013, 8, e55929. [Google Scholar] [CrossRef]
  63. Gao, G.F.; Li, P.F.; Zhong, J.X.; Shen, Z.J.; Chen, J.; Li, Y.T.; Isabwe, A.; Zhu, X.Y.; Ding, Q.S.; Zhang, S.; et al. Spartina alterniflora invasion alters soil bacterial communities and enhances soil N 2 O emissions by stimulating soil denitrification in mangrove wetland. Sci. Total Environ. 2019, 653, 231–240. [Google Scholar] [CrossRef]
  64. Taubert, M.; Stähly, J.; Kolb, S.; Küsel, K. Divergent microbial communities in groundwater and overlying soils exhibit functional redundancy for plant-polysaccharide degradation. PLoS ONE 2019, 14, e0212937. [Google Scholar] [CrossRef] [PubMed] [Green Version]
  65. Siles, J.A.; Margesin, R. Insights into microbial communities mediating the bioremediation of hydrocarbon-contaminated soil from an Alpine former military site. Appl. Microbiol. Biotechnol. 2018, 102, 4409–4421. [Google Scholar] [CrossRef] [PubMed] [Green Version]
  66. Crowe, M.A.; Power, J.F.; Morgan, X.C.; Dunfield, P.F.; Lagutin, K.; Rijpstra, W.I.C.; Rijpstra, I.C.; Sinninghe Damste, J.S.; Houghton, K.M.; Ryan, J.L.J.; et al. Pyrinomonas methylaliphatogenes gen. nov., sp. nov., a novel group 4 thermophilic member of the phylum Acidobacteria from geothermal soils. Int. J. Syst. Evol. Microbiol. 2014, 64, 220–227. [Google Scholar] [CrossRef] [PubMed] [Green Version]
  67. Tank, M.; Bryant, D.A. Chloracidobacterium thermophilum gen. nov., sp. nov.: An anoxygenic microaerophilic chlorophotoheterotrophic acidobacterium. Int. J. Syst. Evol. Microbiol. 2015, 65, 1426–1430. [Google Scholar] [CrossRef] [PubMed] [Green Version]
  68. Kant, R.; van Passe, M.W.J.; Palva, A.; Lucas, S.; Lapidus, A.; del Rio, T.G.; Dalin, E.; Tice, H.; Bruce, D.; Goodwin, L.; et al. Genome sequence of Chthoniobacter flavus Ellin428, an aerobic heterotrophic soil bacterium. J. Bacteriol. 2011, 193, 2902–2903. [Google Scholar] [CrossRef] [Green Version]
  69. Okazaki, K.; Iino, T.; Kuroda, Y.; Taguchi, K.; Takahashi, H.; Ohwada, T.; Tsurumaru, H.; Okubo, T.; Minamisawa, K.; Ikeda, S. An assessment of the diversity of culturable bacteria from main root of sugar beet. Microbes Environ. 2014, 29, 220–223. [Google Scholar] [CrossRef] [Green Version]
  70. Semenov, M.V.; Chernov, T.I.; Tkhakakhova, A.K.; Zhelezova, A.D.; Ivanova, E.A.; Kolganova, T.V.; Kutovaya, O.V. Distribution of prokaryotic communities throughout the Chernozem profiles under different land uses for over a century. Appl. Soil Ecol. 2018, 127, 8–18. [Google Scholar] [CrossRef]
  71. Chernov, T.I.; Zhelezova, A.D.; Kutovaya, O.V.; Makeev, A.O.; Tkhakakhova, A.K.; Bgazhba, N.A.; Kurbanova, F.G.; Rusakov, A.V.; Puzanova, T.A.; Khokhlova, O.S. Comparative Analysis of the Structure of Buried and Surface Soils by Analysis of Microbial DNA. Microbiol. Russ. Fed. 2018, 87, 833–841. [Google Scholar] [CrossRef]
  72. Zhang, B.; Wu, X.; Zhang, G.; Li, S.; Zhang, W.; Chen, X.; Sun, L.; Zhang, B.; Liu, G.; Chen, T. The diversity and biogeography of the communities of Actinobacteria in the forelands of glaciers at a continental scale. Environ. Res. Lett. 2016, 11, 054012. [Google Scholar] [CrossRef]
  73. Ji, M.; van Dorst, J.; Bissett, A.; Brown, M.V.; Palmer, A.S.; Snape, I.; Siciliano, S.D.; Ferrari, B.C. Microbial diversity at Mitchell Peninsula, Eastern Antarctica: A potential biodiversity “hotspot”. Polar Biol. 2016, 39, 237–249. [Google Scholar] [CrossRef]
  74. Fricke, W.; Barnum, T.; Davila, A.F.; Robinson, C.K.; DiRuggiero, J.; Jedynak, B.; McKay, C.P.; Crits-Christoph, A. Colonization patterns of soil microbial communities in the Atacama Desert. Microbiome 2013, 1, 28. [Google Scholar] [CrossRef] [Green Version]
  75. Houfani, A.A.; Větrovský, T.; Navarrete, O.U.; Štursová, M.; Tláskal, V.; Beiko, R.G.; Boucherba, N.; Baldrian, P.; Benallaoua, S.; Jorquera, M.A. Cellulase−Hemicellulase Activities and Bacterial Community Composition of Different Soils from Algerian Ecosystems. Microb. Ecol. 2019, 77, 713–725. [Google Scholar] [CrossRef] [PubMed]
  76. Hu, D.; Zang, Y.; Mao, Y.; Gao, B. Identification of Molecular Markers That Are Specific to the Class Thermoleophilia. Front. Microbiol. 2019, 10, 1185. [Google Scholar] [CrossRef] [PubMed]
  77. Preece, C.; Verbruggen, E.; Liu, L.; Weedon, J.T.; Peñuelas, J. Effects of past and current drought on the composition and diversity of soil microbial communities. Soil Biol. Biochem. 2019, 131, 28–39. [Google Scholar] [CrossRef]
  78. Schlatter, D.C.; Reardon, C.L.; Johnson-Maynard, J.; Brooks, E.; Kahl, K.; Norby, J.; Huggins, D.; Paulitz, T.C. Mining the Drilosphere: Bacterial Communities and Denitrifier Abundance in a No-Till Wheat Cropping System. Front. Microbiol. 2019, 10, 1339. [Google Scholar] [CrossRef] [Green Version]
  79. Lipson, D.A.; Schmidt, S.K. Seasonal changes in an alpine soil bacterial community in the Colorado Rocky Mountains. Appl. Environ. Microbiol. 2004, 70, 2867–2879. [Google Scholar] [CrossRef] [Green Version]
  80. Žifčáková, L.; Větrovský, T.; Lombard, V.; Henrissat, B.; Howe, A.; Baldrian, P. Feed in summer, rest in winter: Microbial carbon utilization in forest topsoil. Microbiome 2017, 5, 122. [Google Scholar] [CrossRef] [Green Version]
Figure 1. Weather and soil conditions during the study period. The sampling depth for upper organic horizon is 10 cm, the sampling depth for lower mineral horizon is 55 cm.
Agronomy 12 00519 g001
Figure 2. Seasonal dynamics of DNA yields. the sampling depth for upper organic horizon is 10 cm, the sampling depth for lower mineral horizon is 55 cm.
Agronomy 12 00519 g002
Figure 3. Seasonal dynamics of bacterial and archaeal 16S gene (DNA) and gene transcript (cDNA) copy numbers in soil (10 cm is the sampling depth for upper organic horizon, 55 cm is the sampling depth for lower mineral horizon).
Agronomy 12 00519 g003
Figure 4. Relative abundances of different classes in total bacterial communities of the upper organic soil horizon throughout the season.
Agronomy 12 00519 g004
Figure 5. Relative abundances of different classes in active bacterial communities of the upper organic soil horizon throughout the season.
Agronomy 12 00519 g005
Figure 6. Non-metric multidimensional scaling plots of total (A) and active (B) soil bacterial community patterns in different sampling times using UniFrac (10 cm is the sampling depth for upper organic horizon, 55 cm is the sampling depth for lower mineral horizon).
Agronomy 12 00519 g006
Publisher’s Note: MDPI stays neutral with regard to jurisdictional claims in published maps and institutional affiliations.

