Article

Wheat Nutrient Management Strategies to Increase Productivity, Profitability and Quality on Sandy Loam Soils

1
Department of Agronomy, Sardar Vallabhbhai Patel University of Agriculture & Technology, Meerut 250110, India
2
PAU-Regional Research Station, Kapurthala 144601, India
3
Department of Agronomy, Bihar Agricultural University, Sabour 813210, India
4
Prince Sultan Bin Abdulaziz International Prize for Water Chair, Prince Sultan Institute for Environmental, Water and Desert Research, King Saud University, Riyadh 11451, Saudi Arabia
5
Department of Agricultural Engineering, College of Food and Agriculture Sciences, King Saud University, Riyadh 11451, Saudi Arabia
6
Centre for Carbon, Water and Food, The University of Sydney, Camperdown, NSW 2570, Australia
*
Authors to whom correspondence should be addressed.
Agronomy 2022, 12(11), 2807; https://doi.org/10.3390/agronomy12112807
Submission received: 15 September 2022 / Revised: 13 October 2022 / Accepted: 15 October 2022 / Published: 10 November 2022

Abstract

:
By 2050, the population of the world is anticipated to increase from 7.7 billion to 9.7 billion people, and, and wheat is expected to continue to play a vital role in ensuring food security globally. It is the main diet for 40% of the world’s population and supplies food for more than 4.5 billion people in 94 countries contains 21% of the joules and 20% of the protein. The present investigations were carried out during rabi 2017–2018 and 2018–2019 to determine how optimal nutrient management (INM) practices enhance fertilizer usage efficiency, productivity, soil health, and viability in wheat (Variety DBW 71) through innovative nutritional sources and their modes of application methods. The treatments comprised of, viz., control, basal applications of recommended NPK (80:60:40)/NPK granules (200 kg/ha) + FYM (5 t ha−1) + bio-stimulant granules (62.5 kg/ha), +NPK bio-fertilizer (seed treatment), along with a top dressing of urea (20 kg/ha)/bio-stimulant (625 mL ha−1)/NPK Powder (1%) sprays (40/55/70 DAS), which had triplicated randomized block design (RBD) at the crop research farm of SVPUA&T, Meerut (U.P.). The results revealed that wheat grown with incorporation of FYM and bio-stimulant –L attained significantly better growth and higher dry matter accumulation across the stages. The crop contained 1.63% N, 0.31% P, 0.69% K in grain, and 0.57% N, 0.11% P and 1.34% K in straw. Such crops exhibited agronomic, physiological, and apparent recovery efficiency of NPK of the order of 3.2 kg kg−1 of nutrient applied, 14.0 kg kg−1 of nutrient uptake, and 0.23% against recommended NPK. Applications of FYM, NPK bio-fertilizer+ urea, and bio-stimulant + NPK sprays worked synergistically and increased grain yields by 29.8, 35.2, 50.3 and 41.1% over their respective controls. The results also indicated that soil organic carbon (0.47%), available NPK (227.0, 27.7, 172.1 kg/ha), dehydrogenase activity, and microbial population (bacteria, fungal and actinomycetes) in soil was also highest with the treatment. Finally, the wheat crop required an investment of Rs ha−1 131,453 and fetched a net reoccurrence of Rs. 96,154, with benefits of Rs. 3.72 over cost, respectively. Therefore, the study reveals that integrated nutrient management, viz., FYM 5 t ha−1 +NPK (12–32–16) -G @ 200 kg/ha + NPK bio-fertilizer (seed treatment) + urea @ 20 kg/ha, foliar application NPK (18−18−18) -P@ 1% and bio-stimulant –L 0.62 L ha−1 improved the better growth, productivity, soil health and profitability of wheat crops. Finally, to boost production, the region must emphasize the wheat crop’s part in integrated nutrition management with foliar application of bio-stimulants. Furthermore, these investigations must be reinvestigated at different sites with different agro-climatic conditions and texturally divergent soils.

1. Introduction

Wheat (Triticum aestivum L.) provides 21% of the food’s joules and 20% of its protein; more than two-thirds of global wheat is used for staple food and one fifth is used for livestock feed. The area planted with wheat on a global and national scale is 215.48 and 29.65 million ha, and produces 731.4 and 99.9 million metric tonnes, respectively, with an average productivity of 3390 and 3371 kg/ha. On a dry-weight basis, wheat germ contains 10.8% of it is water, 26.5% is crude protein, 8.56% is crude fat, and 4.18% is ash [1]. Furthermore to such vital nutrients, wheat germ contains significant amounts of bio- active compounds, like as tocopherols, phytosterols, policosanols, carotenoids, thiamin, and riboflavin, which are present in amounts of 300–740 mg per kg, 24–50 mg per kg, 10 mg per kg, 4–18 mg per kg, 15–23 mg per kg, and 6–10 mg per kg, respectively. With a projected population by 2050, population will rise from 7.7 billion to 9.7 billion respectively [2], wheat will likely continue to perform a significant contribution in ensuring food security worldwide. About 9.6 million ha (36.6% of the total area), 26.9 million tonnes (39.3% of the total production), and 2785 kg/ha (the productivity), Uttar Pradesh state-country is the leading producer of wheat [3]. However, low nutrient-use efficiency (NUE) is a key concern while designing and evaluating various wheat-based crop production systems, which could greatly impact fertilizer, soil and water management to maximize production and minimize nutrient losses [4]. The widespread application of chemical fertilizer without adding organic manures for the past 50 years has resulted in a substantial deficiency in micronutrients. However, organic manure application as a renewable plant nutrition source is gaining popularity, since integrated nutrient management is crucial for boosting output and maintaining soil health [5,6]. Among the different benefits of farm manure are soil permeability improvements [7], improved soil organic carbon and its stocks, enzymatic activities and enhanced soil fertility [8]. Additionally, the use of wood-derived biochar is significant because it enhances water retention, nutrient management, and appears to be a highly effective method for recycling nutrients [9]. In recent developments, nano-materials evidenced a wide range of chemical–physical properties, as well as distinct biological properties, and silica especially plays a crucial part in fostering aversion to against stresses, both biotic and abiotic, particularly in plants, and its utilisation in crop fields is astoundingly rising to increase cultivation of crops [10].
Wheat productivity might potentially be increased by using bio-fertilizers such as Azotobacter and Azospirillum individually or in combination, as well as the biostimulant Z++ [11,12]. Farmers use chemical fertilizers to boost wheat production and address nutrient deficiencies, but doing so raises cultivation expenses and has negative environmental effects, including global warming. Hence, the scope of INM increased by manifolds, but their impact on the effectiveness of fertiliser use and soil health is still to be investigated in the region. Due to these considerations, the present investigation conducted at SVPUA&T in Meerut, U.P., to evaluate the impact of INM on enhancing the overall sustainability of wheat in the region, with the goals of defining (i) the impact of INM strategies on wheat growth, yield characteristics, yield, and quality; (ii) the impact of INM on soil health; and (iii) the viability of wheat grown using various nutrient management strategies economically.

Research Hypothesis

“Do integrated nutrient management approaches improve grain quality, soil health and microbial activities for better livelihoods?”

2. Materials and Methods

2.1. Selected Site for the Experiment

Using 12 m2 plots, this triplicated RBD-designed investigation was carried out at the experiment farm of Sardar Vallabhbhai Patel University of Agriculture and Technology’s experimental fields in Meerut, Uttar Pradesh, which are situated 237 m above mean sea level and at latitude 290 40′ N and longitude 770 42′ E. Detailed experimental layout is shown in Figure 1.

2.2. Climate and Weather

Daily observations throughout the investigation on temperature, humidity, sunshine hours, rainfall, pan evaporation, and wind velocity were recorded at the meteorological observatory near the site. During the experimental period from 2017–2018 and 2018–2019, mean weekly minimum temperature varied from 4.8 °C in the 3rd week of January to 19.6 °C in the 4th week of April during 2017–2018. The crop experienced the lowest (4.8 °C) mean weekly minimum temperature in the 2nd week of January and highest (38.2 °C) in the 4rd week of April during 2017–2018 (Figure 2A). The mean weekly maximum temperature was recorded to be highest (38.2) in the 4th week of April and lowest (15.60 °C) in the 1st week of January during 2017–2018. The 1st week of January and 3rd week of January were the most humid (95.7% and 96.7%) during 2017–2018 and 2018–2019, respectively; however, the driest (30.3% and 34.1%) crop season was the 3rd and 4th week of April during both years. Accordingly, the evaporation demand of the atmosphere during 2018–2019 was maximum (86.5 mm) during the last week of April and minimum (1.3 mm) during the 1st week of January (Figure 2B), while during 2017–2018 the respective value was 81 mm and 6.9 mm. The crop received 20.2 mm of rain during 2017–2018 (Figure 2A) and 100.9 mm during 2018–2019 (Figure 2B).

2.3. Soil of the Experiment Field

Before planting a wheat crop in the experimental field, the soil was sampled from ten distinct places taken at 0 to 15 cm. The samples were then uniformly mixed, and a sample of the resulting soil was air-dried, ground, and the material is permitted to pass through a 2 mm sieve before being tested for its physical, chemical, and biological qualities. At the experimental site, the soil holds a sandy loam in texture that had a low in readily accessible both organic carbon and nitrogen, medium in readily available phosphorus and potassium, and alkaline through response.

2.4. Treatments

The current experiment treatments included nutrient management practices using inorganic and organic sources, bio-fertilizer, and bio-stimulants along with their mode of application as: T1, control; T2, suggested NPK; T3, FYM @ 5t ha−1 + suggested NPK; T4, suggested NPK + bio-stimulant-G @ 25 kg/acre; T5, suggested NPK + bio-stimulant-L @ 625 mL ha−1 foliar application at 40, 55 and 70 DAS; T6, suggested NPK + NPK-P 1% foliar spray at 70 DAS + bio-stimulant-L @ 625 mL ha−1 foliar spray at 70 DAS; T7, FYM @ 5 t ha−1+ suggested NPK + bio-stimulant-G 25 kg/acre; T8, FYM @ 5 t ha−1 + NPK-G @ 200 kg/ha +NPK bio-fertilizer + urea @ 20 kg/ha each at 40 and 55 DAS; T10, FYM @ 5 t ha−1 + NPK-G @ 200 kg/ha + NPK bio-fertilizer + urea @ 20 kg/ha at 40 DAS + NPK-P @ 1% foliar spray at 55 and 70 DAS; T11, FYM @ 5 t ha−1 + NPK-G @ 200 kg/ha + NPK bio-fertilizer + NPK-P @ 1% foliar spray at 40, 55 and 70 DAS; T12, FYM @ 5 t ha−1 + NPK 200 kg/ha + NPK bio-fertilizer + urea @ 20 kg/ha each as basal and 40 DAS + bio-stimulant-L @ 625 mL ha−1 foliar spray each at 55 and 70 DAS; T13, FYM @ 5 t ha−1 + NPK-G @ 200 kg/ha + NPK bio-fertilizer + NPK-P @ 1% foliar spray at 40, 55 and 70 DAS + bio-stimulant-L @ 625 mL ha−1 foliar spray each at 40, 55 and 70 DAS; T14, FYM at 5 t ha−1 and NPK-G at 200 kg/ha and NPK biofertilizer, as well as urea at 20 kg/ha at 40 DAS and NPK-P at 1% foliar spray at 55 and 70 DAS with bio-stimulant-L at 625 mL ha−1 foliar spray each at 55 and 70 DAS. The conditions of the experiment are clearly depicted in Table 1.

2.5. Intercultural Operations

Certified seed of wheat variety DBW-71, provided by the University, was used for sowing. Weed infestation was checked through the post-emergence application of sulfosulfuron + metsulfuron @ 32 g a.i. ha−1 in 800 L of water over 28 DAS during both years. Plant-protection measures were not applied because none of the disease or pest infestations crossed the ETL. To guarantee that the soil profile would be sufficiently moist before wheat was planted, a irrigation prior to sowing application of 5 cm was made in the field. Planking was used after a soil-turning plough to plough the test field. In order to achieve a good tillage, dried unwanted plants and stubbles were pulled, and the field was then cultivator-plowed once more.
At 20 DAS, each plot had a meter scale placed at three random locations to count the number of plants per row length in meters. To determine how the treatments affected crop growth, measurements of plant height, the tiller count, and accumulation of dry matter were made at 30, 60, and 90 days after sowing, as well as at harvest. In each net plot, five plants were chosen at random and tagged. The height of each plant, measured from the ground’s surface to the tips of its fully expanded leaves, was then recorded in centimetres. To express plant height in centimeters, the heights of all five plants were added together and averaged. Utilizing 0.25 m−2 row length from three locations within each plot, the number of tillers was counted, and the average of the three locations was used for analysis. Three plants based on randomly selected places in each plot were taken from each plot’s 50 cm row length and were chopped off just above the ground from the sampling area and dried in an oven for 5–6 days. Before being dried in an 700 °C oven, samples were first sun-dried to obtain constant weight. The samples were dried before being weighed to determine their dry weight. Physiological parameters were calculated using the information based on the dry weight of different plants sections and the leaf area measured at different stages of growth. The dry weight of various plant sections, LAI measurements taken at 30, 60, and 90 days and at harvest, and estimates of CGR, LAD, NAR, and RGR taken at 30, 60, 90, and 90 days after sowing were all used to calculate various physiological parameters. To calculate the harvest index, the biological yield to economic yield (grain yield) ratio was used [13].

2.6. Nutrient Contents and Uptake by Crop

After the wheat crop was harvested and threshed, the seed and straw samples from each treatment were collected, and allowed to dry in the sun. With the help of a Wiley Mill grinder and a di-acid mixture of HNO3: HClO4 (3:1), the nutritional content of grain and straw samples from wheat plants was determined separately for each treatment. Total nitrogen was then estimated using the micro-Kjeldahl method, vanadomolybdo-phosphoric acid yellow color, and flame photometer, respectively. The nitrogen content percentage is multiplied by the value of 5.73; the protein content of wheat grain was calculated [14]. Protein yield was computed by multiplying the rate of protein in wheat seed by the corresponding seed yields, then dividing by 100.
According to [15], using the dilution plate method and Martin’s rose bengal agar medium, the presence of bacteria, fungi, and actinomycetes was identified as well as Ken Knight’s and Ken Knight’s agar media, respectively. Microbial biomass carbon (µg g−1) in soil was determined in terms of biomass carbon following the method of [16]. Further, microbial biomass nitrogen (µg g−1) was determined by strong acidic conditions by Kjeldahl digestion, and the ammonium was measured by distillation. By using the triphenyl tetrazolium chloride (TTC) and calcium carbonate technique [17], dehydrogenase activity in soil was calculated and reported in terms of mg triphenyl formazan (TPF) generated h−1 g−1 of air-dry soil.
The following equation was used to compute the agronomic use-efficiency (AE), which is represented as kg grain increase per kg of any specific applied nutrient:
A E = Y y Y 0 A t
where Yy stands for the tested yield (kg/ha), Y0 is controlled yield (kg/ha), and At is nutrients used in test treatment units (kg/ha).
The following equation was used to determine the physiological efficiency (PE) of the administered nutrient:
P E = Y t Y 0 U t U 0
where Yt stands for tested yield (kg/ha), Y0 is controlled yield control (kg/ha), Ut stands for nutrition uptake during test therapy (g ha−1), and U0 is controlled nutrient uptake (g ha−1).
The equation below was used to compute the apparent recovery efficiency (ARE) of applied nutrients, which was then expressed in percentage terms:
A R E = N t N 0 N a × 100
where Nt is the amount of nutrient extracted from the test treatment plot (kg/ha), N0 is the amount of nutrient taken from the control plot (kg/ha), and Na is the amount of nutrient added (kg/ha).

2.7. Geometric Scrutiny

According to [18], statistical evaluation of the experimental information gathered throughout the investigation was performed in randomized block design using the analysis of variance (ANOVA) technique. When the F- Test indicated that the difference between the treatment means was significant, the significance of the mean and the interaction effect was computed to assess the importance of the difference.

3. Results

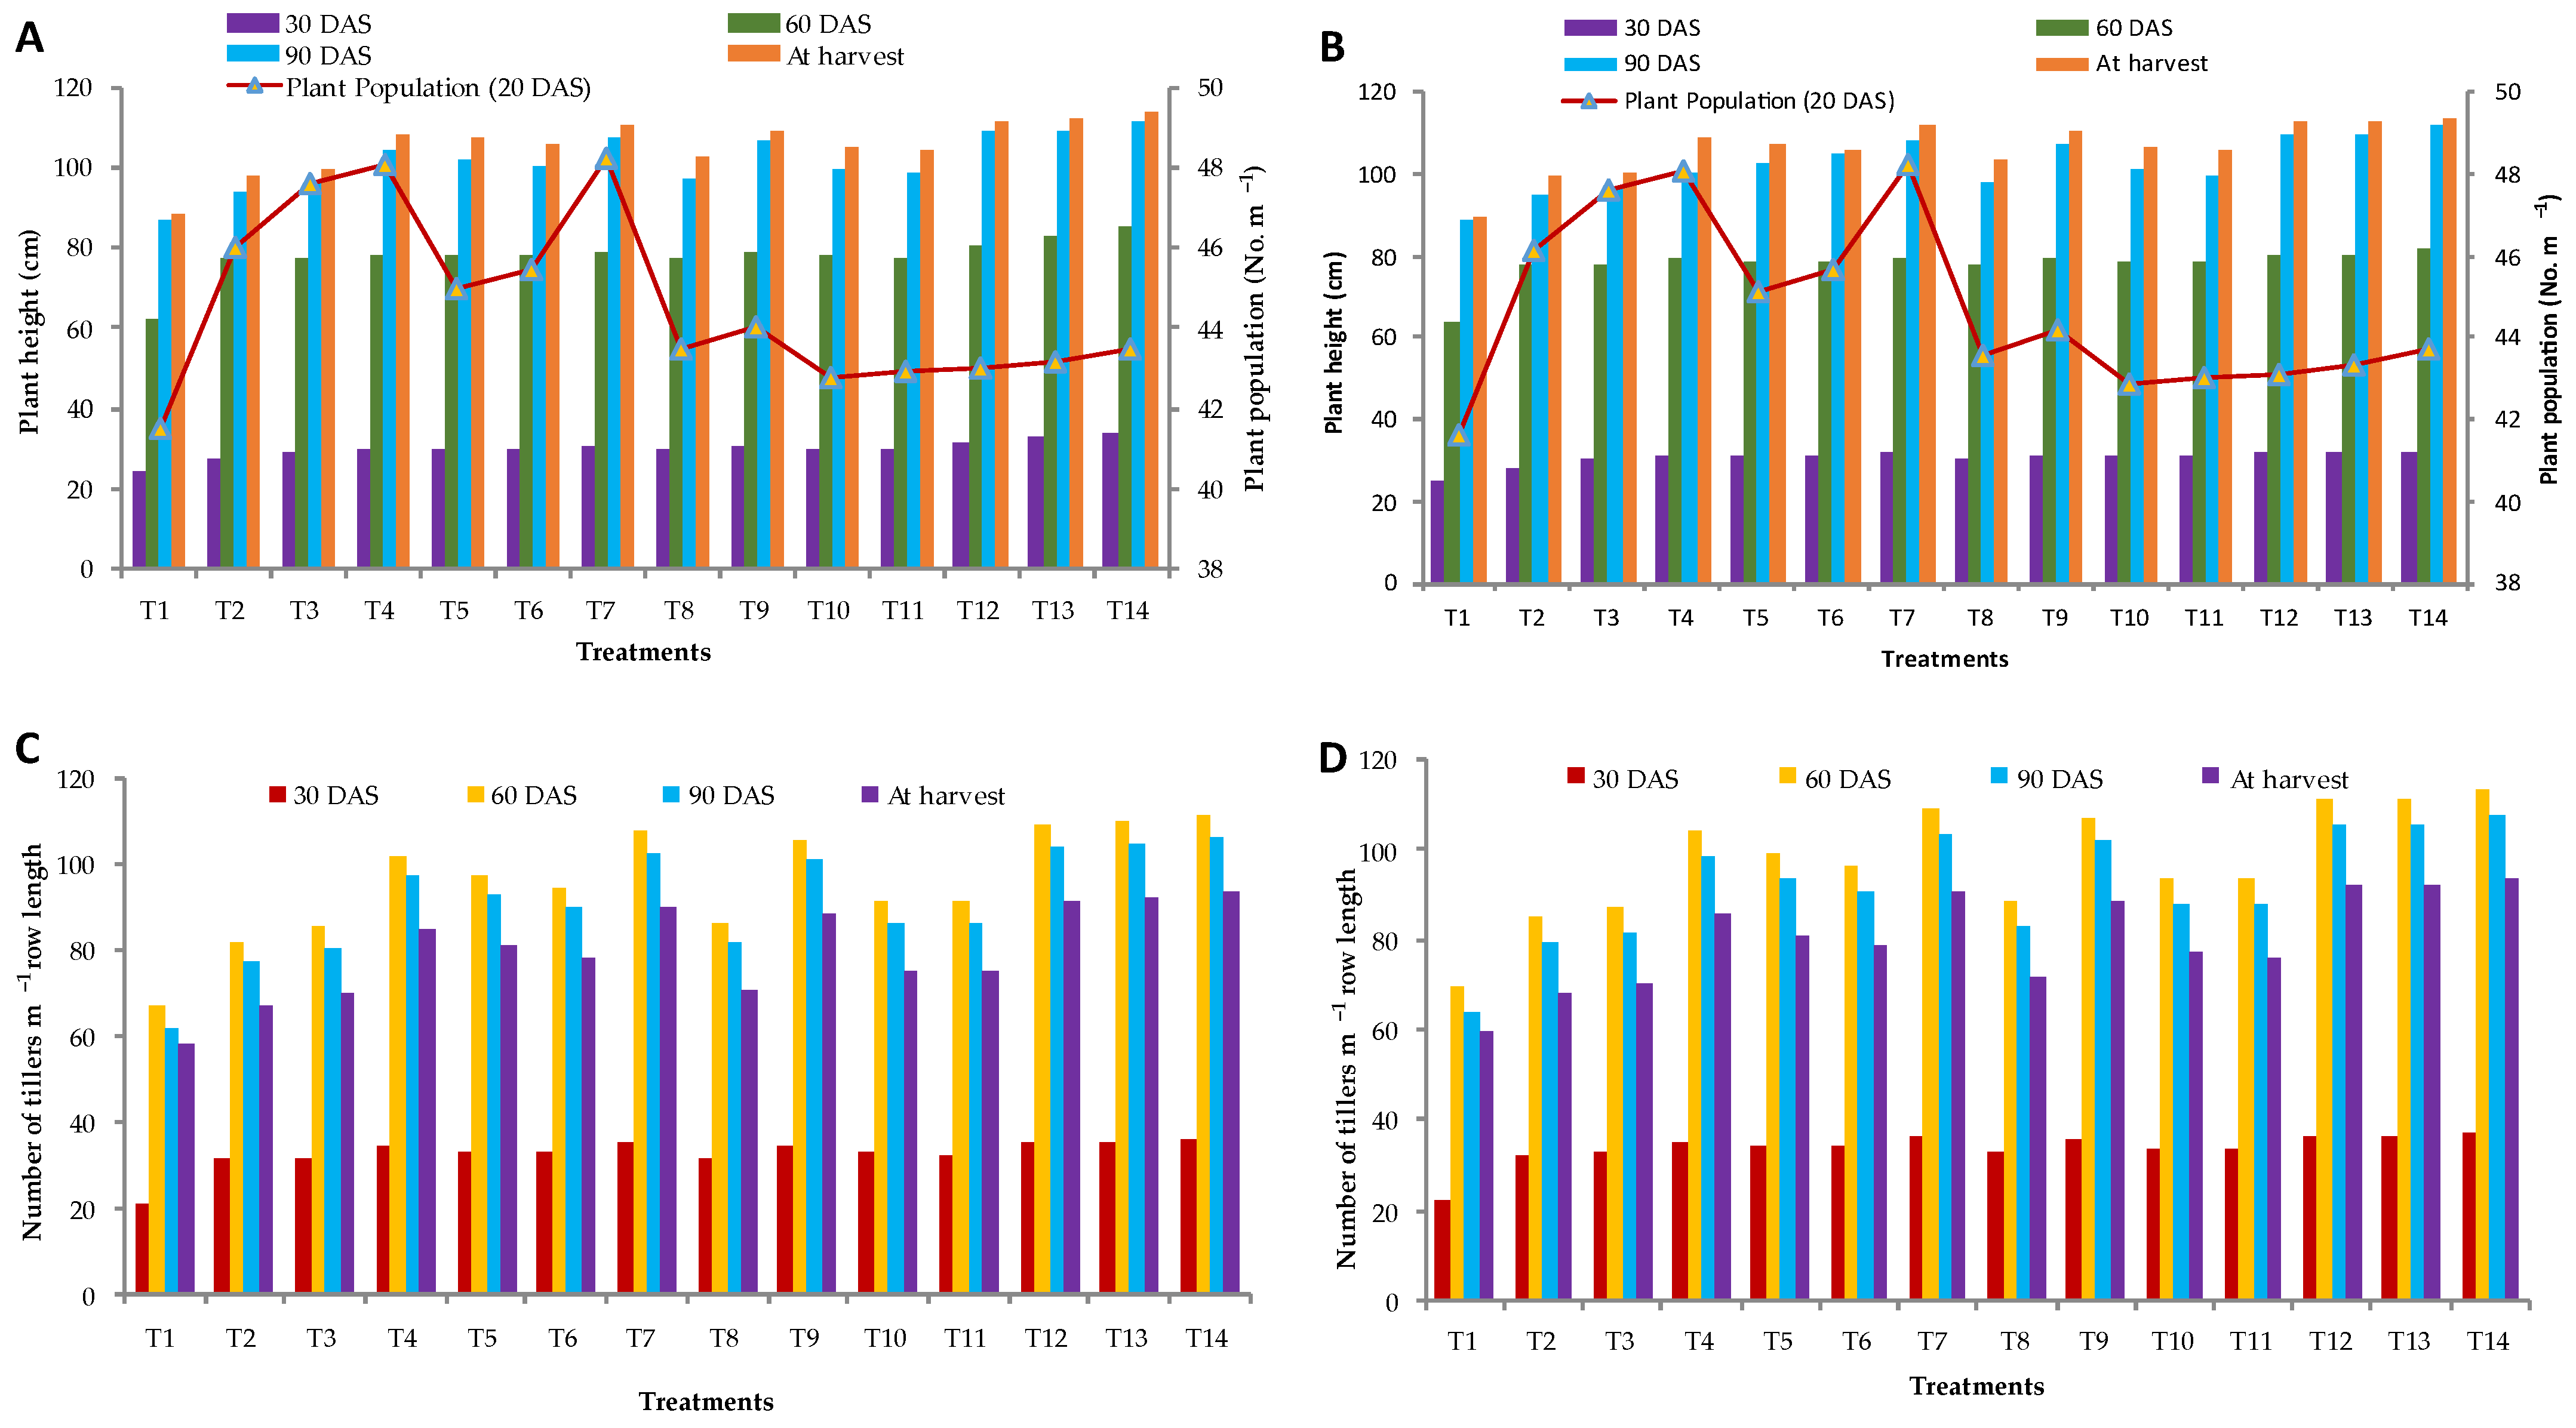
3.1. Wheat Growth Parameters

Around 40% of the world’s population eats wheat (Triticum aestivum L.), which feeds more than 4.5 billion people in 94 countries and supplies 21% of the food’s joules and 20% of its protein.. Hence, to improve its productivity is important. In the current INM study, observations showed that crops receiving nutrients from external sources had a higher population of wheat plants than control plots, irrespective of the treatments throughout the investigation. These effects, however, were not noteworthy. Upon further examination of the data, it was discovered that the number of plants per square meter varied from 41.5 in crops that received no nutrients to 48.2 in INM plots during 2017–2018. Such variation was 41.6 plants m−1 to 48.2 plants m−1 during 2018–2019 (Figure 3). Plant height varied significantly under different nutrient management practices at all stages of growth throughout the investigation. Plant height increased with crop age advancement up to harvest. However, the increment rate was highest between 60 and 90 DAS throughout the investigation (Figure 3). Wheat plants grown in control plots were shorter when compared to different nutrient management treatments. At the 30-day stage, taller plants of wheat (34.2 and 32.2 cm) were measured with the application of nutrient management under T-14, which, in the first year of the study, was comparable to T-13 and T-12 and, in the second year, was vastly superior to the other treatments., where all the treatments were at par with each other except control and suggested NPK (Figure 3). At the 60-day stage, the plant’s maximum height (85.3 cm and 81.6 cm) was obtained with the T-14 treatment, which was much better than the other treatments. During both years, with the exception of control plots, all treatment variations in plant height were comparable. Plant height was higher than authorized NPK at harvest in 2017–2018 (18.2%) and 2018–2019 (17.8%). However, only T-14-based applications at all phases during the two years showed a considerable rise. At all growth phases, nearly the same tendency was seen. The control plots produced shorter plants at all growth phases and significantly reduced plant height (Figure 3).
In both years, the management of nutrients significantly impacted all phases of wheat growth. The number of tillers declined at 30 DAS, amplified at 60 DAS, and then further declined again at 90 DAS till harvest. With the use of various nutrient management strategies over the course of the two years, there were considerable variations in the number of tillers per meter of wheat row length at different stages. The number of tillers/meter row length varied from 21.1 to 35.7 and 22.3 to 36.9, 66.9 to 111.2 and 69.3 to 113.0, and 58.4 to 93.4 and 59.5 to 93.8 during both respective years at 30 and 60 DAS and at harvest (Figure 3). T-14 had the most tillers per meter of row length at 30, 60, and 90 DAS, as well as throughout harvest in each of the years. A considerably higher number of tillers were produced in treatment T-14 than in treatments where FYM was not supplied at comparable nutrition levels at 30, 60, and 90 days and harvest. Additionally, the use of bio-stimulant-G + suggested NPK did have a discernible impact on the Treatment T-4 had a tiller count per meter of row length that was statistical significant equivalent to treatments T-5 and T-6, but significantly less effective than the T-1 and T-2 treatments over the course of both years. Compared to the T-8 treatment, the T-14 treatment produced statistically more tillers per meter of row length. In comparison to the other treatments, the control plot had the fewest tillers per meter of row length during both years’ worth of growth (Figure 4).

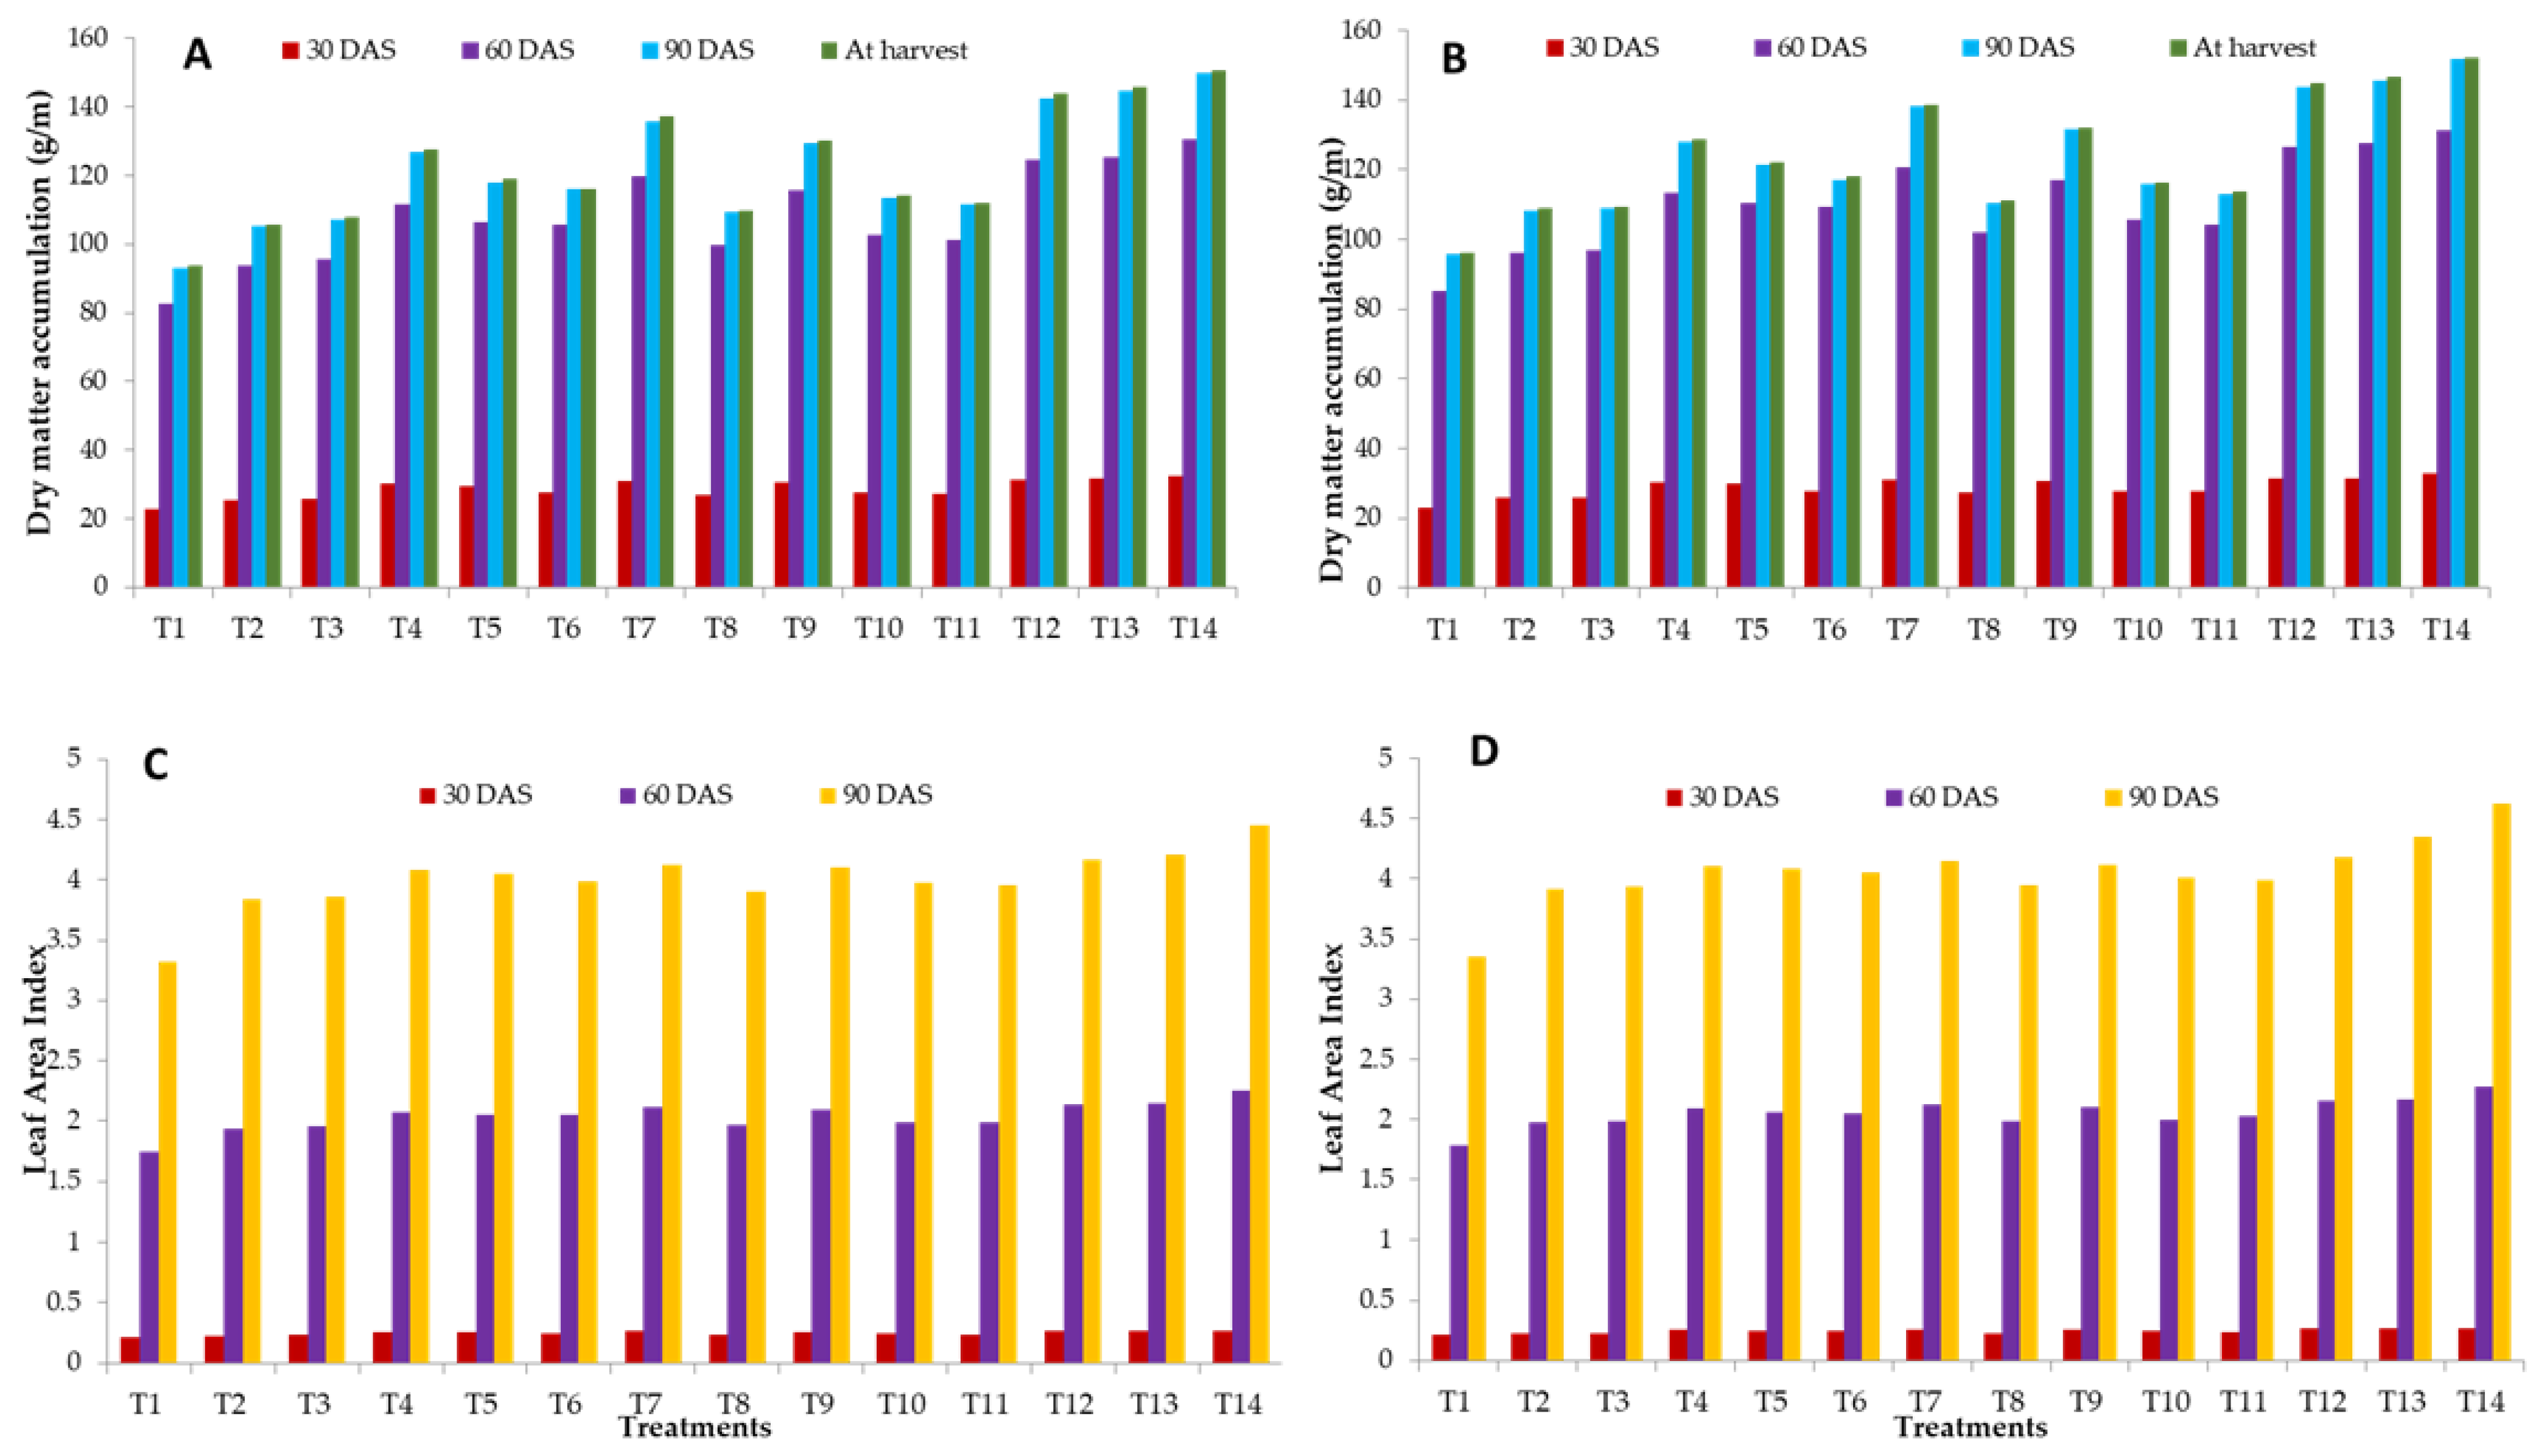
3.2. Accretion of Dry Mass

Regardless of the treatment, dry matter accumulation increased steadily with crop age. Different INM techniques significantly a higher plant dry matter content than the control, but with age, the rate of increase slowed and was lowest found after the 3-month stage (Figure 5). In comparison to suggested NPK, T-14 plots resulted in most substantial buildup of dry matter @ 42.8% (2017–2018) and 39.8% (2018–2019) at harvest, while it remained at par maximum dry matter accumulation under T-14 observed at 30 DAS, and it was statistically comparable to T-4, T-7, T-9, T-12, and T-13 throughout the two years. Nutrient management practice of T-14 resulted in significantly higher dry matter accumulation, which was at par with T-7, T-12, and T-13, while they were significantly higher than control at 60 DAS during 2017–2018 and 2018–2019, respectively. Minimum dry matter accumulation was recorded in control plots at 30, 60, and 90 DAS and harvest during both years (Figure 5).

3.3. Leaf Area Index (LAI)

LAI tended to increase as improvements in crop age upto the 3-month stage throughout the experimentation period (Figure 5). Although the difference was substantial at all stages during the two years, treatments receiving nutrients had greater leaf area indexes than controls. Between nutrient management practices, the greatest value of LAI was seen in T-14. It was statistically similar in T-13, T-12, T-10,T-9, T-7, T-6, T-5, and T-4, which produced a significantly higher mean leaf area index of 0.27 and 2.26 at 30 and 60 days after sowing, except for treatment T-10 at 60 DAS in the second year of investigation, during both years. The 90 DAS crop under T-14 treatment was statistically similar to treatments T-13, T-12, T-9, T-7, T-5, and T-4 during the first-year investigation, and treatment T-13 during the second-year investigation. Leaf area index as compared to T-1 plots improved in T-13 and T-14 plots to 28.6% in 2017–2018, and to 22.9 and 28.6% at 60 DAS to 26.8 and 34.0% at 90 DAS, respectively. However, LAI improved to 28.6% in T-13 and T-14 plots, as compared to T-1 plots during 30 DAS, which further improved to 21.9 and 27.5% at 60 DAS and 29.9 and 38.2% at 90 DAS, respectively, during 2018–2019 (Figure 5). Additionally, suggested NPK considerably increased leaf area index compared to control treatments. At all stages of the crop, the control plot had the lowest leaf area index (Figure 5).

3.4. Leaf Area Duration

The duration of leaf area increased with crop growth up to the 90-day stage, as given in Table 1 during the investigation period. Treatments receiving nutrients had higher leaf area duration in comparison to control. Among different treatments, T-14 resulted in a higher value of leaf area duration, which was at par with T13, T-12, T-9, T-7, T-6, T-5, and T-4, and produced significantly higher mean leaf area duration in the range of 38.0 and 102 at 30–60 and 60–90 DAS, respectively, throughout the experiment, while treatments T-4, T-5 and T-9 were not at par in the second-year investigation at 60–90 DAS than those grown with other nutrient management practices. Leaf area duration, as compared to the T-1 plot, improved in the T-13 and T-14 plots to 23.8 and 29.2% in 2017–2018 to 22.6 and 27.8% in 2018–2019, respectively, at 30–60 DAS, while these increments shifted to 25.7 and 32.4% in 2017–2018 to 27.2 and 34.7% at 60–90 DAS in 2018–2019 in the T-13 and T-14 plots as compared to the T-1 plot, respectively (Table 2). However, it was inferior to the treatments where FYM @ 5 t ha−1 + suggested NPK or bio-stimulant-G combined with NPK-G and urea, foliar spray of NPK-P, or bio-stimulant -L were applied over both years. The suggested NPK produced considerably higher leaf area duration as compared to the control. At all phases of the crop, the control plot had the lowest leaf area duration (Table 2).

3.5. Crop Growth Rate (CGR) g m−2 day−1

At all the critical phases during both years, various nutrient management techniques considerably impacted crop growth rate (CGR). According to observations, the CGR peaked at 30 and 60 days before harvest, reached its lowest point between 90 DAS and harvest, and then steadily decreased until crop maturity (Table 2). Wheat plants cultivated using nutrient management techniques considerably outperformed controls at all stages over the course of the two experiment years. Crops fed with T-14 registered the highest CGR at 30 to 60 DAS (3.27 and 3.28 g m−2 day−1), 60 to 90 DAS (0.64 and 0.68 g m−2 day−1), and 90 days until harvest (0.05 and 0.04 g m−2 day−1) and was at par with T-13 and T-12 treatments, respectively, at 60 to 90 DAS during 2016–17 only, and superior to other treatments over both years (Table 2). At all phases, the suggested NPK (T-2) reported higher CGR compared to the control and lower CGR compared to the other treatments. In the control plot during the course of two years, the lowest CGR value was noted.

3.6. Relative Growth Rate (RGR) g g−1 day−1

RGR attained maximum value between the 30–60 days stage and then declined consistently until crop maturity during the course of study. According to observations, the RGR peaked in both years between 30 and 60 days (Table 3). At 30–60 and 60–90 DAS for wheat crops fertilized with T-14 in both years, the maximum RGR was reported; however, at 90 DAS until harvest, the highest RGR of 0.0003 g g−1 d−1 was only recorded in the first year of the experiment. Over the course of both years, the control group had the lowest RGR value compared to the other therapies.

3.7. Net Assimilation Rate (NAR) g g−1 day−1

NAR exhibited an uprising trend with crop age up to 30–60 DAS, and then fell continuously over the next two years. Furthermore, the crops grown under control conditions noted the least NAR in comparison to the other treatments at 30–60, followed by 60–90 DAS, throughout the experiment. Nutrient management practice involving T-14 recorded maximum NAR at the 30-to-60 DAS stage (9.25 and 18.7 g g−1 day−1), which was statistically at par with T-13, T-12, T-9, T-7, and T-4 during 2017–2018 only (Table 3). Further, T-14 recorded significantly higher NAR at 60 to 90 DAS, which was statistically at par with T-13, T-12 during 2017–2018. Wheat grown in control plots recorded the least NAR over treated plots at 30–60, followed by 60–90 DAS, throughout the studied duration (Table 3).

3.8. Yields and Yield Attributes

Numerous nutrition management techniques impacted data on yield-attributing features, including ear length, spikelet number and grains per spike, and test weight (Figure 4). Comparing all of the nutrient management approaches to the control over both years, longer ear lengths were observed. The maximum value of ear length (12.5 cm) was recorded in T-14, while the shortest ear length (6.10 and 6.90 cm) was measured in control plots, which was inferior to all the other treatments. T-11 recorded significantly lower value of ear length in comparision with T-13 during both years. Foliar application of bio-stimulant-L in treatment T-12 gave maximum ear length (11.20 and11.40 cm) when compared to similar treatment in the absence of bio-stimulant (T-8) throughout the studied duration. The minimum ear length was documented in control plots for both years of study. The number of spikelets per spike increased significantly among different nutrient management practices compared to control plots. During both years, T-14, T-7, T-12, and T-13 were found to have the highest number of spikelets per spike (17.4 and 17.9), which is notably greater than the other treatments. In control plots, the minimum number of spikelets per spike was noted. When compared to control plots, wheat plants cultivated using various nutrition management techniques produced significantly more spike−1 grains. Further, the observations indicated that the number of spike−1grains differed with nutrient management practices during both years. Among various treatments, the greatest number of grains per spike (49.7 and 49.8) was recorded in T-14 compared to other treatments, which were at par with T-7, T-9, T-12, and T-13 during two study years. Minimum grains per spike were recorded in control plots during both years. Wheat grains differed slightly in test weight among different nutrient management practices throughout the studied duration (Figure 4). One thousand-grain weight ranged from 35.7 to 40.12 g during 2017–2018 and 35.8 to 40.3 g during 2018–2019, the lowest being in control plots and the highest achieved with T-14 treatment. Additionally, the application of suggested NPK + bio-stimulant G @ 25 kg/acre recorded higher test weight over suggested NPK throughout the studied duration.
Several nutrient management strategies boosted the grain yield compared to control plots. By applying the suggested NPK, the yield increased by 22% (3214 kg/ha) compared to the control. Adding FYM over the suggested NPK increased the yield by an additional 6.4% (3420 kg/ha), which was still a considerable improvement. Nutrient management practices, viz., T-7, T-12 and T-13, led to an increase in wheat grain yield in comparison to the control plot by 50.3% (3958 kg/ha), 46.6% (3862 kg/ha), 41.1% (3716 kg/ha) and 56.0% (4110 kg/ha); however, differences were significant among themselves (Table 3). Further, T-10 and T-14 treatments increased the grain yield, as compared to those with T-11 and T-13, by (0.52 to 0.82%, 6.4 to 6.4%) from 3631 to 3627 and 4751 to 4764 kg/ha, respectively, during both the years. However, treatment with T-10 was found to be significant over T-8 during both years by 1.9% (3562 kg/ha). Additionally, the addition of bio-stimulant–L in T-14 treatment at 55 and 70 DAS+ bio-stimulant-L @ 625 mL ha−1 foliar spray each at 55 and 70 DAS induced a significant rise in grain yield of 30.8% in the first year and 30.3% in the second year of the study investigation when compared to similar treatment without the use of bio-stimulant in treatment T-10 at 55 and 70 DAS. The treatment with T-14 had the highest grain yield across both years. It was statistically comparable to the treatment involving the addition of FYM + NPK-G + NPK biofertilizer and foliar spraying of NPK-P @ 1% with bio-stimulant-L at 40, 55, and 70 DAS. The other treatments were statistically significantly better (Figure 4).
Straw yield was profoundly impacted by various nutrient treatments, and varied between 4214 to 4299 and 6319 to 6479 kg/ha during the investigation (Table 4). Straw yield enhanced significantly with the application of nutrients irrespective of the nutrient management practices compared to control plots. The maximum straw yield was obtained under T-14, which was statistically similar to T-13 treatment plots, while significantly superior to the rest of the treatments, including control and suggested NPK during both the years.
The biological yield of wheat (grain + straw yield) was profoundly impacted by various nutrient management techniques and varied between 6848 to 11,070 kg/ha and 6953 to 11,243 kg/ha during the respective years. The maximum biological yield of 11,070 and 11,243 kg/ha was produced in the T-14 treatment during both years, which was found statistically at par with the biomass yield recorded in T-13, each at 40, 55 and 70 DAS, and significantly more effective than the other treatments during both years. Minimum and significantly lower biomass of 6848 and 6953 kg/ha during both years was produced in control plots (T-1) (Table 4). The maximum value of harvest index (42.9 to 42.4) in wheat was obtained under the T-14 plots followed by T-13 treatment plots. The lowest value of harvest index (38.5 to 38.2) was obtained in control plots during two years of investigation. Nevertheless, the impact on the wheat harvest index has been non-significant irrespective of the years.

3.9. Grain and Straw–Nitrogen (N) Uptake

Grain and straw N contents increased between various INM approaches compared to untreated control plots. Wheat grain N varied between 1.18 to 1.62 and 1.20 to 1.64, and straw N from 0.21 to 0.56 and 0.23 to 0.59, respectively, under varying treatments during both years (Table 5). T-14 resulted in maximum nitrogen grain and straw content, while the minimum was noted in the control plot over the course of two years. Integrated nutrient usage had a favorable effect on level of nitrogen in the wheat grain and straw. All treated plots were observed with increased nitrogen uptake in grain and straw over control conditions. Nitrogen uptake in wheat grain ranged from 31.1 to 77.0 and 31.9 to 78.1 kg/ha, while in straw, from 8.85 to 35.4 and 9.89 to 38.2 kg/ha, respectively, during both years among different treatments (Table 5). In the T-13 and T-14 plots, during 2017–2018, the grain and straw N uptake were reported to be 128 and 148%, and 254 and 300%, respectively, higher than T-1 plots, which were further reported to vary as 126 and 145%, and 231 and 287%, respectively, in the T-13 and T-14 plots during 2018–2019 as compared to T-1 plots (Table 5).
The T-14 treatment, which was at par with T-13 while being noticeably better than the remainder of the treatments for both years, reported the highest nitrogen uptake in grain. Additionally, during the first year of the experimental inquiry, increased nitrogen uptake in straw was seen in T-14 treatments, which were comparable to T-13 and much better than other treatments. Under control circumstances, grain and straw showed the lowest nitrogen uptake respectively.

3.10. Protein Content and Yields in Grain (%)

On a worldwide and national level, there are 216 and 29.7 million ha, respectively, planted with wheat, producing 731 and 99.9 million metric tonnes with an average productivity of 3390 and 3371 kg/ha. By dry weight basis, wheat germ has a 10.8% water content, 26.5% crude protein content, 8.56% crude fat content, and 4.18% ash content [1]. During both experimental years, the protein content of wheat ranged from 7.38 to 10.1% and 7.47 to 10.2%, respectively. When the crop was fertilized with T-14, a mean protein content of 10.2% was observed, as opposed to a mean protein content of 7.42% under control and 8.50% with suggested NPK (Table 4). Different INM approaches and broadcasting of urea positively affected wheat protein content. However, the lowest protein content (7.38% and 7.47%) was recorded in the control plot during the investigation periods. Protein yield ranged from 194 to 481 kg/ha and 198 to 488 kg/ha under different treatments during both years (Table 5). In the T-13 and T-14 plots, during 2017–2018, protein (%) and protein yield were reported to be 32.9 and 37.2%, and 125.2 and 147.6%, respectively, higher than the T-1 plots, which were further reported to vary as 34.3 and 37.1%, and 126.5 and 146.1%, respectively, in the T-13 and T-14 plots during 2018–2019 as compared to the T-1 plots (Table 4).
There was an increase in protein yield among different nutrient management strategies compared to control. The crop grown with T-14 treatments produced the highest protein levels, whereas control crops had the lowest levels in both years.

3.11. Biological Properties and Microbial Biomass Carbon

Biological features such as bacteria, fungus, actinomycetes and microbial biomass carbon were significantly impacted by nutrient management strategies over the course of the two study years (Table 5). In comparison to control plots over both years, the bacterial population significantly increased under various nutrient management strategies. The increment magnitude was 29.9% during 2017–2018 and 29.4% during 2018–2019, with a mean of 29.4%. The crop fertilized with T-14 resulted in the highest bacterial population of 0.87 and 0.88 CFU in comparison to the other treatments. The crop outperformed with the former system compared to under T-13 by 4.8% (2017–2018) and 4.7% (2018–2019). Further, T-4 resulted in a higher bacterial population in comparison to T-2 treatments. In addition, T-12 and T-13 recorded the greatest bacterial populations when compared to T-8 in both years. The fewest microorganisms were found in the control plot, which was less effective than other treatments for two years (Table 4). Bacteria, fungi and actinomycetes in T-13 and T-14 plots, during 2017–2018, were reported to be 23.9 and 29.9%, 38.3 and 44.7% and 44.2 and 48.9%, and during 2018–2019 as 23.5 and 29.4%, 38.8 and 42.9%, and 42.2 and 46.7%, respectively, as compared to the T-1 plots, respectively (Table 5).
The increment magnitude was 44.7% during 2017–2018 and 42.9% during 2018–2019, with a mean of 43.8%. The crop-fed T-14 proved superior, being 33.3% in 2017–2018 and 34.6% in 2018–2019, with more fungi colonies compared to the rest of the treatments. Additionally, T-4 showed significantly higher fungi colonies than the similar T-2. Further, T-7 also produced a noticeably higher level of fungi colony than treatment T-4, where FYM was not applied. Furthermore, the effect of foliar spray bio-stimulant–L in treatment T-13 also registered higher fungi colonies than in a similar treatment without foliar application of bio-stimulant (T-11) (Table 5). The lowest levels of fungi were counted in control plots throughout the experiment. The increment magnitude was 30.1% during 2017–2018 and 28% during 2018–2019, with a mean of 29.1%. The crop fertilized with T-14 treatments registered the highest actinomycetes population, being 15.9% (2017–2018) and 15.7% (2018–2019) more actinomycetes colonies than with the suggested NPK (Table 5). The population of actinomycetes was found lowest in control plots for both years. Nutrient management practice, comprising T-14, registered the highest mean microbial biomass carbon of 163.1 µg/g compared to other treatments as observed during the studied years (Table 5). Under T-7, microbial biomass carbon levels were found to be significantly higher than they would have been in a similar treatment without the application of a bio-stimulant (T-3). Additionally, compared to treatment T-11, treatment T-13’s foliar application of bio-stimulant produced larger levels of microbial biomass carbon. In control plots, the lowest microbial biomass carbon levels (133.7 and 134.7 µg/g) were seen in both years.

3.12. Enzymatic Activities

In comparison to the control plots in both years, dehydrogenase activity increased significantly when various nutrition management techniques were used. The maximum value (0.57 and0.58 TPF/g1) of dehydrogenase activity was found in T-14 in comparison to the remaining treatments, accompanied by treatment involving T-13, T-12, and T-7 during both the year. T-7 treatment plots recorded significantly higher dehydrogenase activity over the suggested NPK and control plots. Minimum dehydrogenase activity was observed in the control plots (0.42 and 0.43 TPF/g1) throughout the experiment period (Table 6). During 2017–2018, in the T-13 and T-14 plots, the microbial C, microbial N and dehydrogenase activity were reported to be 17.7 and 21.7%, 25.7 and 35.1%, and 26.2 and 35.7% higher than the T-1 plots, which were further reported to vary as 18.0 and 21.4%, 25.1 and 35.4%, and 25.6 and 34.9% higher, respectively, in the T-13 and T-14 plots during 2018–2019 as compared to the T-1 plots (Table 6). The highest apparent recovery efficiency of applied NPK in wheat (0.59% and 0.61%) was recorded when the level of NPK was raised from control to T-14 during both years. The lowest apparent recovery efficiency of 0.21 and 0.22% was recorded in T-3 plots during both years (Table 6).

4. Discussion

4.1. Organic Manures Viz-a-Viz Growth Parameters

Organic manures are a significant source of both macro- and micronutrients and other growth-promoting substances, coupled with an increase in microbial activity, which assistances in taming metabolism and plant growth. The data pertaining to growth attributes reveal that the production of biomass in wheat at all stages of growth was significantly impacted by the application of various organic manures (Figure 4). The application of organic manures favorably influenced all the components of plant biomass. With regard to plant height, nutrient management practices involving FYM @ 5 t ha−1 treatment were found to be significantly better than control plots. Additionally, integrated nutrient management was recorded with a higher accumulation of dry matter, rate of crop growth & relative growth, and leaf area index than control plots and the suggested NPK. It might be challenging to replicate the good effects of organic manures with other materials sometimes because they provide a wide range of nutrients and enhance the physical qualities of soils. [19]. Indirectly or directly, plant development is improved by FYM’s addition of significant amounts of macro- and micronutrients, humic substances, organic matter, and other elements are all products of the decomposition of organic matter in the soil [20]. Using organic manures promotes plant development, microbial activity, and increased soil enzyme activity [21]. With the addition of FYM, plants grew taller and accumulated more dry matter, which may be related to FYM’s quick mineralization, given that it contains significant amounts of potassium, phosphorus, and nitrogen [21,22]. Additionally, as shown by [23,24,25,26], the integration of FYM enhances the population of N-fixers and solubilizes the phosphorus, and boosts the activity of nitrogenase and urease enzymes.
Organic nutrient sources, such as FYM, bio-stimulants, and NPK bio-fertilizers, are sustainable and environmentally responsible alternatives to increase production while reducing the detrimental outcomes of chemical fertilisers on the environment and soil health. The data presented in Figure 4 reveal that applying organic manures produced higher yield attributes in wheat, viz., effective tillers meter−1 row length, grains ear−1 and test weight. Incorporation of FYM @ 5 t ha−1 along with + NPK-G + NPK bio-fertilizer + Urea and foliar spray of NPK-P and bio-stimulant –L recorded the highest yield attributes when compared to control plots. Organic manures are advantageous because they provide a consistent supply of nutrients, resulting in improved plant growth and development. Additionally, the application of FYM increases the availability of nitrogen, phosphate, and potassium in addition to the release of micronutrients, which may have helped improve wheat’s production characteristics. Higher yield parameters in wheat may have resulted from the favourable effects of balanced NPK supplementation through inorganic fertilisers and the availability of plant nutrients and humic substances from organic manures [27,28]. The efficiency of photosynthetic processes, cell wall expansion, meristematic activity, cell division and control over water uptake into the cells may have all been triggered by these actions.
The application of FYM pointedly improved wheat grain and straw yield. The FYM was reported to be one of the best sources of plant nutrients because of the higher concentration of nitrogen and potassium in FYM that is available to the crop easily. Upon FYM application, only a small amount of N is readily accessible to the plants, while a larger portion of N is made available because of giving balanced nutrition to plants. Additionally, a higher yield may be the result of FYM providing the plants with more nutrients that are directly available to them, such as nitrogen and potassium. By stabilizing the discharge of polysaccharides and other organic molecules during the degradation of organic materials, FYM may also have increased the amount of water-stabilized aggregates in the soil, leading to taller plants, more tillers, and eventually a larger yield [29,30]. The improvement in growth and other yield qualities contributed significantly to the rise in grain and straw production under the effect of FYM. Due to the production of greater humus colloidal complexes and their higher nutritional content, FYM and poultry manure favored soil characteristics [31,32]. Additionally, as seen in [33], the addition of FYM considerably improved wheat production parameters, adding to the final land productivity.

4.2. Nutrient Dynamics in Crop Biomass

Organic manures act as a ‘slow-release fertilizer’, providing a continuous opportunity to supply nutrients for plant uptake for longer. Organic manures significantly affected the wheat grain and straw’s nutrient uptake and content. T-14 plots significantly increased the wheat grain and straw’s nutrient uptake and content during both years (Table 5). Consequent enhancement in wheat grain and straw’s nutrient uptake and content may be attributed to the application of FYM, which perhaps have increased the activity of soil microorganisms and resulted in increased fungi, bacteria, and actinomycetes populations, coupled with greater soil enzyme activity, thereby stimulating plant growth [21]. Wheat nutrient uptake was influenced by the soil’s higher rates of mineralization of carbon and plant nutrients due to the FYM application’s increased microbial respiration [34]. The application of FYM is well known for preserving soil productivity for a much longer period of time than the sole usage of inorganic fertilizers [35]. FYM contains all the macro- and micronutrients required for plant growth [36]. Native nutrient’s solubilization, the chelation of intricate intermediate organic molecules created during the decomposition of manure, and the mobilisation and accumulation of different nutrients in different plant parts may all be contributing factors to the higher nutrient uptake in wheat that follows the subsequent application of organic manures (FYM) [28]. The outcomes are consistent with the conclusions of [37,38].

4.3. Enzymatic and Microbial Activity of Soil

Enzymes, which are thought to distinguish the degree of particular soil processes and occasionally serve as proxies for soil fertility, catalyze all biological events in soil. By using FYM, dehydrogenase’s enzyme activity was significantly impacted. In contrast to control plots and the suggested NPK (Table 6), the highest dehydrogenase activity was seen in T-14 plots loaded with FYM @ 5 t ha−1 along with NPK-G @ 200 kg/ha+ NPK bio-fertilizer + urea @ 20 kg/ha at 40 DAS + foliar spray NPK-P @ 1% +bio-stimulant @ 625 mL ha−1 at 55 and 70 DAS. The higher activity of dehydrogenase enzymes in soils amended with organic nutrient sources was not only due to large microbial biomass, as well as the fact that the microbial biomass produces more enzymes and has higher levels of endo-enzymes. Generally, soil enzymatic activities are related to the presence of organic matter content. The activity of the dehydrogenase enzyme was closely pertaining to microbial biomass and soil organic matter under different ecosystems [39,40,41,42,43]. The population density and composition of microorganisms are important attributes related to the quality of organic carbon in soils. The number of bacteria, fungi, and actinomycetes dramatically increased after applying various organic manures. Comparing the microbial population of the control plots and suggested NPK, respectively, the addition of FYM greatly improved it due to the soil’s improved physio-chemical characteristics and increased carbon content, FYM incorporation may have increased the number of soil microbes [44]. The boosted activity and expansion of soil microbes may cause the increase in microbial population brought on by applying organic manures. According to [43,45,46], the lower C:N ratio of FYM plots compared to control plots and the high total N and K content led to an increase in the population of microorganisms.

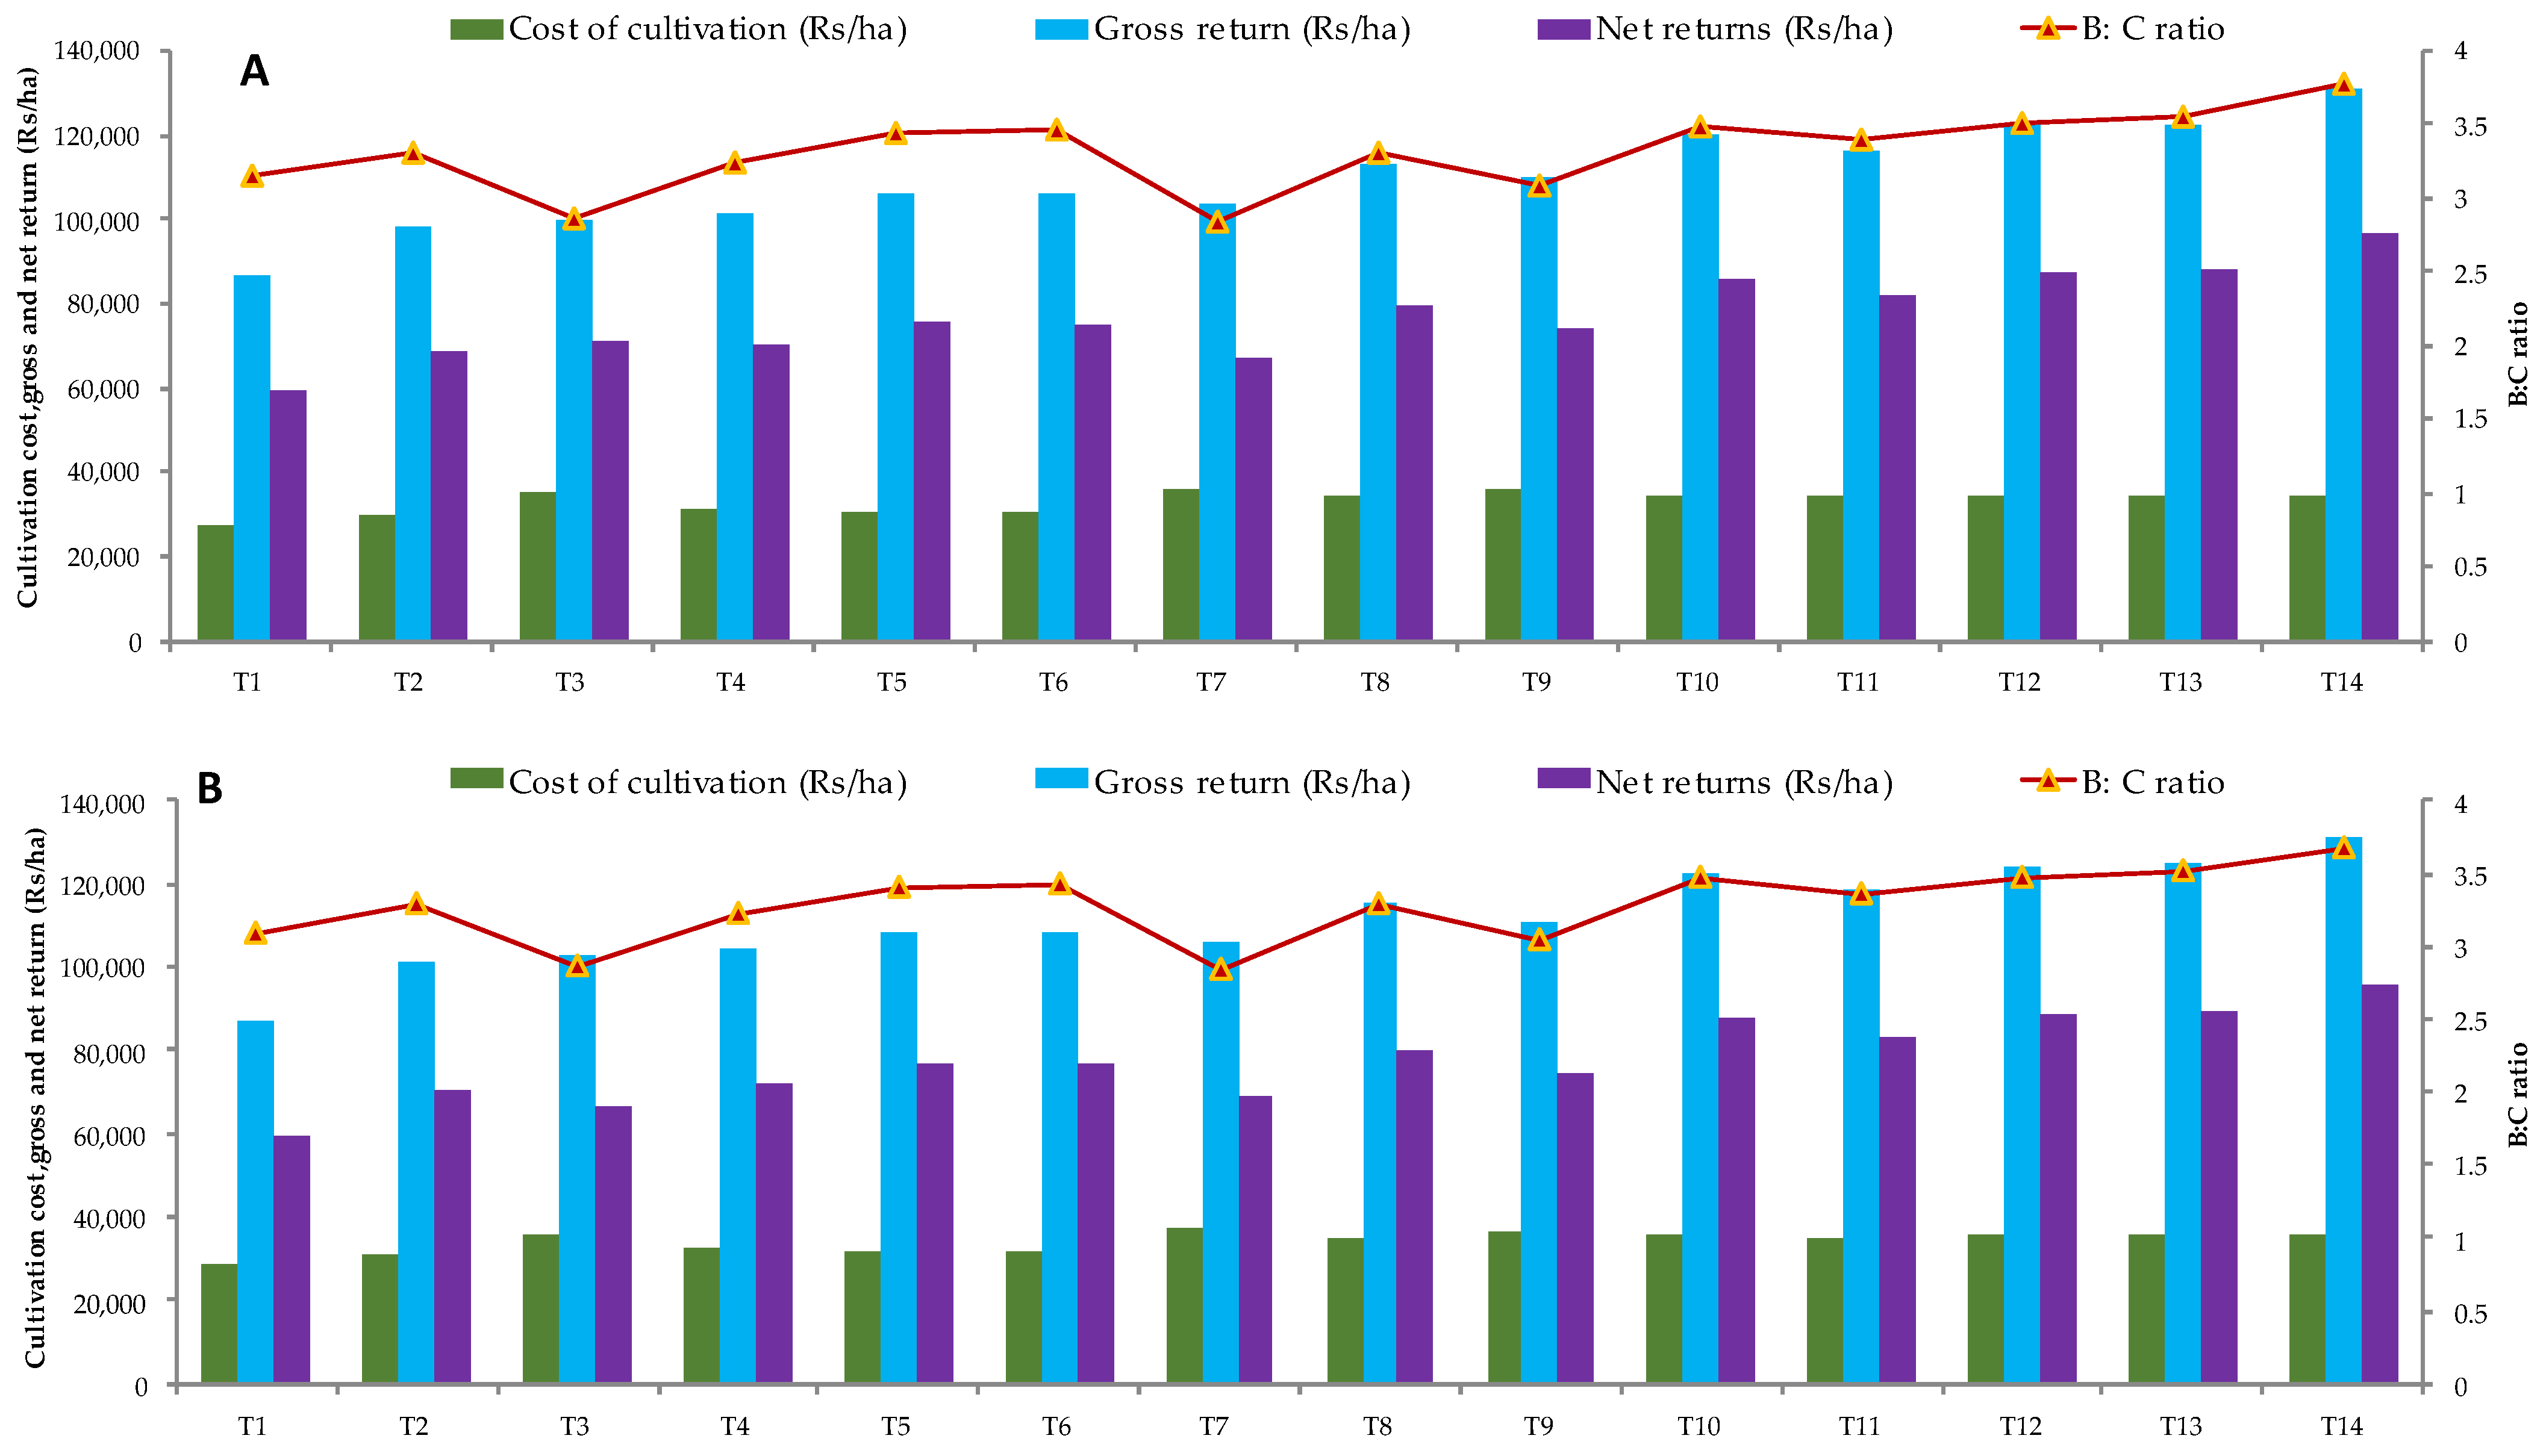
4.4. Benefit:Cost Ratio

Higher B:C ratios were observed in T-14 plots compared to other nutrient management techniques used in wheat. Crops fertilized under T-14 and T-13 plots produced the highest B:C ratios (3.77) and (3.67), while the lowest B:C ratios were recorded in (2.85) and (2.83) during both years (Figure 6). The wheat grain and straw production is impacted by increasing cost and treatment are the key causes of this trend in economic returns [47,48,49].

4.5. Interpretations/Conclusions

Wheat crops supplied with integrated nutrient management (INM) practice resulted in the highest grain yield and benefits, which further adds to the livelihoods of the wheat farmers in the region. INM approaches improved soil and grain nutrient uptake, improved the nutritional values of final produce, and the physico-chemical properties and microbial activity of soils. Therefore, in order to increase productivity, the wheat crop’s role of INM with foliar application of bio-stimulants must be highlighted in the region. Further, such studies must be carried out at different locations with different agro-climatic conditions having texturally divergent soils.

Author Contributions

Conceptualization, supervision, data curation, methodology, formal analysis, writing—original draft, L.J., R.K.N., R.B., M.S.C., S.S. and S.K.G.; funding acquisition, writing—review and editing, A.A., A.Z.D. and M.A.M. All authors have read and agreed to the published version of the manuscript.

Funding

This research was financially supported by the Deanship of Scientific Research, King Saud University through the Vice Deanship of Scientific Research Chairs and the Research Chair of Prince Sultan Bin Abdulaziz International Prize for Water.

Institutional Review Board Statement

Not applicable.

Informed Consent Statement

Not applicable.

Data Availability Statement

Not applicable.

Acknowledgments

The authors extend their appreciation to the Deanship of Scientific Research, King Saud University for funding through the Vice Deanship of Scientific Research Chairs and the Research Chair of Prince Sultan Bin Abdulaziz International Prize for Water.

Conflicts of Interest

The authors declare no conflict of interest.

References

  1. Bilgicli, N.; Ibanoglu, S. Effect of wheat germ and wheat bran on the fermentation activity, phytic acid content and color of terhana, a wheat flour-yoghurt mixture. J. Food Eng. 2007, 78, 681–686. [Google Scholar] [CrossRef]
  2. United Nations, Department of Economic and Social Affairs, Population Division. World Population Prospects: Highlights (ST/ESA/SER.A/423), 2019. Available online: https://www.un.org/development/desa/publications/world-population-prospects-2019-highlights.html (accessed on 1 June 2022).
  3. Anonymous. Agriculture Statistics at a Glance; Directorate of Economics and Statistics Department of Agriculture and Cooperation, Ministry of Agriculture Government of India New Delhi: New Delhi, India, 2019. [Google Scholar]
  4. Fixen, P.; Brentrup, F.; Bruulsema, T.; Garcia, F. Nutrient/fertilizer use efficiency: Measurement, current situation and trends. In Managing Water and Fertilizer for Sustainable Agricultural Intensification; IFA/IWMI/IPNI/IPI: Paris, France, 2014; 30p, Chapter 1. [Google Scholar]
  5. Baloch, M.S.; Shah, I.T.H.; Nadim, M.A.; Khan, M.I.; Khakwani, A.A. Effect of seeding density and planting time on growth and yield attributes of wheat. J. Anim. Plant Sci. 2006, 20, 239–240. [Google Scholar]
  6. Bakht, J.; Shafi, M.; Jan, M.T.; Shah, Z. Influence of crop residue management, cropping system and N fertilizer on soil N and C dynamics and sustainable wheat (Triticum aestivum L.) production. Soil Tillage Res. 2007, 104, 233–240. [Google Scholar] [CrossRef]
  7. Bali, S.V.; Mudgal, S.C.; Gupta, R.D. Effect of recycling of organic waste on rice–wheat rotation under alfisol soil condition of North–western H imalayas. Himachal J. Agric. Res. 1986, 12, 98–107. [Google Scholar]
  8. Sarma, A.; Singh, H.; Nanwal, R.K. Effect of integrated nutrient management on productivity of wheat (Triticum aestivum L.) under limited and adequate irrigation supplies. Indian J. Agron. 2007, 52, 120–123. [Google Scholar]
  9. Maroušek, J.; Trakal, L. Techno-economic analysis reveals the untapped potential of wood biochar. Chemosphere 2022, 291, 133000. [Google Scholar] [CrossRef] [PubMed]
  10. Maroušek, J.; Maroušková, A.; Periakaruppan, R.; Gokul, G.M.; Anbukumaran, A.; Bohatá, A.; Kříž, P.; Bárta, J.; Černý, P.; Olšan, P. Silica Nanoparticles from Coir Pith Synthesized by Acidic Sol-Gel Method Improve Germination Economics. Polymers 2022, 14, 266. [Google Scholar] [CrossRef]
  11. Kumar, V.; Ahlawat, I.P.S. Carry-over effect of biofertilizer and nitrogen applied to wheat (Triticum aestivum) and direct applied N in maize (Zea mays) in wheat maize cropping systems. Indian J. Agron. 2004, 49, 233–236. [Google Scholar]
  12. Bhardwaj, S.K.; Sharma, S.D.; Kumar, P. Effect of conjoint use of bio-organics and chemical fertilizers on yield, soil properties under French bean–cauliflower-based cropping system. Arch. Agron. Soil Sci. 2011, 58, 759–763. [Google Scholar] [CrossRef]
  13. Singh, I.D.; Stoskopf, N.C. Harvest Index in Cereals. Agron. J. 1971, 63, 224–226. [Google Scholar] [CrossRef]
  14. Association of Official Agricultural Chemists. Methods of Analysis, 9th ed.; Association of Official Agricultural Chemists: Washington, DC, USA, 1960; pp. 15–16. [Google Scholar]
  15. Rangaswami, G. Agricultural Microbiology; Asia Publishing House: London, UK, 1966; p. 413. [Google Scholar]
  16. Vance, E.D.; Brookes, P.C.; Jenkinson, D.S. An extraction method for measuring soil microbial biomass C. Soil Biol. Biochem. 1987, 19, 703–707. [Google Scholar] [CrossRef]
  17. Casida, I.E.; Klein, D.A.; Santore, T. Measurement of dehydrogenase activity by incubating the soil with TTC method. Soil Sci. 1964, 98, 373. [Google Scholar] [CrossRef]
  18. Gomez, K.A.; Gomez, A.A. Statistical Procedure for Agriculture Research, 2nd ed.; Jon Wiley and Sons: New York, NY, USA, 1984. [Google Scholar]
  19. Pong, X.P.; Laty, J. Organic farming: Challenge of timing nitrogen availability to crop N requirements. Soil Sci. Soc. Am. J. 2000, 64, 247–253. [Google Scholar] [CrossRef] [Green Version]
  20. Noreen, F.; Noreen, S. Effect of different fertilizers on yield of wheat. Int. J. Sci. Res. 2014, 3, 1596–1599. [Google Scholar]
  21. Knapp, B.A.; Ros, M.; Insam, H. Do composts affect the soil microbial community? In Microbes at Work: From Wastes to Resources; Insam, H., Franke–Whittle, I., Goberna, M., Eds.; Springer: Berlin/Heidelberg, Germany, 2010; pp. 93–114. [Google Scholar]
  22. Willrich, T.; Jurmer, D.O.; Volk, V.V. Manure Application Guidelines for Pacific Northwest; ASAE Paper No.74-4601; American Society of Agricultural and Biological Engineers: St. Joseph, MI, USA, 1974. [Google Scholar]
  23. Channabasanagowda, N.K.; Patil, B.; Patil, B.N.; Awaknavar, J.S.; Ninganur, B.T.; Hunje, R. Effect of organic manures on growth, seed yield and quality of wheat. Karnataka J. Agric. Sci. 2008, 21, 366–368. [Google Scholar]
  24. Sepat, R.N.; Rai, R.K.; Dhar, S. Planting system and integrated nutrient management for enhanced wheat (Triticum aestivum) productivity. Indian J. Agron. 2010, 55, 114–118. [Google Scholar]
  25. Singh, Y.; Singh, B.; Ladha, J.K.; Bains, J.S.; Gupta, R.K.; Singh, J.; Balasubramanian, V. On-farm evaluation of leaf color chart for need-based Nitrogen management in irrigated transplanted rice in North Western India. Nutr. Cycl. Agroecosyst. 2007, 78, 167–176. [Google Scholar] [CrossRef]
  26. Singh, S.P.; Pal, M.S. Effect of integrated nutrient management on productivity, quality, nutrient uptake and economics of mustard (Brassica juncea). Indian J. Agron. 2011, 56, 381–387. [Google Scholar]
  27. Sekar, A. Studies on the Evaluation of Sugarcane Variety and Production Technologies for Animating Sugarcane Productivity in Coastal Region of Tamil Nadu. Ph.D. Thesis, Annamalai University, Annamalainagar, India, 2003. [Google Scholar]
  28. Sharma, G.D.; Thakur, R.; Raj, S.; Kauraw, D.L.; Kulhare, P.S. Impact of integrated nutrient management on yield, nutrient uptake, protein content of wheat (Triticum aestivum) and soil fertility in a typic haplustert. Bioscan 2013, 8, 1159–1164. [Google Scholar]
  29. Hendrix, P.F.; Callaham, M.A., Jr.; James, S.W. Ecology of nearetic earthworms in the Southern USA-I. Charasteristics of diplocardia longa surface casts in grass, hardwood and pinc micro habitats on the lower pied mount of Georgia. Megadrilogica 1994, 5, 45–51. [Google Scholar]
  30. Martens, D.A.; Johanson, J.B.; Frankenberger, W.T., Jr. Production and persistence of soil enzymes with repeated addition of organic residues. Soil Sci. 1992, 153, 53–61. [Google Scholar] [CrossRef]
  31. Singh, K.; Srivastava, O.P. Effect of organic manure on soil fertility as showed by nutrition availability and yield response in potato. Proc. Int. Symp. Soil Fertil. Eval. 1970, 1, 815–820. [Google Scholar]
  32. Dhaka, B.R.; Chawla, N.; Pathan, A.R.K. Integrated nutrient management on performance of wheat (Triticum aestivum L.). Ann. Agric. Res. New Ser. 2012, 33, 214–219. [Google Scholar]
  33. Gupta, V.; Sharma, R.S. Effect of integrated nutrient management on productivity and balance of rice- wheat cropping system. Annu. Plant Soil Res. 2007, 8, 148–151. [Google Scholar]
  34. Powon, M.P.; Aguyoh, J.N.; Mwaja, V. Effects of inorganic fertilizers and farmyard manure on growth and tuber yield of potato. Afr. Crop Sci. Conf. Proc. 2005, 7, 1089–1093. [Google Scholar]
  35. Flaig, W. Specific effect of soil organic matter on the potential of soil productivity. FAO Bull. 1975, 27, 31–69. [Google Scholar]
  36. Hesse, P.R. Potentials of organic materials for soil improvement. In Organic Matter and Rice; International Rice Research Institute: Losbanos, Philippines, 1984; pp. 35–43. [Google Scholar]
  37. Mitra, S.; Roy, A.; Saha, A.R.; Maitra, D.N.; Sinha, M.K.; Mahapatra, B.S.; Saha, S. Effect of integrated nutrient management on fiber yield, nutrient uptake and soil fertility in jute (Corchorus olitorius). Indian J. Agric. Sci. 2010, 80, 801–804. [Google Scholar]
  38. Kumar, P.; Pannu, R.K. Effect of different sources of nutrition and irrigation levels on yield, nutrient uptake and nutrient use efficiency of wheat. Int. J. Life Sci. Pharma Res. 2012, 1, 187–192. [Google Scholar]
  39. Frankenberger, W.T.; Dick, W.A. Relationships between enzyme activities and microbial growth and activity indices in soil. Soc. Sci. Soc. Am. J. 1983, 47, 945–951. [Google Scholar] [CrossRef]
  40. Goyal, S.; Mishra, M.M.; Dhankar, S.S.; Kapoor, K.K.; Batra, R. Microbial biomass turnover and enzyme activities following the application of farmyard manure to field soils with and without previous long term applications. Biol. Fertil. Soils 1993, 15, 60–64. [Google Scholar] [CrossRef]
  41. Ramesh, P.; Panwar, N.R.; Singh, A.B.; Ramana, S. Effect of organic manures on productivity, soil fertility and economics of soyabean (Glycine max)—Durum Wheat (Triticum durum) cropping system under organic farming in vertisols. Indian J. Agric. Sci. 2008, 78, 1033–1037. [Google Scholar]
  42. Khursheed, S.; Arora, S.; Ali, T. Effect of different organic sources on biochemical properties in typical inceptisols of Jammu. Progress. Agric. 2012, 12, 348–353. [Google Scholar]
  43. Meena, M.C.; Dwivedi, B.S.; Singh, D.; Sharma, B.M.; Kumar, K.; Singh, R.V.; Kumar, P.; Rana, D.S. Effect of integrated nutrient management on productivity and soil health in pigeonpea (Cajanus cajan)-wheat (Triticum aestivum) cropping system. Indian J. Agron. 2012, 57, 333–337. [Google Scholar]
  44. Meena, B.P.; Kumar, A.; Lal, B.; Sinha, N.K.; Tiwari, P.K.; Dotaniya, M.L.; Jat, N.K.; Meena, V.D. Soil microbial, chemical properties and crop productivity as affected by organic manure application in popcorn (Zea mays L. var. everta). Afr. J. Microbiol. Res. 2015, 9, 1402–1408. [Google Scholar]
  45. Mubarak, T.; Singh, K.N. Nutrient management and productivity of wheat (Triticum aestivum) based cropping system in temperate zone. Indian J. Agron. 2011, 56, 176–181. [Google Scholar]
  46. Verma, G.; Mathur, A.K.; Bhandari, S.C.; Kanthaliya, P.C. Long term effect of integrated nutrient management on properties of a typic haplustept under maize-wheat cropping system. J. Indian Soc. Soil Sci. 2010, 58, 299–302. [Google Scholar]
  47. Pandey, A.K.; Singh, S.K.; Prasad, R. Long term effect of organic and inorganic fertilizer on yield of rice and wheat. Environ. Ecol. 2009, 27, 1292–1295. [Google Scholar]
  48. Choudhary, S.; Yadav, L.R.; Yadav, S.S.; Sharma, O.P.; Keshwa, G.L. Integrated use of fertilizers and manures with foliar application of iron in barley (Hordeum vulgare). Indian J. Agron. 2013, 58, 363–367. [Google Scholar]
  49. Singh, V.K.; Shukla, A.K.; Singh, M.P.; Majumdar, K.; Mishra, R.P.; Rani, M.; Singh, S.K. Effect of site-specific nutrient management on yield, profit and apparent nutrient balance under pre-dominant cropping systems of Upper Gangetic Plains. Indian J. Agric. Sci. 2015, 85, 335–343. [Google Scholar]
Figure 1. Detailed layout of the conducted experiment.
Agronomy 12 02807 g001
Figure 2. Weekly average meteorological conditions for crop growth (A) during 2017–2018 and (B) during 2018–2019 at experimental location.
Agronomy 12 02807 g002
Figure 3. Plant height (cm) and population (no m−1) during 2017–2018 (A) and 2018–2019 (B), and tillers (no m−1 row length) during 2017–2018 (C) and 2017–2018 (D).
Agronomy 12 02807 g003
Figure 4. Yield attributes (ear length, spikelets per spike, grains per spikelets and 1000 grain wt) during 2017–2018 (A) and 2017–2018 (B).
Agronomy 12 02807 g004
Figure 5. Dry matter accumulation (g/m) during 2017–2018 (A) and 2018–2019 (B), and leaf area index (no m−1 row length) during 2017–2018 (C) and 2017–2018 (D).
Agronomy 12 02807 g005
Figure 6. Economic analysis of imposed treatments during 2017–2018 (A) and 2018–2019 (B).
Agronomy 12 02807 g006
Table 1. The conditions of the experiment.
a)Statistical Design:Randomised Block Design
b)No. of treatments:14
c)No. of replication:03
d)No. of plot (Total):42
e)Gross plotsize:4.0 m × 3.0 m = 12.0 m2
f)Net plot size:3.0 m × 1.8 m = 5.4 m2
g)Row spacing:20 cm
h)Total number of rows:15
i)Variety:DBW-71
j)Seed rate:125 kg/ha
k)Recommended NPK dose:80:60:40 (kg/ha)
Table 2. Nutrient management strategies effects on leaf area duration and crop growth rate at various crop stages.
SymbolLeaf Area DurationCrop Growth Rate (g m−2 L and Area d−1)
30–60 DAS60–90 DAS30–60 DAS60–90 DAS90-At Harvest
2017–20182018–20192017–20182018–20192017–20182018–20192017–20182018–20192017–20182018–2019
T129.329.875.976.91.992.060.330.280.010.01
T232.433.186.888.32.282.340.340.260.020.02
T332.833.387.288.92.332.370.340.300.020.02
T434.935.292.293.02.712.770.460.490.020.02
T534.434.791.592.02.602.720.390.410.020.02
T634.334.490.491.52.572.690.390.400.020.01
T735.535.793.594.02.962.990.540.580.040.02
T832.933.488.189.12.422.500.350.360.020.01
T935.235.492.993.32.842.880.510.490.020.02
T1033.534.089.890.32.512.590.380.370.030.02
T1133.333.789.190.12.462.550.360.350.010.03
T1236.036.294.694.93.103.160.600.580.030.02
T1336.236.695.497.83.133.210.640.590.030.03
T1437.838.1100.5103.53.273.280.640.680.050.04
SEM (±)1.271.283.373.410.100.100.020.020.010.01
C.D. (p = 0.05)3.633.679.619.740.290.300.050.050.030.03
Table 3. Nutrient management strategies effects on relative growth rate (g g−1 day−1) and net assimilation rate (g m−2 leaf area day−1) at various crop stages.
SymbolRelative Growth Rate (g g−1 day−1)Net Assimilation Rate (g m−2 Leaf Area day−1)
30–60 DAS60–90 DAS90-At Harvest30–60 DAS60–90 DAS
2017–20182018–20192017–20182018–20192017–20182018–20192017–20182018–20192017–20182018–2019
T10.04410.04450.00400.00400.00020.00017.237.310.480.36
T20.04370.04380.00390.00400.00010.00027.877.980.490.41
T30.04360.04400.00480.00430.00020.00037.868.060.500.43
T40.04440.04380.00310.00260.00020.00028.548.550.710.67
T50.04440.04470.00350.00320.00020.00028.268.360.630.67
T60.04390.04400.00460.00480.00020.00018.088.380.600.61
T70.04510.04530.00310.00230.00010.00039.199.280.740.78
T80.04290.04330.00380.00390.00020.00017.998.180.520.50
T90.04470.04580.00320.00270.00020.00028.858.870.580.82
T100.04390.04400.00330.00320.00010.00018.068.270.570.57
T110.04300.04370.00450.00430.00030.00027.978.270.550.51
T120.04590.04630.00430.00400.00020.00029.429.300.810.78
T130.04600.04670.00380.00390.00020.00027.9612.060.870.79
T140.04640.04610.00420.00450.00030.00019.2518.710.850.88
SEM (±)0.020.020.00010.00010.00010.00010.310.370.030.03
C.D. (p = 0.05)NSNS0.00030.00040.00020.00020.881.060.070.07
Table 4. Nutrient management strategies effects on crop yield (kg/ha).
SymbolYield (kg/ha)
GrainStrawBiologicalHarvest Index (%)
2017–20182018–20192017–20182018–20192017–20182018–20192017–20182018–2019
T126342654421442996848695338.538.2
T232143226482151628035838840.038.5
T334203428506254168482884440.338.8
T439583967558158319539979841.540.5
T538623878548457789346965641.340.2
T637163721531456229030934341.239.8
T7411041245722593998321006341.841.0
T835623575523656138798918840.538.9
T940874096567258569759995241.941.2
T1036313657527456198905927640.839.4
T1136123627522955958841922240.939.3
T124172418356745856984610,03942.441.7
T13446344776025617810,48810,65542.642.0
T14475147646319647911,07011,24342.942.4
SEM (±)145.0145.5203.1212.0348.1357.41.521.48
C.D. (p = 0.05)414.2415.5580.2605.6994.11020.8NSNS
Table 5. Nutrient management strategies impacts on N content (%), uptake (kg/ha) in grain and straw of wheat, and protein content (%) and protein yield (kg/ha) and biological properties of soils.
SymbolN Content in Grain
(%)
N Content in Straw
(%)
N Uptake in Grain
(kg/ha)
N Uptake in Straw
(kg/ha)
Protein (%)Protein Yield
(kg/ha)
Bacteria
(105 CFU g−1)
Fungi
(104 CFU g−1)
Actinomycetes (10 6 CFU g−1)
2017–20182018–20192017–20182018–20192017–20182018–20192017–20182018–20192017–20182018–20192017–20182018–20192017–20182018–20192017–20182018–20192017–20182018–2019
T11.181.200.210.2331.131.98.859.897.387.471941980.670.680.470.490.430.45
T21.361.370.290.3043.744.214.015.58.478.542722760.700.710.510.520.470.48
T31.371.370.310.3246.947.015.717.38.538.572922940.720.720.520.530.480.49
T41.501.530.470.4859.460.726.228.09.589.903793930.720.730.530.540.490.50
T51.491.510.450.4557.558.624.726.09.479.663663750.730.740.570.570.530.53
T61.471.500.420.4354.655.822.324.29.389.583493560.730.740.570.580.530.54
T71.531.580.500.5262.965.228.630.99.339.453833900.760.770.580.590.540.55
T81.391.400.330.3449.550.117.319.19.189.293273320.760.770.590.590.550.55
T91.521.550.490.5062.163.527.829.39.169.343743830.790.790.610.620.570.58
T101.471.490.410.4353.454.521.624.29.099.183303360.800.810.630.640.590.60
T111.461.470.380.3952.753.319.921.88.698.763143180.820.830.640.660.600.62
T121.561.600.510.5265.166.928.930.59.779.984084170.830.840.650.670.610.63
T131.571.610.520.5370.772.131.332.79.8110.034384490.830.840.650.680.620.64
T141.621.640.560.5977.078.135.438.210.1310.244814880.870.880.680.700.640.66
SEM (±)0.050.060.020.022.192.240.941.010.340.3513.714.00.030.030.020.020.020.02
C.D. (p = 0.05)0.160.160.050.056.266.402.692.880.980.9939.240.00.080.080.060.060.060.06
Table 6. Nutrient management strategies effects on microbial C, microbial N and dehydrogenase activity of soil and nutrient use efficiency.
SymbolSoil Biological PropertiesNutrient Use Efficiency
Microbial-C (ug/g 1soil)Microbial-N (ug/g 1soil)Dehydrogenase Activity (ug TPF/g 1soil day−1)Agronomic NPK-Use
Efficiency
Physiological NPK-Use
Efficiency
Apparent Recovery Efficiency
2017–20182018–20192017–20182018–20192017–20182018–20192017–20182018–20192017–20182018–20192017–20182018–2019
T1133.7134.718.618.90.420.430.000.000.000.000.000.00
T2142.7144.620.320.80.460.473.223.1814.613.50.220.24
T3144.6145.420.521.10.470.483.243.1918.116.80.210.22
T4152.4153.222.422.40.510.527.367.2912.913.10.520.53
T5149.3150.122.222.30.500.526.826.8015.414.20.480.50
T6147.1148.322.022.20.490.505.905.8212.715.70.410.43
T7156.7157.723.023.10.520.536.096.0611.311.60.450.47
T8145.6146.321.121.30.470.483.283.2610.910.70.210.22
T9155.6156.322.822.90.510.536.326.2711.611.70.460.47
T10147.2147.921.621.90.480.493.713.7313.414.20.260.28
T11146.9147.221.421.80.480.483.883.864.085.120.260.28
T12157.2158.123.223.30.530.545.445.4111.211.30.410.42
T13157.3159.023.423.70.530.547.257.2312.512.00.550.57
T14162.7163.625.125.60.570.587.877.8415.014.80.590.61
SEM (±)5.575.600.820.830.020.020.220.210.800.480.020.02
C.D. (p = 0.05)15.916.02.342.370.050.050.630.612.341.400.060.05
Publisher’s Note: MDPI stays neutral with regard to jurisdictional claims in published maps and institutional affiliations.

