Article

Productivity of Soybean under Projected Climate Change in a Semi-Arid Region of West Africa: Sensitivity of Current Production System

by
Dilys S. MacCarthy
1,*,
Pierre S. Traore
2,3,
Bright S. Freduah
1,
Samuel G. K. Adiku
4,
Daniel E. Dodor
4 and
Samuel K. Kumahor
4
1
Soil and Irrigation Research Centre, School of Agriculture, University of Ghana, Kpong EL-0633-5197, Ghana
2
International Crops Research Institute for the Semi-arid Tropics (ICRISAT), Bamako BP 320, Mali
3
Manobi Africa PLC, Level 2 Max City Bldg., Remy Ollier St., Port-Louis 11602, Mauritius
4
Department of Soil Science, School of Agriculture, University of Ghana, Legon, Accra GA-489-9979, Ghana
*
Author to whom correspondence should be addressed.
Agronomy 2022, 12(11), 2614; https://doi.org/10.3390/agronomy12112614
Submission received: 31 August 2022 / Revised: 30 September 2022 / Accepted: 15 October 2022 / Published: 24 October 2022

Abstract

:
The production of soybean is gaining more attention in West Africa. In light of projected changes in climate, there is a need to assess the potential impacts on yield productivity and variability among farmers. An evaluated GROPGRO module of the Decision Support System for Agro-technological Transfer (DSSAT) was used to simulate soybean productivity under both historical (1980–2009) and projected climate scenarios from multiple general circulation models (GCMs) under two representative concentration pathways (RCPs): 4.5 and 8.5. Agronomic data from 90 farms, as well as multiple soil profile data, were also used for the impact assessment. Climate change leads to a reduction (3% to 13.5% across GCMs and RCPs) in the productivity of soybean in Northern Ghana. However, elevated atmospheric carbon dioxide has the potential to offset the negative impact, resulting in increased (14.8% to 31.3% across GCMs and RCPs) productivity. The impact of climate change on yield varied widely amongst farms (with relative standard deviation (RSD) ranging between 17% and 35%) and across years (RSD of between 10% and 15%). Diversity in management practices, as well as differences in soils, explained the heterogeneity in impact among farms. Variability among farms was higher than that among years. The strategic management of cultural practices provides an option to enhance the resilience of soybean productivity among smallholders.

1. Introduction

Soybean (Glycine max (L.) Merrill) is becoming an increasingly important crop in Ghana due to rising demand within the poultry sector, as well as its demand as a raw material for the expanding oil industry. Northern Ghana contributes about 96% of the total soybean produced in Ghana, and its cultivation is a key livelihood opportunity in this region. Unlike other cereals, which require the use of considerable amounts of fertilizer, notably, nitrogen [1], soybean improves soil fertility by fixing atmospheric nitrogen into the soil (through biological nitrogen fixation) which then becomes available to subsequent cereals grown in crop rotation schemes. Its cultivation is also associated with a reduction in Striga hermonthica, a noxious weed that limits the yield of other crops. Soybean crop residue also serves as an important feed for livestock, due to its high nutrient content [2]. The increasing demand for the crop for industrial processing has made it a cash crop, thus significantly contributing to poverty reduction among smallholder farmers. Its demand for domestic purposes is also on the rise, thus playing an important role in the nutrition of households due to its high protein content.
The cultivation of soybean, similarly to many other crops in Sub-Saharan Africa (SSA), is largely undertaken by smallholder farmers with low external input and who are heavily reliant on rainfall; hence, yield levels are generally very low. Unlike other major soybean-producing countries such as Brazil, the United States of America (USA), and China, where a significant proportion of soybean is cultivated under irrigation, it is mainly rain-fed in Ghana. Several factors limit the productivity of soybean in Ghana. Prominent among them is the over-reliance on rainfall, which has increasingly become erratic [3], resulting in drought spells which are detrimental to optimal growth and yield [4]. Another weather parameter which is known to impact the yield of soybean is high temperature. Changes in temperature influence the physiological, biochemical, metabolic, and molecular functions of plants [5], affecting the growth and yield of crops [6]. Higher temperatures have been associated with higher nutrient contents of soybean by a number of studies [7]. Future climatic changes are likely to have substantial impact on soybean production, depending on the magnitude of variations in temperature and CO2 from baseline conditions [8,9]. An increased temperature from 26 °C to 30 °C resulted in soybean yield decline, whereas yield increases were reported in cooler environments where the base temperature was 19 °C. Hatfield et al. [10] indicated that a projected rise in temperature and increasing CO2 coupled with an increase in the variability of precipitation will create a complex set of interactions on plant growth and water use, with a consequential effect on yield. However, insurance (provision of financial protection services) against environmental stress factor is almost non-existent. Indeed, even under current weather conditions, climate factors and management side-by-side, as well as their interaction, contribute to low yields [4,11].
Climate change in SSA, characterized by projected increases in temperatures and more erratic rainfall distributions [12], poses a major threat to sustainable agricultural growth, food security, and development in Africa. As a result, the efforts of African countries to achieve the Millennium Development Goals may be seen as a mirage if the adverse effects of climate change are not addressed [13] and appropriate adaptation measures put in place to either benefit or reduce its negative impact. The potential effect of climate change on soybean production is, however, not well addressed [14,15]. Additionally, most studies on climate change impacts on soybean have been restricted to cooler regions [16,17] and were carried out at scales that do not capture the heterogeneity in input, management, and resources which are peculiar to smallholder systems in SSA [14,18,19,20]. Adaptation strategies must be carried out at farm level; therefore, there is a need to assess the diversity in climate change impacts across smallholder farming systems and to capture its underlying factors. The aim of this study was to assess (i) the potential climate change impacts on the yield of soybean in Northern Ghana, and (ii) the heterogeneity of this impact among smallholder farmers.

2. Materials and Methods

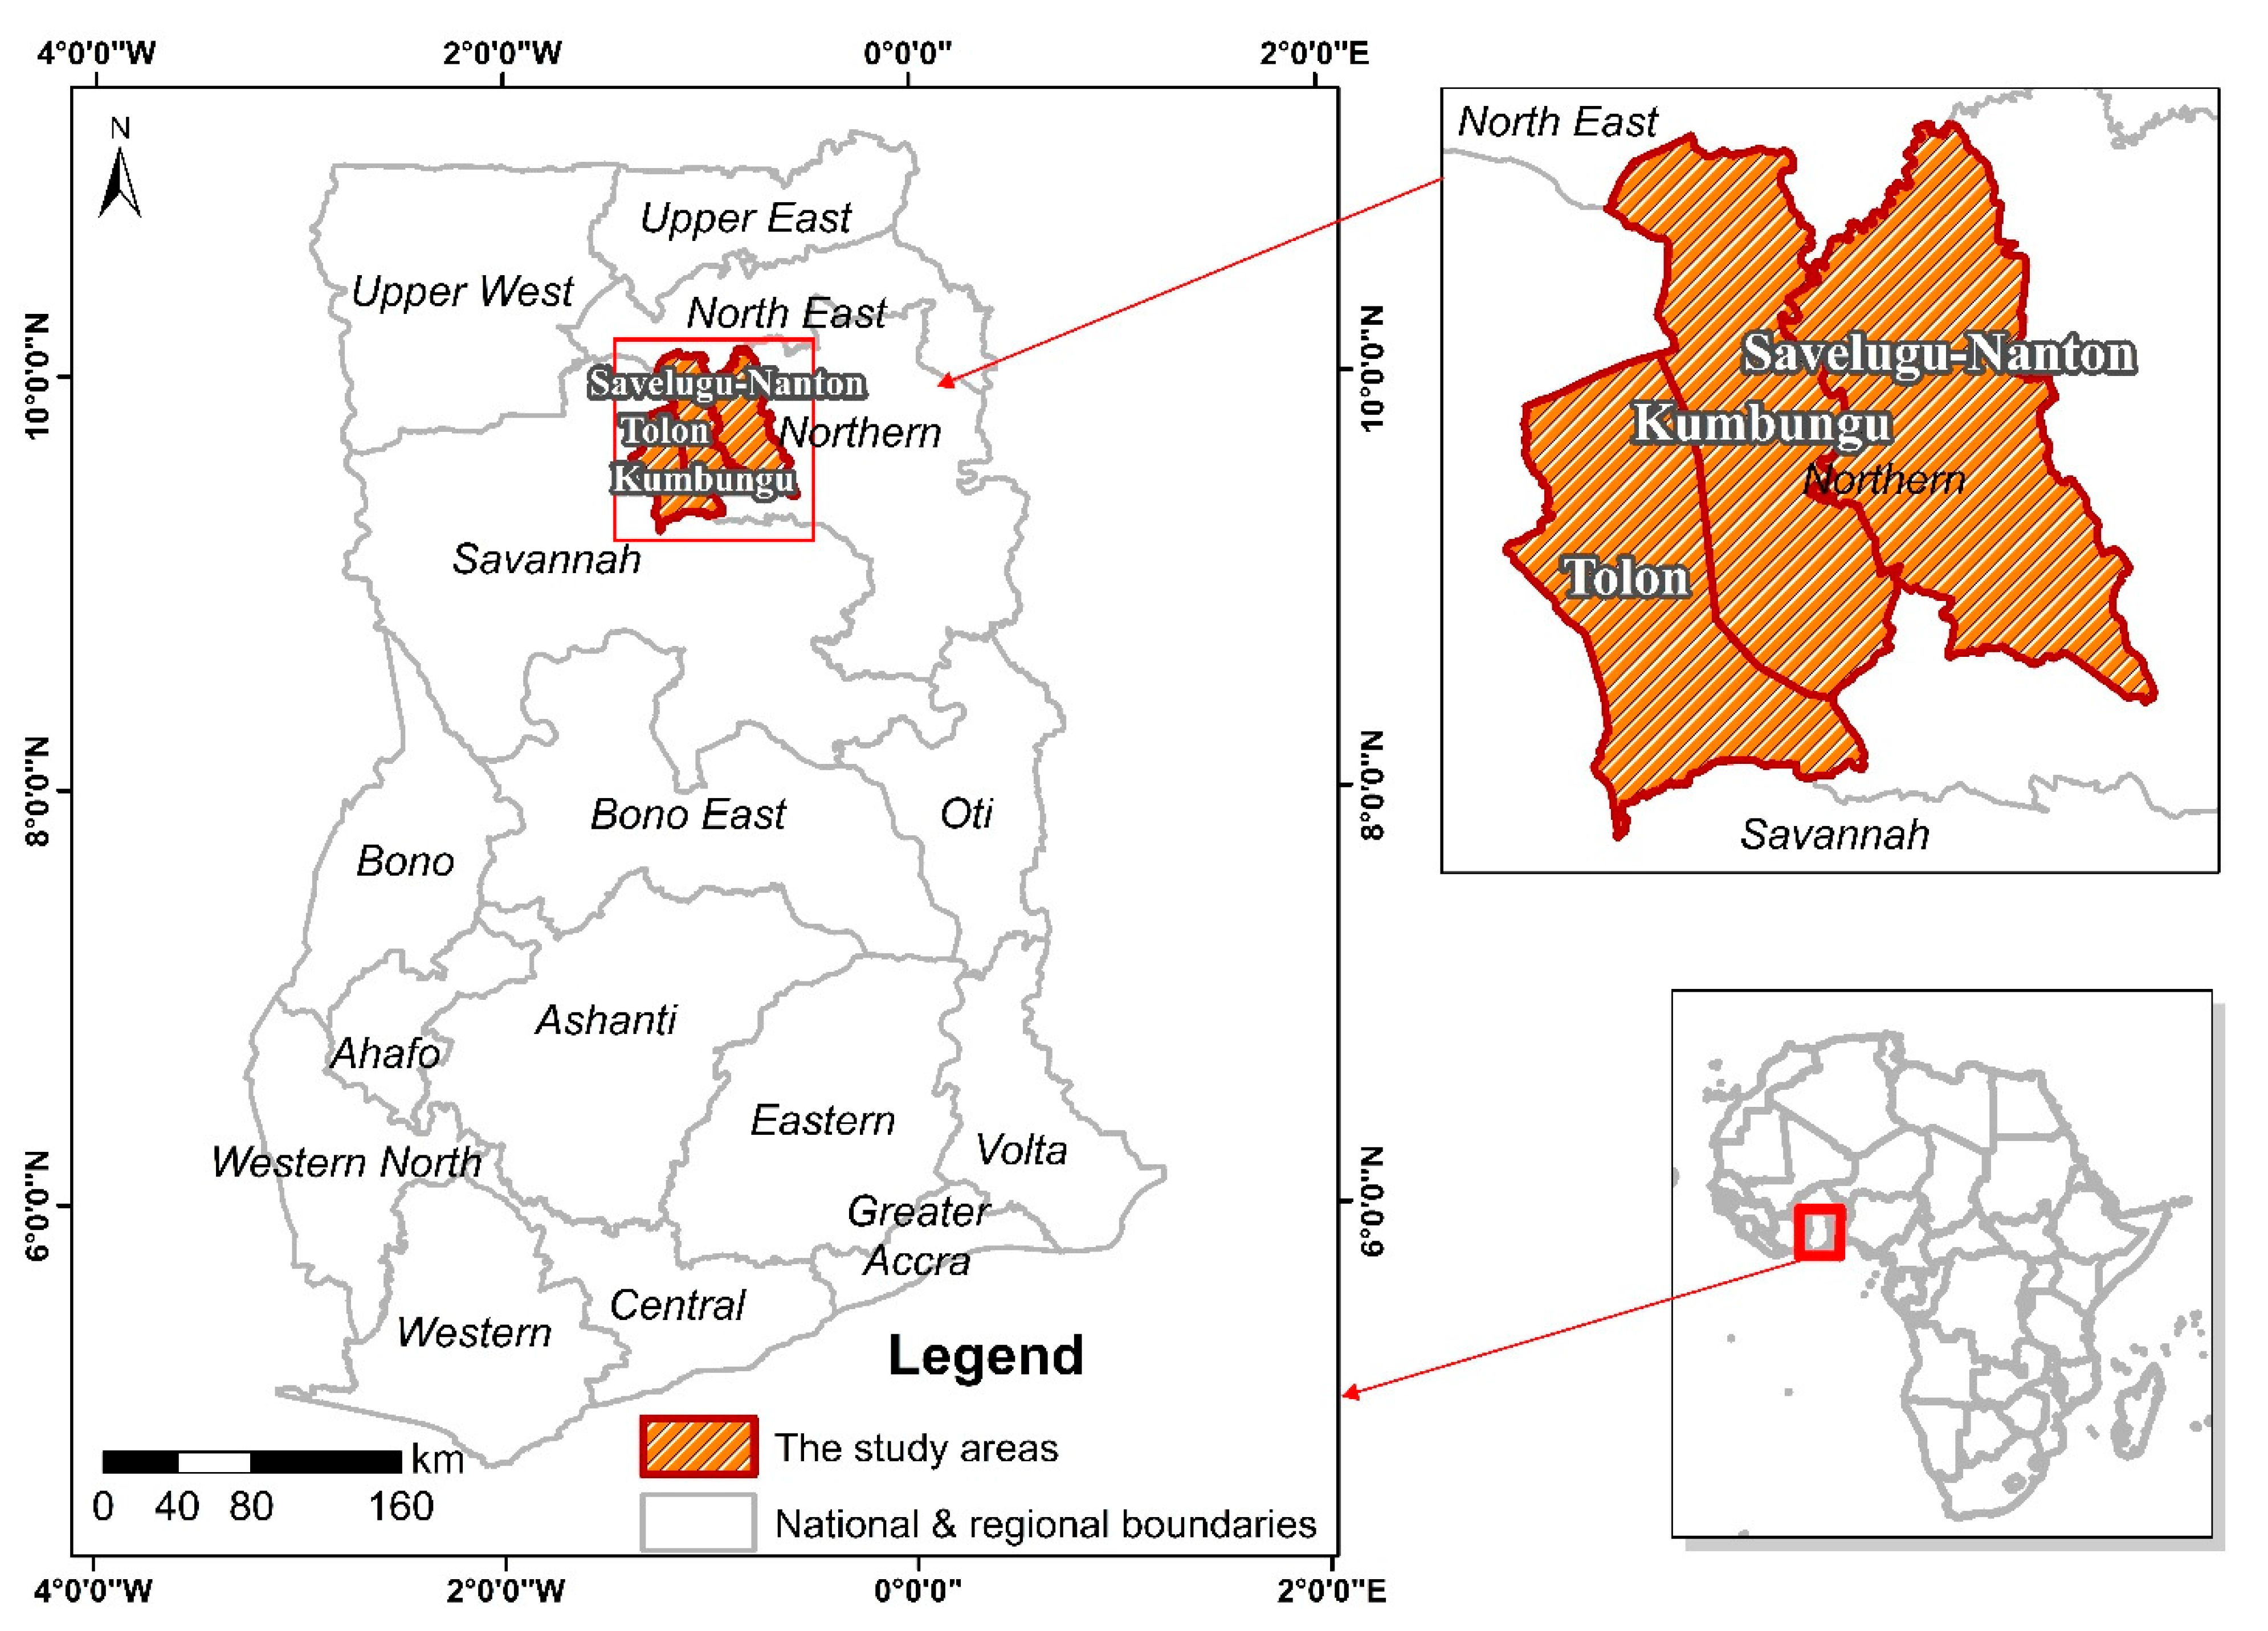
2.1. Description of the Study Area

This study was conducted in three districts; Tolon, Kumbungu and Savelugu-Nanton, of the Northern Region of Ghana (Figure 1). The Tolon and Kumbungu districts lie between latitude 9.25° N and longitude 53.02° W. Annual rainfall is uni-modal, ranging between 950 mm and 1200 mm and occurs from May to October with peaks in July–August. This is followed by a dry season spanning November to March with mean daily temperatures ranging from 33 °C to 39 °C, while the mean night temperature ranges from 20 °C to 25 °C. The Savelugu-Nanton District lies between 9.62° N and –0.82° W. The elevation of the district ranges between 122 and 245 m above sea level. The soils are generally coarse textured, relatively shallow in depth, and with low soil organic carbon content. The dominant soil type is Alfisol (FAO classification) [21,22].
The annual average rainfall ranges from 650 mm to 1600 mm (Figure 2). The district is characterized by high temperatures, with an average of 34 °C. The maximum temperature could rise to as high as 42 °C, with a minimum of 19 °C.
Annual rainfall is marked by a high inter-annual variability that influences crop production. Agriculture in the study area is mainly rain-fed. The majority of the districts’ inhabitants are smallholder farmers (with farm sizes ranging from less than 1 to 2 ha), cultivating a range of cereals (maize, millet, sorghum, and rice) and legumes (cowpea, peanut, and soybean). Additionally, livestock plays an important role in the functioning of the farming system through the use of crop residues as feed, and the provision of manure for farming.

2.2. Agronomic Field Survey and Data Collection

An agronomic survey was conducted from June to October, 2017, to gather reference agronomic and crop management data on soybean in Northern Ghana to calibrate and evaluate the soybean model for local varieties and conditions. The data collection involved ninety (90) farms from seven (7) farming communities within the Tolon/Kumbungu and Savelugu/Nanton districts. Eight (8) lead farmers were selected and trained on data collection and record-keeping. Locally manufactured rain gauges [23] were mounted on the lead farmers’ farms to record rainfall amounts. This was useful in capturing the spatial variation in rainfall, and hence, improving the model output. The soybean fields were monitored throughout the growing season. Data were collected on crop management (variety, planting date, planting density, flowering dates, etc.), rainfall amounts and distribution during the growing season, biomass at flowering, and grain yield data at final harvest. Additional information was collected on soil type and depth, farm size, variety and sources of seed, crop insurance purchase, etc.
The planting window of soybean in the study area spanned from the first week in June to the third week in July 2017 (Figure 3). A follow-up visit was carried out between 10 and 14 September (which is about 6 to 9 weeks into the growing season after planting) to collect aboveground biomass data from a 4 m2 area on each farm, oven-dried to a constant weight to assess plant performance at flowering. In addition, pre-planting soil samples were taken (Table 1). Two varieties, namely, Afayak (63.3%) and Jenguma (36.7%), were cultivated.

2.3. Calibration of the DSSAT CROPGRO Module for Soybean

Calibration of the two varieties (Afayak: TGX 1834-5E and Jenguma: Tax 1445-2E; both—maturing between 105 and 115 days) which are widely used in Northern Ghana [24] was performed using information from eighteen farms (18; 8 farms that cultivated Afayak and 10 farms that cultivated Jenguma) in different communities in the Northern Region of Ghana during the 2017 growing season for the Decision Support System for the Agro-technology Transfer (DSSAT v. 4.6) crop model. Both varieties are determinate, resistant to pod shattering, lodging, and pest infestation. They are also effective in the control of Striga hermonthica [25] . Data on crop management such as planting dates and densities, crop phenology (flowering and maturity dates), crop growth (biomass at flowering), and grain yield at harvest were collected. Other weather parameters, including solar radiation and temperature (maximum and minimum), were obtained from the National Aeronautics and Space Administration (NASA-POWER) website using the GPS coordinates taken from the farms. Soil information (Table 1) was also used as an input for the DSSAT CROPGRO model. The soil profile data were taken 2 weeks prior to sowing. Soil organic carbon (OC) was determined following the procedure developed by Walkely and Black [26]. The pH of the soils was determined in 1:10 soil-to-water suspensions. For bulk density (BD), the core sampler method was used as described by Blake and Hartge [27]. Soil moisture at wilting point, field capacity, and saturation were determined as described by Hoogenboom et al. [28]. Model calibration was conducted first with crop phenology, followed by growth, and finally, yield parameters.

2.4. Evaluation of the DSSAT CROPGRO Module for Soybean

Management information from 49 farms which were cultivated with Afayak and 23 farms which were cultivated with Jenguma were used for the model evaluations. The genetic coefficients obtained during calibration are presented in Table 2.

2.5. Evaluation of the DSSAT CROPGRO Module for Soybean

For the period 1980 to 2009, the 30-year historical baseline weather data were obtained from the Ghana Meteorological Agency and used to build future climate scenarios based on the modified delta methodology, as described in [29,30]. The baseline data consisted of daily minimum and maximum temperature, daily rainfall amount, and solar radiation. The future, mid-century climate scenarios (2040–2069) were selected from a list of 29 GCMs that adequately captured the West African climate [31] under two representative concentration pathways (RCPs), namely, RCP 4.5 and RCP 8.5. The ambient atmospheric CO2 concentration used in the study was 390 ppm for the baseline period. RCP 4.5 used 499 ppm CO2 concentration, whereas RCP 8.5 used 571 ppm. For each RCP, a scatterplot of all 29 GCMs was derived based on the differences in temperature and rainfall amount (also considering the number of rainy days) over the growing season (June–September) (Figure 4). The median of the GCMs under each quadrant and the middle GCM were then selected to represent 5 plausible climate scenarios, namely, cool/wet, cool/dry, middle, hot/wet, and hot/dry scenarios.

2.6. Assessment of Model Performance

Various statistical criteria were used to assess the ability of the model to reproduce observed crop phenology, biomass yield at flowering, and grain yield at maturity. These include the root mean squared error (RMSE), relative root mean square error (RRMSE) [32], mean absolute error (MAE) [32], Willmott d-value [33], Nash–Sutcliffe modeling efficiency (EF) [34], and coefficient of determination (R2).

2.7. Assessing Climate Change Impact and Variability

To assess the impact of climate change among soybean farms in the study area, agronomic data described in Section 2.2 for the 90 farms were used together with soil data presented in Table 1 to set up simulations using the DSSAT-CROPGRO model. The simulations were performed with 30 years of historical weather data (1980–2009) as the reference years, while 5 projected GCM data values from 30 years (2040–2069) per each RCP (4.5 and 8.5) were used as projected climate data. The outputs of the simulations were then used to estimate climate change impacts on the yield of soybean (dijk) of each farm (i = 90) under each GCM (j = 5), and RCP (k = 2). The climate change impact was defined as in Equation (1):
d i j k ( % ) = 100 × ( f u t u r e   X ¯ i j k h i s t o r i c a l   X ¯ i H i s t o r i c a l   X ¯ i )
where the average grain yield is denoted as X ¯ . The overall average impact of climate change ( Δ j k ) on soybean grain yield under each climate scenario and RCP was estimated in Equation (2) as:
Δ j k ( % ) = i = 1 n d i j k N
where N is the total number of farms. Variability in climate change impact across farms (hh) due to differences in management practices (Vm) was estimated as in Equation (3):
V m = ( 1 h i = 1 y ( X h h i X ¯ h h ) 2 ) X ¯
where y is years. Variability in climate change impact due to inter-annual differences in weather parameters (Vw) was estimated as shown in Equation (4):
V w = ( 1 y i = 1 h h ( X y i X ¯ y ) 2 ) X ¯

2.8. Assessing the Impact of Climate Parameters

Changes in yield relative to the respective changes in each of the two main weather parameters (rainfall and temperature) were evaluated to determine the sensitivity of yield to the respective changes in each of the parameters.

3. Results

3.1. Model Calibration

The durations from emergence to flowering for both cultivars were calibrated with RMSE values of 2.9 and 2.3 days and RRMSE values of 6.4% and 5.2% for Afayak and Jenguma, respectively. The duration from emergence to maturity was also calibrated with RMSE values of 4.1 and 4.0 days and RRMSE values of 3.9% and 3.7% for Afayak and Jenguma, respectively. The calibration statistics for biomass at flowering and final grain yield of the two cultivars are presented in Table 3. The model adequately captured the observed biomass produced at flowering for the two cultivars with d-values of 0.99 and 0.95 for Afayak and Jenguma, respectively. The final grain yield was well calibrated with d-values of approximately 0.87 and above and RRMSEs below 28%.

3.2. Evaluation of Model Performance

The evaluation statistics for final grain yield of the two cultivars are presented in Table 4 and Figure 5. The model adequately captured observed grain yield for the two cultivars with d-values of 0.83 and 0.86 for Afayak and Jenguma, respectively. The final grain yield was well calibrated with RRMSE values below 30%.

3.3. Analysis of Climate Data

The changes in daily temperature, annual rainfall, and rainfall events were analyzed to ascertain the similarities and differences between the baseline and the projected weather. All the GCMs generally projected higher temperatures compared with the baseline with increases ranging from 1.15 (IPSL-CM5B-LR) to 2.19 °C (BNU-ESM) and 1.73 (GFDL-ESM2) to 3.23 °C (HadGEM2-ES) under RCP 4.5 and 8.5, respectively (Figure 6).
Annual rainfall over the 30-year period ranged from 695 to 1580 mm, with an average of 1062 mm. Percentage change in the amount of rainfall ranged from −3.97% to 2.17% under RCP 4.5 and −7.21% to 9.51% for RCP 8.5 (Figure 7).
Rainfall was counted as an event if a minimum value of 2.5 mm rainfall was observed. The number of rainy days ranged from 40 to 77 days across the years. All the GCMs projected a reduced number of rainfall events, except the Middle scenario (CESMI-BGC and GFDL-ESM2) under both RCPs, which projected a marginal increase in the number of rainy days (Figure 8). Reductions ranged from 7 days to an increase of 1 day under RCP 4.5 and −10 to an increase of 3 days for RCP 8.5. The dry scenarios recorded the highest reductions under both RCPs.

3.4. Spatial Grain Yield and Variability

Simulated grain yield distribution under both ambient and elevated CO2 conditions and two RCPs are presented in Figure 9. The simulated baseline mean grain yield of soybean among farms was 2093 kg/ha, with a variability of 19%. Under a climate change scenario assuming ambient CO2 concentrations under RCP 4.5, the mean grain yield among farms ranged from 1919 kg/ha to 2019 kg/ha. Under elevated CO2 concentrations, yield increased to between 2416 and 2528 kg/ha.
The variability in grain yields among farms under RCP 4.5 was between 18% and 23% and 16% and 21% with and without elevated CO2 concentrations, respectively. In both cases, the hot wet scenario yielded the highest variability and lowest mean grain yields. Under RCP 8.5, simulated grain yields assuming ambient CO2 resulted in yield declines as with RCP 4.5; thus, the distribution of yields under all GCMs were to the left (towards lower grain yields) of that of the baseline yields (Figure 9). As with RCP 4.5, the hot wet climate scenarios yielded the lowest mean grain yield among the climate scenarios irrespective of CO2 concentration used, while the middle scenarios exhibited the highest grain yield. Simulated grain yields were between 1842 and 2011 kg/ha under ambient CO2 concentrations and between 2497 and 2717 kg/ha under elevated CO2 concentrations. Variability in grain yields was generally higher under ambient CO2 conditions (17–26%) than under elevated CO2 concentrations (15–24%).

3.5. Temporal Grain Yield and Variability

Simulated inter-annual grain yield ranged between 1913 kg/ha under the hot and wet climate scenario (HadGEM2-AO) to 2019 kg/ha under the hot dry climate scenario (BNU-ESM), assuming ambient CO2 concentrations under RCP 4.5 conditions. Under elevated CO2 concentrations, grain yield ranged from 2410 kg/ha under the hot/wet climate scenario (HadGEM2-AO) to 2527 kg/ha in the hot dry climate scenario (BNU-ESM). Thus, grain yields were higher under elevated CO2 concentrations. Inter-annual variability in yields within the various climate scenarios were low, ranging from 10.1% to 11.4% under both ambient and elevated CO2 conditions, respectively.
Under RCP 8.5 and ambient CO2 conditions, inter-annual grain yields were generally marginally lower than those obtained under RCP 4.5, with yields ranging between 1842 kg/ha (hot/wet: CanESM2) to 2009 kg/ha (middle: GFDL-ESM). Inter-annual variability in grain yield among the climate scenarios under RCP 8.5 was as equally low as with RCP 4.5, ranging from 9.8% to 14.5% and from 9.7% to 14.4% under ambient and elevated CO2 conditions, respectively.

3.6. Climate Change Impact on Soybean Grain Yields

Simulated soybean yields declined relative to the baseline yields under ambient CO2 conditions under both RCP 4.5 and 8.5. Under RCP 4.5, yield declines were between 3.0% and 9.2% among the climate scenarios, representing a difference in yield of 6.2% between the two extreme climate scenarios. Under RCP 8.5, grain yield decline was generally higher than that obtained under RCP 4.5, ranging from 3.5% to 13.5%. This indicated differences in yield of about 10% between the two extreme climate scenarios (Figure 10).
Under elevated CO2 conditions, simulated grain yields increased relative to baseline yields under both RCP 4.5 and 8.5. Grain yields increased by between 14.8% and 22.0% (hot/wet and hot/dry scenarios, respectively), indicating a difference of about 7.2% in mean yield change between the two extreme climate scenarios under RCP 4.5. Grain yield increases were generally higher under RCP 8.5 than under RCP 4.5 due to the higher CO2 projection under RCP 8.5. Simulated mean yield increases were between 18.0% and 31.3% (hot/wet and middle scenarios, respectively). This represents about a 13.3% difference in the mean yield change between the two extreme climate scenarios under RCP 8.5.

3.7. Variability in Climate Change Impact among Farms

The impact of climate change among farms was diverse irrespective of CO2 concentration and climate scenario. The relative standard deviation (RSD) in climate change impact among farms under ambient CO2 conditions ranged between 18% and 23% across the climate scenarios under RCP 4.5. The RSDs were generally higher under RCP 8.5, with values ranging between 17% and 26%. Under elevated CO2 conditions, the simulated variability in climate change impact among farms was generally lower than those simulated under the ambient CO2 conditions. The RSD under RCP 4.5 with elevated CO2 ranged from 20% to 31% (cool/dry and hot dry scenarios, respectively) and from 18% to 35% (cool/wet and hot/wet scenarios, respectively) for ambient CO2. Generally, the hot scenarios exhibited higher spatial variability than the cool scenarios.

3.8. Inter-Annual Variability in Climate Change

The variation in climate change impact was noticeable among the 30-year data used under elevated CO2 concentration. The RSD due to inter-annual variation in weather parameters was higher under RCP 8.5 than under RCP 4.5 (from 10% to 11% for RCP 4.5 and from 10% to 14% for RCP 8.5). For both RCPs, the hot wet scenarios exhibited the highest variability in climate change impact. Under ambient CO2 concentration, inter-annual variation in climate change impact was from 10% to 11% for RCP 4.5 and between 10% and 15% for RCP 8.5. As with elevated CO2 concentrations, the hot climate scenarios generally exhibited higher variability compared with relatively cool scenarios.

3.9. Sources of Variations in Climate Change Impact among Farms

Analysis of variance revealed that soil type, sowing window, cultivar and their interactions markedly influenced the variation in climate change impact among farms in this study under both CO2 scenarios. Irrespective of CO2 concentration and RCP used, soil type contributed most to the variability in climate change impact among farms (with RSD values ranging from 6% to 150%). The magnitude of the RSD was, however, much higher for the simulations under ambient CO2 condition (Figure 11). The contribution of the differences in sowing windows also contributed markedly to variability in climate change impact among farms under both RCP and CO2 scenarios. The contributions of cultivars to the variability were, however, marginal under both RCPs under elevated CO2 concentrations. The RSD of cultivar ranged between 0 and 11 across RCPs under ambient CO2 conditions and between 0% and 4% under elevated CO2 conditions.

3.10. Relationship between Changes in Grain Yield, Temperature, and Rainfall Amount

Under the same temperature change, the magnitude of change in yield varied, implying that other factors such as time of planting impacted on the magnitude of changes in yields under climate change. However, as temperature increased, the variation in yield changes also increased, irrespective of the CO2 concentration (Figure 12). The relationship between the projected differences in rainfall amount and grain yield changes (Figure 13) was rather weak compared with that of temperature. There was a higher diversity in the differences in rainfall amount under RCP 8.5 than under RCP 4.5, which may have contributed to the higher diversity in grain yield and climate change impacts among farms.

4. Discussion

4.1. Model Performance

Soybean is becoming an increasingly important and promising cash crop in Ghana, particularly in Northern Ghana, where it provides additional benefits of nutritional support for smallholder communities in addition to its cash benefit, hence the motivation to assess the impact of projected climate change on its yield. The CROPGRO simulation model was able to adequately capture the phenology and yield pattern for the two soybean varieties investigated in this study. Recently, Bebeley et al. [35] reported that the CROPGRO model adequately reproduced grain yields of three soybean varieties of varying maturity duration in northern Nigeria. Naab et al. [36] successfully calibrated and evaluated the CROPGRO model to simulate peanut yields in Northern Ghana. The two soybean varieties investigated in this study are widely cultivated in Northern Ghana, and hence, are appropriate for assessments of climate change impacts on soybean yield for this region. The choice of CROPGRO in this study was informed by its good performance (least error in predicting seed yield) in a recent study by Kothari et al. [37] that used 10 crop models to test their readiness for climate change impact assessment.

4.2. Baseline Grain Yields

On the whole, soybean yields under the contemporary climate vary in response to differences in management practices (cultivar, time of planting, etc.), as illustrated in the variation in yields among farmers. The simulated average yield of 2.3 t ha−1 across farms and years is comparable to the average grain yield of 2.2 t ha−1 obtained from the agronomic survey. These yields are, however, above a typical farmer’s average yield for the study region, but within the values reported by Ulzen et al. [38]. There is a growing middle class in the subregion, with the consequent growing demand for animal products, which rely heavily on soy cake for feeding. Thus, there has been rapid growth in the production of soybean in the subregion even outside the two traditional soybean producing countries (Nigeria and South Africa) that contribute to about 70% of the grain in Africa: Ghana is no exception. Given the growing importance of the grain for many other products in the subregion, it is imperative to assess its sensitivity to projected climate change so as to plan strategies to adapt to changing climate.

4.3. Climate Change Impact on Grain Yield

To the best of our knowledge, this study is one of the few conducted within the West African subregion that has assessed the sensitivity of soybean productivity to projected climate. Until now, only Tingem and Rivington [39] have reported on climate change impacts on soybean within the subregion. In this study, the impact of two (2) climate parameters on soybean yields under projected climate were studied, as well as the variability of the impact among farms and years. These include changes in the amount and distribution of rainfall, increased temperature as well as increased CO2 concentration. As observed even under the current climate, unfavorable rainfall amounts and distributions negatively impact on yields of soybean, as is the case for other crops. Unfavorable rainfall distribution leads to drought stress, which consequently translates into yield loss. The extent of yield loss, however, depends on the growth stage of the crop and the duration of the stress. In the current study, given that planting dates varied, the extent of the impact of change in rainfall distribution also varied among farms based on differences in the date of planting. Another important driver is elevated temperature, which negatively impacted plant growth, largely by reducing phenology, and hence, the amount of resources taken up by plants thereby resulting in yield decline. Additionally, elevated temperature results in a higher vapor pressure deficit (VPD), leading to increased transpiration. Thus, the normal physiology of plants is altered with plant resources that would contribute to the yield being partly used to maintain plant metabolic activities such as increased transpiration. A recent screen house study by Ogunkanmi et al. [40] on the effect of extreme temperature and moisture stress on the productivity of soybean indicated significant yield losses under high temperature. The yield losses were further accentuated under moisture stress conditions.
On the other hand, elevated CO2 has a counter impact on soybean yield, as observed in the current study. Implications of the effect of elevated CO2 on soybean yield under current production systems cannot be overemphasized, as it influences the direction of change in soybean yield under projected climate conditions. Unlike cereals in which elevated CO2 may not necessarily result in projected yield increases, particularly in the West African subregion where the soils are limited in vital nutrients such as N [41,42], soybean as a legume does not have that limitation due to its N fixing capability. Increased yields are explained by the reduction in transpiration (due to the partial closure of stomata), leading to increased resistance to drought [43], and hence, increased water use efficiency. Thus, elevated CO2 and temperature had opposing impact on soybean yields in this study, with the effect of the elevated CO2 over-riding the negative effect of temperature (Figure 8). Tingem and Rivington [39] reported grain yield increases of between 6% and 162% (across the varied climate scenarios), which they attributed to elevated CO2 and increased amounts of rainfall (which offset the negative impacts of increased temperature).
What remains unclear is whether the nutritional values will be compromised under climate change. A number of studies have reported on the reduced nutrient contents of crops, including soybean, under projected climate change conditions, and attributed this to the effect of elevated CO2. Studies carried out by Smith et al. [44] in the United States, Australia, and Japan showed decline (3% to 17%) in nutrient content of major crops under free air CO2-enhanced experiments. The effects varied among the crops, with large-grained cereals (maize and sorghum) showing no significant change in nutrient composition. They attributed this to the photosynthesis mechanism in C4 plants which does not respond to CO2 enrichment, and hence, did not affect nutrient uptake. For soybean, declines in zinc and iron were observed, whereas the protein content of the grain exhibited little to no change [35]. This study did not assess the nutritional composition of soybean under climate change, largely due to the unavailability of reliable data on the varieties of soybean considered. It is important to note that the current study did not capture the potential effect of pests and diseases on the productivity of soybean under climate change scenarios. The soybean varieties used in the study are reported to be resistant to pests and diseases under the current production system, although they may succumb under future climate. Skendži et al. [45], in their review of climate change impacts on agricultural insect pests, indicated that the impacts on pest and disease outbreaks are complex and will vary depending on the environment. They projected that locations in the tropics are less likely to be adversely impacted compared with those in temperate environments which may become more favorable for pests, particularly due to projected rises in temperature. The spread and severity of pests and plant diseases is largely influenced by weather parameters [46]. Thus, climate change will influence the dynamics in the spread and distribution of pests and plant diseases, and the emergence of new ones [47]. Future studies should consider integrating the effect of pests and plant diseases in analyzing impacts due to climate change on crop productivity so as to inform breeding for more resistant varieties. Additionally, the use of inorganic fertilizer is not a common practice in the current production system in the subregion; hence, it was not considered in this study.

4.4. Spatial vs. Temporal Variability in Climate Change Impact

In this study, there was higher variation among farms compared with inter-annual variation. The main factors identified to be responsible for the observed variability among farms were the type of soybean cultivar, planting date, and soil type. As a remedy, the issues of cultivar type and planting date could be addressed through enhanced extension services to farmers on the most appropriate or optimal planting windows, as well as appropriate cultivars for attaining good yields. The influence of appropriate management practices cannot be overemphasized, particularly in smallholder systems where it may be even more important than climate change impacts [48]. Similar results were previously reported by Freduah et al. [49] and MacCarthy et al. [50] for maize productivity under current and future agricultural production systems. Mall et al. [20], in their study on mitigating climate change impacts on soybean productivity in India, suggested the appropriate determination of optimal planting windows as a mitigating strategy to manage the negative impacts of climate change on soybean productivity. Concerted efforts to provide extension officers with the appropriate research findings and resourcing them to reach out to farmers will be important in mitigating climate change effects on soybean productivity. Additionally, investments into climate services infrastructure that can support in-season forecasts to inform the planning of farm activities such as sowing can help to narrow sowing windows to the most productive periods, and hence, reduce variability in grain yield.
Sources of variation in climate change impact on soybean yield under current production systems as reported in the literature are many and attributed to the choice of climate model and location of study, with its associated weather and soil characteristics, among others. In this study, another dimension has been brought to light which has thus far received little to no attention. Thus, the variability in yields among farms is large, and is more important than the variability in inter-annual yield; hence, it deserves more attention. The dominant factors identified in this study as contributing factors to the large variations in climate change impacts among farms are, in decreasing order; soil type, planting dates, and variety. Soils in Northern Ghana are generally loose-textured and characteristically low in water-holding capacity, with a pronounced spatial variability in soil properties [22,51]. Interestingly, the top three harshest climate scenarios exhibited the largest relative standard deviation. Additionally, the extent of variation in climate change impact was significantly reduced under elevated CO2 conditions, a phenomenon that could be explained by the effect of elevated CO2 in increasing water use efficiency, thereby reducing potential water stress under elevated CO2 concentrations.

5. Conclusions

This study provides insights into spatial and temporal variability in soybean yield in two districts situated in the Northern Region of Ghana under both current and projected climate conditions. Understanding sources of variation in soybean yield provides a pathway for the optimal management of soybean production under both current and future climate change. Climate change will negatively impact the productivity of soybean in Northern Ghana. However, elevated atmospheric carbon dioxide has the potential to off-set the reduction in yield caused by climate change, resulting in increased productivity. The effect of climate change on yield productivity varied widely among farms and among years. The variability among farms (due to diversity in management practices and soil type) was more important than that among years (due to differences in weather parameters). This calls for more attention to be directed at the extension of good management practices to farmers so as to reduce the variability of impact among farms. The extent of this variability could be influenced by elevated atmospheric CO2 levels.

Author Contributions

Conceptualization, D.S.M., S.G.K.A. and B.S.F.; methodology, D.S.M., S.G.K.A. and B.S.F.; formal analysis, D.S.M., S.G.K.A. and B.S.F.; investigation, D.S.M., S.G.K.A. and S.K.K.; resources, P.S.T. and D.S.M.; data curation, B.S.F.; writing—original draft preparation, D.S.M. and B.S.F.; writing—review and editing, D.S.M., S.G.K.A., B.S.F., P.S.T., D.E.D. and S.K.K.; visualization, D.S.M., B.S.F., D.E.D. and S.K.K.; project administration, D.S.M. and P.S.T.; funding acquisition, D.S.M. and P.S.T. All authors have read and agreed to the published version of the manuscript.

Funding

This research was funded by the CGIAR Research Program on Climate Change, Agriculture and Food Security (CCAFS), which is carried out with support from CGIAR Fund Donors and through bilateral funding agreements.

Data Availability Statement

The data presented in this study are available on request from the corresponding author.

Conflicts of Interest

The authors declare no conflict of interest.

References

  1. MacCarthy, D.S.; Adiku, S.G.; Kamara, A.Y.; Freduah, B.S.; Kugbe, J.X. The role of crop simulation modeling in managing fertilizer use in maize production systems in northern Ghana. In Enhancing Agricultural Research and Precision Management for Subsistence Farming by Integrating System Models with Experiments; Timlin, D.J., Saseendran, S.A., Eds.; John Wiley & Sons, Inc.: Hoboken, NJ, USA, 2022; pp. 48–68. [Google Scholar] [CrossRef]
  2. Asodina, F.A.; Adams, F.; Nimoh, F.; Weyori, E.A.; Wongnaa, C.A.; Bakang, J.E.-A. Are non-market benefits of soybean production significant? An extended economic analysis of smallholder soybean farming in Upper West region of northern Ghana. Agric. Food Secur. 2020, 9, 1–13. [Google Scholar] [CrossRef]
  3. Dankwa, P.; Cudjoe, E.; Amuah, E.E.Y.; Kazapoe, R.W.; Agyemang, E.P. Analyzing and forecasting rainfall patterns in the Manga-Bawku area, northeastern Ghana: Possible implication of climate change. Environ. Chall. 2021, 5, 100354. [Google Scholar] [CrossRef]
  4. MacCarthy, D.S.; Adiku, S.G.; Freduah, B.S.; Gbefo, F.; Kamara, A.Y. Using CERES-Maize and ENSO as decision support tools to evaluate climate-sensitive farm management practices for maize production in the northern regions of Ghana. Front. Plant Sci. 2017, 8, 31. [Google Scholar] [CrossRef] [PubMed] [Green Version]
  5. Guy, C.; Kaplan, F.; Kopka, J.; Selbig, J.; Hincha, D.K. Metabolomics of temperature stress. Physiol. Plant. 2008, 132, 220–235. [Google Scholar] [CrossRef] [PubMed]
  6. Kotak, S.; Larkindale, J.; Lee, U.; von Koskull-Döring, P.; Vierling, E.; Scharf, K.-D. Complexity of the heat stress response in plants. Curr. Opin. Plant Biol. 2007, 10, 310–316. [Google Scholar] [CrossRef]
  7. Köhler, I.H.; Huber, S.C.; Bernacchi, C.J.; Baxter, I.R. Increased temperatures may safeguard the nutritional quality of crops under future elevated CO2 concentrations. Plant J. 2019, 97, 872–886. [Google Scholar] [CrossRef] [PubMed] [Green Version]
  8. Sentelhas, P.C.; Battisti, R.; Câmara, G.; Farias, J.; Hampf, A.; Nendel, C. The soybean yield gap in Brazil–magnitude, causes and possible solutions for sustainable production. J. Agric. Sci. 2015, 153, 1394–1411. [Google Scholar] [CrossRef] [Green Version]
  9. Seddigh, M.; Jolliff, G.D. Physiological Responses of Field-Grown Soybean Leaves to Increased Reproductive Load Induced by Elevated Night Temperatures 1. Crop Sci. 1984, 24, 952–957. [Google Scholar] [CrossRef]
  10. Hatfield, J.L.; Boote, K.J.; Kimball, B.A.; Ziska, L.; Izaurralde, R.C.; Ort, D.; Thomson, A.M.; Wolfe, D. Climate impacts on agriculture: Implications for crop production. Agron. J. 2011, 103, 351–370. [Google Scholar] [CrossRef]
  11. Sultan, B.; Gaetani, M. Agriculture in West Africa in the twenty-first century: Climate change and impacts scenarios, and potential for adaptation. Front. Plant Sci. 2016, 7, 1262. [Google Scholar] [CrossRef] [Green Version]
  12. MacCarthy, D.S.; Hathie, I.; Freduah, B.S.; Ly, M.; Adam, M.; Ly, A.; Nenkam, A.; Traore, P.S.; Valdivia, R.O. Potential impacts of agricultural intensification and climate change on the livelihoods of farmers in Nioro, Senegal, West Africa. In Handbook of Climate Change and Agroecosystems: Climate Change and Farming System Planning in Africa and South Asia: AgMIP Stakeholder-Driven Research, Part 2; World Scientific: Singapore, 2021; pp. 3–31. [Google Scholar]
  13. Asante, F.A.; Amuakwa-Mensah, F. Climate change and variability in Ghana: Stocktaking. Climate 2014, 3, 78–101. [Google Scholar] [CrossRef] [Green Version]
  14. Yuzbashkandi, S.S.; Khalilian, S. On projecting climate change impacts on soybean yield in Iran: An econometric approach. Environ. Process. 2020, 7, 73–87. [Google Scholar] [CrossRef]
  15. Nadeem, M.; Li, J.; Yahya, M.; Sher, A.; Ma, C.; Wang, X.; Qiu, L. Research progress and perspective on drought stress in legumes: A review. Int. J. Mol. Sci. 2019, 20, 2541. [Google Scholar] [CrossRef] [PubMed] [Green Version]
  16. Boote, K.; Jones, J.; Hoogenboom, G.; Pickering, N. The CROPGRO model for grain legumes. In Understanding Options for Agricultural Production; Springer: Berlin/Heidelberg, Germany, 1998; pp. 99–128. [Google Scholar]
  17. Adhikari, U.; Nejadhashemi, A.P.; Woznicki, S.A. Climate change and eastern Africa: A review of impact on major crops. Food Energy Secur. 2015, 4, 110–132. [Google Scholar] [CrossRef]
  18. Reis, L.; Santos e Silva, C.M.; Bezerra, B.; Mutti, P.; Spyrides, M.H.; Silva, P.; Magalhães, T.; Ferreira, R.; Rodrigues, D.; Andrade, L. Influence of climate variability on soybean yield in Matopiba, Brazil. Atmosphere 2020, 11, 1130. [Google Scholar] [CrossRef]
  19. Bhatia, V.; Singh, P.; Wani, S.; Chauhan, G.; Rao, A.K.; Mishra, A.; Srinivas, K. Analysis of potential yields and yield gaps of rainfed soybean in India using CROPGRO-Soybean model. Agric. For. Meteorol. 2008, 148, 1252–1265. [Google Scholar] [CrossRef] [Green Version]
  20. Mall, R.; Lal, M.; Bhatia, V.; Rathore, L.; Singh, R. Mitigating climate change impact on soybean productivity in India: A simulation study. Agric. For. Meteorol. 2004, 121, 113–125. [Google Scholar] [CrossRef]
  21. Brammer, H. Soils of Ghana. In Agriculture and Land Use in Ghana; Wills, J.B., Ed.; Oxford University Press: London, UK, 1962. [Google Scholar]
  22. MacCarthy, D.S.; Adiku, S.G.; Freduah, B.S.; Kamara, A.Y.; Narh, S.; Abdulai, A.L. Evaluating maize yield variability and gaps in two agroecologies in northern Ghana using a crop simulation model. S. Afr. J. Plant Soil 2018, 35, 137–147. [Google Scholar] [CrossRef] [Green Version]
  23. World Meteorological Organization (WMO). Local Manufactured Farmer Rain Gauges in Mali. Available online: https://library.wmo.int/pmb_ged/iom_116_en/Session%201/P1_24_Konate_LocalManufFarmerRainGaugesMali.pdf (accessed on 30 September 2022).
  24. Buah, S.S.J.; Ibrahim, H.; Derigubah, M.; Kuzie, M.; Segtaa, J.V.; Bayala, J.; Zougmore, R.; Ouedraogo, M. Tillage and fertilizer effect on maize and soybean yields in the Guinea savanna zone of Ghana. Agric. Food Secur. 2017, 6, 1–11. [Google Scholar] [CrossRef]
  25. African Plant Nutrition Institute (APNI) and Savanna Agricultural Research Institute (SARI). Soybean Cropping Guide 4R Nutrient Management and Best Agronomic Practices Northern Ghana. Available online: https://www.apni.net/wp-content/uploads/2022/07/4R-Soybean-Guide-0706.pdf (accessed on 30 September 2022).
  26. Walkley, A.; Black, I.A. An examination of the Degtjareff method for determining soil organic matter, and a proposed modification of the chromic acid titration method. Soil Sci. 1934, 37, 29–38. [Google Scholar] [CrossRef]
  27. Blake, G.R.; Hartge, K. Particle Density. In Methods of Soil Analysis, Part 1. Physical and Mineralogical Methods; Madison, A.K., Ed.; SSSA/ASA: Madison, WI, USA, 1986; Volume 5, pp. 377–382. [Google Scholar]
  28. Hoogenboom, G.; Jones, J.; Wilkens, P.; Porter, C.; Batchelor, W.; Hunt, L.; Boote, K.; Singh, U.; Uryasev, O.; Bowen, W. Decision Support System for Agrotechnology Transfer Version 4.0: Overview; Univeristy of Hawaii: Honolulu, HI, USA, 2004; Volume 1. [Google Scholar]
  29. Rosenzweig, C.; Jones, J.W.; Hatfield, J.L.; Ruane, A.C.; Boote, K.J.; Thorburn, P.; Antle, J.M.; Nelson, G.C.; Porter, C.; Janssen, S. The agricultural model intercomparison and improvement project (AgMIP): Protocols and pilot studies. Agric. For. Meteorol. 2013, 170, 166–182. [Google Scholar] [CrossRef] [Green Version]
  30. Ruane, A.C.; Goldberg, R.; Chryssanthacopoulos, J. Climate forcing datasets for agricultural modeling: Merged products for gap-filling and historical climate series estimation. Agric. For. Meteorol. 2015, 200, 233–248. [Google Scholar] [CrossRef] [Green Version]
  31. Ruane, A.C.; McDermid, S.P. Selection of a representative subset of global climate models that captures the profile of regional changes for integrated climate impacts assessment. Earth Perspect. 2017, 4, 1–20. [Google Scholar] [CrossRef] [Green Version]
  32. Willmott, C.J.; Matsuura, K. Advantages of the mean absolute error (MAE) over the root mean square error (RMSE) in assessing average model performance. Clim. Res. 2005, 30, 79–82. [Google Scholar] [CrossRef]
  33. Willmott, C.J.; Robeson, S.M.; Matsuura, K. A refined index of model performance. Int. J. Climatol. 2012, 32, 2088–2094. [Google Scholar] [CrossRef]
  34. Nash, J.E.; Sutcliffe, J.V. River flow forecasting through conceptual models part I—A discussion of principles. J. Hydrol. 1970, 10, 282–290. [Google Scholar] [CrossRef]
  35. Bebeley, J.; Kamara, A.; Jibrin, J.; Akinseye, F.; Tofa, A.; Adam, A.; Kamai, N.; Solomon, R. Evaluation and application of the CROPGRO-soybean model for determining optimum sowing windows of soybean in the Nigeria savannas. Sci. Rep. 2022, 12, 1–15. [Google Scholar] [CrossRef]
  36. Naab, J.; Singh, P.; Boote, K.; Jones, J.; Marfo, K. Using the CROPGRO-peanut model to quantify yield gaps of peanut in the Guinean Savanna zone of Ghana. Agron. J. 2004, 96, 1231–1242. [Google Scholar] [CrossRef] [Green Version]
  37. Kothari, K.; Battisti, R.; Boote, K.J.; Archontoulis, S.V.; Confalone, A.; Constantin, J.; Cuadra, S.V.; Debaeke, P.; Faye, B.; Grant, B. Are soybean models ready for climate change food impact assessments? Eur. J. Agron. 2022, 135, 126482. [Google Scholar] [CrossRef]
  38. Ulzen, J.; Abaidoo, R.C.; Mensah, N.E.; Masso, C.; AbdelGadir, A.H. Bradyrhizobium inoculants enhance grain yields of soybean and cowpea in Northern Ghana. Front. Plant Sci. 2016, 7, 1770. [Google Scholar] [CrossRef] [Green Version]
  39. Tingem, M.; Rivington, M. Adaptation for crop agriculture to climate change in Cameroon: Turning on the heat. Mitig. Adapt. Strateg. Glob. Change 2009, 14, 153–168. [Google Scholar] [CrossRef]
  40. Ogunkanmi, L.; MacCarthy, D.S.; Adiku, S.G. Impact of Extreme Temperature and Soil Water Stress on the Growth and Yield of Soybean (Glycine max (L.) Merrill). Agriculture 2021, 12, 43. [Google Scholar] [CrossRef]
  41. MacCarthy, D.S.; Sommer, R.; Vlek, P.L. Modeling the impacts of contrasting nutrient and residue management practices on grain yield of sorghum (Sorghum bicolor (L.) Moench) in a semi-arid region of Ghana using APSIM. Field Crops Res. 2009, 113, 105–115. [Google Scholar] [CrossRef]
  42. Adiku, S.G.; MacCarthy, D.S.; Hathie, I.; Diancoumba, M.; Freduah, B.S.; Amikuzuno, J.; Traore, P.S.; Traore, S.; Koomson, E.; Agali, A. Climate change impacts on west african agriculture: An integrated regional assessment (CIWARA). The Agricultural Model Intercomparison and Improvement Project (AgMIP) Integrated Crop and Economic Assessments, Part 2. In Handbook of Climate Change and Agroecosystems; ICP Series on Climate Change Impacts, Adaptation and Mitigation; Rosenzweig, C., Hillel, D., Eds.; Imperial College Press: London, UK, 2015; pp. 25–73. [Google Scholar]
  43. Sultan, B.; Defrance, D.; Iizumi, T. Evidence of crop production losses in West Africa due to historical global warming in two crop models. Sci. Rep. 2019, 9, 1–15. [Google Scholar] [CrossRef] [PubMed] [Green Version]
  44. Smith, M.R.; Thornton, P.K.; Myers, S.S. The Impact of Rising Carbon Dioxide Levels on Crop Nutrients and Human Health; International Food Policy Research Institute: Washington, DC, USA, 2018; p. 10. [Google Scholar]
  45. Skendžić, S.; Zovko, M.; Živković, I.P.; Lešić, V.; Lemić, D. The impact of climate change on agricultural insect pests. Insects 2021, 12, 440. [Google Scholar] [CrossRef]
  46. Fand, B.B.; Kamble, A.L.; Kumar, M. Will climate change pose serious threat to crop pest management: A critical review. Int. J. Sci. Res. Publ. 2012, 2, 1–14. [Google Scholar]
  47. Kocmánková, E.; Trnka, M.; Juroch, J.; Dubrovský, M.; Semerádová, D.; Možný, M.; Žalud, Z. Impact of climate change on the occurrence and activity of harmful organisms. Plant Prot. Sci. 2009, 45, S48. [Google Scholar] [CrossRef] [Green Version]
  48. Adam, M.; MacCarthy, D.S.; Traoré, P.C.S.; Nenkam, A.; Freduah, B.S.; Ly, M.; Adiku, S.G. Which is more important to sorghum production systems in the Sudano-Sahelian zone of West Africa: Climate change or improved management practices? Agric. Syst. 2020, 185, 102920. [Google Scholar] [CrossRef]
  49. Freduah, B.S.; MacCarthy, D.S.; Adam, M.; Ly, M.; Ruane, A.C.; Timpong-Jones, E.C.; Traore, P.S.; Boote, K.J.; Porter, C.; Adiku, S.G. Sensitivity of maize yield in smallholder systems to climate scenarios in semi-arid regions of West Africa: Accounting for variability in farm management practices. Agronomy 2019, 9, 639. [Google Scholar] [CrossRef] [Green Version]
  50. MacCarthy, D.S.; Adam, M.; Freduah, B.S.; Fosu-Mensah, B.Y.; Ampim, P.A.; Ly, M.; Traore, P.S.; Adiku, S.G. Climate change impact and variability on cereal productivity among smallholder farmers under future production systems in West Africa. Sustainability 2021, 13, 5191. [Google Scholar] [CrossRef]
  51. Antwi, M.; Duker, A.A.; Fosu, M.; Abaidoo, R.C. Geospatial approach to study the spatial distribution of major soil nutrients in the Northern region of Ghana. Cogent Geosci. 2016, 2, 1201906. [Google Scholar] [CrossRef]
Figure 1. Map showing study sites in northern Ghana, West Africa.
Agronomy 12 02614 g001
Figure 2. Historical (1980–2010) yearly average maximum and minimum temperatures and total annual rainfall of the study site.
Agronomy 12 02614 g002
Figure 3. Distribution of planting dates for soybean in the study area in the 2017 agronomy survey.
Agronomy 12 02614 g003
Figure 4. Scatterplots of changes in precipitation and temperature over the growing season (JJAS—June, July, August, and September) for Tamale, Ghana, for 29 general circulation models (GCM) under 2 representative concentration pathways (RCP), namely, (A) RCP 4.5 and (B) RCP 8.5. The letters denote each of the 29 GCMs that best capture West African weather variability. The 5 dots in each of the 5 clusters of GCM represent the median for the respective cluster. The 5 GCMs selected under RCP 4.5 are: W, CMCC-CMS; Z, IPSL-CM5A-LR; F, CESMI-BGC; Y, HadGEM2-AO; and C, BNU-ESM; and for RCP 8.5: O, MIROC5; Z, IPSL-CM5B-LR; I, GFDL-ESM2; D, CanESM2; and K, HadGEM2-ES.
Agronomy 12 02614 g004
Figure 5. Performance of the DSSAT model in simulating soybean grain yield for evaluation.
Agronomy 12 02614 g005
Figure 6. Projected changes in monthly temperature for 5 general circulation models under two representative concentration pathways (A is RCP 4.5 and B is RCP 8.5) for the period 2040–2069.
Agronomy 12 02614 g006
Figure 7. Projected changes in rainfall amount for 5 general circulation models under two representative concentration pathways (RCP 4.5 and 8.5; A and B respectively) and for the period 2040–2069.
Agronomy 12 02614 g007
Figure 8. Projected change in rainfall events for 5 general circulation models under two representative concentration pathways (A is RCP 4.5 and B is RCP 8.5) for the period 2040–2069.
Agronomy 12 02614 g008
Figure 9. Distribution of simulated grain yield under ambient and elevated CO2 conditions, two RCPs 4.5 (A) and 8.5 (B), each with 5 different climate scenarios.
Agronomy 12 02614 g009
Figure 10. Impact of climate change on simulated soybean yield under (A) ambient and (B) elevated carbon dioxide concentrations, two RCPs (4.5 and 8.5) and 5 different climate scenarios. Each box in the graph shows the distribution of relative yield change across farms. The line within the box marks the median, the dots depict the means.
Agronomy 12 02614 g010
Figure 11. Source of variation for soybean yield under ambient CO2 ((A) RCP 4.5, (B) RCP 8.5) and under elevated CO2 ((C) RCP 4.5 and (D) RCP 8.5).
Agronomy 12 02614 g011
Figure 12. Relationship between average change in temperature over the growing season and the corresponding simulated change in grain yield under (A) RCP 4.5 with ambient CO2, (B) RCP 8.5 with ambient CO2, (C) RCP 4.5 with elevated CO2, and (D) RCP 8.5 with elevated atmospheric CO2 for Tamale, Ghana.
Agronomy 12 02614 g012
Figure 13. Relationship between average change in total rainfall amount over the growing season and the corresponding simulated change in grain yield under (A) RCP 4.5 with ambient CO2, (B) RCP 8.5 with ambient CO2, (C) RCP 4.5 with elevated CO2 and (D) RCP 8.5 with elevated atmospheric CO2, for Tamale, Ghana.
Agronomy 12 02614 g013
Table 1. Soil parameters used in the evaluation of the model.
LocationL
(cm)
SLL
(cm3/cm3)
SDUL
(cm3/cm3)
SAT
(cm3/cm3)
BD
(g/cm3)
OC
(%)
pHH2O
(-)
Dimabi50.0120.1760.3591.340.5085.1
150.0120.1760.3591.340.5085.1
300.0160.1760.3591.640.4755.3
450.0270.1920.3601.70.2375.7
600.0450.1920.3601.780.1026.2
Kpalsogu150.0780.1380.4761.340.685.13
300.0900.1510.3531.640.485.26
450.1050.1750.3321.700.385.7
600.1240.2020.3141.780.176.16
Nyankpala50.1450.320.481.30.756.5
150.1450.320.4751.30.656.5
300.1440.30.4821.30.56.5
450.1820.330.4751.350.456.5
600.2010.360.4661.350.456.5
Nasia50.060.2370.3621.390.416.2
150.050.2240.3561.390.416.2
300.050.2240.3411.590.326.0
450.1050.2260.3421.590.285.8
600.120.2010.3421.630.285.7
Tibogu50.040.2470.3591.360.616.7
150.050.2270.3591.390.516.7
300.050.2280.3401.590.426.4
450.1050.2290.3421.590.386.1
600.1220.2050.3421.630.386.1
Langa50.0830.1590.3941.540.71−99
150.0860.1580.3951.540.58−99
300.0860.1630.3971.530.56−99
500.0830.1570.3651.620.45−99
L, depth of the soil layer; SLL, soil lower limit or wilting point; SDUL, soil drained upper limit or field capacity; SAT, saturated water content; BD, bulk density; OC, organic carbon; pHH2O, soil pH in water.
Table 2. Genetic coefficients of the soybean varieties used.
Genetic
Coefficient
DescriptionCultivars
JengumaAfayak
CSDLCritical short-day length, below which reproductive development progresses with no day length effect (for short-day plants) (hour)11.8811.88
PPSENSlope of the relative response of development to photoperiod with time (positive for short-day plants) (1/hour)0.340.34
EM-FLTime between plant emergence and flower appearance (R1) (photothermal days)3230
FL-SHTime between first flower and first pod (R3) (photothermal days)16.516
FL-SDTime between first flower and first seed (R5) (photothermal days)2524
SD-PMTime between first seed (R5) and physiological maturity (R7) (photothermal days)4138.5
FL-LFTime between first flower (R1) and end of leaf expansion (photothermal days)2826
WTPSDMaximum weight per seed (g)0.190.19
SDPDVAverage seed per pod under standard growing conditions (#/pod)2.252.25
THRSHThreshing percentage. The maximum seed to (seed + shell) ratio at maturity. Causes seeds to stop growing as their dry weight increases until shells are filled in a cohort.72.377.8
CSDLCritical short-day length below which reproductive development progresses with no day length effect (for short-day plants) (hour)11.8811.88
PPSENSlope of the relative response of development to photoperiod with time (positive for short-day plants) (1/hour)0.340.34
Table 3. Calibration statistics at flowering and maturity for the two soybean varieties.
DescriptionRMSE
(kg/ha)
RRMSE
(%)
MAE
(kg/ha)
d-Value
(-)
No. of
Farms
Afayak (biomass at flowering)32810.622.90.998
Jenguma (biomass at flowering)45715.434.40.9510
Afayak grain yield 32322.732.20.958
Jenguma grain yield 66527.754.20.8710
Table 4. Model evaluation statistics at maturity for grain yield.
DescriptionRMSE
(kg/ha)
RRMSE
(%)
MAE
(kg/ha)
EF
(-)
d-Value
(-)
No. of
Farms
Afayak grain yield 62828.110.0.530.8349
Jenguma grain yield 47621.917.20.480.8123
Publisher’s Note: MDPI stays neutral with regard to jurisdictional claims in published maps and institutional affiliations.

