Article

Transcriptome Analysis of ‘Kyoho’ Grapevine Leaves Identifies Heat Response Genes Involved in the Transcriptional Regulation of Photosynthesis and Abscisic Acid

1
Grape and Wine Research Institute, Guangxi Academy of Agricultural Sciences, Nanning 530007, China
2
Agricultural College, Guangxi Academy of Agricultural Sciences, Nanning 530007, China
*
Authors to whom correspondence should be addressed.
Agronomy 2022, 12(10), 2591; https://doi.org/10.3390/agronomy12102591
Submission received: 7 September 2022 / Revised: 8 October 2022 / Accepted: 18 October 2022 / Published: 21 October 2022

Abstract

:
Grapevine is a popular cultivated fruit throughout the world and heat stress is one of the most serious threats to viticulture. However, transcriptional responses, such as molecular properties of photosynthesis and abscisic acid biosynthesis, metabolism and signal transduction pathway of grapevine to heat stress, are still poorly understood. In this study, RNA-seq was carried out for thermostabilized grapevine ‘Kyoho’ leaves. Results showed that 685 and 469 genes were commonly down-regulated and up-regulated at three sampling time-points. The light-dependent reactions of photosynthesis was significantly enriched in up-regulated DEGs at 1 hpt and down-regulated DEGs at R24 hpt. Heat stress impaired the photosynthetic capacity of grapevine leaves, and there was a significant positive relationship between photosynthesis and stomatal conductance at short-term post-heat stress treatment, but the inhibition of HS on Pn was non-stomata limitation for a longer period. Photosystem (PS)Ⅱ was more sensitive to heat stress than PSⅠ, and PsbP, as well as Psb28, played important roles in response to heat stress. The abscisic acid (ABA) content in heat-stress-treated Kyoho plants was higher than that in the control at 1 hpt, but less in heat-stress-treated plants at 4 and R24 hpt, which was regulated by numerous genes involved in the ABA biosynthesis and catabolism pathways. These results help to understand the influence of heat stress on photosynthesis and ABA biosynthesis, metabolism and signal transduction pathway.

1. Introduction

Grapevine is one of the most economically important fruit crops in the world [1]. However, the production and quality of grapes are often affected by various environmental factors, including heat stress (HS) [2,3,4,5]. Studies indicated that when suffering from HS, photosynthetic, respiratory activities and berry quality were reduced, and the biosynthesis and accumulation of sugars, acids and anthocyanins in berries were also affected [6,7,8].
It has been reported that photosynthesis of grapevines was limited at temperatures above 35 °C and generally the restrictions were caused by stomatal limitation [9,10,11,12,13,14]. Several studies on grape leaves clearly showed that net photosynthetic rate (Pn) and stomatal conductance (Gs) sharply declined, while substomatal CO2 concentration (Ci) abruptly rose at a temperature of over 40 °C [15,16]. During heat treatments, the reduction in photosynthesis of Semillon grapevine was attributed to 15–30% stomatal conductance [16,17], while Sepúlveda and Kliewer suggested stomatal limitation fully accounted for the reduction in photosynthesis [18].
Abscisic acid (ABA)-mediated responses are an important component of thermotolerance, and it was generally accepted that the ability to synthesize ABA under HS was the key factor attributed to the higher heat tolerance of a plant [19,20,21]. It has been noted that ABA is linked to HS signaling in different plant species, such as Arabidopsis, creeping bentgrass, maize, and bromegrass [22,23,24,25]. In grape berry skin, the ABA catabolism/conjugation process and ABA biosynthetic pathway were also affected by water and heat stresses [26].
In previous works, many studies demonstrated that a series of heat shock transcription factors (HSFs) have a high transcript abundance in grapes under heat conditions, such as VvHSFA2a and VpHSFB2b [27,28]. Among 19 VvHSFs, only VSF01, VHSF05, VHSF15 and VHSF18 showed different transcription levels in V. vinifera ‘Jingxiu’ (weak heat tolerance) and V. davidii ‘Tangwei’ (strong heat tolerance) under HS, indicating that these four VvHSFs may be important factors underlying the thermotolerance difference between the two varieties [29].
Besides HSFs, some other genes have also been reported to participate in the tolerance of HS in grapes, such as heat shock proteins (HSPs) and members of the Bcl-2-associated athanogene family [30,31]. For example, enhanced levels of HSP21 have been reported to be involved in alleviating HS and inducing decrease in Pn in salicylic acid (SA)-pretreated grapevine [15].
In recent years, with the advancement of biotechnology, more and more studies have investigated transcriptomic or proteomic changes in grapes post-HS. Liu et al., used Affymetrix Grape Genome oligonucleotide microarray to identify genes that were responsive to HS and/or to subsequent recovery in grape leaves, and found that the responsive genes belonged to a large number of important traits and biological pathways [5]. Proteins related to electron transport chains of photosynthesis, antioxidant enzymes, and HSPs may play key roles in enhancing grape adaption to and recovery capacity from HS in ‘Carbernet Sauvignon’ leaves [32]. In a recent study, high-throughput sequencing and the iTRAQ labeling technique was integrated to assess proteomic and transcriptomic changes in grape leaves under four different temperature regimes, and found alternative splicing, especially intron retention, was an important posttranscription regulatory event in response to high temperature [33]. RNA-seq has also been used to identify differentially expressed transcripts modulated by temperature in ripening grapevine fruits, and results showed that the tannin synthesis and degree of galloylation was impaired by high temperatures at the transcriptomic levels [34]. Admittedly, there are several more recent works using RNA-Seq profiles to investigate grapevine responses to heat [34,35,36], and many abiotic HS-induced genes and proteins have been identified [4], but our understanding of the molecular mechanisms involved in HS responses and thermotolerance in grape leaves is still insufficient. Thus, the dynamic transcriptomic changes in grape leaves in response to HS deserves a detailed investigation.
In the present study, we conducted transcriptomic analysis to elucidate the transcriptional changes at different time points post-HS and after recovery by RNA-seq, and the transcriptional levels of genes involved in photosynthesis and ABA biosynthesis, metabolism, and signaling transduction were analyzed further. The results from this study clarify the molecular mechanisms governing the heat-responsive processes involved in the transcriptional regulation of photosynthesis and ABA biosynthesis, metabolism, and signal transduction.

2. Materials and Methods

2.1. Plant Materials and Treatments

Stem cuttings of ‘Kyoho’ (Vitis labrusca × Vitis vinifera L.) were rooted in 2500 cm3 pots containing a mixture of 2 peat moss: 3 perlite (V/V) and grown for about 8 weeks in a controlled environment room under 25 °C (16 h light/8 h dark), 60–70% relative humidity. Water was irrigated once every two days, and 1/10 MS nutrient solution was supplied once a week, 300 mL per plant each time. Young grapevines with identical growth were acclimated for two days in an illuminating incubator (60–70% relative humidity, 26/20 °C day/night cycle and photosynthetic active radiation at 800 μmol m−2s−1) and divided into two groups. On the following day (the first day of the experiment, Day 1), the first group was kept at 26/20 °C day/night in the illuminating incubator as the control. The second group was treated at 47 °C in another illuminating incubator from 10:00 a.m. to 14:00 pm. The stressed grapevines were then subjected to 26 °C rapidly. All conditions were the same as the control until 14:00 p.m. on Day 2. Five randomly selected leaves from 5 plants of the treatment and control were sampled at 11:00 a.m. (1 h post heat treatment, 1 hpt) and 14:00 p.m. (4 h post heat treatment, 4 hpt) on Day 1 and 14:00 p.m. on Day 2 (24 h post recovery from heat treatment, R24 hpt) and immersed in liquid nitrogen and stored at −80 °C for transcriptomic analyses, quantitative real-time RT-PCR (qRT-PCR) analysis, and ABA content measurement. Chlorophyll florescence and gas exchange parameters were measured at 1, 4 and R24 hpt on the fifth leaf from the top of each plant. Five plants were used for the measurements and 2 data were obtained from each leaf. Three independently replicated experiments were executed.

2.2. RNA-Seq Analysis

Total RNA was extracted using the TRIZOL reagent (Takara, Dalian, China) according to the manufacturer’s instructions. RNA quality analysis, library construction, and sequencing were performed by Biomarker Technologies (Beijing, China).
Raw data (raw reads) from fastq were firstly processed through in-house perl scripts. In this step, clean data (clean reads) were obtained by removing reads containing adapter, ploy-N and low quality reads. Then, clean reads were mapped to the reference grapevine genome (Vitis_vinifera.PN40024.v4.53.genome.fa) using HISAT2 [37,38]. Quantification of gene expression levels were estimated by fragments per kilobase of transcript per million mapped reads (FPKM) [39]. The formula is as follows:
FPKM = cDNA   Fragments Mapped   Fragments   Millons × Transcript   Length   kb

2.3. Gene Function Annotations and Classifications

Gene function was annotated based on the following databases: NCBI non-redundant protein sequence database (Nr), NCBI non-redundant nucleotide sequences (Nt), Protein family (Pfam), Swiss-Prot, Cluster of Orthologous Groups of proteins (COG), the database of Clusters of Protein homology (KOG), Kyoto Encyclopedia of Genes and Genomes Ortholog database (KO) and Gene Ontology (GO).

2.4. Identification of Differentially Expressed Genes (DEGs)

Differentially expressed genes (DEGs) between the samples were identified by ‘DESeq2’ [40]. The resulting p values were adjusted using the Benjamini–Hochberg approach for controlling the false discovery rate (FDR). Genes with fold change ≥ 2, FDR ≤ 0.01, and an adjusted p value < 0.01 found by DESeq2 were regarded as DEGs.
GO enrichment analysis of the DEGs was implemented by the GOseq R packages based Wallenius non-central hyper-geometric distribution [41]. KOBAS software was used to test the statistical enrichment of DEGs in KEGG pathways [42].

2.5. Validation of RNA-Seq by Quantitative Real-Time RT-PCR

Total RNA extraction was the same as that used for RNS-seq analysis described above. First-strand cDNA was synthesized using the Superscript II reverse transcriptase (Invitrogen) with an oligo(dT)15 primer according to the manufacturer’s instructions (Tiangen Biotech, Beijing, China). Twelve DEGs were chosen to confirm that they involve in responding to HS using quantitative real-time RT-PCR method. All the genes were normalized with VvEF1-α and VvActin. The selected DEGs and their corresponding primer sequences are provided in Table S1. qRT-PCR was performed using the LightCycler® 480 SYBR Green I Master (Roche) with 10 pmol of each primer, and the reactions were run on a LightCycler® 480 (Roche). All reactions were performed in triplicate, and the normalized relative expression levels were calculated with the 2−ΔΔCt method [43]. Pearson correlation coefficients (p-value < 0.01) were calculated to assess the correlations between the different expression patterns obtained by qRT-PCR and RNA-seq.

2.6. Analysis of Photosynthetic Gas Exchange

Photosynthetic gas exchange was analyzed with an open-path infrared gas analyser system (CIRAS-3, PP system, Amesbury, USA) which can assess photosynthesis by means of photosynthetic photon flux density (PPFD), leaf temperature and CO2 concentration in the cuvette. Pn, Gs, Ci and transpiration rate (Tr) were determined at a concentration of ambient CO2 (400 ppm) and a PPFD of 1200 μmol m−2 s−1.

2.7. Measurement of Chlorophyll Fluorescence

Chlorophyll fluorescence was measured using a Handy Plant Efficiency Analyser (Hansatech Instrument, King’s Lynn, UK) on the fifth leaf from the top using a previously standardized protocol [44]. The leaves were clipped in the middle using leaf dark clips (Handsatech Instrument) for 30 min at 26 °C (control) or 47 °C (HS) before measurement. The maximum quantum efficiency of PSⅡ photochemistry (Fv/Fm) was measured on the adaxial leaf surface immediately after the dark adaptation using a PPFD of 3000 μmol m−2 s−1 as saturating flash for the duration of 1 s. The following PSⅡ behaviour parameters were calculated per excited leaf cross-section (CSm): ABS/CSm (absorption flux per CSm approximated), TRo/CSm (trapped energy flux per CSm), RC/CSm (percentage of active/inactive reaction centers per CSm), ETo/CSm (electron transport flux per CSm), DIo/CSm (dissipated energy flux per CSm).

2.8. Measurement of Endogenous ABA Content

The ABA content was measured using the method of enzyme-linked immunosorbent assay as described previously [45].

2.9. Statistical Analysis

Significant differences were determined when p < 0.05 according to independent t-tests. Heatmap was performed with MetaboAnalyst 5.0, and statistical analysis was performed with SPSS (SPSS Inc., Chicago, IL, USA) for Windows, version 26.0.

3. Results

3.1. Illumina Sequencing

Eighteen cDNA libraries were generated with mRNA from the six sample groups: group1 (heat treatment exposed at 47 °C for 1 h, H1), group2 (heat treatment exposed at 47 °C for 4 h, H4), group3 (24 h post recovery from heat treatment exposed at 47 °C for 4 h, HR24), group4, 5, and 6 (control at 26 °C for 1 h, 4 h and 28 h, respectively, namely as C1, C4, and CR24) for the full expanded leaf. These cDNA libraries were then subjected to Illumina HiSeq 2000 sequencing. After removing reads of low quality, adapter sequences, or reads with more than 5% ambiguous nucleotides, a total of 501,871,839 clean reads were produced consisting of 146,372,337,142 nucleotides (146.37 Gb), with an average GC content of 45.7%. Reads mapping to the genome sequence ranged from 85.26% to 89.31% of the reads (Table S2). To better understand the distribution of the samples according to the six groups, the principal component analysis (PCA) for the 18 samples was carried out based on the gene expression level. Results showed the first two principal components accounted for 91.9% of the variation, the three samples of each group clustered together, and the distances among three groups of HS treatment were much greater than that of the control (Figure S1A). To further investigate the robustness of the RNA-Seq dataset, the correlation coefficients of the transcriptome profiles among the 18 samples were calculated and were found to reach 0.97 between three biological replicates of each group (Figure S1B).

3.2. DEGs among the HS Treatment and Control in Grape

A total of 11,097 differentially expressed transcripts between HS treatment and control were obtained. Among these DEGs, 2631 were down-regulated and 1889 were up-regulated at 1 h post HS treatment (hpt), 3379 were down-regulated and 2817 were up-regulated at 4 hpt, while 2943 were repressed and 1952 were induced at 24 h after recovery from 4 h of HS treatment (R24 hpt) compared to their corresponding control (Figure 1A). A total of 469 genes were commonly up-regulated at the three sampling time-points by HS treatment (Figure 1B), and the top five enriched GO terms of these 469 DEGs in the ‘biological process’ category were ‘response to heat’, ‘response to hydrogen peroxide’, ‘response to reactive oxygen species’, ‘protein oligomerization’, and ‘protein folding’. In the ‘cellular component’ category, the top five enriched GO terms of the commonly up-regulated DEGs were ‘Cajal body’, ‘telomerase holoenzyme complex’, ‘nucleus’, ‘mitochondrial intermembrane space’ and ‘mitochondrial respiratory chain complex I’. In the ‘molecular function’ category, the top five enriched GO terms of the commonly up-regulated DEGs were ‘unfolded protein binding’, ‘protein self-association’, ‘protein binding involved in protein folding’, ‘heat shock protein binding’, and ‘misfolded protein binding’ (Figure 1C). A total of 685 genes were commonly down-regulated at the three sampling time-points by HS treatment (Figure 1D). The top five enriched GO terms of the commonly down-regulated 685 genes in ‘biological process’ category were ‘hormone-mediated signaling pathway’, ‘pectin catabolic process’, ‘defense response’, ‘chitin catabolic process’, and ‘brassinosteroid metabolic process’. In the ‘cellular component’ category, the top five enriched GO terms of the commonly down-regulated DEGs were ‘integral component of membrane’, ‘extracellular region’, ‘plasma membrane’, ‘cell wall’, and ‘plant-type cell wall’. In the ‘molecular function’ category, the top five enriched GO terms of the commonly down-regulated DEGs were ‘protein kinase activity’, ‘protein serine/threonine kinase activity’, ‘ATP binding’, ‘transferase activity, transferring acyl groups other than amino-acyl groups’, and ‘aspartic-type endopeptidase activity’ (Figure 1E).
To validate the transcriptional pattern identified by RNA-seq, the expression of 12 DEGs was analyzed using qRT-PCR. The correlation coefficients of 0.731 indicated the credibility of the results of the RNA-Seq-based gene expression (Figure S2).

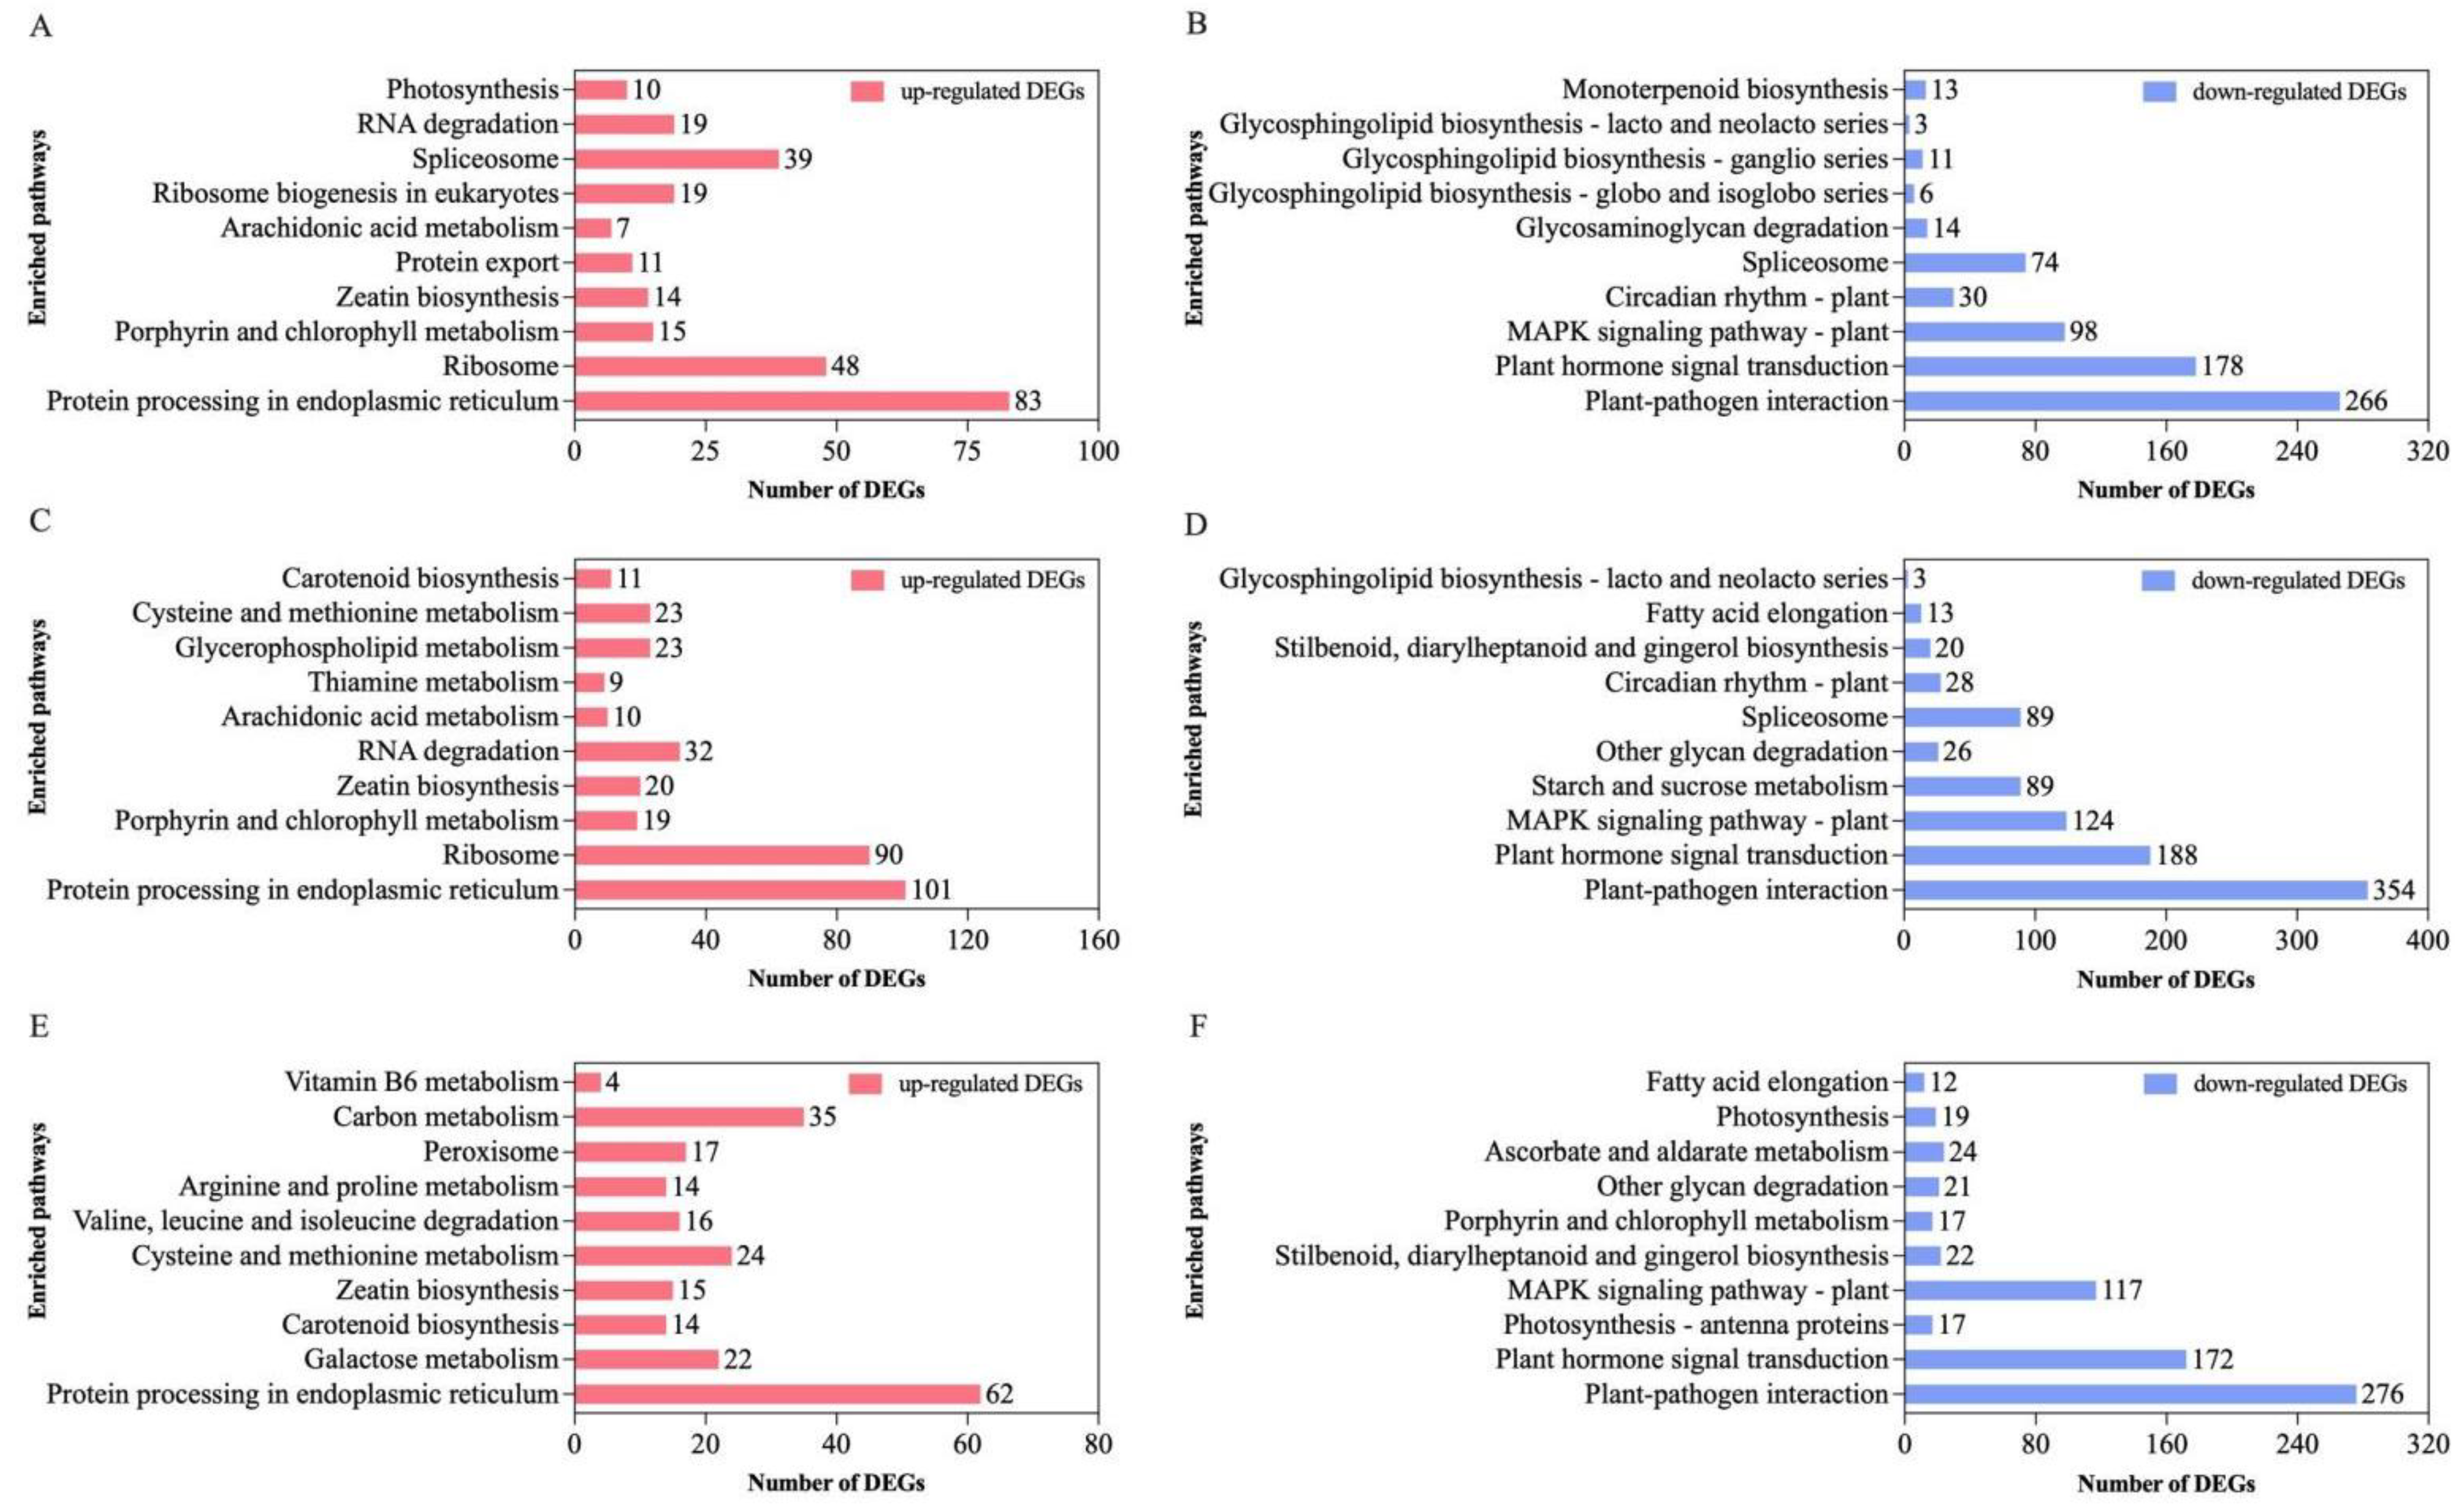
3.3. KEGG Pathway Enrichment Analysis of DEGs

KEGG Orthology-Based Annotation System (http://kobas.cbi.pku.edu.cn/home.do, accessed on 10 June 2022) were used to test the statistical enrichment pathways for up- or down-regulated DEGs between HS treatment and control [42]. According to the KEGG pathway analysis, both ‘Protein processing in endoplasmic reticulum’ and ‘Zeatin biosynthesis’ were contained in the top 10 enriched pathways of up-regulated DEGs at the three sampling time-points (Figure 2A,C,E), while ‘Plant-pathogen interaction’, ‘Plant hormone signal transduction’ and ‘MAPK signaling pathway-plant’ were contained in the top 10 enriched pathways of down-regulated DEGs at the three sampling time-points (Figure 2B,D,F). It should be noted that ‘Photosynthesis’ was significantly enriched in up-regulated DEGs at 1 hpt and down-regulated DEGs at R24 hpt (Figure 2A,F). ‘Ribosome’, ‘Porphyrin and chlorophyll metabolism’, ‘’RNA degradation’, and ‘Arachidonic acid metabolism’ were enriched in up-regulated DEGs at 1 and 4 hpt (Figure 2A,C), while ‘Circadian rhythm-plant’, ‘Spliceosome’, and ‘Glycosphingolipid biosynthesis—lacto and neolacto series’ were enriched in down-regulated DEGs at 1 and 4 hpt (Figure 2B,D). ‘Carotenoid biosynthesis’ and ‘Cysteine and methionine metabolism’ were enriched in up-regulated DEGs at 4 and R24 hpt (Figure 2C,E), while ‘Fatty acid elongation’ and ‘other glycan degradation’ were enriched in down-regulated DEGs at 4 and R24 hpt (Figure 2D,F).

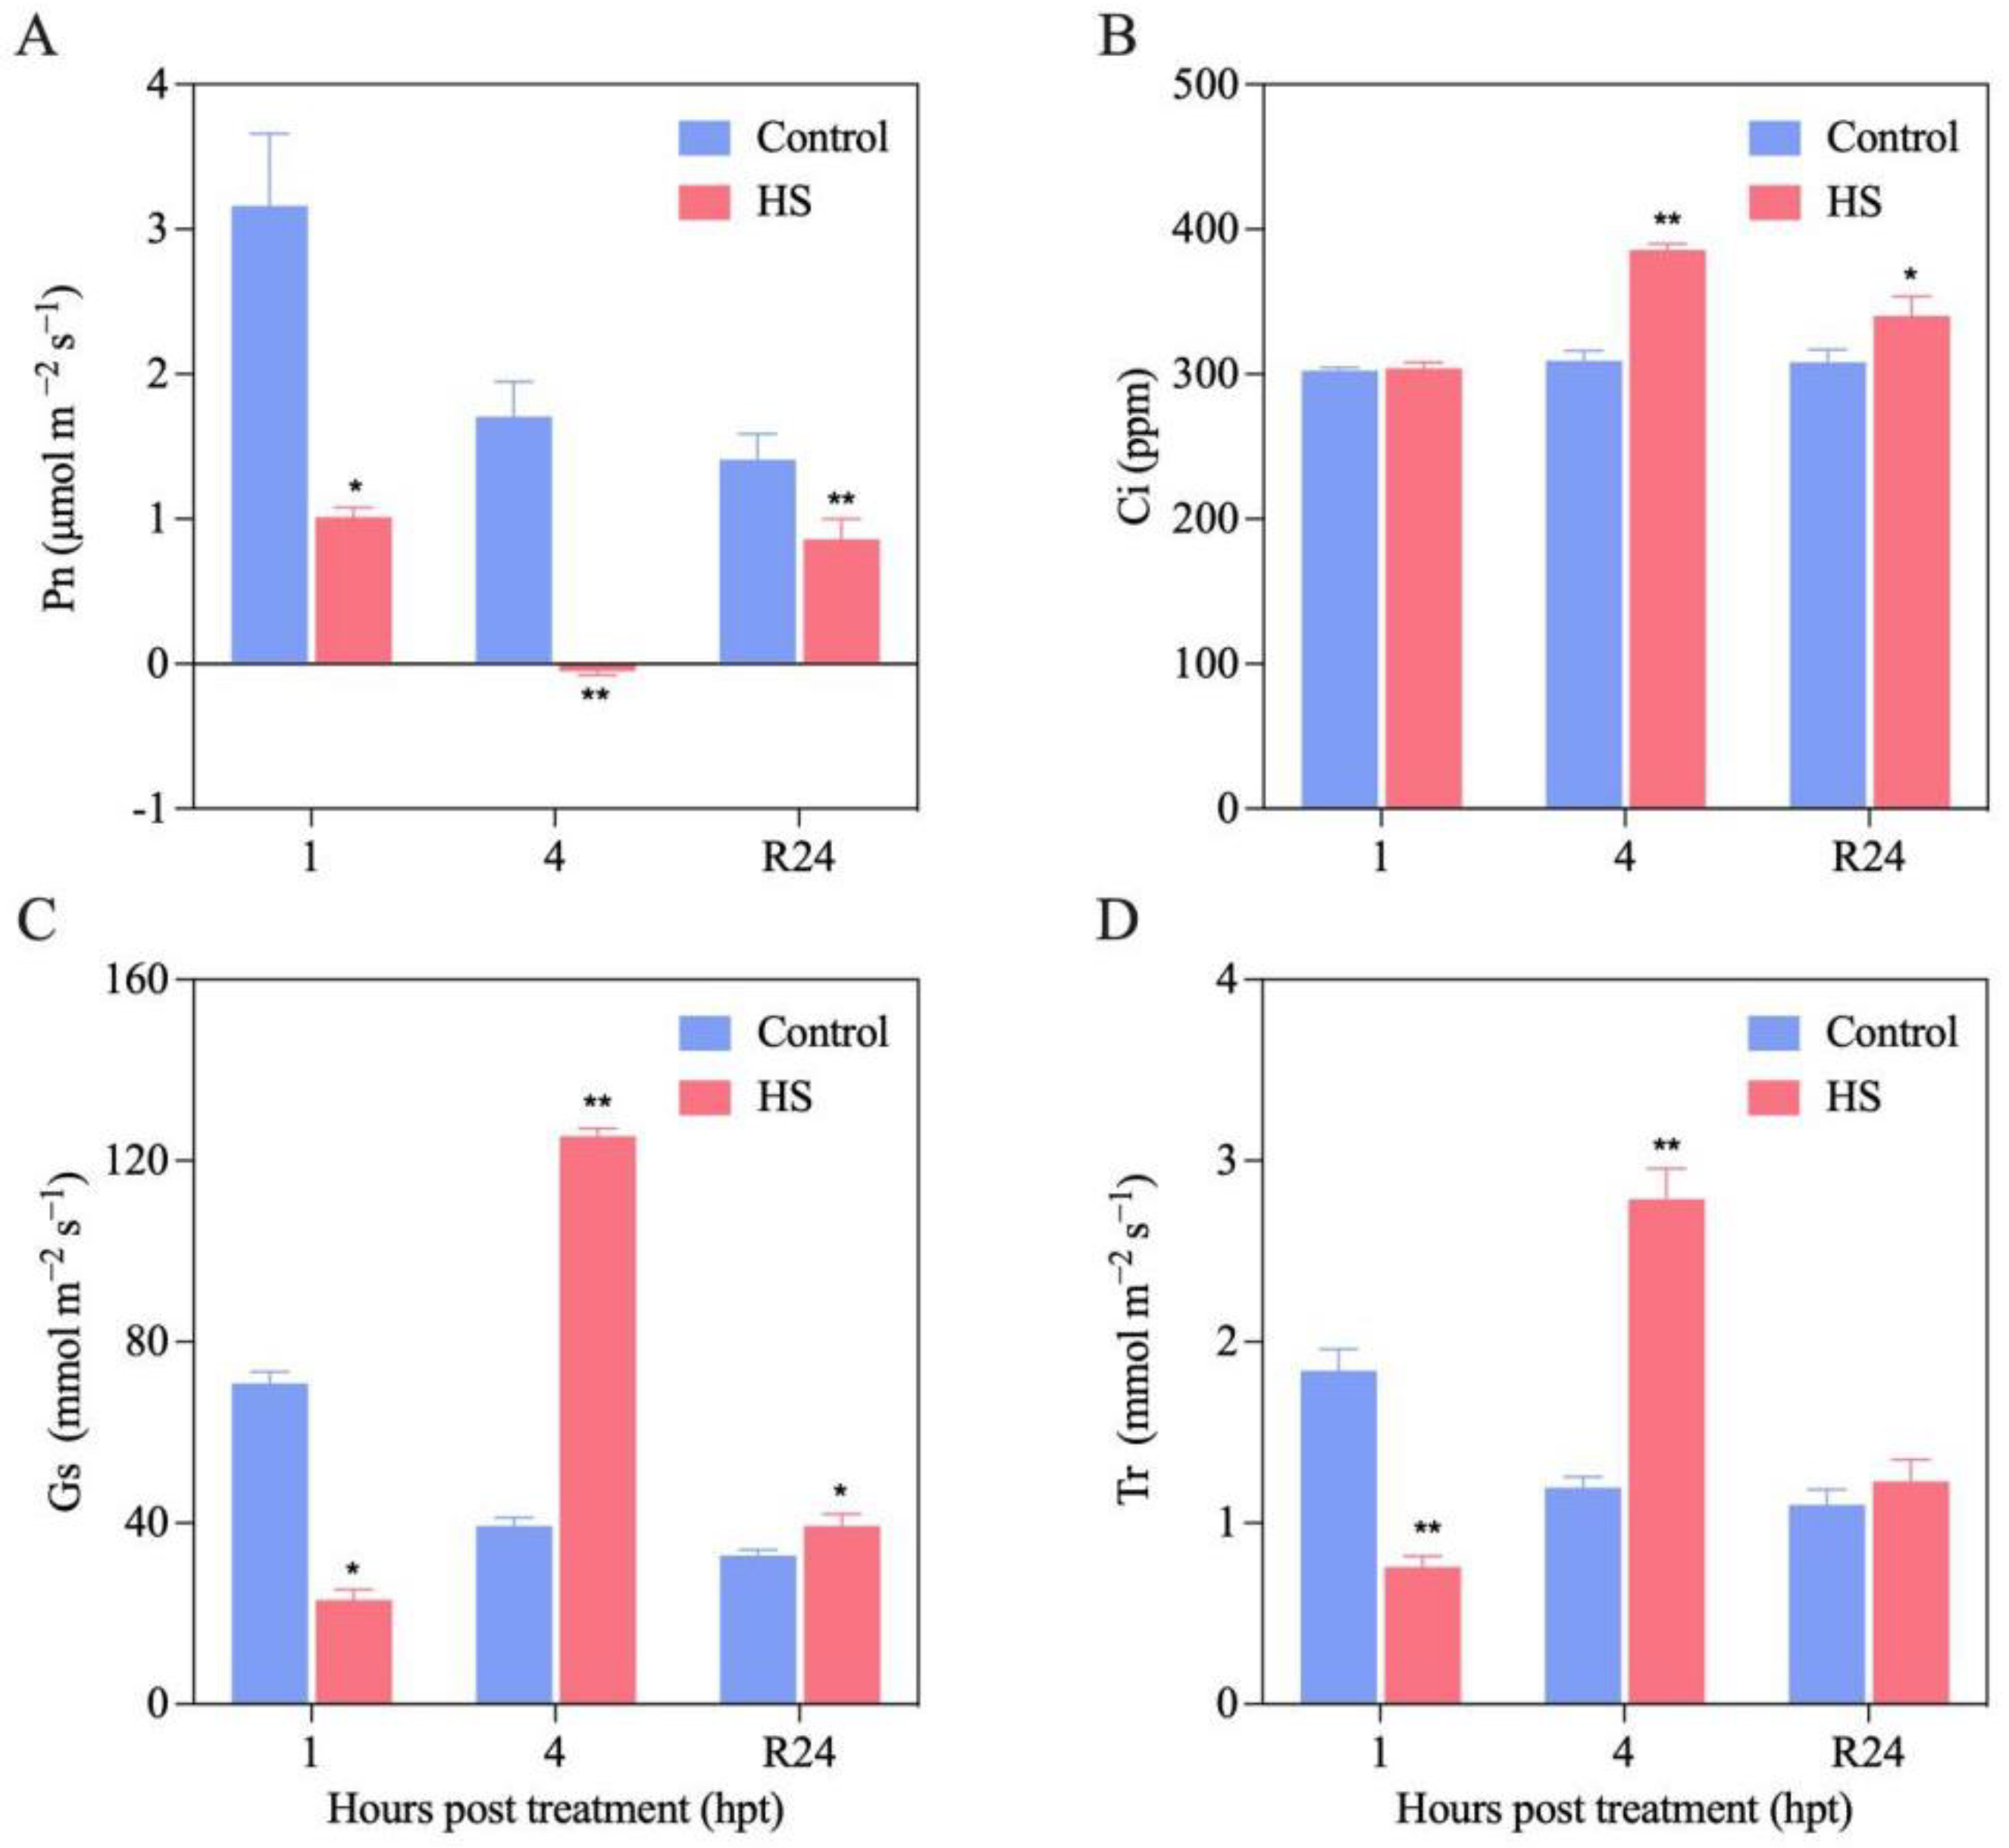
3.4. Effect of HS Treatment on Gas Exchange

To explore the effect of HS treatment on photosynthesis, Pn, Gs, Ci and Tr were measured at 1, 4 and R24 hpt. It was showed that Pn in leaves of HS-treated grapevines was decreased by 67.97% at 1 hpt, when compared with that of the control, and it was decreased by 102.93% at 4 hpt. After recovery from HS, the Pn was raised, but was even lower than that of the control at R24 hpt (Figure 3A). The Ci in leaves of HS-treated plants was increased to 1.25- and 1.1-fold when compared with control at 4 and R24 hpt, respectively (Figure 3B). It was noteworthy that Gs and Tr in leaves of HS-treated grapevines was decreased by 67.48% and 58.92% at 1 hpt, respectively, but the two parameters were increased by 2.18- and 1.33-fold at 4 hpt, respectively. After recovery from HS, Gs and Tr were decreased, but Gs in leaves of HS-treated grapevines was still higher than that of the control (Figure 3C,D).

3.5. Effect of HS Treatment on Donor Side, Reaction Center and Acceptor Side of PSⅡ

In the present study, Fv/Fm was decreased significantly at 1 and 4 hpt, but not significantly at R24 hpt (Figure 4A). Besides the Fv/Fm, on a per-unit excited leaf cross-section (CSm), ABS/CSm was also decreased significantly at 1 and 4 hpt, and to a minimum at 4 hpt (Figure 4B). ETo/CSm, TRo/CSm, and RC/CSm was decreased significantly at all of the three sampling time-points, and to a minimum at 4 hpt (Figure 4C–E), while DIo/CSm was increased significantly at 4 and R24 hpt (Figure 4F).

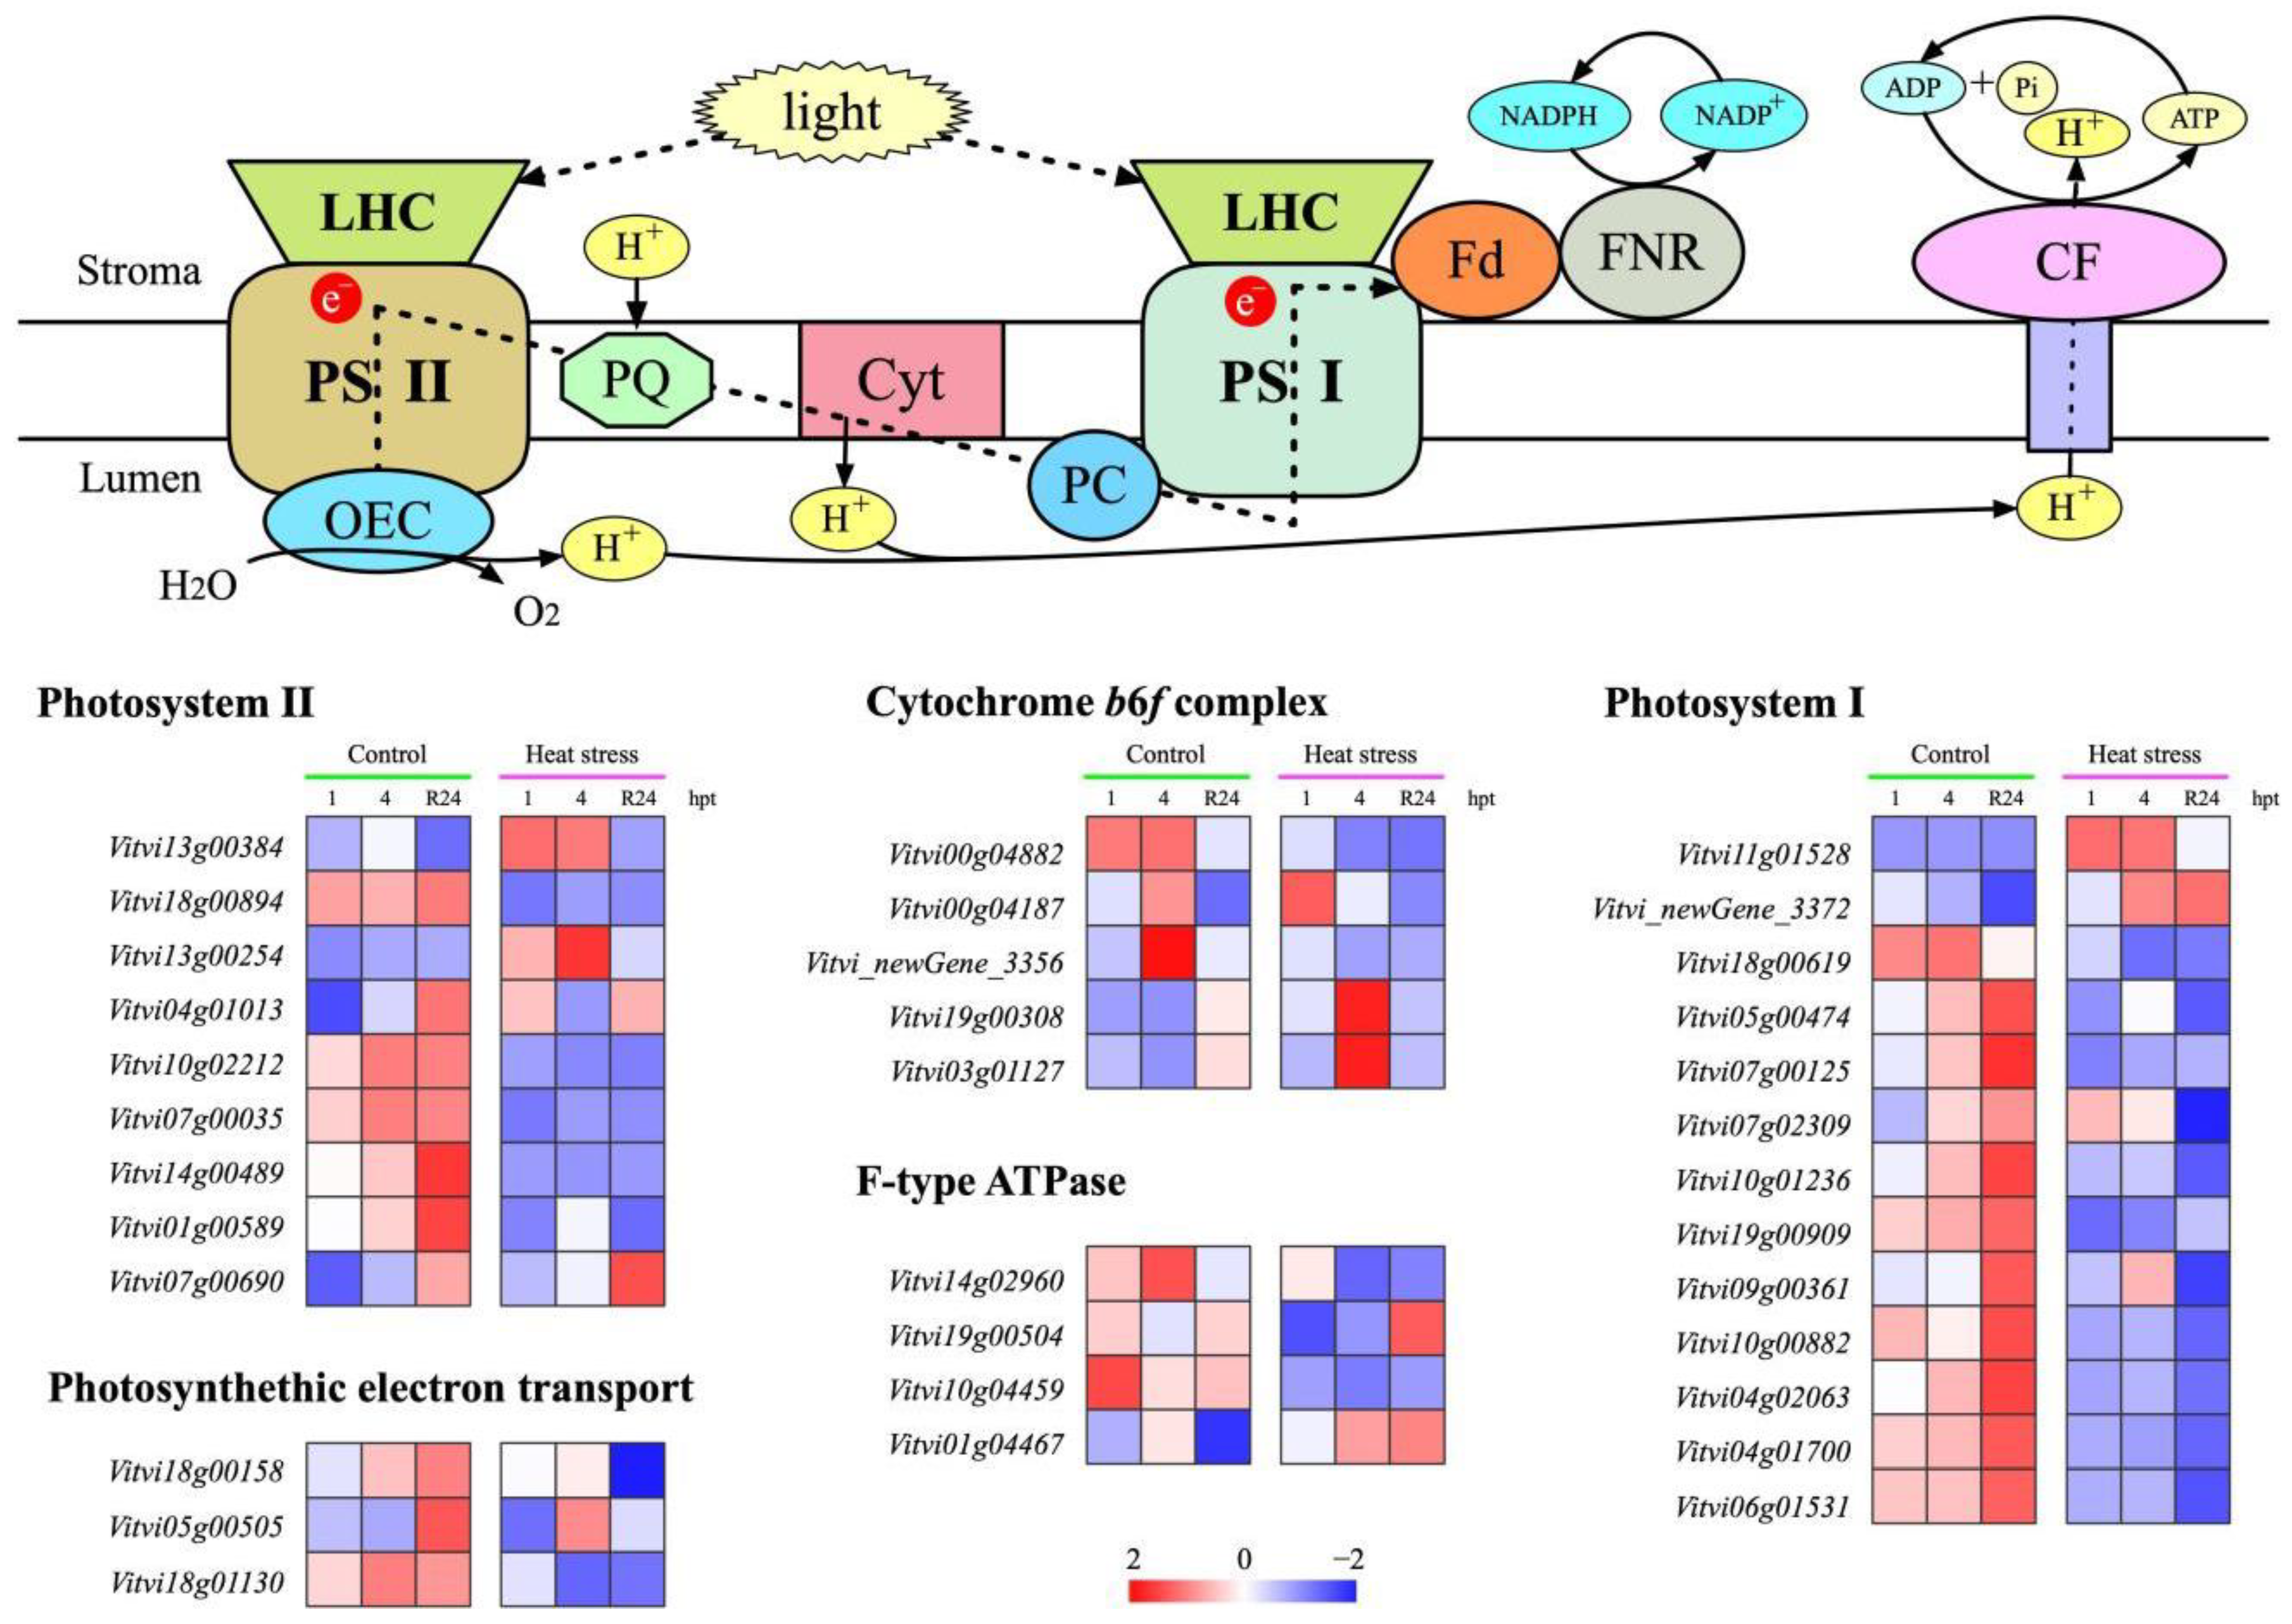
3.6. Effect of HS Treatment on Expression of Photosynthesis-Related Genes

To explore the differences in gene expression profiles at different time points post-HS treatment as well as recovery from HS, a KEGG (http://www.genome.jp/kegg/, accessed on 10 June 2022) pathway enrichment analysis revealed that 34 DEGs were involved in photosynthesis. These DEGs covered all sections of the pathway, including PSⅡ, photosynthetic electron transport, cytochrome b6/f complex, F-type ATPase, and PSⅠ.
In PSⅡ, the expression of PsbA (Vitvi13g00384) was up-regulated at 1 and R24 hpt, PsbP (Vitvi13g00254) was up-regulated at 1 and 4 hpt, while another PsbP gene (Vitvi04g01013) and Psb28 (Vitvi07g00690) were up-regulated at 1 hpt. PsbQ (Vitvi10g02212) was down-regulated at 4 and R24 hpt. Other DEGs in PSⅡ, including PsbO (Vitvi18g00894), PsbW (Vitvi07g00035 and Vitvi14g00489), and PsbY (Vitvi01g00589) were down-regulated at R24 hpt (Figure 5, Table S3).
In photosynthesis electron transport, the expression of PetE (Vitvi18g00158) and PetH (Vitvi18g01130) was decreased at R24 hpt, while PetF (Vitvi05g00505) was up-regulated at 4 hpt. In cytochrome b6/f complex, the expression of PetA (Vitvi_newGene_3356, and Vitvi00g04187) was up-regulated at 1 hpt, and kept normal at 4 and R24 hpt, while PetB (Vitvi00g04882) was down-regulated at 4 hpt. The expression of PetC1 (Vitvi19g00308) was increased at 1 and 4 hpt, while PetC2 (Vitvi03g01127) was only significantly induced at 4 hpt. In F-type ATPase, the subunits Beta (Vitvi14g02960) and gamma (Vitvi19g00504) was down-regulated at 4 hpt and 1 hpt, respectively. The ATPase subunit c (Vitvi10g04459) was down-regulated at 4 and R24 hpt, while the ATPase subunit b (Vitvi01g04467) was up-regulated at R24 hpt (Figure 5, Table S3).
In PSⅠ, the expression of PsaA (Vitvi11g01528) was up-regulated at all three sampling time-points. One of the PsaB genes (Vitvi18g00619) was down-regulated at 4 hpt and R24 hpt, while another PsaB gene (Vitvi_newGene_3372) was up-regulated at the two sampling time-points. The expression of PsaE (Vitvi07g02309) was up-regulated at 1 hpt, and it was down-regulated at R24 hpt. Other DEGs in PSⅠ, including PsaD (Vitvi05g00474 and Vitvi07g00125), PsaF (Vitvi10g01236), PsaG (Vitvi19g00909), PsaH (Vitvi09g00361), PsaK (Vitvi10g00882), PsaL (Vitvi04g02063), PsaN (Vitvi04g01700) and PsaO (Vitvi06g01531) were down-regulated at R24 hpt (Figure 5, Table S3).

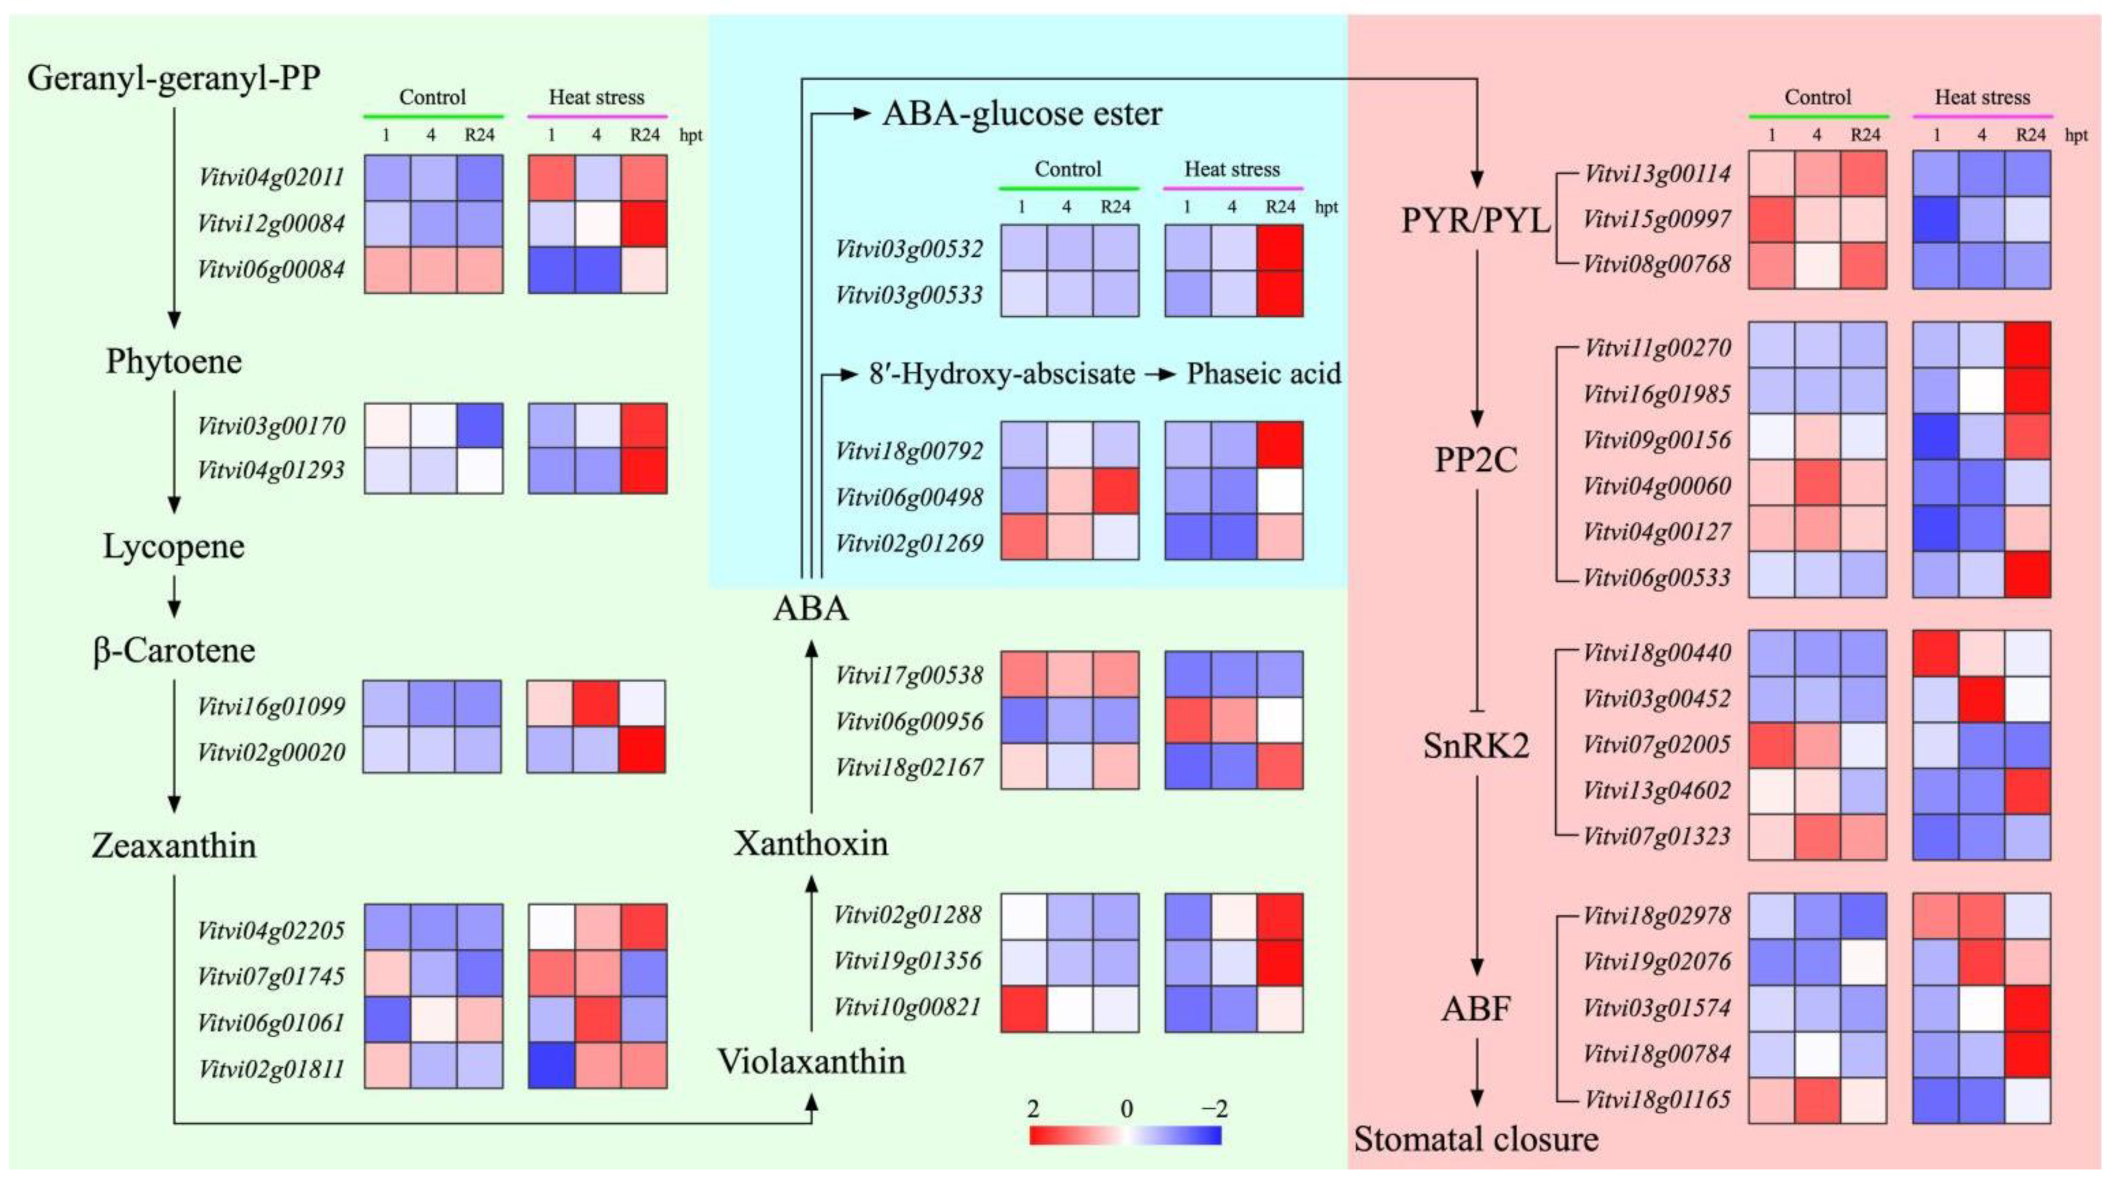
3.7. Effect of HS Treatment on Expression of ABA Biosynthesis, Catabolism and Signal Transduction-Related Genes

In the present study, we measured the ABA content in grape leaves post-HS treatment, and results showed that the ABA content in HS-treated plants was more than that in control at 1 hpt, but it was less in HS-treated plants at 4 and R24 hpt (Figure S3). To explore the differences in gene expression patterns at different time points post-HS treatment as well as recovery from HS, a KEGG pathway enrichment analysis revealed that 42 genes encoding 14 enzymes or proteins were involved in ABA biosynthesis, metabolism and signal transduction pathway (Figure 6, Table S4).
In the ABA biosynthesis pathway, most DEGs were up-regulated or kept normal at the three sampling time-points, except for one phytoene synthase 2 (PSY2) gene (Vitvi06g00084) and 9-cis-epoxycarotenoid dioxygenase 2 (NCED2, Vitvi10g00821), which were down-regulated at 1 and 4 hpt, as well as NCED 4 (Vitvi02g01288) and NCED1 (Vitvi19g01356); both were down-regulated at 1 hpt, and up-regulated at 4 and R24 hpt, and ABA2 (Vitvi17g00538), whose expression was decreased at the three sampling time-points. The expression of 1 AAO3 (Vitvi18g02167) was decreased at 1 hpt, and remained normal at 4 and R24 hpt (Figure 6, Table S4).
In the ABA catabolism process, ABA 8′-hydroxylase (ABA8ox, EC: 1.14.13.93) and ABA glucosyltransferase (ABA-GT, EC: 2.4.1.263) are the major enzymes for phaseic acid (PA) and ABA glucosyl-ester (ABA-GE), respectively [46]. Compared with that in control, the expression of ABA-GT (Vitvi03g00533) was decreased at 1 hpt, and increased at R24 hpt, another ABA-GT gene (Vitvi03g00532) was up-regulated at R24 hpt. Three genes annotated as ABA8ox were identified, and their expression levels were variable. Among them, ABA8ox1 (Vitvi02g01269) was down-regulated at 1 and 4 hpt, ABA8ox2 (Vitvi06g00498) was down-regulated at 4 and R24 hpt, while the expression of ABA80x4 (Vitvi18g00792) was induced at R24 hpt (Figure 6, Table S4).
In ABA signal transduction pathway, the expression of ABA receptors PYRs/PYLs were decreased at one or more sampling time-points. Type 2C serine threonine protein phosphatase 2C 72 (PP2C 72, Vitvi04g00060) and PP2C53 (Vitvi04g00127) were down-regulated at 1 and 4 hpt, PP2C24 (Vitvi06g00533) was down-regulated at 1 hpt and up-regulated at R24 hpt, PP2C 16 (Vitvi09g00156) was down-regulated at 1 hpt, and PP2C 8 (Vitvi16g01985) was up-regulated at 4 and R24 hpt, while PP2C68 (Vitvi11g00270) was up-regulated at R24 hpt. Five DEGs annotated as SNF1-related type 2 protein kinases (SnRK2) were identified in this study. Among them, SAPK2 (Vitvi18g00440) and SAPK10 (Vitvi03g00452) were up-regulated at 1 and 4 hpt, and the later was also up-regulated at R24 hpt. SAPK3 (Vitvi13g04602) was down-regulated at 4 hpt and up-regulated at R24 hpt. Both SnRK2A (Vitvi07g02005) and SnRK2I (Vitvi07g01323) were down-regulated at 4 and R24 hpt. Five DEGs were annotated as ABA responsive element binding factor (ABF) in this study. Among them, two DEGs named as G-box-binding factor 4 (Vitvi18g02978 and Vitvi19g02076) were up-regulated at 4 hpt and the former was up-regulated at 1 hpt. Two DEGs named as ABI5-5 (Vitvi03g01574 and Vitvi18g00784) were up-regulated at R24 hpt. One DEG named as FD (Vitvi18g01165) was down-regulated at 1 and 4 hpt (Figure 6, Table S4).

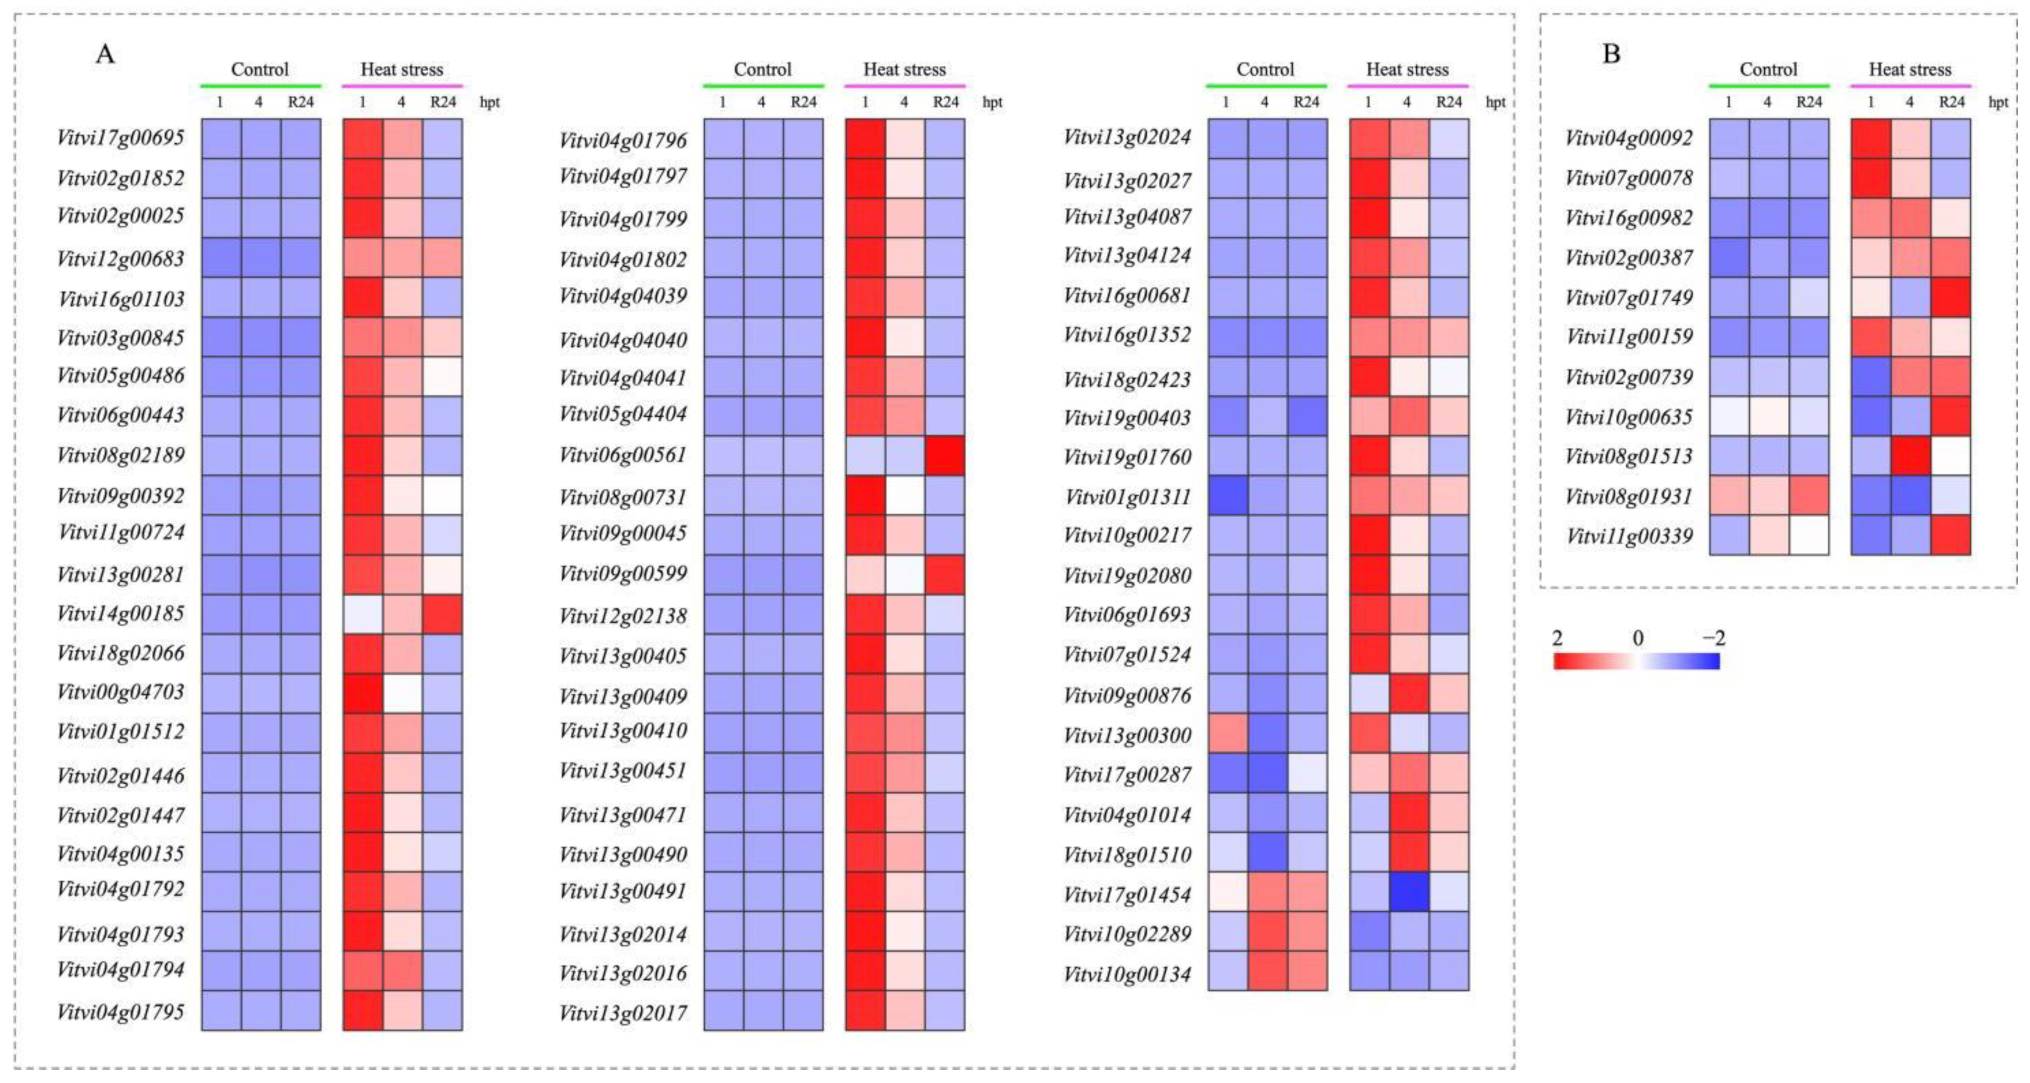
3.8. Effect of HS Treatment on Expression of HSPs and HSFs

In this study, 68 DEGs of the HSPs family were detected in the HS-treated grapevine transcriptome. Among these DEGs, 55 were up-regulated at all three sampling time-points, including 1 HSP101, 1 HSP70-HSP90 organizing protein, 3 HSP90, 9 HSP70, and 41 HSP20, while HSP90-5 (Vitvi01g01311), 2 HSP80 (Vitvi10g00217 and Vitvi19g02080), and 5 HSP70 (Vitvi06g01693, Vitvi07g01524, Vitvi09g00876, Vitvi13g00300, and Vitvi17g00287) were up-regulated at 1 and 4 hpt, and remained normal at R24 hpt. One HSP70 (Vitvi04g01014) and 1 HSP20 (Vitvi18g01510) were up-regulated at 4 hpt, and kept normal at 1 and R24 hpt. One HSP20 (Vitvi17g01454) was down-regulated at 4 hpt, 1 HSP20 (Vitvi10g02289) was down-regulated at R24 hpt, and 1 HSP20 (Vitvi10g00134) was down-regulated at 4 and R24 hpt (Figure 7A, Table S5).
Among our data, HSF30 (Vitvi04g00092), HSFA6b (Vitvi07g00078), HSFB2a (Vitvi16g00982), and HSFB2b (Vitvi02g00387) were significantly up-regulated at all of the three sampling time-points, HSF24 (Vitvi07g01749) and HSFA7a (Vitvi11g00159) were up-regulated at 1 and R24 hpt, HSF8 (Vitvi02g00739) and HSFA4a (Vitvi10g00635) were up-regulated at 4 hpt and R24 hpt, respectively, and HSFA2e (Vitvi08g01513) was up-regulated at 4 and R24 hpt. HSFB3 (Vitvi08g01931) was down-regulated throughout all time points, and HSFC1 (Vitvi11g00339) was down-regulated at 1 and 4 hpt, but up-regulated at R24 hpt (Figure 7B, Table S6).

4. Discussion

Since the response of plants to HS is an intricate physiological process, there are various pathways intertwined closely to regulate this mechanism. These mechanisms include physiological adaptations, such as photosynthesis and activation of signaling pathways, and gene regulatory networks inducing the expression of HSFs and HSPs governing HS response and acquisition of thermotolerance [4,5,47]. Therefore, it is not strange that thousands of genes were successfully detected as responsive to HS treatment. In the present study, we set up a control at each sampling time point to eliminate the influence of time change in a day.
Finally, compared with the control at each time point, 4520, 6196, and 4895 genes were identified to be regulated by HS at 1, 4 and R24 hpt, respectively. Among them, 685 and 469 genes were commonly down-regulated and up-regulated at the three sampling time-points, respectively. A few studies also reveal the molecular-level changes of grapes in response to HS. Using microarray analysis, Liu et al., showed that only 12 genes were usually up-regulated due to HS and recovery, and only 73 genes were generally down-regulated [5]. Compared with the results of our experiment, the much smaller number of differentially expressed genes may be due to the different experimental technique. Additionally, using the transcriptome technique, Ju et al., detected 1727 up-regulated genes and 1231 down-regulated genes in response to HS in Cabernet Sauvignon grapevine cuttings [48], and Liu et al., identified 1728 up-regulated and 1232 down-regulated genes in heat-treated Cabernet Sauvignon grapevine compared with control [49]. The difference between these two results and our study may be due to the difference of heat treatment methods and may also be related to the ploidy of varieties. The Cabernet Sauvignon grapevine is diploid, while the variety used in this study (Kyoho) is tetraploid. Previous studies showed that the ploidy levels can affect the gene expression and the classical RNA-Seq normalization approach may not be appropriate for the comparison of samples with different ploidy levels [50,51]. As polyploids have more than two basic sets of chromosomes, the number of each allele on the chromosome also increases, which may lead to gene higher expression and more obvious growth advantages than diploid plants [51]. Polyploidy breeding may also be a rapid strategy for adaptation to stress conditions. Compared with the previous experiment, the tetraploid variety (Kyoho) used in this experiment has a stronger response to high temperature stress at the gene expression level. This seems to give a molecular biological explanation for the heat resistance of thermostabilized polyploid grapes.
The responsive genes identified in this study were classified under a large number of GO terms and KEGG pathways. Of particular interest, genes involved in photosynthesis and ABA biosynthesis, metabolism, and signal transduction, as well as HSFs and HSPs were further analyzed. Gas exchange parameters, chlorophyll fluorescence and ABA content in HS treated grapevine leaves were measured.

4.1. Photosynthesis Was Inhibited by HS Treatment

Previous studies have reported that photosynthesis was the most critical process in plants that was directly or indirectly affected by temperature, and was very sensitive even in short-term temperature fluctuations [4,14,33,52]. Extremely high temperatures (above 40 °C) cause damage to photosynthetic apparatus and have a severe impact on photosynthesis [4]. In our study, Pn in leaves of HS-treated grape plants was decreased at all of the three sampling time-points, and even to a negative value at 4 hpt, but Ci was much higher under HS treatment than control at 4 and R24 hpt (Figure 3A,B), suggesting the photosynthesis system was deeply inhibited by HS treatment and the decreased Pn was not caused by the shortage of carbon dioxide supply [14,53], although tetraploid Kyoho may have higher stress tolerance [54]. It is worth noting that in HS-treated Kyoho grapevine, Gs was decreased at 1 hpt, but increased at 4 and R24 hpt (Figure 3C), but in Semillon grapevine, both stomatal conductance and photosynthesis were significant reduced immediately after the heat treatment [17]. When refer to the relationship between photosynthesis and stomatal conductance, there were two opposite viewpoints, Sepúlveda and Kliewer and Matsui et al., suggested that stomatal limitation fully accounted for the change in photosynthesis [18,55], while Godde and Bormnan held the view that stomatal conductance appeared to play only a minor role in the temperature limitation of photosynthesis [56]. From the analysis of gas exchange parameters in this study, we concluded that there was a significant linear relationship between photosynthesis and stomatal conductance in the short term post-HS treatment, but the inhibition of HS on Pn was not the result of stomata closing for longer periods, but rather non-stomata limitation, such as electron transport capacity [57,58]. The increase in Gs and Tr at 4 hpt in HS treated plants may be a self-regulation of plants under stress to decrease leaf surface temperature [59].
Studies have revealed that high temperatures induce anatomical and structural changes in the organization of the photosynthetic membranes of chloroplasts, leading to a decrease in the net photosynthetic rate [60]. In the photosynthesis system, PSⅡ that localized on the thylakoid membrane of chloroplast is often considered as the most heat-sensitive component in the photosynthetic apparatus, whereas PSI has been shown as a heat-resistant component of the photosynthetic electron transport chain [61,62]. In the present study, four genes in PSⅡ were up-regulated at 1 hpt, one gene was up-regulated at 4 hpt, and one gene was up-regulated at R24 hpt. Meanwhile, one and five genes in PSⅡ were down-regulated at 4 hpt and R24 hpt, respectively (Figure 5, Table S3). In PSI, two genes were up-regulated at 1 hpt in HS treated grape leaves, three genes were differentially expressed at 4 hpt. At R24 hpt, 2 and 11 genes in PSI were up-regulated and down-regulated, respectively, indicating PSⅡ was more sensitive to HS than PSI, and high thermal stress may cause serious and perhaps irreversible injury to both PSI and PSII of grapevine leaves [4,62].
As one subunit of the oxygen-evolving complex (OEC) located at the donor side of PSⅡ, the expression of PsbO was reduced at R24 hpt, suggesting that HS treatment injures the OEC. Previous studies have proved that PsbP and PsbQ have specific and important roles in coordinating the activity of the donor and acceptor sides of PSⅡ, and in stabilizing the active form of the PSⅡ-light-harvesting complex Ⅱ (LHCⅡ) supercomplex [63], Psb28 was involved in the recovery of PSⅡ at high temperature in Synechocystis [64]. In the present study, one PsbP gene (Vitvi04g01013) and Psb28 was up-regulated at 1 hpt, and another PsbP gene (Vitvi13g00254) was up-regulated at 1 and 4 hpt, while the PsbQ gene was down-regulated at 4 and R24 hpt (Figure 5, Table S3). From these results, we can assume that genes encoding PsbP and Psb28 play important roles in maintaining or recovery the function of PSⅡ.
High temperature can induce an imbalance between light energy absorption and utilization in photochemical electron transport [65]. Decreases in Fv/Fm are regarded as an indicator of inactivation of PSⅡ reaction centers, caused by damage to the thylakoid membrane [66]. In this study, Fv/Fm was decreased at 1 and 4 hpt in HS-treated grape plants, revealing the electron transfer at the acceptor side of PSII was blocked and the PSⅡ reaction centers was inactivated at 1 and 4 hpt, and was restored its function at R24 hpt. Meanwhile, ABS/CSm was decreased at 1 and 4 hpt, and to a minimum at 4 hpt. ETo/CSm, TRo/CSm, and RC/CSm were decreased at all of the three sampling time-points, and to a minimum at 4 hpt, while DIo/CSm was increased at 4 and R24 hpt (Figure 4), which suggested that HS treatment impaired the light energy absorption, conversion and electron transfer, as well as decreased the percentage of active reaction centers per cross sections of leaves, and this was another reason for the decreased photosynthetic rate [59,67].

4.2. ABA Biosynthesis, Catabolism and Signal Transduction Was Affected by HS Treatment

High temperature could increase ABA levels in plants by regulating ABA-associated genes and related pathways [20]. Carotenoids are precursors of ABA, and PSY is generally accepted as the most important regulatory enzyme in the biosynthesis of carotenoids and ABA [68]. In this study, two PSY2 genes (Vitvi04g02011 and Vitvi12g00084) were up-regulated in HS-treated grapevine plants, and the other PSY2 (Vitvi06g00084) was down-regulated at 1 and 4 hpt (Figure 6, Table S4), suggesting the diversity of the expression patterns of PSYs. β-carotene hydroxylase (CrtZ) could convert β-carotene to zeaxanthin, and the conversion of zeaxanthin to violaxanthin was affected by the expression level of the gene encoding zeaxanthin epoxidase (ZEP) [69,70]. In HS-treated Kyoho grape leaves, CrtZ2 (Vitvi16g01099) and 1 ZEP (Vitvi04g02205) were up-regulated at all of the three sampling time-points, 1 ZEP (Vitvi07g01745) was up-regulated at 1 and 4 hpt in HS-treated grapevine leaves, while CrtZ1 (Vitvi02g00020) was up-regulated at R24 hpt. Two ZEPs, Vitvi06g01061 and Vitvi02g01811 was up-regulated at 1 and 4 hpt, respectively. NCED, which catalyzed the cleavage of 9-cis-violaxanthin to produce xanthoxin, has been suggested was the key enzyme in the ABA biosynthetic pathway in plants [71], and the conversion of xanthoxin to abscisic aldehyde catalyzed by ABA2, and then to ABA by AAO3, were the last steps of the major ABA biosynthetic pathway [72]. In the present study, 3 NCED genes and 1 AAO3 was down-regulated at 1 hpt, but NCED1 and NCED4 were up-regulated at 4 and R24 hpt, while NCED2 was down-regulated at 4 hpt. Another AAO3 was up-regulated at 1 and 4 hpt in HS-treated grape leaves, and ABA2 was down-regulated at the three sampling time-points (Figure 6, Table S4).
The ABA catabolism is largely categorized into two types, an irreversible degradation hydroxylated by ABA8ox and a reversible conjugation catalyzed by ABA-GT [46]. In this study, the expression of ABA8ox1 was down-regulated at 1 and 4 hpt, ABA8ox2 was down-regulated at 4 and R24 hpt, while ABA80x4 was increased at R24 hpt (Figure 6, Table S4). The expression of ABA-GT was decreased at 1 hpt, and increased at R24 hpt, while CBSX1 was up-regulated at R24 hpt in HS-treated Kyoho leaves (Figure 6, Table S4). These results indicated that less ABA was resolved into PA or transformed into ABA-GE at 1 and 4 hpt, while the level of ABA catabolism was enhanced at R24 hpt. Based on these observations, it could be speculated that the ABA level was controlled by the balance between the rates of ABA biosynthesis and catabolism, and regulated by numerous genes involved in the two pathways, as suggested by Nambara and Marion-Poll [21].
ABA signal transduction consists of a double-negative regulatory mechanism, whereby the ABA-bound pyrabactin resistance (PYR)-like (PYL)/regulatory component of ABA receptor (RCAR) inhibit PP2C-type protein phosphatases activity, and PP2C inactivate SnRK2-type protein kinases [73,74]. In the absence of ABA, the receptor forms a homodimer, while the PP2C inhibits autophosphorylation of SnRK2 and phosphorylation of ABF2. In the presence of ABA, a receptor promoter engulfs the hormone within a pocket, allowing the receptor to bind the PP2C and cover the phosphatase active site, thus leads the autophophorylation of SnRK2 and phosphorylation of its ABF2 substrate. In its phosphorylated form, ABF2 binds to an ABA-responsive element (ABRE) in the promoter of ABA-responsive genes, activating transcription [75]. Additionally, it has been reported that increased ABA content could trigger stomatal closure [76]. Therefore, genes involved in the ABA signaling transduction pathway that induced stomatal closure were identified in this study. Results showed that the ABA content was increased in HS-treated grapevine plants at 1 hpt, the expression of 3 PYR/PYL, 4 PP2C genes and 1 ABF were decreased, while two SnRK2 were up-regulated at the same time, thus presumably resulting in the stomatal closure. At 4 hpt, the ABA content in HS treated plants was significantly less than that of the control, and the expression of 2 PYR/PYL, 2 PP2C, 3 SnRK2, and 1 ABF was down-regulated, while 1 PP2C, 2 SnRK2 and 2 ABF were up-regulated, and the Gs in HS treated plants was increased. At R24 hpt, lower ABA content was measured in HS-treated plants, 3 PP2C, 2 SnRKs and 2 ABF genes were up-regulated, while 2 PYR/PYL and 2 SnRK2 genes were down-regulated at the same time, possibly contributing to the higher Gs in HS-treated plants (Figure 3C, Figure 6 and Figure S3). Thus, there was a positive association between stomatal closure and ABA content in HS treated grapevines.

4.3. Heat Shock Proteins and Heat Shock Factors Were Mostly Up-Regulated by HS Treatment

HSPs play a central role in the response of plants to HS and their acquisition of thermotolerance [77]. Previous studies have shown that the heat signal was probably transduced by several pathways to converge on HSFs, followed by activation of a number of HSPs and other heat-responsive genes that drive the heat adaptation process in plants [78,79,80]. HSP families include HSP100 (Clp), HSP90, HSP70 (DnaK), HSP60 (chaperonin and GroEL) and small HSPs (sHSPs) [81]. Sixty-eight DEGs were identified in our study as candidate genes for membership in different HSP families. Most of the HSPs were significantly up-regulated during the heat treatment and the following recovery, and the expression level of some was sharply increased at 1 hpt and reduced gradually (Figure 7A, Table S5), which was consistent with previous study that plants suffering from HS sharply accumulated HSPs to enhance heat tolerance [82]. It has been confirmed that sHSPs played an important role in heat tolerance [83,84]. Wheat chloroplastic sHSP26 was highly induced by HS in vegetative and generative tissues in both wheat and Arabidopsis [85]. In the present study, differentially expressed sHSPs accounted for the total differentially expressed HSPs 66.18%, evidencing their importance (Figure 7A, Table S5).
HSFs play important roles in both basal and acquired thermotolerance through binding to cis-acting regulatory elements called heat shock elements (HSEs) in the promoter region of HSP genes [80]. Four HSFA3 homologous genes were identified in transcriptome of HS treated Rhododendron, and their expression levels were increased by 10,000-fold after heat treatment for 24 h [86]. In our study, one HSFA3 was identified, and it was up-regulated at 4 and R24 hpt, suggesting this gene could not sense the HS immediately (Figure 7B, Table S6). In grapevine, both VvHSFA2a and VpHSFB2b have been reported to be associated with thermotolerance [27,28]. In this study, HSFB2b was also up-regulated in HS-treated Kyoho leaves in all of the three sampling time-points, but no HSFA2a was identified (Figure 7). It should be noted that the expression levels of 2 HSFs were decreased post-HS treatment (Figure 7B, Table S6), thus, it could be speculated that these genes functioned negatively in the heat tolerance of grapevine.
It should be noted that most HSFs and HSPs maintained similar heat response profiles among subgenomes, indicating little functional divergence occurred among the orthologous genes of HSFs and HSPs, as suggested by Wang et al. [87].

5. Conclusions

The study provided evidence to suggest that PSⅡ was more sensitive to HS than PSⅠ, and genes encoding PsbP and Psb28 played important roles in maintaining the function of PSⅡ. HS treatment impaired the photosynthetic capacity of grapevine leaves, and there was a significant positive relationship between photosynthesis and stomatal conductance in the short term post-HS treatment, but the inhibition of HS on Pn was non-stomata limitation for a longer period. The ABA content in HS-treated Kyoho plants was higher than that in the control at 1 hpt, but less in HS-treated plants at 4 and R24 hpt, which was regulated by numerous genes involved in the ABA biosynthesis and catabolism pathways. Most differentially expressed HSFs and HSPs encoding sequences, especially HSF30, HSFA6b, HSFB2a, HSFB2b and sHSPs, played important roles in response to HS treatment. These results provide candidate genes and pathways involved in the HS responses in grapevine, especially deepening our understanding of relationship between photosynthesis, ABA biosynthesis, metabolism, signal transduction and HS in grapevine.

Supplementary Materials

The following supporting information can be downloaded at: at https://www.mdpi.com/article/10.3390/agronomy12102591/s1, Figure S1: Principal component analysis of RNA-seq data (A) and correlation of transcriptome profiles among samples post-HS treatment and control (B). Figure S2: Validation of the gene expression results of qRT-PCR and RNA-seq in the HS-treated grapevines and control. Figure S3: ABA content in HS-treated grapevines and control at 1, 4 and R24 hpt. Data represent mean values ± SD from three independent experiments. Asterisks indicate statistical significance (* 0.01 < p < 0.05, ** p < 0.01, Student’s t-test) of differences between HS-treated grapevines and control. Table S1. List of the primers used for quantitative real-time RT-PCR validation experiments. Table S2. Summary of Illumina reads mapping to the reference grapevine genome by BLAST analysis. Table S3. Transcriptomic profiles and annotation of DEGs involved in photosynthesis pathway following HS treatment and subsequent recovery. Table S4. Transcriptomic profiles and annotation of DEGs involved in the ABA biosynthesis, metabolism, and signal transduction pathways following HS treatment and subsequent recovery. Table S5. Transcriptomic profiles and annotation of DEGs contained in HSP family following HS treatment and subsequent recovery. Table S6. Transcriptomic profiles and annotation of DEGs contained in HSF family following HS treatment and subsequent recovery.

Author Contributions

Conceptualization, R.G. and X.C.; methodology, L.L., G.H. and S.Z.; software, R.W. and X.S.; investigation, J.H. and Y.Z.; writing, R.G. and X.C.; supervision, T.X. and X.B.; funding acquisition, R.G. and X.C. All authors have read and agree to the published version of the manuscript.

Funding

This research was funded by the National Natural Science Foundation of China (31860543 and 31760554), as well as the Science and Technology Development Fund of Guangxi Academy of Agricultural Sciences (Guinongke Grant No. 31860543, Guinongke2021JM26 and 2018JZ22).

Data Availability Statement

The RNA-seq rawdata has been deposited in the NCBI Sequence Read Archive under the accession number PRJNA752263 (https://www.ncbi.nlm.nih.gov/bioproject/PRJNA752263, accessed on 5 August 2021).

Acknowledgments

We thank Biomarker Technologies for their help with high-throughput-sequencing-related experiments.

Conflicts of Interest

The authors declare that they have no known competing financial interests or personal relationships that could have appeared to influence the work reported in this paper.

Abbreviations

HSheat stress
ABAabscisic acid
HSFsheat shock transcription factors
HSPsheat shock proteins
iiTRAQisobaric tags for relative and absolute quantitation
qRT-PCRquantitative real-time RT-PCR
FPKMfragments per kilobase of transcript per million mapped reads
NRNCBI non-redundant protein sequence database
COGCluster of Orthologous Groups
PfamThe database of Homologous protein family
KEGGThe database of Kyoto Encyclopedia of Genes and Genomes
GOGene Ontology
DEGsdifferentially expressed genes
PnNet photosynthetic rate
Gsstomatal conductance
Cisubstomatal CO2 concentration
Trtranspiration rate
PPFDphotosynthetic photon flux density
PSⅡphotosystem Ⅱ
PSⅠphotosystem Ⅰ
Fv/Fmmaximum quantum efficiency of PSⅡ photochemistry
CSmexcited leaf cross-section
ABS/CSmabsorption flux per CSm approximated
TRo/CSmtrapped energy flux per CSm
RC/CSmpercentage of active/inactive reaction centers per CSm
ETo/CSmelectron transport flux per CSm
DIo/CSmdissipated energy flux per CSm
Hpthour post treatment
R24 hpt24 h after recovery from treatment
PSYphytoene synthase
CrtZbeta-carotene hydroxylase
ZEPzeaxanthin epoxidase
NCED9-cis-epoxycarotenoid dioxygenase
ABAOabscisic-aldehyde oxidase
ABA8oxABA 8′-hydroxylase
ABA-GTABA glucosyltransferase
PAphaseic acid
ABA-GEABA glucosyl-ester
PP2Ctype 2C serine threonine protein phosphatase
SnRK2SNF1-related type 2 protein kinases
ABFABA-responsive element binding factor
ABIABA-insensitive
OECoxygen-evolving complex
LHCⅡPSⅡ-light-harvesting complex Ⅱ

References

  1. Vivier, M.A.; Pretorius, I.S. Genetically tailored grapevines for the wine industry. Trends Biotechnol. 2002, 20, 472–478. [Google Scholar] [CrossRef]
  2. Cramer, G.; Urano, K.; Delrot, S.; Pezzotti, M.; Shinozaki, K. Effects of abiotic stress on plants: A systems biology perspective. BMC Plant Biol. 2011, 11, 163. [Google Scholar] [CrossRef] [PubMed] [Green Version]
  3. Xu, H.G.; Liu, G.J.; Liu, G.T.; Yan, B.F.; Duan, W.; Wang, L.J.; Li, S.H. Comparison of investigation methods of heat injury in grapevine (Vitis) and assessment to heat tolerance in different cultivars and species. BMC Plant Biol. 2014, 14, 156. [Google Scholar] [CrossRef] [PubMed] [Green Version]
  4. Venios, X.; Korkas, E.; Nisiotou, A.; Banilas, G. Grapevine responses to heat stress and global warming. Plants 2020, 9, 1754. [Google Scholar] [CrossRef] [PubMed]
  5. Liu, G.T.; Wang, J.F.; Cramer, G.; Dai, Z.W.; Duan, W.; Xu, H.G.; Wu, B.H.; Fan, P.G.; Wang, L.J.; Li, S.H. Transcriptomic analysis of grape (Vitis vinifera L.) leaves during and after recovery from heat stress. BMC Plant Biol. 2012, 12, 174. [Google Scholar] [CrossRef] [PubMed] [Green Version]
  6. Cohen, S.D.; Tarara, J.M.; Gambetta, G.A.; Matthews, M.A.; Kennedy, J.A. Impact of diurnal temperature variation on grape berry development, proanthocyanidin accumulation, and the expression of flavonoid pathway genes. J. Exp. Bot. 2012, 63, 2655–2665. [Google Scholar] [CrossRef] [Green Version]
  7. Greer, D.H.; Weedon, M.M. The impact of high temperatures on Vitis vinifera cv. Semilion grapevine performance and berry ripening. Front. Plant Sci. 2013, 4, 491. [Google Scholar] [CrossRef] [Green Version]
  8. Zhang, J.H.; Huang, W.D.; Liu, Y.P.; Pan, Q.H. Effects of temperature acclimation pretreatment on the ultrastructure of mesophyll cells in young grape plants (Vitis vinifera L. cv. Jingxiu) under cross-temperature stresses. J. Integr. Plant Biol. 2005, 47, 959–970. [Google Scholar] [CrossRef]
  9. Kriedemann, P.E. Photosynthesis in vine leaves as a function of light intensity, temperature and leaf age. Vitis 1968, 7, 213–220. [Google Scholar]
  10. Ferrini, F.; Mattii, G.B.; Nicese, F.P. Effect of temperature on key physiological responses of grapevine leaf. Am. J. Enol. Viticult. 1995, 46, 375–379. [Google Scholar]
  11. Schultz, H.R. Extension of a Farquhar model for limitations of leaf photosynthesis induced by light environment, phenology and leaf age in grapevines (Vitis vinifera L. cv. White Riesling and Zinfandel). Funct. Plant Biol. 2003, 30, 673–687. [Google Scholar] [CrossRef]
  12. Yu, D.J.; Kim, S.J.; Lee, H.J. Stomatal and non-stomatal limitations to photosynthesis in field-grown grapevine cultivars. Biol. Plant. 2009, 53, 133–137. [Google Scholar] [CrossRef]
  13. Zsofi, Z.; Varadi, G.; Balo, B.; Marschall, M.; Nagy, Z. Heat acclimation of grapevine leaf photosynthesis: Mezzo- and macroclimate aspects. Funct. Plant Biol. 2009, 36, 310–322. [Google Scholar] [CrossRef]
  14. Luo, H.B.; Ma, L.; Xi, H.F.; Duan, W.; Li, S.H.; Loescher, W.; Wang, J.F.; Wang, L.J. Photosynthetic responses to heat treatments at different temperatures and following recovery in grapevine (Vitis amurensis L.) leaves. PLoS ONE 2011, 6, e23033. [Google Scholar] [CrossRef] [Green Version]
  15. Wang, L.J.; Fan, L.; Loescher, W.; Duan, W.; Liu, G.J.; Cheng, J.S.; Luo, H.B.; Li, S.H. Salicylic acid alleviates decreases in photosynthesis under heat stress and accelerates recovery in grapevine leaves. BMC Plant Biol. 2010, 10, 34. [Google Scholar] [CrossRef] [Green Version]
  16. Greer, D.H.; Weedon, M.M. Modelling photosynthetic responses to temperature of grapevine (Vitis vinifera cv. Semillon) leaves on vines grown in a hot climate. Plant Cell Environ. 2012, 35, 1050–1064. [Google Scholar] [CrossRef]
  17. Greer, D.H.; Weston, C. Heat stress affects flowering, berry growth, sugar accumulation and photosynthesis of Vitis vinifera cv. Semillon grapevines grown in a controlled environment. Func. Plant Biol. 2010, 37, 206–214. [Google Scholar] [CrossRef]
  18. Sepulveda, G.; Kliewer, W.M. Stomatal response of three grapevine cultivars (Vitis vinifera L.) to high temperature. Am. J. Enol. Vitic. 1986, 37, 44–52. [Google Scholar]
  19. Baron, K.N.; Schroeder, D.F.; Stasolla, C. Transcriptional response of abscisic acid (ABA) metabolism and transport to cold and heat stress applied at the reproductive stage of development in Arabidopsis thaliana. Plant Sci. 2012, 188–189, 48–59. [Google Scholar] [CrossRef]
  20. Sharma, E.; Borah, P.; Kaur, A.; Bhatnagar, A.; Mohapatra, T.; Kapoor, S.; Khurana, J.P. A comprehensive transcriptome analysis of contrasting rice cultivars highlights the role of auxin and ABA responsive genes in heat stress response. Genomics 2021, 113, 1247–1261. [Google Scholar] [CrossRef]
  21. Nambara, E.; Marion-Poll, A. Abscisic acid biosynthesis and catabolism. Annu. Rev. Plant Biol. 2005, 56, 165–185. [Google Scholar] [CrossRef] [Green Version]
  22. Larkindale, J.; Hall, J.D.; Knight, M.R.; Vierling, E. Heat stress phenotypes of Arabidopsis mutants implicate multiple signaling pathways in the acquisition of thermotolerance. Plant Physiol. 2005, 138, 882–897. [Google Scholar] [CrossRef] [Green Version]
  23. Larkindale, J.; Huang, B. Thermotolerance and antioxidant systems in Agrostis stolonifera: Involvement of salicylic acid, abscisic acid, calcium, hydrogen peroxide, and ethylene. J. Plant Physiol. 2004, 161, 405–413. [Google Scholar] [CrossRef]
  24. Gong, M.; Li, Y.J.; Chen, S.Z. Abscisic acid induced thermotolerance in maize seedlings is mediated by Ca2+ and associated with antioxidant systems. J. Plant Physiol. 1998, 153, 615–621. [Google Scholar] [CrossRef]
  25. Robertson, A.J.; Ishikawa, M.; Gusta, L.V.; MacKenzie, S.L. Abscisic acid-Induced heat tolerance in bromus inermis leyss cell-suspension cultures (heat-stable, abscisic acid-responsive polypeptides in combination with sucrose confer enhanced thermostability). Plant Physiol. 1994, 105, 181–190. [Google Scholar] [CrossRef] [Green Version]
  26. Zarrouk, O.; Brunetti, C.; Egipto, R.; Pinheiro, C.; Genebra, T.; Gori, A.; Lopes, C.M.; Tattini, M.; Chaves, M.M. Grape ripening is regulated by deficit irrigation/elevated temperatures according to cluster position in the canopy. Front. Plant Sci. 2016, 7, 1640. [Google Scholar] [CrossRef] [Green Version]
  27. Pillet, J.; Egert, A.; Pieri, P.; Lecourieux, F.; Kappel, C.; Charon, J.; Gomes, E.; Keller, F.; Delrot, S.; Lecourieux, D. VvGOLS1 and VvHsfA2 are involved in the heat stress responses in grapevine berries. Plant Cell Physiol. 2012, 53, 1776–1792. [Google Scholar] [CrossRef]
  28. Peng, S.B.; Zhu, Z.G.; Zhao, K.; Shi, J.L.; Yang, Y.Z.; He, M.Y.; Wang, Y.J. A novel heat shock transcription factor, VpHsf1, from Chinese Wild Vitis pseudoreticulata is involved in biotic and abiotic stresses. Plant Mol. Biol. Rep. 2013, 31, 240–247. [Google Scholar] [CrossRef]
  29. Liu, G.T.; Chai, F.M.; Wang, Y.; Jiang, J.Z.; Duan, W.; Wang, Y.T.; Wang, F.F.; Li, S.H.; Wang, L.J. Genome-wide identification and classification of HSF family in grape, and their transcriptional analysis under heat acclimation and heat stress. Hortic. Plant J. 2018, 4, 133–143. [Google Scholar] [CrossRef]
  30. Kobayashi, M.; Katoh, H.; Takayanagi, T.; Suzuki, S. Characterization of thermotolerance-related genes in grapevine (Vitis vinifera). J. Plant Physiol. 2010, 167, 812–819. [Google Scholar] [CrossRef]
  31. Kobayashi, M.; Takato, H.; Fujita, K.; Suzuki, S. HSG1, a grape Bcl-2-associated athanogene, promotes floral transition by activating CONSTANS expression in transgenic Arabidopsis plant. Mol. Biol. Rep. 2012, 39, 4367–4374. [Google Scholar] [CrossRef] [PubMed]
  32. Liu, G.T.; Ma, L.; Duan, W.; Wang, B.C.; Li, J.H.; Xu, H.G.; Yan, X.Q.; Yan, B.F.; Li, S.H.; Wang, L.J. Differential proteomic analysis of grapevine leaves by iTRAQ reveals responses to heat stress and subsequent recovery. BMC Plant Biol. 2014, 14, 110. [Google Scholar] [CrossRef] [PubMed] [Green Version]
  33. Jiang, J.F.; Liu, X.N.; Liu, C.H.; Liu, G.T.; Li, S.H.; Wang, L.J. Integrating omics and alternative splicing reveals insights into grape response to high temperature. Plant Physiol. 2017, 173, 1502–1518. [Google Scholar] [CrossRef] [PubMed]
  34. Rienth, M.; Torregrosa, L.; Sarah, G.; Ardisson, M.; Brillouet, J.-M.; Romieu, C. Temperature desynchronizes sugar and organic acid metabolism in ripening grapevine fruits and remodels their transcriptome. BMC Plant Biol. 2016, 16, 164. [Google Scholar] [CrossRef]
  35. Pucker, B.; Schwandner, A.; Becker, S.; Hausmann, L.; Viehöver, P.; Töpfer, R.; Weisshaar, B.; Holtgräwe, D. RNA-Seq time series of Vitis vinifera bud development reveals correlation of expression patterns with the local temperature profile. Plants 2020, 9, 1548. [Google Scholar] [CrossRef]
  36. Toups, H.S.; Cochetel, N.; Gray, D.; Cramer, G.R. VviERF6Ls: An expanded clade in Vitis responds transcriptionally to abiotic and biotic stresses and berry development. BMC Genom. 2020, 21, 472. [Google Scholar] [CrossRef]
  37. Jallion, O.; Aury, J.M.; Noel, B.; Policriti, A.; Clepet, C.; Casagrande, A.; Choisne, N.; Aubourg, S.; Vitulo, N.; Jubin, C.; et al. The grapevine genome sequence suggests ancestral hexaploidization in major angiosperm phyla. Nature 2007, 449, 463–467. [Google Scholar]
  38. Kim, D.; Langmead, B.; Salzberg, S.L. HISAT: A fast spliced aligner with low memory requirements. Nat. Methods 2015, 12, 357–360. [Google Scholar] [CrossRef] [Green Version]
  39. Trapnell, C.; Williams, B.A.; Pertea, G.; Mortazavi, A.; Kwan, G.; van Baren, M.J.; Salzberg, S.L.; Wold, B.J.; Pachter, L. Transcript assembly and quantification by RNA-Seq reveals unannotated transcripts and isoform switching during cell differentiation. Nat. Biotechnol. 2010, 28, 511–515. [Google Scholar] [CrossRef] [Green Version]
  40. Love, M.I.; Huber, W.; Anders, S. Moderated estimation of fold change and dispersion for RNA-seq data with DESeq2. Genome Biol. 2014, 15, 550. [Google Scholar] [CrossRef] [Green Version]
  41. Young, M.D.; Wakefield, M.J.; Smyth, G.K.; Oshlack, A. Gene ontology analysis for RNA-seq: Accounting for selection bias. Genome Biol. 2010, 11, R14. [Google Scholar] [CrossRef] [Green Version]
  42. Mao, X.; Cai, T.; Olyarchuk, J.G.; Wei, L. Automated genome annotation and pathway identification using the KEGG Orthology (KO) as a controlled vocabulary. Bioinformatics 2005, 21, 3787–3793. [Google Scholar] [CrossRef]
  43. Livak, K.J.; Schmittgen, T.D. Analysis of relative gene expression data using real-time quantitative PCR and the 2−ΔΔCT method. Methods 2001, 25, 402–408. [Google Scholar] [CrossRef]
  44. Sitko, K.; Rusinowski, S.; Pogrzeba, M.; Daszkowska-Golec, A.; Gieroń, Ż.; Kalaji, H.; Małkowski, E. Development and aging of photosynthetic apparatus of Vitis vinifera L. during growing season. Photosynthetica 2020, 58, 186–193. [Google Scholar] [CrossRef]
  45. Yang, J.C.; Zhang, J.H.; Wang, Z.Q.; Zhu, Q.S.; Wang, W. Hormonal changes in the grains of rice subjected to water stress during grain filling. Plant J. 2001, 127, 315–323. [Google Scholar] [CrossRef] [Green Version]
  46. Chen, W.K.; Yu, K.J.; Liu, B.; Lan, Y.B.; Sun, R.Z.; Li, Q.; He, F.; Pan, Q.H.; Duan, C.Q.; Wang, J. Comparison of transcriptional expression patterns of carotenoid metabolism in ‘Cabernet Sauvignon’ grapes from two regions with distinct climate. J. Plant Physiol. 2017, 213, 75–86. [Google Scholar] [CrossRef]
  47. Ohama, N.; Sato, H.; Shinozaki, K.; Yamaguchi-Shinozaki, K. Transcriptional regulatory network of plant heat stress response. Trends Plant Sci. 2017, 22, 53–65. [Google Scholar] [CrossRef]
  48. Ju, Y.; Min, Z.; Zhang, Y.; Zhang, K.-k.; Liu, M.; Fang, Y. Transcriptome profiling provide new insights into the molecular mechanism of grapevine response to heat, drought, and combined stress. Sci. Hortic. 2021, 286, 110076. [Google Scholar] [CrossRef]
  49. Liu, M.; Ju, Y.; Min, Z.; Fang, Y.; Meng, J. Transcriptome analysis of grape leaves reveals insights into response to heat acclimation. Sci. Hortic. 2020, 272, 109554. [Google Scholar] [CrossRef]
  50. Coate, J.E.; Doyle, J.J. Quantifying whole transcriptome size, a prerequisite for understanding transcriptome evolution across species: An example from a plant allopolyploid. Genome Biol. Evol. 2010, 2, 534–546. [Google Scholar] [CrossRef] [Green Version]
  51. Pirrello, J.; Deluche, C.; Frangne, N.; Gévaudant, F.; Maza, E.; Djari, A.; Bourge, M.; Renaudin, J.-P.; Brown, S.; Bowler, C.; et al. Transcriptome profiling of sorted endoreduplicated nuclei from tomato fruits: How the global shift in expression ascribed to DNA ploidy influences RNA-Seq data normalization and interpretation. Plant J. 2018, 93, 387–398. [Google Scholar] [CrossRef] [Green Version]
  52. Sharma, A.; Kumar, V.; Shahzad, B.; Ramakrishnan, M.; Singh Sidhu, G.P.; Bali, A.S.; Handa, N.; Kapoor, D.; Yadav, P.; Khanna, K.; et al. Photosynthetic response of plants under different abiotic stresses: A Review. J. Plant Growth Regul. 2020, 39, 509–531. [Google Scholar] [CrossRef]
  53. Li, Y.T.; Xu, W.W.; Ren, B.Z.; Zhao, B.; Zhang, J.W.; Liu, P.; Zhang, Z.S. High temperature reduces photosynthesis in maize leaves by damaging chloroplast ultrastructure and photosystem II. J. Agron. Crop Sci. 2020, 00, 1–17. [Google Scholar] [CrossRef]
  54. Allario, T.; Brumos, J.; Colmenero-Flores, J.M.; Iglesias, D.J.; Pina, J.A.; Navarro, L.; Talon, M.; Ollitrault, P.; Morillon, R. Tetraploid Rangpur lime rootstock increases drought tolerance via enhanced constitutive root abscisic acid production. Plant Cell Environ. 2013, 36, 856–868. [Google Scholar] [CrossRef]
  55. Matsui, A.; Ryugo, K.; Kliewer, W.M. Lowered berry quality due to heat stress at the early ripening stage of berry growth in a seeded grapevine, Vitis vinifera L. Res. Bull. Fac. Agric. Gifa Univ. 1991, 56, 139–145. [Google Scholar]
  56. Godde, D.; Bormnan, J.F. Regulation of photosynthesis in higher plants. In Molecular to Global Photosynthesis; Archer, M.D., Barber, J., Eds.; Imperial College Press: London, UK, 2004; pp. 221–286. [Google Scholar]
  57. Salvucci, M.E.; Crafts-Brandner, S.J. Relationship between the heat tolerance of photosynthesis and the thermal stability of rubisco activase in plants from contrasting thermal environments. Plant Physiol. 2004, 134, 1460–1470. [Google Scholar] [CrossRef] [Green Version]
  58. Way, D.A.; Oren, R. Differential responses to changes in growth temperature between trees from different functional groups and biomes: A review and synthesis of data. Physiology 2010, 30, 669–688. [Google Scholar] [CrossRef] [Green Version]
  59. Feng, B.; Liu, P.; Li, G.; Dong, S.T.; Wang, F.H.; Kong, L.A.; Zhang, J.W. Effect of Heat Stress on the Photosynthetic characteristics in flag leaves at the grain-filling stage of different heat-resistant winter wheat varieties. J. Agron. Crop Sci. 2014, 200, 143–155. [Google Scholar] [CrossRef]
  60. Bernardo, S.; Dinis, L.-T.; Machado, N.; Moutinho-Pereira, J. Grapevine abiotic stress assessment and search for sustainable adaptation strategies in Mediterranean-like climates. A review. Agron. Sustain. Dev. 2018, 38, 66. [Google Scholar] [CrossRef] [Green Version]
  61. Brestic, M.; Zivcak, M.; Olsovska, K.; Kalaji, H.M.; Shao, H.B.; Hakeem, K.R. Heat signaling and stress responses in photosynthesis. In Plant Signaling: Understanding the Molecular Crosstalk; Hakeem, K.R., Rehman, R.U., Tahir, I., Eds.; Springer: New Delhi, India, 2014; pp. 241–256. [Google Scholar]
  62. Kun, Z.; Bai-hong, C.; Yan, H.; Rui, Y.; Yu-an, W. Effects of short-term heat stress on PSII and subsequent recovery for senescent leaves of Vitis vinifera L. cv. Red Globe. J. Integr. Agr. 2018, 17, 2683–2693. [Google Scholar]
  63. Ifuku, K.; Ido, K.; Sato, F. Molecular functions of PsbP and PsbQ proteins in the photosystem II supercomplex. J. Photochem. Photobiol. B Biol. 2011, 104, 158–164. [Google Scholar] [CrossRef] [PubMed]
  64. Sakata, S.; Mizusawa, N.; Kubota-Kawai, H.; Sakurai, I.; Wada, H. Psb28 is involved in recovery of photosystem II at high temperature in Synechocystis sp. PCC 6803. B.B.A. Bioenerg. 2013, 1827, 50–59. [Google Scholar] [CrossRef] [PubMed] [Green Version]
  65. Wang, L.J.; Loescher, W.; Duan, W.; Li, W.D.; Yang, S.H.; Li, S.H. Heat acclimation induced acquired heat tolerance and cross adaptation in different grape cultivars: Relationships to photosynthetic energy partitioning. Funct. Plant Biol. 2009, 36, 516–526. [Google Scholar] [CrossRef] [PubMed]
  66. Roháček, K. Chlorophyll fluorescence parameters: The definitions, photosynthetic meaning, and mutual relationships. Photosynthetica 2002, 40, 13–29. [Google Scholar] [CrossRef]
  67. Zhang, Q.C.; Li, Y.; Xu, W.G.; Zhang, Y.; Qi, X.L.; Fang, Y.H.; Peng, C.J. Joint expression of Zmpepc, Zmppdk, and Zmnadp-me is more efficient than expression of one or two of those genes in improving the photosynthesis of Arabidopsis. Plant Physiol. Biochem. 2021, 158, 410–419. [Google Scholar] [CrossRef]
  68. Cazzonelli, C.I.; Pogson, B.J. Source to sink: Regulation of carotenoid biosynthesis in plants. Trends Plant Sci. 2010, 5, 266–274. [Google Scholar] [CrossRef]
  69. Guzman, I.; Hamby, S.; Romero, J.; Bosland, P.W.; O’Connell, M.A. Variability of carotenoid biosynthesis in orange colored Capsicum spp. Plant Sci. 2010, 179, 49–59. [Google Scholar] [CrossRef] [Green Version]
  70. Sugiyama, A.; Ikoma, Y.; Fujii, H.; Shimada, T.; Endo, T.; Shimizu, T.; Omura, M. Structure and expression levels of alleles of Citrus zeaxanthin epoxidase genes. J. Jpn. Soc. Hort. Sci. 2010, 79, 263–274. [Google Scholar] [CrossRef] [Green Version]
  71. Zhang, M.; Leng, P.; Zhang, G.L.; Li, X.X. Cloning and functional analysis of 9-cis-epoxycarotenoid dioxygenase (NCED) genes encoding a key enzyme during abscisic acid biosynthesis from peach and grape fruits. J. Plant Physiol. 2009, 166, 1241–1252. [Google Scholar] [CrossRef]
  72. Seo, M.; Koshiba, T. Complex regulation of ABA biosynthesis in plants. Trends Plant Sci. 2002, 7, 41–48. [Google Scholar] [CrossRef]
  73. Boneh, U.; Biton, I.; Schwartz, A.; Ben-Ari, G. Characterization of the ABA signal transduction pathway in Vitis vinifera. Plant Sci. 2012, 187, 89–96. [Google Scholar] [CrossRef]
  74. Lee, S.C.; Luan, S. ABA signal transduction at the crossroad of biotic and abiotic stress responses. Plant Cell Environ. 2012, 35, 53–60. [Google Scholar] [CrossRef]
  75. Klingler, J.P.; Batelli, G.; Zhu, J.K. ABA receptors: The START of a new paradigm in phytohormone signalling. J. Exp. Bot. 2010, 61, 3199–3210. [Google Scholar] [CrossRef] [Green Version]
  76. Schroeder, J.I.; Allen, G.J.; Hugouvieux, V.; Kwak, J.M.; Waner, D. Guard cell signal transduction. Annu. Rev. Plant Physiol. Plant Biol. 2001, 52, 627–658. [Google Scholar] [CrossRef] [Green Version]
  77. Sun, J.; Ren, L.P.; Cheng, Y.; Gao, J.J.; Dong, B.; Chen, S.M.; Chen, F.D.; Jiang, J.F. Identification of differentially expressed genes in Chrysanthemum nankingense (Asteraceae) under heat stress by RNA Seq. Gene 2014, 552, 59–66. [Google Scholar] [CrossRef]
  78. Bokszczanin, K.L.; Fragkostefanakis, S. Perspectives on deciphering mechanisms underlying plant heat stress response and thermotolerance. Front. Plant Sci. 2013, 4, 315. [Google Scholar] [CrossRef]
  79. Kotak, S.; Larkindale, J.; Lee, U.; Koskull-Doring, P.V.; Vierling, E.; Scharf, K.D. Complexity of the heat stress response in plants. Curr. Opin. Plant Biol. 2007, 10, 310–316. [Google Scholar] [CrossRef]
  80. Saidi, Y.; Finka, A.; Goloubinoff, P. Heat perception and signalling in plants: A tortuous path to thermotolerance. New Phytol. 2011, 190, 556–565. [Google Scholar] [CrossRef]
  81. Huang, B.R.; Xu, C.P. Identification and characterization of proteins associated with plant tolerance to heat stress. J. Integr. Plant Biol. 2008, 50, 1230–1237. [Google Scholar] [CrossRef]
  82. Wahid, A.; Gelani, S.; Ashraf, M.; Foolad, M.R. Heat tolerance in plants: An overview. Environ. Exp. Bot. 2007, 61, 199–223. [Google Scholar] [CrossRef]
  83. Heckathorn, S.A.; Downs, C.A.; Sharker, T.D.; Coleman, J.S. The small, methionine-rich chloroplast heat-shock protein protects photosystem II electron transport during heat stress. Plant Physiol. 1998, 116, 439–444. [Google Scholar] [CrossRef] [Green Version]
  84. Sanmiya, K.; Suzuki, K.; Egawa, Y.; Shono, M. Mitochondrial small heat-shock protein enhances thermotolerance in tobacco plants. FEBS Lett. 2004, 557, 265–268. [Google Scholar] [CrossRef] [Green Version]
  85. Chuang, H.; Khurana, N.; Nijhavan, A.; Khurana, J.P.; Khurana, P. The wheat chloroplastic small heat shock protein (sHSP26) is involved in seed maturation and germination and imparts tolerance to heat stress. Plant Cell Environ. 2012, 35, 1912–1931. [Google Scholar]
  86. Fang, L.C.; Tong, J.; Dong, Y.F.; Xu, D.Y.; Mao, J.; Zhou, Y. De novo RNA sequencing transcriptome of Rhododendron obtusum identified the early heat response genes involved in the transcriptional regulation of photosynthesis. PLoS ONE 2017, 12, e0186376. [Google Scholar] [CrossRef] [Green Version]
  87. Wang, X.M.; Chen, S.Y.; Shi, X.; Liu, D.N.; Zhao, P.; Lu, Y.Z.; Cheng, Y.B.; Liu, Z.S.; Nie, X.J.; Song, W.N.; et al. Hybrid sequencing reveals insight into heat sensing and signaling of bread wheat. Plant J. 2019, 98, 1015–1032. [Google Scholar] [CrossRef]
Figure 1. Comparison of gene expression at 1, 4 h post-HS treatment (hpt) and 24 h after recovery from 4 h of HS treatment (R24 hpt) between HS-treated grapevines and control. (A) Number of DEGs (p-value ≤ 0.05 and fold-change ≥ 2) between HS-treated grapevines and control at three sampling time points. (B) Venn diagram showing the relationship among up-regulated DEGs at 1, 4, and R24 hpt. (C) The top five enriched GO terms of commonly up-regulated DEGs at the three sampling time-points in the ‘biological process’, ‘cellular component’ and ‘molecular function’ categories. (D) Venn diagram showing the relationship between down-regulated DEGs at 1, 4, and R24 hpt. (E) The top five enriched GO terms of commonly down-regulated DEGs at the three sampling time-points in the ‘biological process’, ‘cellular component’ and ‘molecular function’ categories.
Agronomy 12 02591 g001
Figure 2. The top 10 enriched pathways of DEGs between HS-treated grapevines and control. (A) The top 10 enriched pathways of up-regulated DEGs at 1 hpt. (B) The top 10 enriched pathways of down-regulated DEGs at 1 hpt. (C) The top 10 enriched pathways of up-regulated DEGs at 4 hpt. (D) The top 10 enriched pathways of down-regulated DEGs at 4 hpt. (E) The top 10 enriched pathways of up-regulated DEGs at R24 hpt. (F) The top 10 enriched pathways of down-regulated DEGs at R24 hpt.
Agronomy 12 02591 g002
Figure 3. Effect of HS treatment on gas exchange parameters. (A) net photosynthetic rate (Pn), (B) intercellular CO2 concentration (Ci), (C) stomatal conductance (Gs), (D) transpiration rate (Tr). Gas exchange parameters were measured on the fifth leaf from the top of each plant at a CO2 concentration of 400 μmol mol−1 and a PPFD of 1200 μmol m−2 s−1. Asterisks indicate statistical significance (* 0.01 < p < 0.05, ** p < 0.01, Student’s t-test) of differences between the HS treatment and control at three sampling time-points. Data represent mean values ± SD from three independent experiments.
Agronomy 12 02591 g003
Figure 4. Effect of HS treatment on chlorophyll fluorescence. (A) Fv/Fm (the maximum quantum efficiency of PSⅡ photochemistry), (B) ABS/CSm (absorption flux per CSm approximated), (C) ETo/CSm (electron transport flux per CSm), (D) TRo/CSm (trapped energy flux per CSm), (E) RC/CSm (percentage of active/inactive reaction centers per CSm), (F) DIo/CSm (dissipated energy flux per CSm). Asterisks indicate statistical significance (* 0.01 < p < 0.05, ** p < 0.01, Student’s t-test) of differences between the HS treatment and control at three sampling time-points. Data represent mean values ± SD from three independent experiments.
Agronomy 12 02591 g004
Figure 5. Transcriptomic profiles of DEGs involved in photosynthesis pathway following HS treatment and subsequent recovery. Different shades of red and blue express the average FPKM value (log2 transformed) of the gene in each sample, as illustrated in the legend.
Agronomy 12 02591 g005
Figure 6. Transcriptomic profiles of DEGs involved in the ABA biosynthesis, metabolism, and signal transduction pathways following HS treatment and subsequent recovery. Different shades of red and blue express the average FPKM value (log2 transformed) of the gene in each sample, as illustrated in the legend.
Agronomy 12 02591 g006
Figure 7. Transcriptomic profiles of DEGs contained in the HSP (A) and HSF (B) families following HS treatment and subsequent recovery. Different shades of red and blue express the average FPKM value (log2 transformed) of the gene in each sample, as illustrated in the legend.
Agronomy 12 02591 g007
Publisher’s Note: MDPI stays neutral with regard to jurisdictional claims in published maps and institutional affiliations.

