Article

Empower Innovations in Routine Soil Testing

by
Jan Adriaan Reijneveld
1,*,
Martijn Jasper van Oostrum
2,
Karst Michiel Brolsma
2,
Dale Fletcher
3 and
Oene Oenema
4
1
Eurofins International Agro Competence Center, Binnenhaven 5, 6709 PD Wageningen, The Netherlands
2
Eurofins Agro, Binnenhaven 5, 6709 PD Wageningen, The Netherlands
3
Department of Computer Science, University of Waikato, 124 Hillcrest Road, 3216 Hamilton, New Zealand
4
Wageningen Environmental Research, P.O. Box 47, 6700 AA Wageningen, The Netherlands
*
Author to whom correspondence should be addressed.
Agronomy 2022, 12(1), 191; https://doi.org/10.3390/agronomy12010191
Submission received: 29 November 2021 / Revised: 29 December 2021 / Accepted: 11 January 2022 / Published: 13 January 2022

Abstract

:
Conventional soil tests are commonly used to assess single soil characteristics. Thus, many different tests are needed for a full soil fertility/soil quality assessment, which is laborious and expensive. New broad-spectrum soil tests offer the potential to assess many soil characteristics quickly, but often face challenges with calibration, validation, and acceptance in practice. Here, we describe the results of a 20 year research program aimed at overcoming the aforementioned challenges. A three-step approach was applied: (1) selecting and establishing two contrasting rapid broad-spectrum soil tests, (2) relating the results of these new tests to the results of conventional soil tests for a wide variety of soils, and (3) validating the results of the new soil tests through field trials and communicating the results. We selected Near Infrared Spectroscopy (NIRS) and multi-nutrient 0.01 M CaCl2 extraction (1:10 soil to solution ratio; w/v) as broad-spectrum techniques. NIRS was extensively calibrated and validated for the physical, chemical, and biological characteristics of soil. The CaCl2 extraction technique was extensively calibrated and validated for ‘plant available’ nutrients, often in combination with the results of NIRS. The results indicate that the accuracy of NIRS determinations is high for SOM, clay, SOC, ECEC, Ca-CEC, N-total, sand, and inorganic-C (R2 ≥ 0.95) and good for pH, Mg-CEC, and S-total (R2 ≥ 0.90). The combination of the CaCl2 extraction technique and NIRS gave results that related well (R2 > 0.80) to the results of conventional soil tests for P, K, Mg, Na, Mn, Cu, Co, and pH. In conclusion, the three-step approach has revolutionized soil testing in The Netherlands. These two broad-spectrum soil tests have improved soil testing; have contributed to increased insights into the physical, chemical, and biological characteristics of soil; and have thereby led to more sustainable soil management and cropping systems.

1. Introduction

High-yielding production systems can be built on soils with high natural or improved soil fertility [1,2]. Such systems are indispensable for producing the food required for an increasing world population, because almost all of our food and feed originates from soil-based crop production. It has been estimated that the world’s total crop production has to increase by 50 to 70% between 2010 and 2050, for which sustainable soil fertility management is key [3].
Soil fertility may have different meanings in the literature [4]; here, it is defined in terms of the ‘yielding potential of the soil’. It is a function of parent material and soil-forming factors, including climate, relief, organisms, time, and management [5]. Notably, the last factor has become more important during the last few decades. There are three main components of soil fertility: physical, chemical, and biological. The interactions between these three components are also important [6]. The physical component relates to soil texture and structure, which determine, among other things, the porosity, water holding capacity, and rootability of soil [7]. The biological component relates to the diversity, abundance, and interactions of organisms in soil, which influence the disease suppressive capacity of the soil, the organic matter and nutrient transformations in soil, and the soil structure. The chemical component relates to the elemental composition of the solid, liquid, and gaseous phases of the soil and to the interactions between these phases, which, together with the physical and biological components, determine the ‘fertility status’ of the soil, including the acidity, salinity, nutrient holding capacity, and nutrient mobility. There is growing awareness that the biological and physical components of soil fertility are as important as the chemical component of soil for managing soil and crop production in a sustainable manner [8]. However, in current practice only a few (mostly chemical) soil characteristics are used in routine soil testing (often pH, N, P, and K, as well as SOM), mainly for cost reasons [9,10].
Soil fertility testing started in the 19th century for research purposes and started for farmers at the beginning of the 20th century [11]. At first, ‘total’ amounts of N, S, P, K, Ca, Mg, and Fe in soil were measured, assuming that these amounts would predict nutrient release during the growing season. This turned out to be not successful because there was hardly any relationship between the ‘total’ amounts (or contents) of nutrients in the soil and crop yield [11]. Thereafter, elements extractable from soil with strong acids were used, but this method also gave unsatisfactory correlations with crop yield [12]. An important discovery was that nutrients were present in the soil in different forms and with different bonds, and thereby had different availabilities for uptake by plant roots. This resulted in soil tests using weak acids as extractants. Daubeny [13] was one of the first to experiment with this by discriminating between ‘active’ and ‘dormant’ fractions of nutrients. Dyer [14] coined the term (plant) availability of nutrients. Since then, a wide range of different solutions and procedures have been tested and used for soil fertility assessment because the results of test procedures appeared to be specific for different crop rotations, soil types, and regions. At the same time, there has been little or no international coordination and harmonization of analytical procedures, although recently the Global Soil Laboratory Network was initiated (www.fao.org/global-soil-partnership/glosolan/en/ (accessed on 28 November 2021)).
It has been suggested repeatedly that combinations of soil physical, chemical, and biological characteristics and of various soil nutrient fractions (so-called soil nutrient quantity and soil nutrient intensity fractions) may provide more insight into the temporal dynamics and availability of plant nutrients in soil, and hence more insight into the response of a crop to fertilization and soil management than a single soil test could provide [15,16,17,18]. However, this soil nutrient ‘intensity-quantity’ concept was not implemented in practice until 2004 (as discussed below), mainly because of the presumed increased cost of the analyses.
Soil fertility assessments are commonly based on ‘statistical correlations’—i.e., the results of the soil tests have to be correlated statistically to the results of crop responses, measured in multiple site-year field experiments [19,20,21]. This latter field testing is demanding and thereby also often an obstacle for the introduction of new, improved concepts for soil testing.
Reijneveld et al., 2014 [22], proposed a pragmatic approach for implementing new soil tests in agricultural practice: (1) selecting and establishing new rapid broad-spectrum soil testing techniques that are analytically calibrated; (2) calibrating the results of these broad-spectrum soil testing techniques to the results of (laborious) conventional soil tests using statistical regression models and data and knowledge from ‘old’ soil tests and fertilization trials (first-step agronomic calibration); and (3) validating the new soil tests and concepts in field trials (agronomic validation). Simultaneously, this method called for implementing the new insights and soil characteristics stepwise in practice along with farmers’ field schools.
This three-step approach has been implemented gradually in The Netherlands from 2004 onwards for two rapid broad-spectrum soil testing techniques: multi-nutrient 0.01 M CaCl2 extraction and Near Infrared Spectroscopy (NIRS). Critical to the introduction of new soil tests is their meaningfulness, accuracy, and precision. Here, we report on the development and implementation of this three-step approach in practice using results from a wide range of studies and tests conducted during the past 15 years. We tested the following hypotheses: (i) the results of new broad-spectrum soil testing techniques compare well with the results of reference methods (analytical calibration)—i.e., the correlation coefficient of determination R2 > 0.90 and the residual prediction deviation RPD > 2.0; (ii) the explained variance (R2) of the relation between the results of the broad-spectrum soil testing techniques and those of conventional soil test methods (first-step agronomic calibration) exceeds 80%; and (iii) routinely analyzing a comprehensive number of soil characteristics will increase ultimately crop yield and quality and contribute to sustainable soil management.
For testing the first hypotheses, we made use of data of soil analyses from Eurofins Agro, Wageningen, The Netherlands. Eurofins Agro is the successor of the BLGG laboratories founded in 1927 and currently analyzes > 100,000 soil samples a year, including >80% of the soil samples offered to the agronomical soil testing market in The Netherlands. For testing the second hypothesis, we used the results from databases of, among others, Wageningen University and Eurofins Agro. The third hypothesis has been tested in several studies and is still part of several ongoing research programs.

2. Materials and Methods

A brief overview of the three-step approach is given below.
In step 1, promising soil testing techniques were selected (and analytically calibrated and validated) for measuring meaningful characteristics so as to obtain a rapid and integrated soil fertility assessment. Near Infrared Spectroscopy (NIRS) was chosen for measuring key soil physical, chemical (soil quantity), and biological characteristics, while multi-nutrient extractions were performed with 0.01 M CaCl2 followed by discrete analysis (DA). ICP-AES or ICP-MS were chosen for assessing plant available nutrients.
In step 2, the results of NIRS and multi-nutrient extractions were related to the results of a wide range of conventional soil tests carried out using advanced statistical methods (first-step agronomic calibration). In step 3, validation experiments in the field were performed to test whether the new soil tests resulted in more accurate predictions of soil fertility and improved fertilization and soil management recommendations (improved agronomic calibration and validation). Simultaneously, the new soil test results and insights were implemented stepwise in practice along with farmers’ field schools.

2.1. Step 1: Selection and Calibration of Rapid Broad-Spectrum Soil Testing Techniques

2.1.1. Multi-Nutrient Extractions with 0.01 M CaCl2

Multi-nutrient extractions with 0.01 M CaCl2 were first proposed for assessing the readily available nutrients in soil more than half a century ago [23]. Decades later, this method was promoted again by, among others, refs. [24,25,26], as it is relatively simple and cheap and a solution of 0.01 M CaCl2 has a comparable ionic strength to soil solutions of most soils. Thus, the measured nutrients in the extract reflect the availability of the nutrients at the pH and ionic strength of the soil solution. Various nutrient elements and metals can be measured in a single extract simultaneously, which allows us to consider the relationships between available nutrients. This method has been used routinely in The Netherlands from 2004 onwards based on the studies by Houba et al. (1990; 1994) and Van Erp (2002) [24,25,26].
In this publication, we summarize the results of >350,000 routine soil tests from The Netherlands; all data originate from the period 2010–2014 (Table 1; Figure 1). All samples were taken and analyzed by one laboratory (Eurofins Agro). Soil samples were analyzed at farmers’ request and results were documented in reports to farmers. Fields (up to 5 hectare) were sampled by taking 40 subsamples when walking in a ‘W’-like pattern over them, and these subsamples were bulked and mixed into one sample for subsequent analysis. The standard sampling depth for grassland was 0–10 cm, and that for arable land was 0–25 cm. Prior to extraction, soil samples were dried at 40 °C; gently milled; and sieved (2 mm) to remove gravel, stubble, and roots. After extraction at a 1:10 extraction ratio (w/v) for two hours at 20 °C, nutrient element concentrations were determined by discrete analysis (DA) and ICP-AES or ICP-MS under controlled conditions. Results were verified analytically through reference samples, duplicated samples, and ring tests (see Supplementary Information).
Please note that the results of the 0.01 M CaCl2 test are subject to quality assurance (S4), which is subdivided into first- (checked by laboratory analysts themselves), second- (independently checked through control samples by the analyst), and third-line control ring-tests by ILVO (www.ilvo.vlaanderen.be), VITO (www.vito.be), and Wepal ISE (http://www.wepal.nl (accessed on 28 November 2021)). For the first control check, a total of 5 standard soil samples are used, and for the second control check a total of 3 standard soil samples are used. For most nutrient elements, the measured contents in the reference samples are stable, but this is not the case for N and S. For micro nutrients, procedures have been implemented to prevent contamination in the laboratory and the loss of micro nutrients through adsorption on filters and glassware. All determinations in the ring tests were within the quality boundaries used by Wepal, ILVO, and VITO (not shown).

2.1.2. Near Infrared Spectroscopy

Near infrared spectroscopy (NIRS) for solid materials was developed in the 1960s to determine the element and compound concentrations of an object via the surface reflectance and calibration of the obtained spectra to the results of conventional reference methods [31]. NIRS has been used for assessing the feed quality of grass and maize silage on a routine basis by Eurofins-Agro since 1986. NIRS allows for the fast, quantitative, non-destructive, and cost-effective estimation of multiple physical, chemical, and biological soil characteristics from the same spectral data [32,33,34] once sufficiently large databases have been established with reference data [35] and accurate calibration and validation procedures have been implemented [36,37]. Eurofins Agro started with NIRS for soil fertility assessments in 2003, in parallel with conventional soil test methods (Table 2 and Table 3), so as to build a solid calibration and validation database. In this study, we report the results of calibration and validation (Supplementary Information S1–S4; Supplementary Figure S1; Supplementary Table S1). Following soil sampling, drying, and sieving (using the procedures described above), an amount of 125 g of soil is put into standard glass jars, equilibrated at room temperature, and scanned in replicate runs with a Q-interline FT-NIRS analyzer (http://www.q-interline.com (accessed on 28 November 2021)) in a climate-controlled room. Spectral data are measured as absorbance. The spectra are trimmed to include only the wavelengths between 1000 and 2667 nm with a resolution of 16 cm−1. Spectra are then related to the results of reference methods using statistical models based on a set of 4 filters (AMX-S2000, 2018). First, spectra are transformed into a new latent space by applying the Savitzky–Golay method [38,39] and the partial least squares method [40]. The nearest neighbor method [41] is then subjected to Gaussian processes [42] to generate the final result.
Calibration models are currently based on a minimum of 1000 reference samples (but for some tests up to 90,000 reference samples are available), depending on the year of the introduction of the specific soil characteristics, the efforts made to create high-quality models, and the number of ‘outliers’. Over the years, calibration models have been improved, more soil characteristics have been calibrated and validated, and many of these have gradually been introduced into routine soil testing (Table 2 and Table 4). Although there is some debate regarding the reliability of the use of RPD to evaluate NIRS [65,66], it has been used for several years by NIR scientists working on agricultural products and has been adopted by soil scientists [67]. We choose to give the RPD values in addition to R2, the root mean squared error (RMSE), and bias. An RPD value of >2 is used as a threshold for adequacy, following the guidelines of Chang et al. (2001) [68].

2.2. Step 2: Relate Results of the New Testing Techniques to Those of Conventional Soil Tests

The results of NIRS and multi-nutrient extraction determinations were related to the results of conventional soil tests using descriptive statistics—i.e., correlation (R2) and regression coefficients (Table 3). A database of the results of a large number of projects was compiled and comparisons were made between the results of NIRS and CaCl2 extraction determinations and those of conventional analyses. These projects included both national projects and EU-funded projects covering different countries (Table 3).

2.3. Step 3: Improved Agronomical Calibration and Validation, and Communication

The results of the new broad-spectrum soil tests were introduced in practice via soil test reports stepwise from 2004 onwards. Initially, fertilization and soil management recommendations were based on the results of conventional methods only, but over time new fertilization recommendations tests were presented and implemented in agricultural practice (farmers and extension services) and research.
In the meantime, additional laboratory and greenhouse research and field trials were conducted to further develop a new mechanistic approach for fertilization recommendations in practice; this approach considered the soil nutrient intensity, buffering capacity, and quantity concept [18,69,70]. This new approach makes use of two broad-spectrum soil tests and has been tested in several studies (see Supplementary Information S5). At the same time, communication campaigns, farmers’ field schools, and meetings with advisors were organized to explain the concept and improve the implementation of the new approach and soil tests in practice.

3. Results

3.1. Step1: Calibration of the Broad-Spectrum Soil Tests

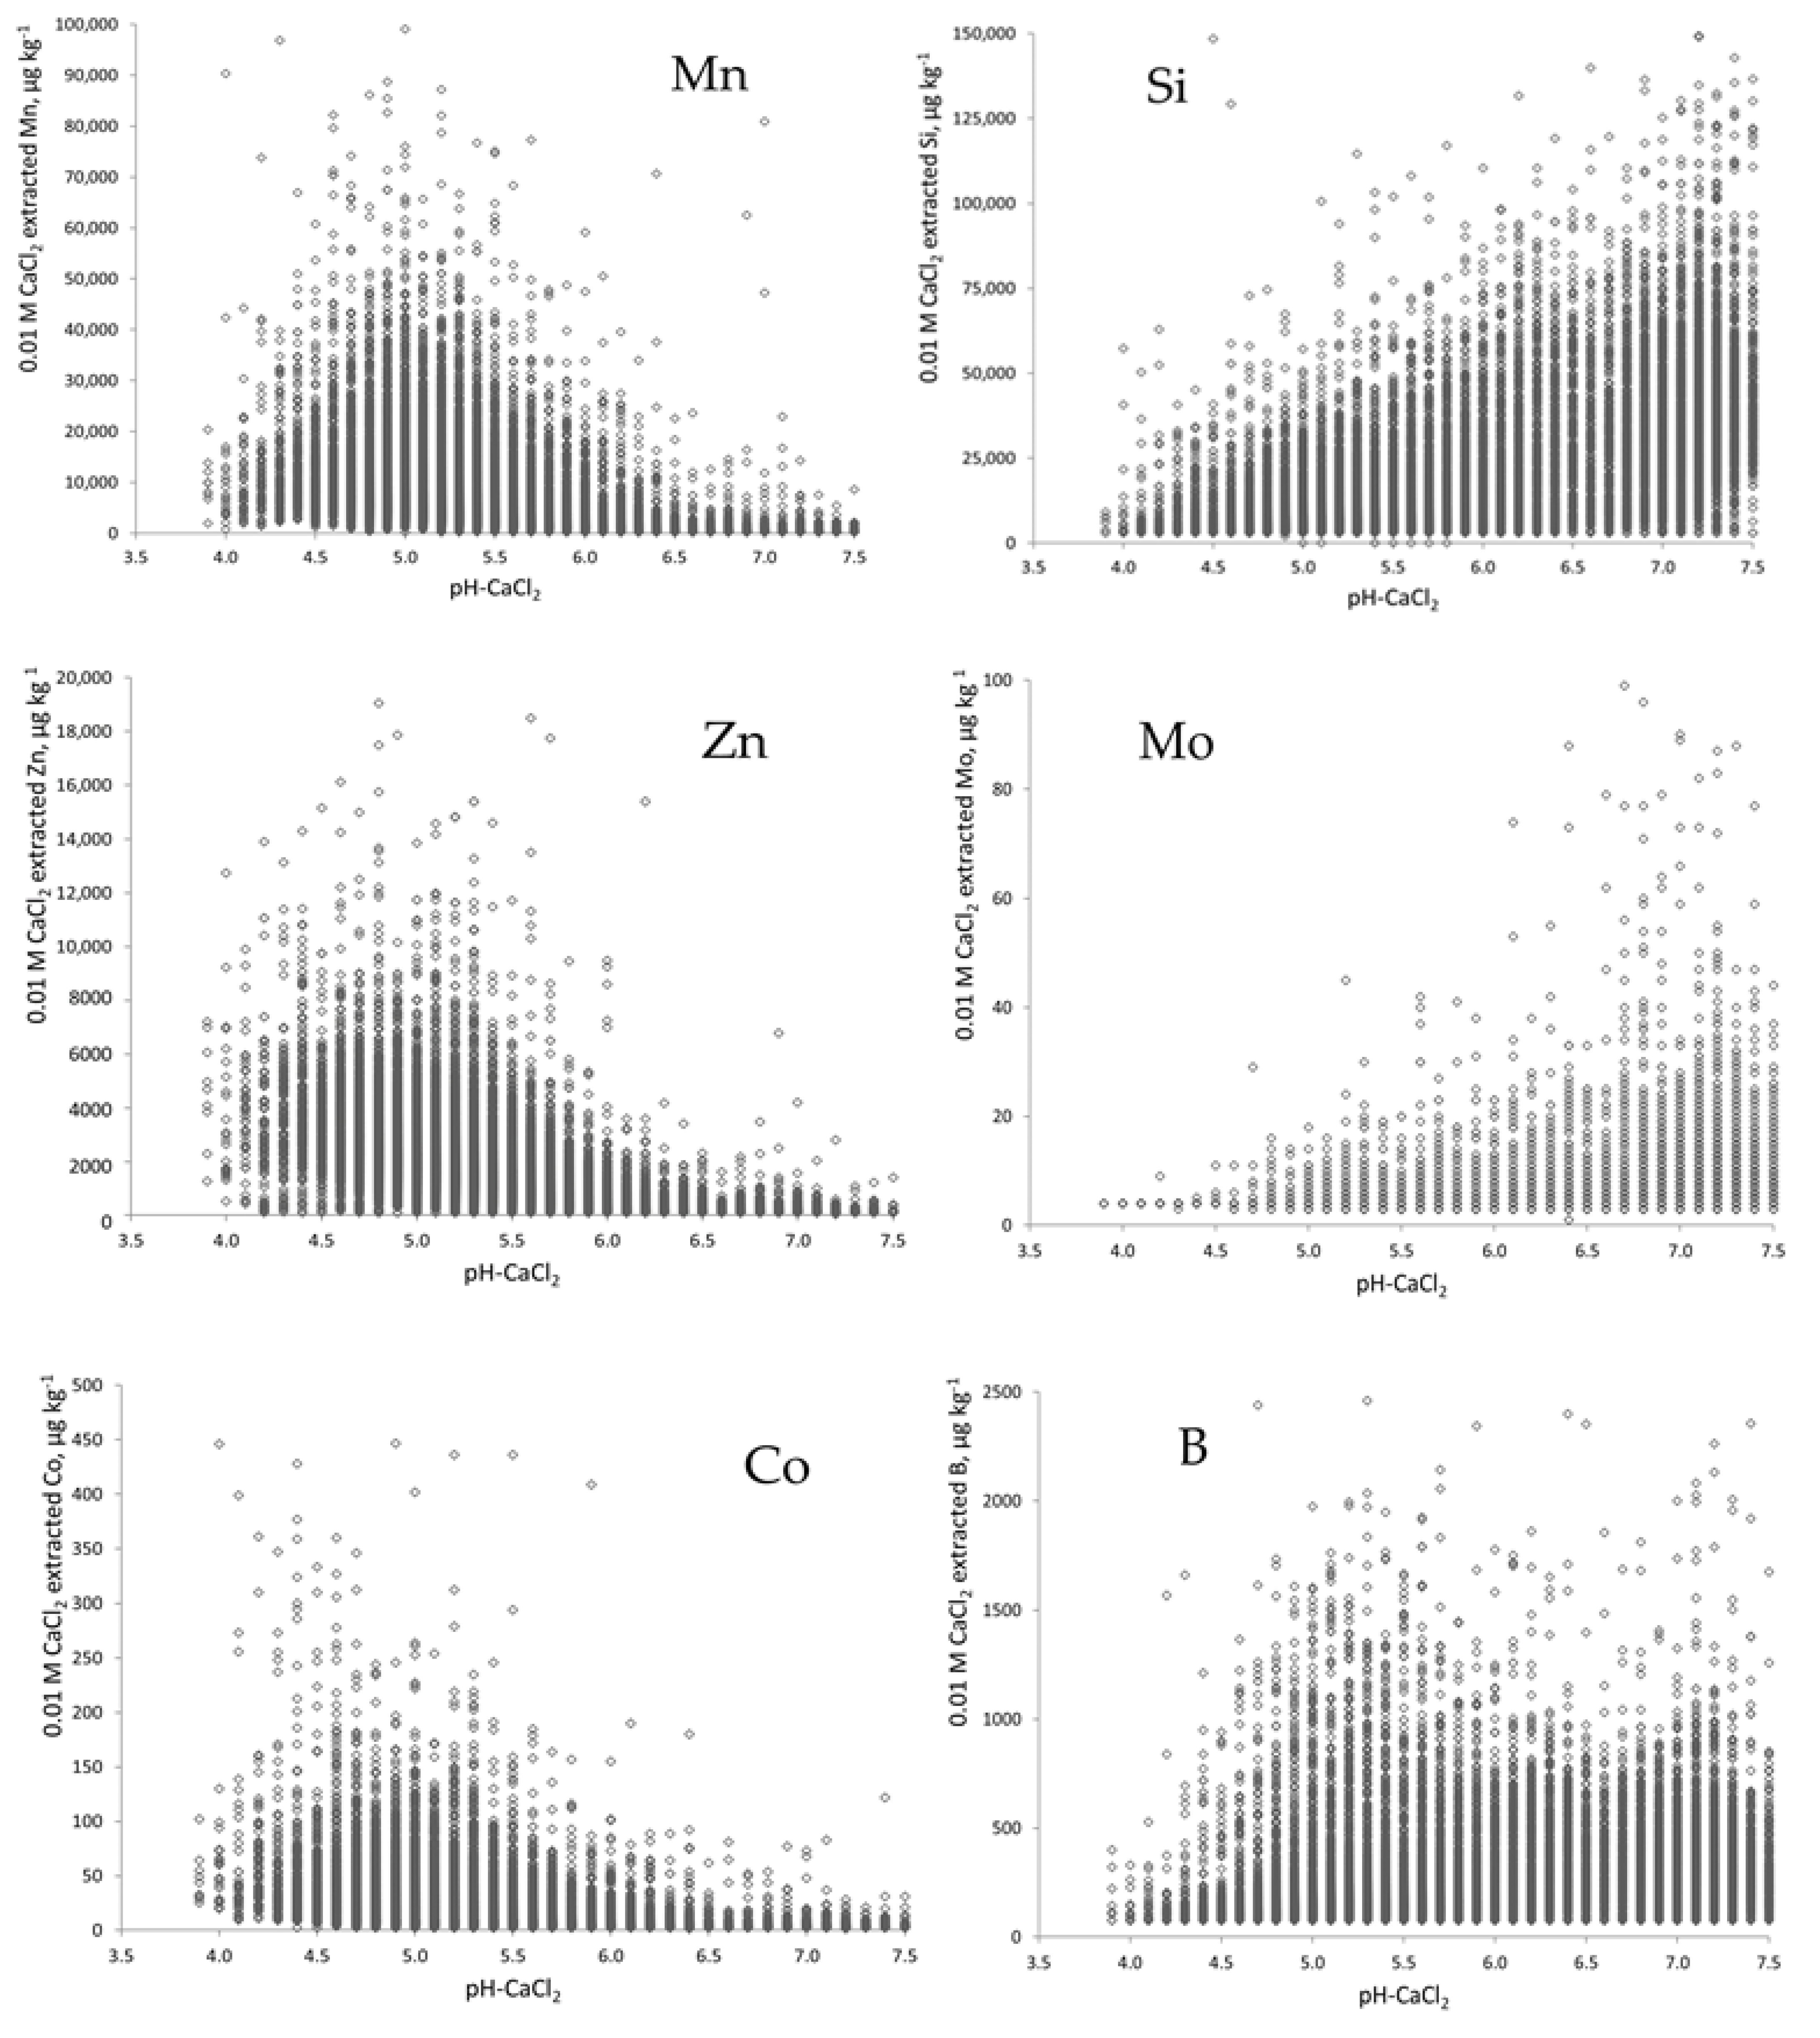
3.1.1. Multi-Nutrient Extractions with 0.01 M CaCl2

All essential and beneficial nutrients for plants (N, S, P, K, Mg, Na, Si, Mn, Fe, Cu, Zn, B, Mo) were assessed through multi-nutrient extractions (apart from Ca, Cl, and Ni). In addition, two elements that are essential for animals and humans were included (Se, Co). Summary statistics of the results of the 0.01 M CaCl2 extractions and ICP-AES, ICP-MS, and discrete analyses are presented in Table 1. The median values of the nutrient intensity decreased in the order: Mg > K > Na >N (NO3-N + NH4-N) > S > Si > Mn > Fe > P > Zn > B > Cu > Co > Mo > Se.
The intensity of some elements (especially Zn, Mn, and Co) was generally low in high-pH soils and highly variable in low-pH soils (Figure 1). As a consequence, 7, 12, and 15% of Mn, Zn, and Co concentration determinations, respectively, were below the detection limit (Table 1). Conversely, Si, and Mo were often low at low pHs and showed a wide range as the pH increased.

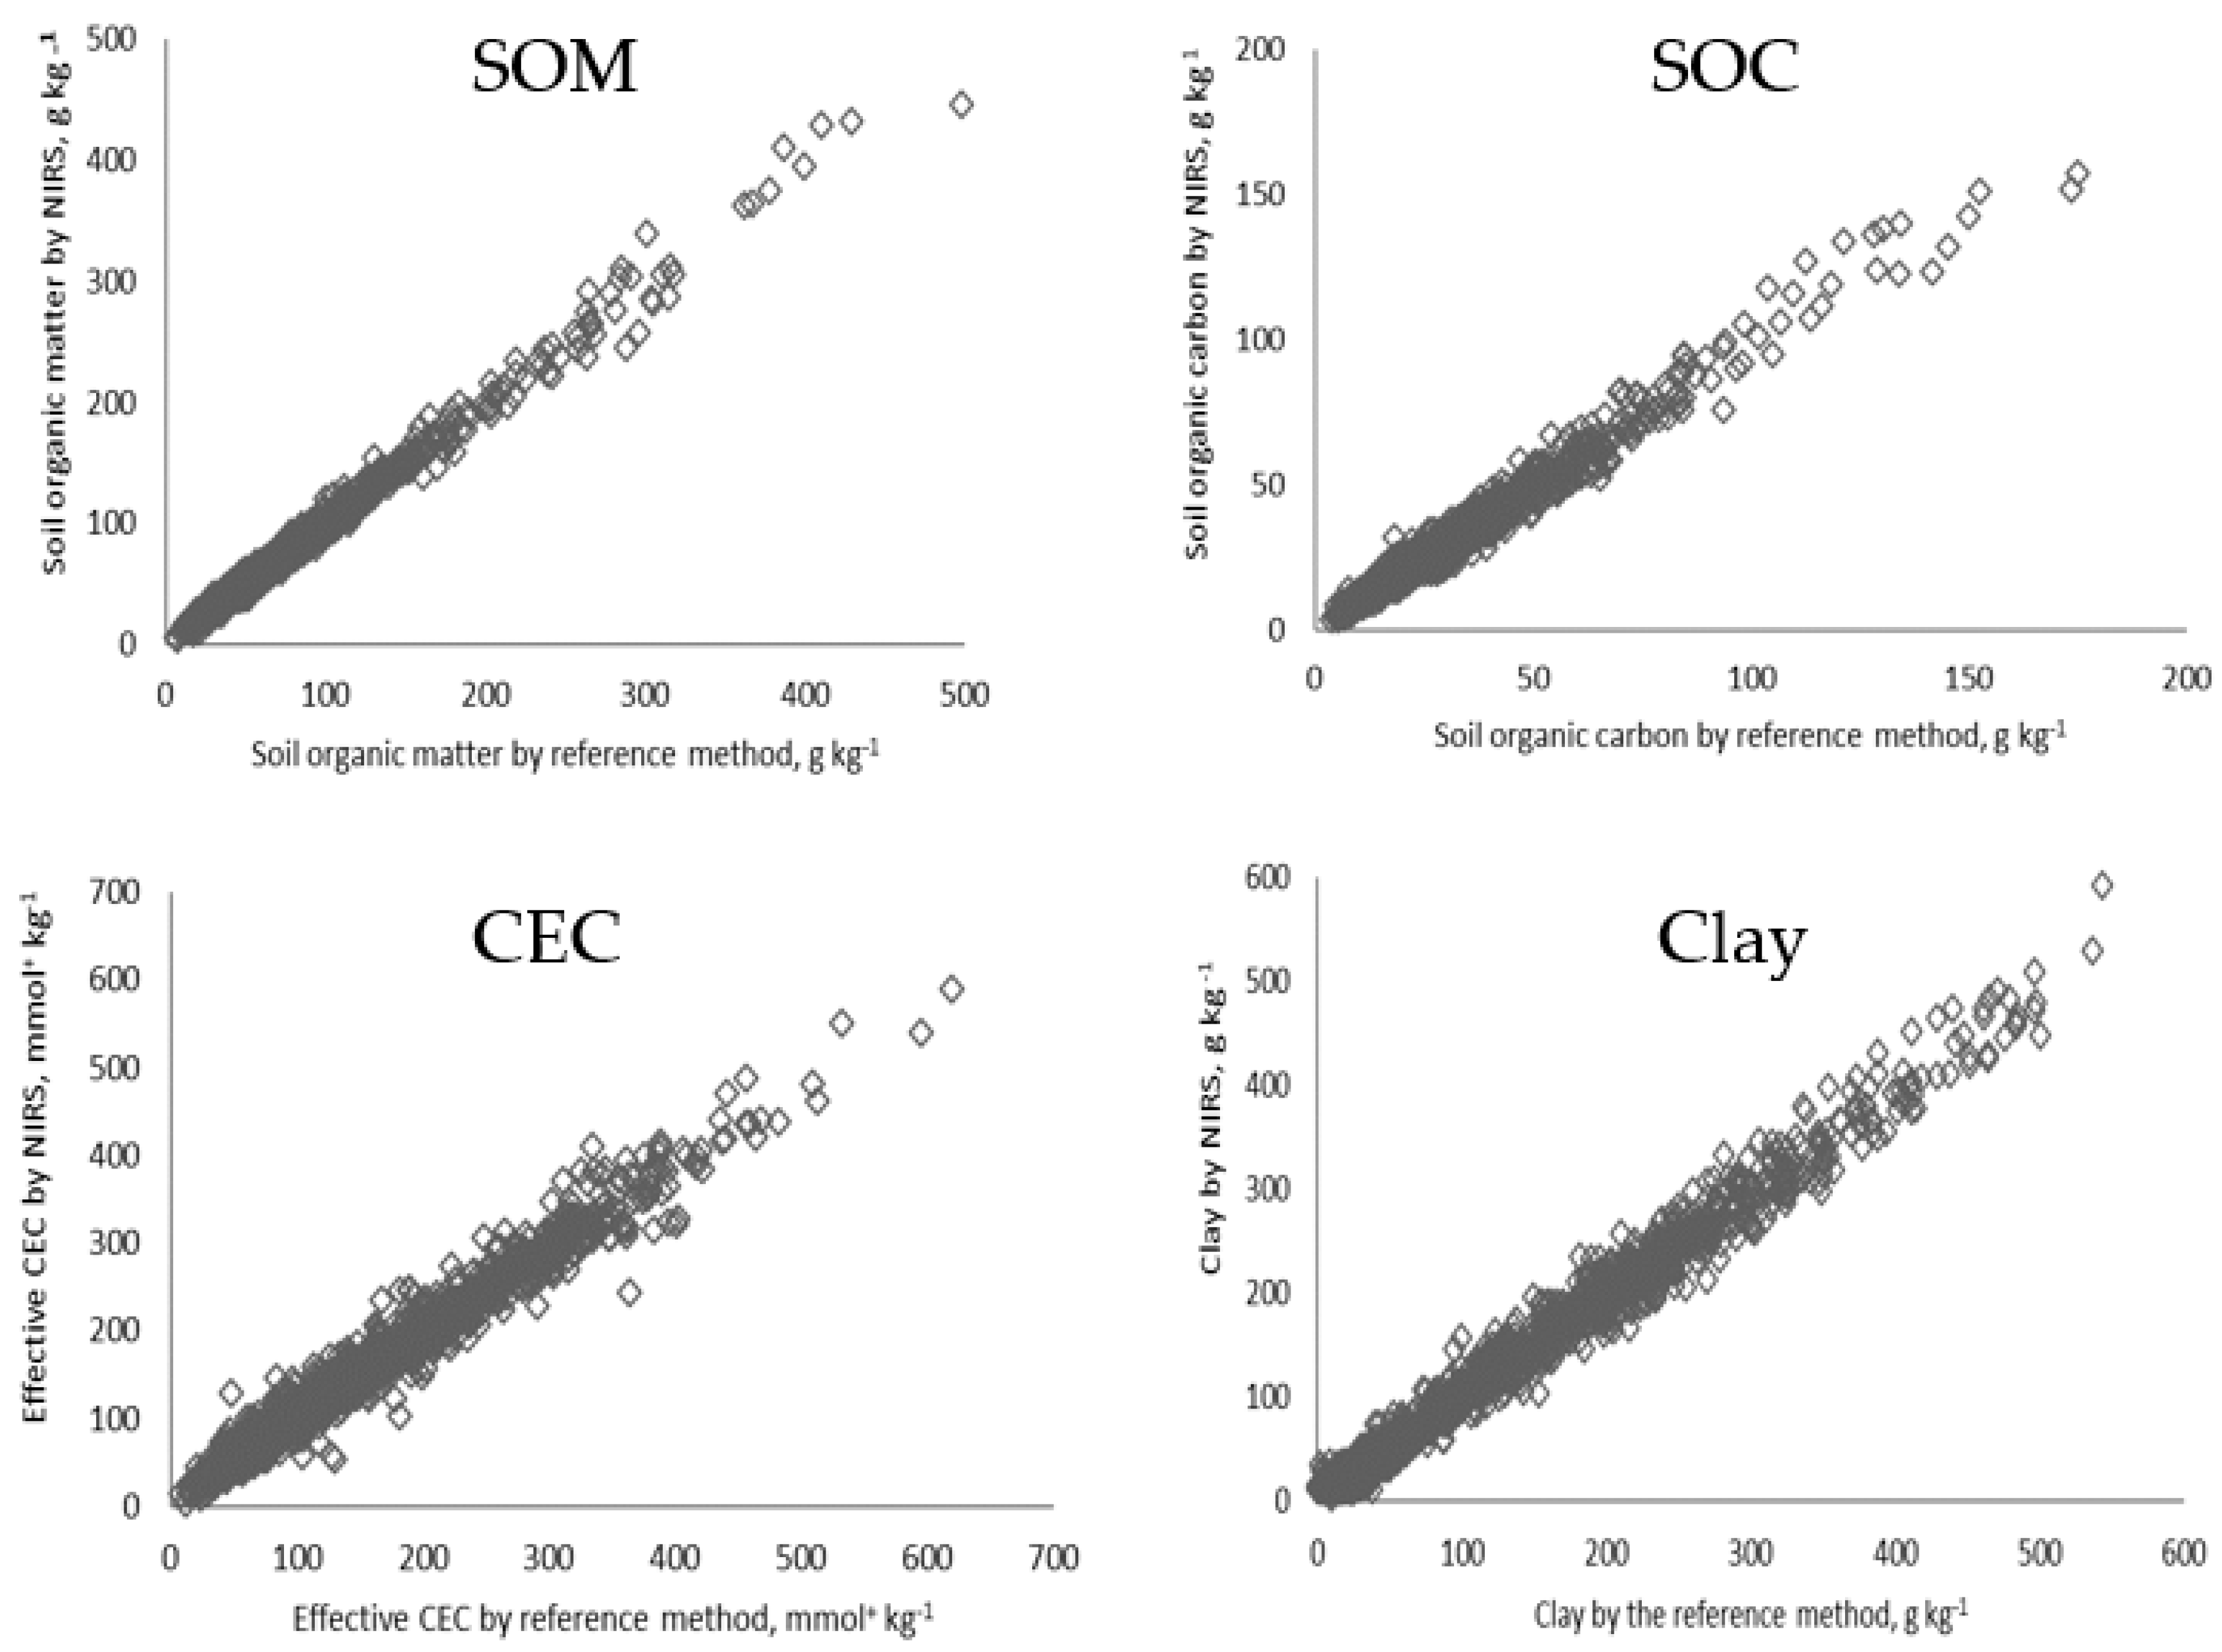
3.1.2. Soil Fertility Characterization through NIRS

The calibration of NIRS spectra to the results of reference methods is presented in Table 2 and Table S1. The RPD of the analytical calibration decreased in the order SOM > SOC > N-total > clay > effective CEC > inorganic C > S-total > Ca-CEC > pH-CaCl2 > sand > Mg-CEC > K-CEC. The analytical validation data set showed a roughly comparable order (Table 4, Figure 2 and Figure S1). Both the analytical calibration and the validation data sets contain samples from different soil types, ranging from dune sands (very light textured, CaCO3 rich and poor, and high pH) to marine clay soils (organic matter and CaCO3 rich) and reclaimed peat soil (light textured and high in organic matter).
In the validation data set (Table 4), the RMSE values of duplicate analyses of the reference method are lower than the RMSE of the reference versus NIRS, except for SOC (3.11–2.98). However, no soil characteristic measured by the reference methods significantly (p < 0.05) differed from the results of the NIRS analyses (see ANOVA, Table 4).

3.2. Step 2: Relating the New Test Data to Those of Conventional Soil Tests

The results of the two broad-spectrum soil testing techniques were related to those of the reference methods in various projects during the last 15 years (first-step agronomic calibration; Table 3). Often, simple linear regression could be used—i.e., only one of the broad-spectrum soil tests was related to the results of reference methods. For example, Na-HCl (reference method) could be explained by Na-CaCl2 (broad-spectrum soil test), using simple linear regression. However, the relationships often improved when the NIRS spectra were added. For example, the linear relation between Mg-NaCl and Mg-CaCl2 had a correlation coefficient R2 of 0.88 and an R2 of 0.97 in a multiple linear regression model—i.e., Mg-NaCl related to Mg-CaCl2 and Mg-CEC [59]. Similarly, Mn-CaCl2 and pH-CaCl2 were related to Mn-.reducible (R2 0.95), while Cu-CaCl2 was combined with SOM and clay content related to Cu-HNO3 (R2 of 0.87) [52]. Thus, a combination of results of the 0.01 M CaCl2 extractions and NIRS proved successful in relating the new test results to the reference methods.

3.3. Step 3: Improved Agronomical Calibration and Validation, and Communication

3.3.1. Agronomic Calibration and Validation of the Soil Tests

For grassland, changing from the common single soil test P-Al [71] to a combination of P-CaCl2 (soil P-intensity) and the ratio P-Al over P-CaCl2 (as a proxy for P-buffering capacity) resulted in an increase in the explained variance in the P content of grass. At the same time, the recommended P application decreased on average by 15 kg P2O5 ha−1 while the same average herbage yield was realized; thus, a more accurate P fertilization recommendation for grassland was achieved [18,54,72,73]. For silage maize, similar improvements in the precision of P fertilization recommendation were achieved; field trials showed that the soil nutrient intensity, buffering capacity, and quantity concept led to improved P fertilization recommendations [74].
The new P fertilization recommendations for grassland, maize land, and arable and vegetable crops were approved by the different fertilization committees in 2011, 2012 [54], and 2020, respectively (www.handboekbodemenbemesting.nl (accessed on 28 November 2021)).
Additionally, for other nutrients a greater precision of fertilization recommendations was achieved through the broad-spectrum soil tests. For example, refined K-fertilization recommendations based on the new soil tests were introduced in 2014 [75], and liming recommendations based upon pH-KCl were changed to pH-CaCl2 (www.handboekbodemenbemesting.nl (accessed on 28 November 2021)). The agronomic calibration and validation of the soil tests for micro nutrients are still in process.

3.3.2. Implementation to the Market

The number of soil characteristics offered to the market gradually increased over time through the introduction of the broad-spectrum soil tests. The release of new soil management and fertilization recommendations was accompanied by promotion campaigns (Figure 3) and field schools where the new recommendations were explained and discussed with farmers and their advisors. From 2004 onwards, about 1500 agronomic advisors were invited annually for meetings in which the ‘new’ test results were explained and the added value for farmers in soil and crop management was discussed. On average, 450–500 advisors attended these annual meetings. Farmers were informed by their advisors as well as in numerous study groups and through mail. Their perceptions of soil tests and recommendations were also surveyed [76]. Furthermore, meetings with agronomist of extension services, representatives of the government, and researchers were organized, mostly on a bi-annual basis.

4. Discussion

Soil tests are a helpful guide to farmers and advisors for improving soil fertility and hence crop yield and quality. Soil tests may also indicate when soil fertility becomes excessive and the risk of nutrient losses (e.g., N and P leaching losses) to groundwater and surface waters increases disproportionally [77]. They are also tools that can be used by land managers and policy makers to monitor soil carbon sequestration and soil health and assess soil threats, including soil acidification, soil compaction, soil degradation, soil salinization, and soil biodiversity decline [78]. At least 5 out of the 17 United Nations Sustainable Development Goals (SDGs) have a direct relation with soil fertility and soil health, while some others have a more indirect relation [79]. This reiterates the importance of soil for food security as well as for sustainable food production systems [80].
Soil fertility encompasses many possible soil characteristics, which often require different soil tests and thereby make full soil fertility assessments laborious and expensive. As a result, routine soil tests commonly include only a few key soil characteristics [9,10], which limits the guidance for soil management and closing yield gaps. Until 2003, most farmers and their advisors in The Netherlands received information about the soil characteristics of P, K, SOM, and pH, including recommendations on P and K fertilization and liming. In 2020, soil tests at farmers’ requests consisted of testing on average >20 physical, chemical, and biological characteristics, and associated soil management and fertilization recommendations. Farmers can still opt for small elementary packages (N, P, K, pH), but 60% of grassland-based dairy farmers and 85% of arable farmers and vegetable growers choose to have a more complete overview of the soil fertility characteristics of their field. Most farmers (>90%) choose additional fertilization recommendations. A significant number of farmers (about 20%) also ask for a micro-nutrient analysis package, which includes nine micro and beneficial nutrients. The results of the soil analyses are presented in tabulated form and through info graphics (for example, soil texture triangle).
The broad-spectrum soil test together with the new concept of the interpretation of the results has improved the guidance given to farmers through more precise and integrated recommendations for soil fertility management and fertilization. There are multiple benefits of this: (i) Farmers receive more data and information about their soil fertility characteristics and improved fertilization and soil management recommendations for a relatively low price. (ii) Laboratories have lowered the costs of their laboratory analyses; have added value to the results of their soil analyses through the soil nutrient intensity, buffering capacity, and quantity concepts; and given improved insights into chemical, physical, and biological soil characteristics. They can thereby gain improved customer satisfaction ([54] and www.handboekbodemenbemesting.nl (accessed on 28 November 2021)). (iii) The environmental footprint of soil analyses can be greatly reduced.

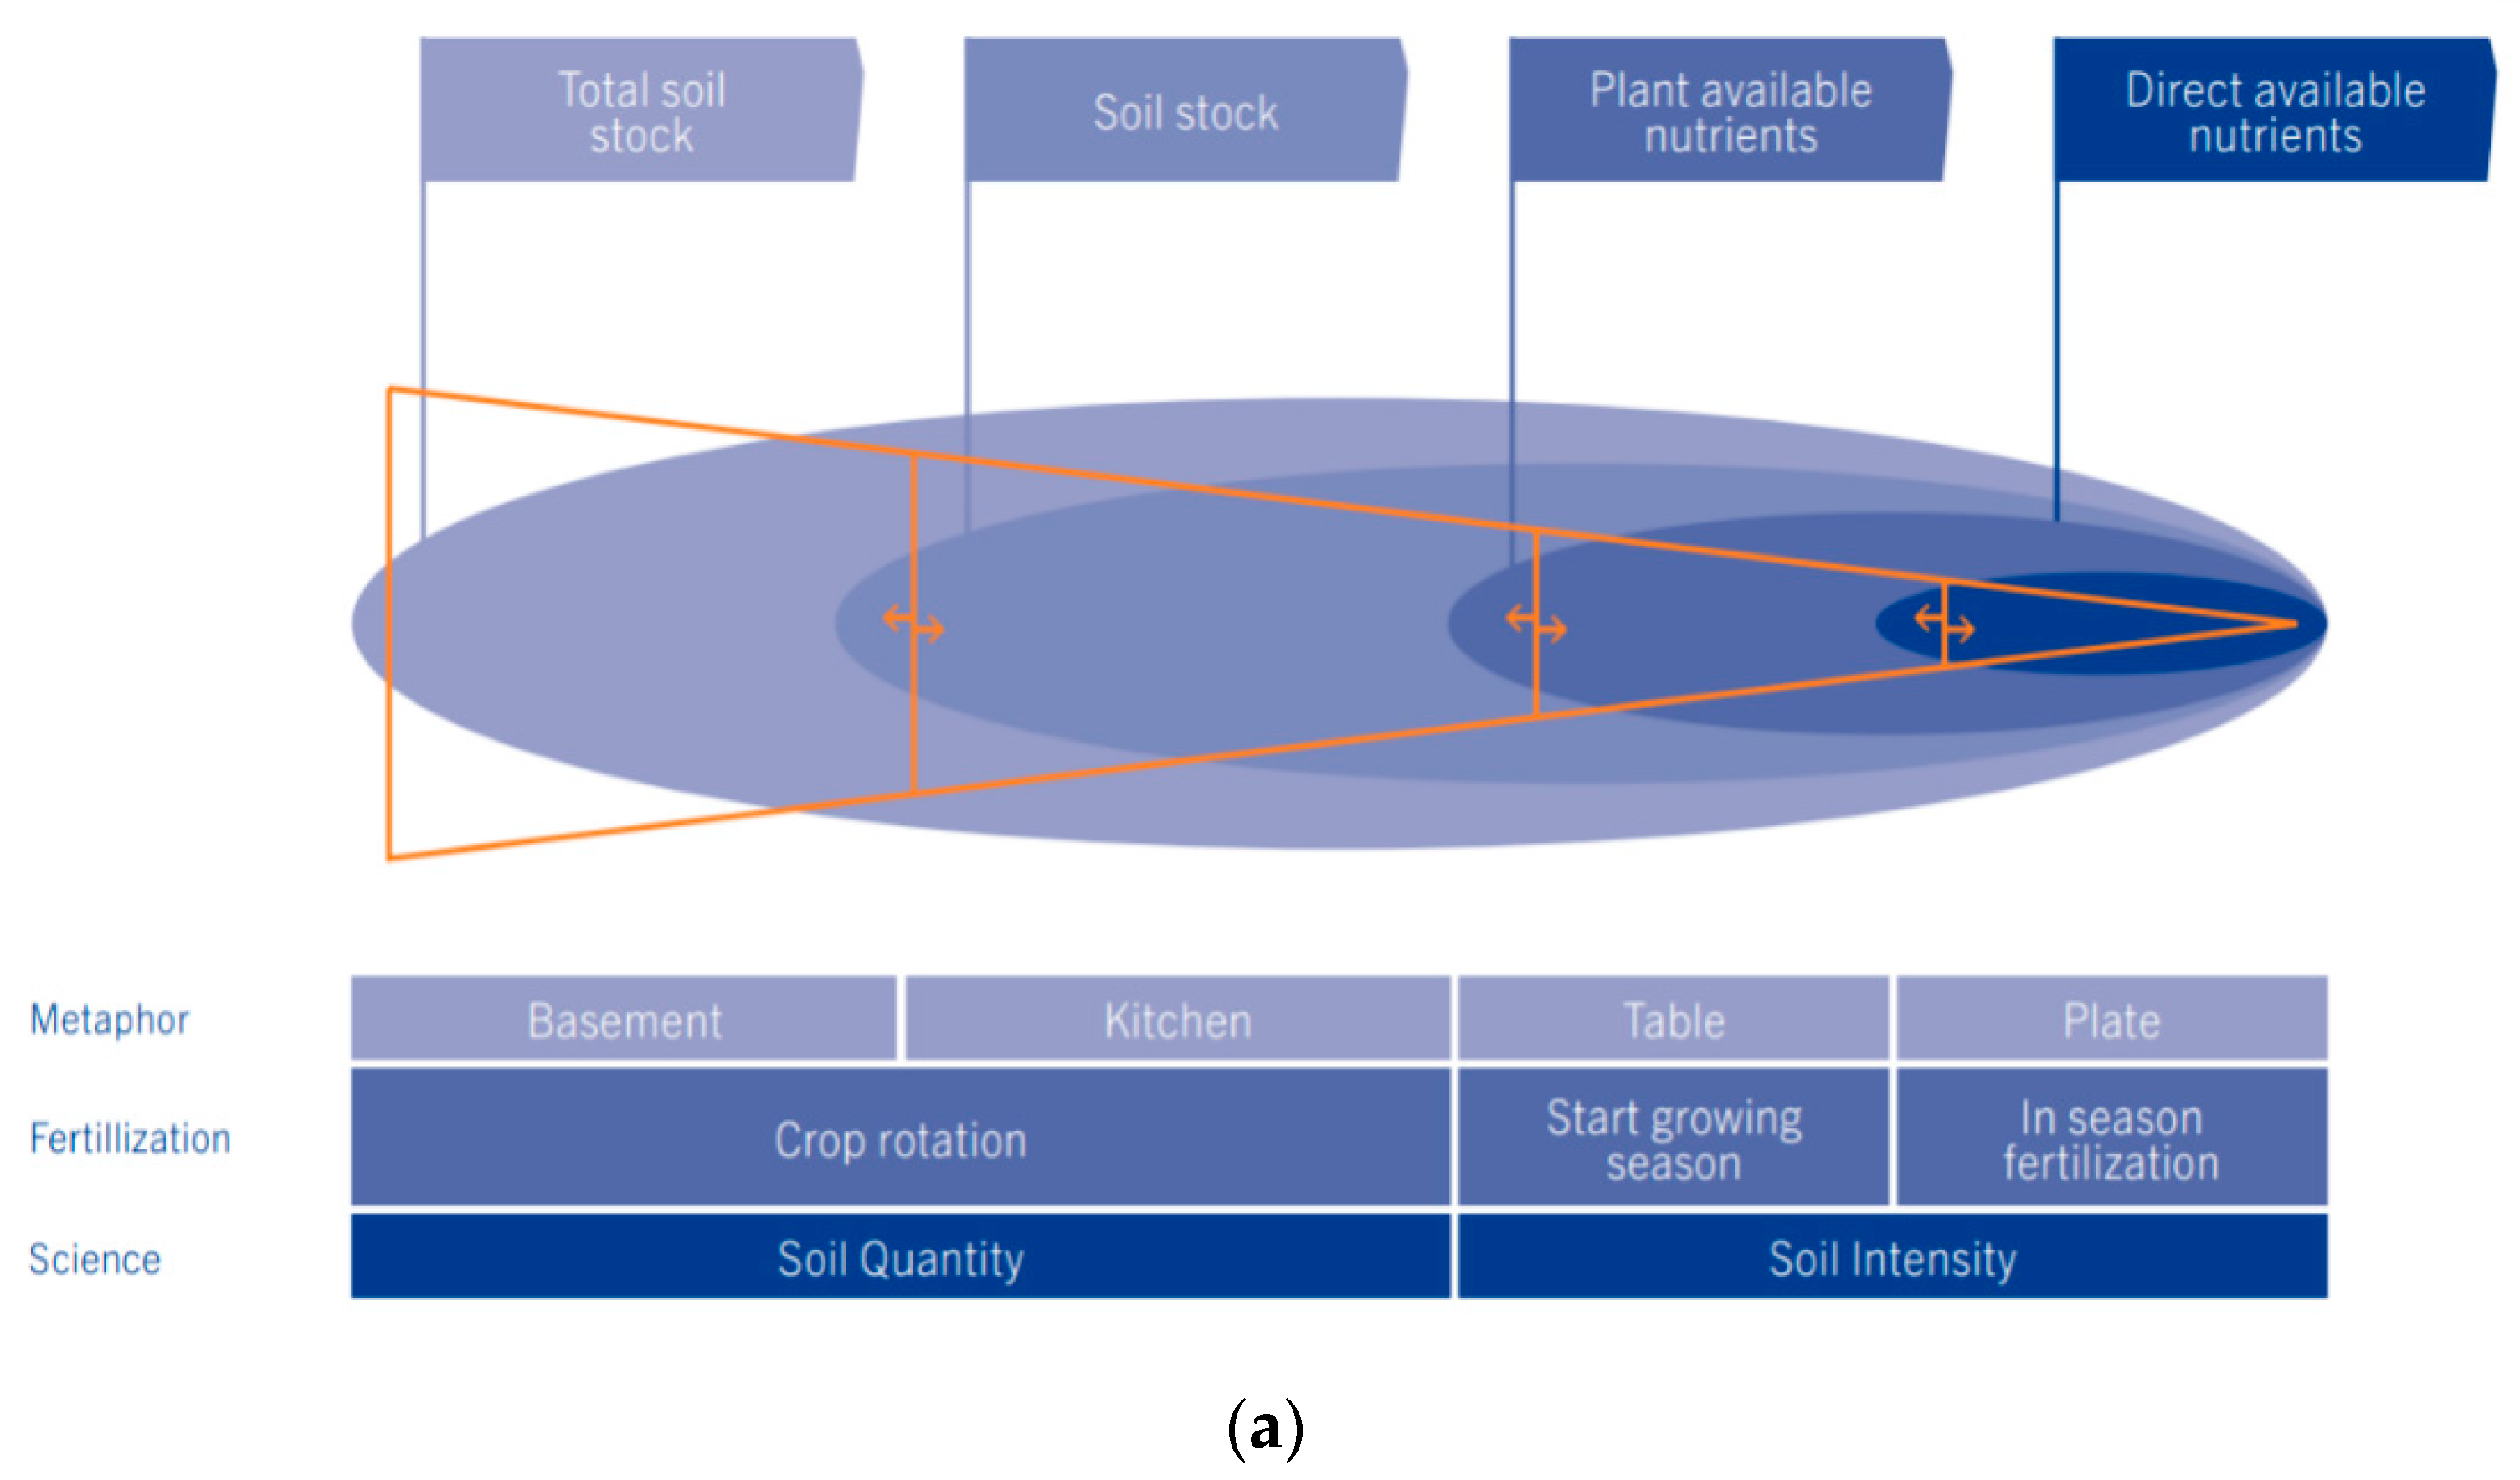
4.1. The Development of the Soil Nutrient Intensity, Buffering Capacity and Quantity Concept

Most fertilization recommendations in the world are based on a single soil test, and many countries and regions have developed their own single soil tests. As a result, there are a myriad of different soil test procedures for the main nutrients (www.fao.org/global-soil-partnership/glosolan/en/ (accessed on 28 November 2021)).
Multi-nutrient 0.01 M CaCl2 extractions for soil fertility testing were proposed a long time ago [23,38]. In 1990, the European Commission started the research project Copernicus to develop fertilization recommendations based on 0.01 M CaCl2 extractions across the European Union (EU). The hypothesis was that the results of CaCl2 extractions were related to the results of conventional methods, and that the results of conventional soil-based fertilization recommendations could be “transformed” into CaCl2-based fertilization recommendations. Although reasonable linear correlation coefficients were found between the results of an array of conventional methods commonly used in EU countries and the results of CaCl2 extractions, it was evident that a significant part of the scatter in the relationships was caused by other soil characteristics [26,64]. The meaning of the results of CaCl2 extractions turned out to be soil type-specific, making the use of uniform CaCl2 extractions less attractive. As a result, CaCl2 extractions were not introduced as a common uniform EU soil test, also because the measurement of the other soil characteristics (needed to increase the deterministic value of the results of CaCl2 extractions) turned out to be too labor-intensive and expensive. The latter changed with the introduction and improved calibration of NIRS for soil analyses and has been critically important for the development of the soil nutrient intensity, buffering, and quantity concepts.
The fact that two or more soil tests may provide more insight into the temporal dynamics of the availability of soil nutrients to plants and the crop response to fertilization has been suggested before by many researchers [15,50,81,82].Additionally, the relationships between soil nutrient intensity, buffering capacity, and quantity have been the subject of several studies [16,17,18,83]. The introduction of the soil nutrient intensity, buffering, and quantity concepts in practice became a reality with the introduction of two different broad-spectrum soil testing techniques; soil nutrient intensity is measured by 0.01 M CaCl2, soil quantity is assessed by NIRS, and the ratio of quantity over intensity is used to assess buffering capacity. For example, the ratio of P-quantity over P-intensity is used for P-buffering [70]. The ratio of nutrient quantity over nutrient intensity is also used for potassium [84,85,86]. An advantage of the use of multiple soil testing techniques for one nutrient is the possibility of distinguishing between soil-based fertilization strategies (i.e., soil fertility, investments for the longer term) and crop-based fertilization strategies (plant nutrition, investments for a single crop season).
Evidently, multi-nutrient CaCl2 extractions (followed by ICP-AES, ICP-MS, and/or DA analyses) and NIRS analyses are two complementary rapid broad-spectrum soil testing techniques, the results of which can be linked mechanistically through the soil nutrient intensity, buffering, and quantity concepts. These concepts were introduced in The Netherlands around 2010 [72,73].

4.2. Analytical Performance of the Broad-Spectrum Soil Tests

The ‘intensity’ of almost all essential main and micro nutrient elements in soil for crop production (apart from Ca, Cl, and Ni) can be assessed through multi-nutrient 0.01 M CaCl2 extractions and subsequent nutrient element determinations via ICP-AES, ICP-MS, and/or DA. NIRS can be used to measure soil physical and chemical (soil quantity) characteristics with R2 values > 0.90 and RPD values ranging from 2.0 up to > 10 (Table 2 and Table 4, Figure 2). The results of the new broad-spectrum soil testing techniques can be related to the results of conventional soil tests through regression analyses, with reasonably good overall performance (R2 > 0.80). Thus, knowledge based on ‘old’ conventional soil tests and fertilization trials can be utilized in these two ‘new’ broad-spectrum soil tests (Table 3). Using NIRS for soil analyses was a relatively new concept in 2004, when it was implemented stepwise in The Netherlands. First, SOM, SOC, N-total [87], and soil texture were introduced, followed by CEC and other soil characteristics, with a satisfactory to good calibration performance (R2 ≥ 0.90; RPD ≥ 3.0). A high performance of NIRS determinations was also found by many others, including Zornoza et al. (2008) [88], who concluded that NIRS could be used for soil carbon, N-total, CEC (R2 > 0.90 and RPD > 3), Ca-CEC, and Mg-CEC (R2 > 0.80, RPD > 2.5). Genot et al. (2011) [89] also found high correlation coefficients for estimating soil carbon, N-total, clay, and CEC, as did Chang et al. (2001) [68] for soil texture (R2 > 0.80: RPD > 2.3). Successful estimations of soil pH were reported by Moron and Cozzolino (2002) [90] and Terhoeven-Urselmans et al. (2008) (R2> 0.85) [91]. Jaconi et al. (2019) [34] were able to estimate soil particle size distributions.
Thus far, only a few studies have focused on soil potassium (Jin et al., 2020) [67]. He et al. (2007) [92] utilized NIRS to assess K and showed that the coefficient of determination (R2) between conventional methods and NIRS was 0.68. A similar result (R2 0.72) was found by Liu and Liu (2012) [93]. We found a R2 of 0.79 and a RPD of 2.0 (Table 2) for K-CEC, comparable to the results of Jia et al. (2015) (R2 0.76 and RPD 2.1) [94]. Although the intensity, buffering capacity, and quantity concepts will likely also improve the micro nutrient recommendations, no successful calibrations for micro nutrient quantity indicators could be obtained by NIRS (data not shown), only manganese-CEC (Mn-CEC) looks promising (R2 0.69; Supplementary Table S1)
The use of NIRS for estimating the soil P status is complicated, as wavebands relevant to SOM and Fe content are often identified as important components for NIRS estimations of soil P. Thus, soil tests such as P-Mehlich, P-Bray-II, and P-CAL cannot be conducted using (VIS)NIR [91,95,96,97]. However, more positive results have been obtained by others. Zhang and Zhang (2015) [98] utilized NIRS to estimate different P fractions in soil (i.e., Fe-P, Mg-P, Ca-P, and Al-P) and found correlation coefficients (R2) ranging between 0.85 and0.90. Rakotonindrina et al. (2020) [99] was able to estimate P-ox with R2 values ranging between 0.70 and 0.90. Niederberger et al. (2015) [100] divided soil P into labile, moderate labile, and stabile P and found R2 values ranging from 0.08 to 0.85. Terhoeven-Urselmans et al. (2008) [91] and Ludwig et al. (2002) [96] estimated successfully P-Olsen, while Brolsma et al. (2018) [101] were able to estimated P-total, P-Al, and oxalate-P with RPD values of 4.3, 2.6, and 2.1 and R2 values of 0.94, 0.83, and 0.74, respectively. Evidently, significant progress has been made in the calibration of NIRS spectra to soil P tests during the last couple of years. Estimations of several soil P fractions may further improve the agronomic value of the P fertilization recommendations based on conventional soil P tests. Additionally, these estimations may give insight in the environmental risk of P leaching from the topsoil to the subsoil and surface water bodies. Thus, these additional soil P tests may be used in environmental evaluations by water (quality) authorities.

4.3. Stepwise Implementation in Practice

The need for better soil tests and the need for the better underpinning of fertilization recommendations based on soil tests have been discussed frequently in The Netherlands [102,103,104]. Yet, no significant changes in soil testing and fertilization recommendations were implemented in agricultural practice between 1970 and 2004 [55]. From the 1970s onwards, the government steadily withdrew from supporting soil fertility and fertilization research; soil testing was privatized and experiments in the field were largely replaced by simulation modelling [105,106].
The privatization of soil fertility and fertilization research led to the replacement of laborious and expensive traditional laboratory methods by rapid broad-spectrum soil testing and new concepts were developed. Introducing additional soil characteristics and recommendations into agricultural practice requires validation experiments, which are costly and time-consuming. Moreover, convincing extension services and farmers of the benefits of new concepts is challenging as well, since existing recommendations are often considered to be ‘valid’ by advisors and farmers even though the underlying statistical significance of the relationships between soil tests and crop yield responses are often not particularly strong. As a first step, the results of the two broad-spectrum soil testing techniques were converted to the results of conventional soil test methods (Table 3). This approach (relating new soil test data to conventional data) can be used in other countries as well. Sims (1989) [107] stated that the use of such empirical equations represents a suitable interim measure. Next, agronomical validation experiments were set up; these showed that new fertilization recommendations often have greater precision and thus lead to improved fertilization recommendations, especially for P fertilization recommendations. Third, farmers will be able to make more informed decisions in soil and nutrient management, which will result in the better control of food production and food health benefits.

4.4. Outlook

Multi-nutrient CaCl2 extractions (followed by ICP-AES, ICP-MS, or DA) combined with NIRS have laid a practical foundation for the soil nutrient intensity, buffering, and quantity concepts for use in practice; together, these form a powerful approach for improved soil testing as a basis for high-precision soil management and fertilization recommendations. Through advanced calibration and validation procedures, accurate assessments of several soil characteristics can be performed. However, further calibration, validation, and field trials are needed, especially for soil micro-nutrients, biological indices, and soil organic carbon fractions.
Several methods have been proposed for the characterization of the soil microbial community. Phospholipid fatty acid analysis (PLFA) is considered to be a robust method with the ability to determine microbial biomass and different groups of microbial taxa [108]. With PLFA as a reference method, NIRS calibrations are being developed for these biological characteristics. The calibration of biological characteristics (e.g., microbial biomass, total bacteria, Gram-positive bacteria, actinomycetes, and mycorrhizal fungi) has been performed rather successfully already (R2 > 0.80 and RPD > 2.5) [88] even for (plant parasitic) nematodes [109]. This opens the door for the more routine soil testing of these characteristics [110].
NIRS analyses might also help us to obtain more information on soil organic matter fractions [111]. Fractions are important in the early detection of changes in organic matter content and quality and for monitoring the effects of C-sequestration management practices [112]. Currently, SOM, SOC, SIC, and total carbon can be assessed by NIRS rather accurately. Pyrolysis GC-MS and the anaerobic mineralization of organic matter may be able to identify the signatures and significance of, for example, protein, carbohydrates, and humic fractions [113]. The first results of the NIRS calibration of several pyrolysis fractions look very promising (data not shown).
There has been common effort worldwide to increase nutrient use efficiency, crop yields, crop quality, and soil carbon sequestration while at the same time protecting the environment. Zhang et al. (2013) [114] emphasized the important role of soil tests and knowledge transfer in improving agricultural practices in China. Sutton et al. (2013) [115] argued the same for India and Sub-Saharan Africa. With the two broad-spectra soil tests (CaCl2 extractions and NIRS), small soil laboratories can be installed in many countries without great costs, though significant support may be needed for setting up the testing, calibration, and validation procedures. These broad-spectrum soil tests can offer a wide range of soil characteristics to local farmers for improving soil and nutrient management and closing yield gaps.
NIRS analyses may also contribute to optimizing quality control and assurance in the total agro-food system [116]. The composition of animal manure [117,118], compost [119], fertilizers [120], crops [121], and forages [122], as well as product quality, including milk [123] and potato starch [124], can be estimated with the same NIRS-based laboratory unit. These data will enable farmers, extension services, researchers, and policy makers to monitor and further improve the agro-food environmental system.

5. Conclusions

Following a period of stagnation in soil fertility research as a result of the withdrawal of governmental support and the initial hesitation of the private sector to take over the routine soil testing of farmers’ fields in The Netherlands, two broad-spectrum soil testing techniques together with the soil nutrient ‘intensity, buffering, and capacity’ concept have been introduced in practice stepwise from 2004 onwards. The use of the multi-nutrient 0.01 M CaCl2 extractant has become routine laboratory practice for the determination of readily available nutrient elements (nutrient intensity), while NIRS has been applied successfully to determine other soil fertility characteristics, including the nutrient quantity characteristics. Combining the results of the multi-nutrient 0.01 M CaCl2 extractant procedure (intensity characteristics) and the NIRS determinations (quantity characteristics) gave high correlation coefficients compared with the ‘old’ conventional soil testing methods and, in the end, demonstrated the greater precision of the new soil management and fertilization recommendations.
Various validation field trials have been conducted, indicating the validity of the new concept and recommendations. However, conducting more field trials remains necessary because new crop cultivars and varieties are becoming commonplace, and there are important interactions between crop type x soil type x weather conditions in crop responses to changes in the soil nutrient status and fertilization practices.
Intensive communication through fields schools, training sessions, brochures, and the Internet has facilitated the introduction of the new concept and broad-spectrum soil tests in practice. Altogether, this has created a win–win situation: (i) farmers receive more data and information about their soil fertility characteristics and improved fertilization and soil management recommendations for a relatively low price; (ii) laboratories have lowered the costs of their laboratory analyses, added value to the results of their soil analyses, and thereby improved customer satisfaction; and (iii) the environmental footprint of soil analyses has been greatly reduced.

Supplementary Materials

The following supporting information can be downloaded at: https://www.mdpi.com/article/10.3390/agronomy12010191/s1, S1: NIRS Reference methods; S2: NIRS Calibration procedures; S3: NIRS Validation procedures; S4: Quality control of soil testing; S5: Scientific underpinning of the CaCl2 method; Figure S1: Scatter plots of the results of NIRS determinations versus the results derived from conventional analyses procedures (right-hand figures) and scatter plots of the residual variance of these relationships (left-hand figures), for N-total, S-total, Ca-CEC, SOM, SOC, C-inorganic, Clay, CEC, pH, Sand, K-CEC, Mg-CEC: validation data set; Table S1: Statistics of the calibration of NIRS to the results of the conventional methods. A distinction has been made between soil characteristics that have been implemented into laboratory practice for routine soil testing, and soil characteristics that are still in the phase of further testing (and thus have not yet been implemented into laboratory practice for routine soil testing): calibration data set.

Author Contributions

Conceptualization and writing first draft by J.A.R. and O.O.; data collection and data analysis by M.J.v.O., K.M.B., J.A.R. and D.F. Review and editing were done by all authors. All authors have read and agreed to the published version of the manuscript.

Funding

The study did not receive additional funding.

Institutional Review Board Statement

Not applicable.

Informed Consent Statement

Not applicable.

Data Availability Statement

All tabulated data is available in the Supplemental Information (Word document with Figure and Table).

Acknowledgments

We acknowledge the support of the BLGG and Eurofins organizations during the development and testing of the broad-spectrum soil tests. Special thanks to the sample taking, laboratory and product management teams. Martin Vervoorn was instrumental at the start, Joris van Benthum and Dennis Wetjens supported the calibration and validation. Wim Bussink, Debby van Rotterdam, and Gerard Ros contributed to the development of the ‘proof the concept’. The feedback from advisors and farmers also has been helpful.

Conflicts of Interest

The authors declare no conflict of interest.

References

  1. Shang, Q.; Ling, N.; Feng, X.; Yang, X.; Wu, P.; Zou, J.; Shen, Q.; Guo, S. Soil fertility and its significance to crop productivity and sustainability in typical agroecosystem: A summary of long-term fertilizer experiments in China. Plant Soil 2014, 381, 13–23. [Google Scholar] [CrossRef]
  2. van Ittersum, M.K.; Rabbinge, R. Concepts in production ecology for analysis and quantification of agricultural input-output combinations. Field Crops Res. 1997, 52, 197–208. [Google Scholar] [CrossRef]
  3. FAO. Towards the Future We Want: End Hunger and Make the Transition to Sustainable Agricultural and Food Systems. Report on Rio + 20. FAO of the UN. 2012. Available online: http://www.fao.org/3/an894e/an894e00.pdf (accessed on 28 November 2021).
  4. Patzel, N.; Sticher, H.; Karlen, D.L. Soil fertility—phenomenon and concept. J. Plant. Nutr. Soil Sci. 2000, 163, 129–142. [Google Scholar] [CrossRef]
  5. Jenny, H. Great soil groups in the equatorial regions of Colombia, South America. Soil Sci. 1948, 66, 5. [Google Scholar] [CrossRef]
  6. Abbott, L.K.; Murphy, D.V. (Eds.) Soil Biological Fertility—A Key to Sustainable Land Use in Agriculture; Springer: Dordrecht, The Netherlands, 2007; pp. 1–15. [Google Scholar]
  7. Osman, K.T. Physical Properties of Soil. Soils. In Soils; Springer: Dordrecht, The Netherlands, 2013. [Google Scholar] [CrossRef]
  8. Schmidt, M.W.I.; Rumpel, C.; Kögel-Knabner, I. Evaluation of an ultrasonic dispersion procedure to isolate primary organomineral complexes from soils. Eur. J. Soil Sci. 2020, 50, 87–94. [Google Scholar] [CrossRef]
  9. Briggs, S.; Eclair-Heath, G. Helping UK farmers to choose, use, and interpret soil test results to inform soil management decisions for soil health. Asp. Appl. Biol Crop. Prod. South. Br. 2017, 134, 161–168. [Google Scholar]
  10. Golicz, K.; Hallett, S.H.; Sakrabani, R.; Pan, G. The potential for using smartphones as portable soil nutrient analyzers on suburban farms in central East China. Sci. Rep. 2019, 9, 1–10. [Google Scholar] [CrossRef]
  11. Russell, E.J. Soil Conditions and Plant Growth, 10th ed.; Longman: London, UK, 1973. [Google Scholar]
  12. Domingo, W.R. The Development of Soil Fertility Research; Joh, N.V., Ed.; Ykema’s Uitgevers-Maatschappij, ‘s: Gravenhage, The Netherlands, 1955. (In Dutch) [Google Scholar]
  13. Daubeny, C.G.B. Memoirs on the rotation of crops and on the quantity of inorganic matters abstracted from the soil by various plants under different circumstances. Roy. Soc. Phil. Trans. Lond. 1845, 135, 79–253. [Google Scholar]
  14. Dyer, B. On the analytical determination of probable available mineral plant food in soils. J. Chem. Soc. Trans. 1894, 65, 115–167. [Google Scholar] [CrossRef] [Green Version]
  15. Kuipers, S.F. Principles of fertilization. In Nederlandse Land- en Tuinbouwbibliotheek; Wolters: Groningen, The Netherlands, 1951. (In Dutch) [Google Scholar]
  16. Dalal, R.C.; Hallsworth, E.G. Evaluation of the parameters of soil phosphorus availability factors in predicting yield response and phosphorus uptake. Soil Sci. Soc. Am. J. 1976, 40, 541–546. [Google Scholar] [CrossRef]
  17. Moody, P.W.; Aitken, R.L.; Compton, B.L.; Hunt, S. Soil phosphorus parameters affecting phosphorus availability to, and fertilizer requirements of, maize (Zea mays). Aust. J. Soil Res. 1988, 26, 611–622. [Google Scholar] [CrossRef]
  18. Van Rotterdam-Los, A.M.D. The Potential of Soils to Supply Phosphorus and Potassium, Processes and Predictions. Ph.D. Thesis, Wageningen University, Wageningen, The Netherlands, 2010. [Google Scholar]
  19. Woods, M.S.; Ketterings, Q.M.; Rossi, F.S. Effectiveness of standard soil tests for assessing potassium availability in sand rootzones. Soil Sci. 2005, 170, 110–119. [Google Scholar] [CrossRef] [Green Version]
  20. Fontana, M.; Bélanger, G.; Hirte, J.; Ziadi, N.; Elfouki, S.; Bragazza, L.; Liebisch, F.; Sinaj, S. Critical plant phosphorus for winter wheat assessed from long-term field experiments. Eur. J. Agron. 2021, 126, 126–263. [Google Scholar] [CrossRef]
  21. Chatzistathis, T.; Papaioannou, B.; Gasparatos, D.; Molassiotis, A. From which soil metal fractions Fe, Mn, Zn and Cu are taken up by olive trees (Olea europaea L., cv. ‘Chondrolia Chalkidikis’) in organic groves? J. Environ. Manag. 2017, 203, 489–499. [Google Scholar] [CrossRef] [PubMed]
  22. Reijneveld, J.A.; Termorshuizen, A.; Vedder, H.; Oenema, O. Strategey for innovation in soil tests illustrated for P tests. Commun. Soil Sci. Plant Anal. 2014, 45, 498–515. [Google Scholar] [CrossRef]
  23. Schofield, R.K.; Taylor, A.W. The measurement of soil pH. Soil Sci. Soc. Am. J. 1955, 19, 164–167. [Google Scholar] [CrossRef]
  24. Houba, V.J.G.; Novozamsky, I.; Lexmond, T.M.; Van der Lee, J.J. Applicability of 0.01 M CaCl2 as a single extraction solution for the assessment of the nutrient status of soils and other diagnostic purposes. Commun. Soil Sci. Plant Anal. 1990, 21, 2281–2290. [Google Scholar] [CrossRef]
  25. Houba, V.J.G.; Novozamsky, I.; Van der Lee, J.J. Status and future of soil and plant analysis. Commun. Soil Sci. Plant Anal. 1994, 25, 753–765. [Google Scholar] [CrossRef]
  26. Van Erp, P.J. The Potentials of Multi-Nutrient Soil Extraction with 0.01 M CaCl2 in Nutrient Management. Ph.D. Thesis, Wageningen University, Wageningen, The Netherlands, 2002. [Google Scholar]
  27. NEN 15923-1. Water Quality—Determination of Selected Parameters by Discrete Analysis Systems—Part 1: Ammonium, Nitrate, Nitrite, Chloride, Orthophosphate, Sulfate and Silicate with Photometric Detection. 2003. Available online: https://www.nen.nl/ (accessed on 28 November 2021).
  28. NEN 6966. Environment—Analyses of Selected Elements in Water, Eluates and Destruates—Atomic Emission Spectrometry with Inductively Coupled Plasma. 2005. Available online: https://www.nen.nl/ (accessed on 28 November 2021). (In Dutch).
  29. NEN 17294-2. Water Quality—Application of Inductively Coupled Plasma Mass Spectrometry (ICP-MS)—Part 2: DeterMination of Selected Elements Including Uranium Isotopes. 2016. Available online: https://www.nen.nl/ (accessed on 20 December 2021).
  30. ISO-10390. Soil Quality—Determination of pH. 2005. Available online: https://www.iso.org/standard/40879.html (accessed on 28 November 2021).
  31. Malley, D.F.; Williams, P. Analysis of sediments and suspended material in lake ecosystems using near-infrared spectroscopy: A review. Aquat. Ecosyst. Health Manag. 2014, 17, 447–453. [Google Scholar] [CrossRef]
  32. Shepherd, K.D.; Walsh, M.G. Infrared spectroscopy—enabling an evidence-based diagnostic surveillance approach to agricultural and environmental management in developing countries. J. Near Infrared Spectrosc. 2007, 15, 1–19. [Google Scholar] [CrossRef]
  33. Rossel, R.V.; Webster, R. Predicting soil properties from the Australian soil visible–near infrared spectroscopic database. Eur. J. Soil Sci. 2012, 63, 848–860. [Google Scholar] [CrossRef]
  34. Jaconi, A.; Vos, C.; Don, A. Near Infrared Spectroscopy as an easy an precise method to estimate soil texture. Geoderma 2019, 337, 906–913. [Google Scholar] [CrossRef]
  35. Nduwamungu, C.; Ziadi, N.; Parent, L.É.; Tremblay, G.F.; Thuriès, L. Opportunities for, and limitations of, near infrared reflectance spectroscopy applications in soil analysis: A review. Can. J. Soil Sci. 2009, 89, 531–541. [Google Scholar] [CrossRef]
  36. Cécillon, L.; Barthès, B.G.; Gomez, C.; Ertlen, D.; Génot, V.; Hedde, M.; Stevens, A.; Brun, J.J. Assessment and monitoring of soil quality using near-infrared reflectance spectroscopy (NIRS). Eur. J. Soil Sci. 2009, 60, 770–784. [Google Scholar] [CrossRef] [Green Version]
  37. FAO. Steering Committee on Soil Spectroscopy. Available online: https://www.fao.org/soils-portal/events/detail/en/c/1268465/ (accessed on 28 November 2021).
  38. Savitzky, A.; Golay, M.J.E. Smoothing and Differentiation of Data by Simplified Least-Squares Procedures. Anal. Chem. 1964, 36, 1627–1639. [Google Scholar] [CrossRef]
  39. Liu, G.; Guo, H.; Pan, T.; Wang, J.; Cao, G. Vis-NIR Spectroscopic Pattern Recognition Combined with SG Smoothing Applied to Breed Screening of Transgenic Sugarcane. Guang Pu Xue Yu Guang Pu Fen Xi 2014, 34, 2701–2706. [Google Scholar]
  40. Kawamura, K.; Tsujimoto, Y.; Nishigaki, T.; Andriamananjara, A.; Rabenarivo, M.; Asai, H.; Rakotoson, T.; Razafimbelo, T. Laboratory Visible and Near-Infrared Spectroscopy with Genetic Algorithm-Based Partial Least Squares Regression for Assessing the Soil Phosphorus Content of Upland and Lowland Rice Fields in Madagascar. Remote Sens. 2019, 11, 506. [Google Scholar] [CrossRef] [Green Version]
  41. Ramirez-Lopez, L.; Behrens, T.; Schmidt, K.; Stevens, A.; Demattê, J.A.M.; Scholten, T. The spectrum-based learner: A new local approach for modeling soil vis–NIR spectra of complex datasets. Geoderma 2013, 195, 268–279. [Google Scholar] [CrossRef]
  42. Liu, M.; Huang, C.; Wang, L.; Zhang, Y.; Luo, X. Short-term soil moisture forecasting via Gaussian process regression with sample selection. Water 2020, 12, 3085. [Google Scholar] [CrossRef]
  43. ISO-13878. Soil Quality—Determination of Total Nitrogen Content by Dry Combustion (“Elemental Analysis”). 1998. Available online: https://www.iso.org/standard/23117.html (accessed on 28 November 2021).
  44. NEN 15587-2. Water Quality—Digestion for the Determination of Selected Elements in Water—Part 2: Nitric Acid Digestion. 2002. Available online: https://www.nen.nl/ (accessed on 28 November 2021).
  45. ISO-23470. Soil Quality—Determination of Effective Cation Exchange Capacity (CEC) and Exchangeable Cations Using a Hexaminecobalt(III)chloride Solution. 2018. Available online: https://www.iso.org/standard/68765.html (accessed on 28 November 2021).
  46. ISO-10694. Soil Quality—Determination of Organic and Total Carbon after Dry Combustion (Elementary Analysis). 1995. Available online: https://www.iso.org/standard/18782.html (accessed on 28 November 2021).
  47. NEN 5754. Soil—Calculation of Organic Matter Content on A Mass Basis as Loss-on-Ignition. 2014. Available online: https://www.nen.nl/ (accessed on 28 November 2021). (In Dutch).
  48. NEN-EN 15936. Sludge, Treated Biowaste, Soil and Waste—Determination of Total Organic Carbon (TOC) by Dry Combustion. 2012. Available online: https://www.nen.nl/ (accessed on 28 November 2021).
  49. NEN-EN 5753. Soil—Determination of Clay Content and Particle Size Distribution in Soil and Sediment by Sieve and Pipet. 2018. Available online: https://www.nen.nl/ (accessed on 28 November 2021).
  50. Van der Paauw, F.; Sissingh, H.A.; Ris, J. Een verbeterde fosfaatextractie van de grond met water: Het Pw-getal. Versl. Landbouwkd. Onderz. 1971, 749. Available online: https://edepot.wur.nl/218204 (accessed on 28 November 2021). (In Dutch).
  51. Houba, V.J.G.; Novozamsky, I.; Huybregts, A.W.M.; Van Der Lee, J.J. Comparison of soil extractions by 0.01 M CaCI2, by EUF and by some conventional extraction procedures. Plant Soil 1986, 96, 433–437. [Google Scholar] [CrossRef]
  52. De Haas, M.J.G.; Bussink, D.W.; Moolenaar, S.W. A New Route for Fertilization Research: Results of 2 Years of CaCl2 Research. NMI Rep. 936.03. 2005. Available online: https://www.nmi-agro.nl/ (accessed on 28 November 2021). (In Dutch).
  53. De Vries, O.; Hetterschij, C.W.G. Investigations into the methodology for potassium determinations in soil. Versl. Van Landbouwkd. Onderz. 1945, 50, 4. Available online: https://edepot.wur.nl/218017 (accessed on 28 November 2021). (In Dutch).
  54. Anonymous. Fertilization Recommendation for Grassland, and Forage Crops. Commissie Bemesting Grasland en Voedergewassen. 2012. Available online: www.bemestingsadvies.nl (accessed on 28 November 2021). (In Dutch).
  55. Anonymous. Fertilization Recommendation for Arable Crops, and Vegetable Crops. Praktijkonderzoek Voor de Akkerbouw en Vollegrondsgroenteteelt. Praktijkonderzoek voor de Akkerbouw en de Vollegrondsgroenteteelt. 1999. Available online: https://www.wur.nl/nl/Publicatie-details.htm?publicationId=publication-way-343537383933 (accessed on 28 November 2021). (In Dutch).
  56. Baier, J.; Baierova, V. Hundredth molar calcium chloride extraction procedure. Part IV: Calibration with conventional soil testing methods for potassium. Commun. Soil Sci. Plant Anal. 1998, 29, 11–14. [Google Scholar] [CrossRef]
  57. Ferrari, T.; Sluijsmans, C. Mottling and magnesium deficiency in oats and their dependence of various factors. Plant Soil 1955, 6, 262–299. [Google Scholar] [CrossRef]
  58. Loch, J.; Jaszberenyi, I.; Vago, I. One hundredth molar calcium chloride soil extraction procedure. Part III: Calibration with conventional soil testing methods for Magnesium. Commun. Soil Sci. Plant Anal. 1998, 29, 1633–1640. [Google Scholar] [CrossRef]
  59. Van Erp, P.V.; Houba, V.J.G.; Reijneveld, J.A.; Van Beusichem, M.L. Relationship between magnesium extracted by 0.01 M calcium chloride extraction procedure and conventional procedures. Commun. Soil Sci. Plant Anal. 2001, 32, 1–18. [Google Scholar] [CrossRef]
  60. Henkens, C.H.H. Copper measurements on arable land; the value of chemical soil test compared to the Aspergillus niger-method. Versl. Landbouwkd. Onderz. 1961, 67. ISSN 0372-6223. (In Dutch) [Google Scholar]
  61. Henkens, C.H.H. Cobalt on grassland. Versl. Landbouwkd. Onderz. 1959, 16, 642–651. (In Dutch) [Google Scholar]
  62. Berger, K.C.; Truog, E. Boron determination in soils and plants. J. Ind. Eng. Chem. 1939, 11–10, 540–545. [Google Scholar] [CrossRef]
  63. Novozamsky, I.; Barrera, L.L.; Houba, V.J.G.; Van der Lee, J.J.; Van Eck, R. Comparison of a hot water and cold 0.01 M CaCl2 extraction procedures for the determination of boron in soil. Commun. Soil Sci. Plant Anal. 1990, 21, 2189–2195. [Google Scholar] [CrossRef]
  64. Fotyma, M.; Jadczyszyn, T.; Jozefaciuk, G. Hundredth molar calcium chloride extraction procedure. Part II: Calibration with conventional soil testing methods for pH. Commun. Soil Sci. Plant Anal. 1998, 29, 1625–1632. [Google Scholar] [CrossRef]
  65. Minasny, B.; McBratney, A. Why you don’t need to use RPD. Pedometron 2013, 33, 14–15. [Google Scholar]
  66. Esbensen, K.H.; Geladi, P.; Larsen, A. The RPD myth. NIR News 2014, 25, 24–28. [Google Scholar] [CrossRef]
  67. Jin, X.; Li, S.; Zhang, W.; Zhu, J.; Sun, J. Prediction of soil-available potassium content with visible near-infrared ray spectroscopy of different pretreatment transformations by the boosting algorithms. Appl. Sci. 2020, 10, 1520. [Google Scholar] [CrossRef] [Green Version]
  68. Chang, C.-W.; Laird, D.A.; Mausbach, M.J.; Hurburgh, C.R., Jr. Near-infrared reflectance spectroscopy—Principal components regression analyses of soil properties. Soil Sci. Soc. Am. J. 2001, 3, 480–490. [Google Scholar] [CrossRef] [Green Version]
  69. Van Rotterdam, A.M.D.; Temminghoff, E.J.M.; Schenkeveld, W.D.L.; Hiemstra, T.; van Riemsdijk, W.H. Phosphorus removal from soil using Fe oxide-impregnated paper: Processes and applications. Geoderma 2009, 151, 282–289. [Google Scholar] [CrossRef]
  70. Van Rotterdam, A.M.D.; Bussink, D.W.; Temminghoff, E.J.M.; van Riemsdijk, W.H. Predicting the potential of soils to supply phosphorus by integrating soil chemical processes and standard soil tests. Geoderma 2012, 189, 617–626. [Google Scholar] [CrossRef]
  71. Egnér, H.; Riehm, H.; Domingo, W.R. Soil tests as basis of establishing soil nutrient status II Chemical extraction methods for phosphor and potassium (Untersuchungen über die chemische Bodenanalyse als Grundlage für die Beurteilung des Nährstoffzustandes der Böden. II. Chemische Extraktionsmethoden zur Phospor—Und Kaliumbestimmung). Kungliga. Landbr. Ann. 1960, 26, 199–215. (in German). [Google Scholar]
  72. Van Rotterdam-Los, A.M.D.; Reijneveld, J.A.; van Oostrum, M.; Abbink, G.; Bussink, W. A more trustworthy P recommendation by implementing the intensity, buffering capacity, quantity concept into agricultural practice. In NUTRIHORT: Nutrient Management, Innovative Techniques and Nutrient Legislation in Intensive Horticulture for an Improved Water Quality: Proceedings; Institute for Agricultural and Fisheries Research (ILVO): Merelbeke, Belgium, 2013; pp. 136–141. Available online: https://biblio.ugent.be/publication/8520976 (accessed on 28 November 2021).
  73. Van Rotterdam, A.M.D.; Bussink, D.W.; Reijneveld, J.A. Improved Phosphorus Fertilisation Based on Better Prediction of Availability in Soil. In Proceedings of the International Fertliser Society, London, UK, 3 July 2014; Volume 755. [Google Scholar]
  74. Bussink, D.W.; Reijneveld, J.A. A concept for the P-recommendation for silage maize. VDLUFA 2010, 122, 100–101. (In German) [Google Scholar]
  75. Bussink, D.W.; Van Schooten, H.; Van Middelkoop, J.; Holshof, G.; Doppenberg, G. Towards a new K fertilizer recommendation for silage maize in the Netherlands. VDLUFA 2018, 130, 37–38. (In German) [Google Scholar]
  76. Reijneveld, J.A.; van Bohemen, F.J.M.; Termorshuizen, A.J.; Oenema, O. Farmers’ perceptions of soil tests: A case study in the Netherlands. Acta Sci. Agric. 2019, 3.8, 96–103. [Google Scholar] [CrossRef]
  77. Schoumans, O.F.; Chardon, W.J. Risk assessment methodologies for predicting phosphorus losses. J. Plant Nutr. Soil Sci. 2003, 166, 403–408. [Google Scholar] [CrossRef]
  78. Amundson, R.; Berhe, A.A.; Hopmans, J.W.; Olsen, C.; Sztein, A.E.; Sparks, D.L. Soil and human security in the 21st century. Science 2015, 348, 6235. [Google Scholar] [CrossRef] [Green Version]
  79. Bouma, J.; Montnarella, L.; Evanylo, G. The challenge for the soil science community to contribute to the implementation of the UN sustainable development goals. Soil Use Manag. 2019, 35, 538–546. [Google Scholar] [CrossRef]
  80. Gil, J.D.B.; Reidsma, P.; Giller, K.; Todman, L.; Whitmore, A.; van Ittersum, M. Sustainable development goal 2: Improved targets and indicators for agriculture and food security. Ambio 2018, 48, 685–698. [Google Scholar] [CrossRef] [Green Version]
  81. Ehlert, P.A.I.; Morel, C.; Fotyma, M.; Destain, J.-P. Potential role of phosphate buffering capacity of soils in fertilizer management strategies fitted to environmental goals. J. Plant. Nutr. Soil Sci. 2003, 166, 409–415. [Google Scholar] [CrossRef]
  82. Quintero, C.E.; Boschetti, N.G.; Benavidez, R.A. Effects of soil buffer capacity on soil test phosphorus interpretation and fertilizer requirement. Commun. Soil Sci. Plant Anal. 2003, 34, 1435–1450. [Google Scholar] [CrossRef]
  83. Lalitha, M.; Dhakshinamoorthy, M. Quantity-intensity characteristics of Potassium (K) in relation to potassium availability under different cropping system in alluvial soils. Afr. J. Agric. Res. 2015, 10, 2097–2103. [Google Scholar] [CrossRef]
  84. Singh, B.; Sharma, K.N.; Rana, D.S. The quantity-intensity relations of potassium in soils from plots having nine fixed crop rotations for six years. Plant Soil 1978, 50, 363–370. [Google Scholar] [CrossRef]
  85. Cervantes, C.E.; Hanson, R.G. A potential method to incorporate quantity/intensity into routine soil test interpretations. Commun. Soil Sci. Plant Anal. 1991, 22, 683–700. [Google Scholar] [CrossRef]
  86. Saleque, M.A.; Anisuzzaman, M.; Moslehuddin, A.Z.M. Quantity-intensity relationships and potassium buffering capacity of four Ganges river floodplain soils. Commun. Soil Sci. Plant Anal. 2009, 40, 1333–1349. [Google Scholar] [CrossRef]
  87. ISO-17184. Soil Quality—Determination of Carbon and Nitrogen by Near-Infrared Spectrometry (NIRS). 2014. Available online: https://www.iso.org/standard/59262.html (accessed on 28 November 2021).
  88. Zornoza, R.; Guerrero, C.; Mataix-Solera, K.M.; Scow, V.; Arcenequi, J. Mataix Beneyto. Soil Biol. Biochem. 2008, 40, 1923–1930. [Google Scholar] [CrossRef] [Green Version]
  89. Genot, V.; Colinet, G.; Bock, L.; Vanvyve, D.; Reusen, Y.; Dardenne, P. Near infrared reflectance spectroscopy for estimating soil characteristics valuable in diagnosis of soil fertility. J. Near Infrared Spectrosc. 2011, 19, 117–138. [Google Scholar] [CrossRef]
  90. Moron, A.; Cozzolino, D. Application of near infrared reflectance spectroscopy for the analysis of organic C, total N and pH in soils of Uruguay. J. Near Infrared Spectrosc. 2002, 10, 215–221. [Google Scholar] [CrossRef]
  91. Terhoeven-Urselmans, T.; Schmidt, H.; Joergensen, R.G.; Ludwig, B. Usefulness of near-infrared spectroscopy to determine biological and chemical soil properties: Importance of sample pre-treatment. Soil Biol. Biochem. 2008, 40, 1178–1188. [Google Scholar] [CrossRef]
  92. He, Y.; Huang, M.; García, A.; Hernandez, A.; Song, H. Prediction of soil macronutrients content using near-infrared spectroscopy. Comput. Electron. Agric. 2007, 58, 144–153. [Google Scholar] [CrossRef]
  93. Liu, X.-M.; Liu, J.-S. Based on the LS-SVM modeling method determination of soil available N and available K by using near-infrared spectroscopy. Spectrosc. Spectr. Anal. 2012, 32, 3019–3023. [Google Scholar]
  94. Jia, S.; Yang, X.; Li, G.; Zhang, J. Quantitatively Determination of Available Phosphorus and Available Potassium in Soil by Near Infrared Spectroscopy Combining with Recursive Partial Least Squares. Spectrosc. Spectr. Anal. 2015, 35, 2516–2520. [Google Scholar]
  95. Confalonieri, M.; Fornasier, F.; Ursino, A.; Boccardi, F.; Pintus, B.; Odoardi, M. The potential of near infrared reflectance spectroscopy as a tool for the chemical characterization of agricultural soils. J. Near Infrared Spectrosc. 2001, 9, 123–131. [Google Scholar] [CrossRef]
  96. Ludwig, B.; Khanna, P.K.; Bauhus, J.; Hopmans, P. Near Infrared Spectroscopy of forest soils to determine chemical and biological properties related to soil sustainability. For. Ecol. Manag. 2002, 171, 121–132. [Google Scholar] [CrossRef]
  97. Oliveira, J.F.; de Brossard, M.; Corazza, E.J.; Marchao, R.L.; Siqueira Vendrame, P.R.; Brito, O.R.; de Fátima Guimaraes, M. VIR-NIR spectrometry, soil phosphate extraction methods and interactions of soil attributes. Quim Nova 2015, 38, 342–350. [Google Scholar]
  98. Zhang, L.; Zhang, R. Fast detection of inorganic phosphorus fractions and their phosphorus content in soil based on near-infrared spectroscopy. Chem. Eng. Trans. 2015, 46, 1405–1410. [Google Scholar]
  99. Rakotonindrina, H.; Kawamura, K.; Tsujimoto, Y.; Nishigaki, T.; Razakamanarivo, H.; Andrianary, B.H.; Andriamananjara, A. Prediction of soil oxalate phosphorus using visible and near-infrared spectroscopy in natural and cultivated system soils of madagascar. Agriculture 2020, 10, 177. [Google Scholar] [CrossRef]
  100. Niederberger, J.; Todt, B.; Boča, A.; Nitschke, R.; Kohler, M.; Kühn, P.; Bauhus, J. Use of near-infrared spectroscopy to assess phosphorus fractions of different plant availabilty in forest soils. Biogeosciences 2015, 12, 3415–3428. [Google Scholar] [CrossRef] [Green Version]
  101. Brolsma, K.M.; van Oostrum, M.J.; Elbers, H.L.; van Vliet, P.C.J. Soil phosphorus with NIRS. Eurofins Agro Rep. 2018, 30. (In Dutch) [Google Scholar]
  102. Van der Paauw, F.; Ris, J. A new K-number for arable crops on sand and reclaimed peat soils. Landbouwvoorlichting 1960, 19, 719–725. (In Dutch) [Google Scholar]
  103. Prummel, J. Autumn and spring fertilization with phosphorus and potassium on arable land. Landbouwkd. Tijdschr. 1962, 74, 252–260. (In Dutch) [Google Scholar]
  104. Boskma, K.; van der Heij, D. Potassium fertilization of potatoes on peaty soil. Versl. Landbouwkd. Onderz. 1964, 644. Available online: https://www.wur.nl/de/Publicatie-details.htm?publicationId=publication-way-353337323938 (accessed on 28 November 2021). (In Dutch).
  105. Harmsen, K. The Institute for Soil Fertility Research 1890–1990. Neth. J. Agric. Sci. 1991, 39, 205–220. [Google Scholar] [CrossRef]
  106. Bouma, J.; Hartemink, A.E. Soil science and society in the Dutch context. NJAS Wagen. J. Life Sci. 2003, 50, 133–140. [Google Scholar] [CrossRef] [Green Version]
  107. Sims, J.T. Comparison of Mehlich 1 and Mehlich 3 extractants for P, K, Ca, Mg, Mn, Cu and Zn in Atlantic coastal plain soils. Commun. Soil Sci. Plant Anal. 1989, 20, 1707–1726. [Google Scholar] [CrossRef]
  108. Frostegård, Ǻ.A.; Tunlid, E.; Bååth, E. Use and misuse of PLFA measurements in soil. Soil Biol. Biochem. 2011, 43, 723–730. [Google Scholar] [CrossRef]
  109. Barthès, B.G.; Brunet, D.; Rabary, B.; Ba, O.; Villenave, C. Near infrared reflectance spectroscopy (NIRS) could be used for characterization of soil nematode community. Soil Biol. Biochem. 2011, 43, 1649–1659. [Google Scholar] [CrossRef]
  110. Comino, F.; Arand, V.; García-Ruizc, R.; Ayora-Cañada, M.J.; Domínguez-Vidala, A. Infrared spectroscopy as a tool for the assessment of soil biological quality in agricultural soils under contrasting management practices. Ecol. Indic. 2018, 87, 117–126. [Google Scholar] [CrossRef]
  111. Zimmermann, M.; Leifeld, J.; Fuhrer, J. Quantifying soil organic carbon fractions by infrared-spectroscopy. Soil Biol. Biochem. 2007, 39, 224–231. [Google Scholar] [CrossRef]
  112. Kusumo, B.H.; Arbestain, M.C.; Mahmud, A.F.; Hedley, M.J.; Hedley, C.B.; Pereira, R.C.; Wang, T.; Singh, B.P. Assessing biochar stability indices using Near Infrared Spectroscopy. J. Near Infrared Spectrosc. 2014, 22, 313–328. [Google Scholar] [CrossRef]
  113. Girona-García, A.; Badía-Villas, D.; Jiménez-Morillo, N.T.; González-Pérez, J.A. Changes in soil organic matter composition after Scots pine afforestation in a native European beech forest revealed by analytical pyrolysis (Py-GC/MS). Sci. Total Environ. 2019, 691, 1155–1161. [Google Scholar] [CrossRef]
  114. Zhang, F.; Chen, X.; Vitousek, P. An experiment f or the world. Nature 2013, 497, 33–35. [Google Scholar] [CrossRef]
  115. Sutton, M.A.; Bleeker, A.; Howard, C.M.; Erisman, J.W.; Abrol, Y.P.; Bekunda, M.; Datta, A.; Davidson, E.; De Vries, W.; Oenema, O.; et al. Our Nutrient World. The Challenge to Produce More Food & Energy with Less Pollution; Centre for Ecology & Hydrology: Bailrigg, UK, 2013. [Google Scholar]
  116. Mohamed, E.S.; Saleh, A.M.; Belal, A.B.; Gad, A. Application of near-infrared reflectance for quantitative assessment of soil properties. Egypt. J. Remote Sens. Space Sci. 2018, 21, 1–14. [Google Scholar] [CrossRef]
  117. Chen, L.; Xing, L.; Han, L. Review of the application of near-infrared spectroscopy technology to determine the chemical composition of animal manure. J. Environ. Qual. 2013, 42, 1015–1028. [Google Scholar] [CrossRef]
  118. Rietra, R.P.J.J.; Oenema, O. Using NIRS to determine composition of solid manure. In Wageningen Environmental Research; Report 2837; Springer: Berlin/Heidelberg, Germany, 2017; Available online: https://edepot.wur.nl/423875 (accessed on 28 November 2021). (In Dutch)
  119. Galvez-Sola, L.; Moral, R.; Perez-Murcia, M.D.; Perez-Espinosa, A.; Bustamante, M.A.; Martinez-Sabater, E.; Paredes, C. The potential of near infrared reflectance spectroscopy (NIRS) for the estimation of agro-industrial compost quality. Sci. Total Environ. 2010, 408, 1414–1421. [Google Scholar] [CrossRef] [PubMed]
  120. Van Vuuren, J.A.; Groenewald, C.A. Use of Scanning Near-Infrared Spectroscopy as a Quality Control Indicator for Bulk Blended Inorganic Fertilizers. Commun. Soil Sci. Plant Anal. 2013, 44, 120–135. [Google Scholar] [CrossRef]
  121. Prananto, J.A.; Minasny, B.; Weaver, T. Near infrared (NIR) spectroscopy as a rapid and cost-effective method for nutrient analysis of plant leaf tissues. Adv. Agron 2020, 164, 1–49. [Google Scholar]
  122. Park, R.S.; Agnew, R.E.; Gordon, F.J.; Steen, R.W.J. The use of near infrared reflectance spectroscopy (NIRS) on undried samples of grass silage to predict chemical composition and digestibility parameters. Anim. Feed Sci. Technol. 1998, 72, 155–167. [Google Scholar] [CrossRef]
  123. Aernouts, B.; Polshin, E.; Lammertyn, J.; Saeys, W. Visible and near-infrared spectroscopic analysis of raw milk for cow health monitoring: Reflectance or transmittance. Int. J. Dairy Sci. 2011, 94, 5315–5329. [Google Scholar] [CrossRef] [Green Version]
  124. López, A.; Arazuri, S.; García, I.; Mangado, J.; Jarén, C. A review of the application of near-infrared spectroscopy for the analysis of potatoes. J. Agric. Food Chem. 2013, 61, 5413–5424. [Google Scholar] [CrossRef] [Green Version]
Figure 1. Relations between soil pH-CaCl2 (x-axis) and 0.01 M-CaCl2-extracted elements (y-axis, μg kg1).
Agronomy 12 00191 g001
Figure 2. Scatter plots showing reference methods (x-axes) versus NIRS (y-axes) for soil organic matter, soil organic carbon, effective CEC, and clay % of the validation data set. Reference methods are given in Table 2, while the number of samples and statistics are given in Table 4 (and Supplementary Figure S1).
Agronomy 12 00191 g002
Figure 3. Communication campaigns for farmers and extension services were created to explain the soil nutrient intensity, buffering, and quantity concepts (a) (see also Rotterdam et al., 2013) [72] and the soil fertility concept (physical, biological, and chemical soil fertility) (b). The arrows in (a) represent the buffering processes through dissolution/desorption (to the right) and adsorption/precipitation (to the left). A metaphor is used to explain the soil nutrient intensity, buffering, and quantity concepts (food on the ‘plate’, ‘kitchen’, and ‘basement’).
Agronomy 12 00191 g003aAgronomy 12 00191 g003b
Table 1. Descriptive statistics of the 0.01 M CaCl2 extractions (1:10 soil to solution ratio; w/v). Year = year of introduction for routine soil testing. DON = dissolved organic nitrogen. All data are from period 2010–2014, except for S (routinely introduced into testing in 2017), and pH (2005–2009, routinely measured by NIRS in the last decade) (Step 1).
Soil
Characteristic
YearReportingFirstMedianThirdAverageSt. Dev.nUnitAnalyses/
0.01 M CaCl2 LimitQuartile Quartile Reference
DON20073.019264031.918.67175mg kg−1DA; NEN-ISO 15923-1 [27]
NH4-N20040.54.46.79.97.74.77175mg kg−1DA; NEN-ISO 15923-1 [27]
NO3-N20041.23.46.31411.212.27175mg kg−1DA; NEN-ISO 15923-1 [27]
S 20172.03.75.510.118.47816,085mg kg−1ICP-AES; NEN 6966 [28]
P20040.21.12.03.83.03.2326,957mg kg−1DA; NEN-ISO 15923-1 [27]
K20048.0588312110067310,417mg kg−1ICP-AES; NEN 6966 [28]
Mg20044.576127216170132310,048mg kg−1ICP-AES; NEN 6966 [28]
Na20045.09.015272546239,181mg kg−1ICP-AES; NEN 6966 [28]
Si20123.04.16.312131645,750mg kg−1ICP-MS; NEN 17294-2 [29]
Fe20122.02.13.03.13.42.445,724mg kg−1ICP-AES; NEN 6966 [28]
Zn20040.10.41.32.21.51.566,541mg kg−1ICP-MS; NEN 17294-2 [29]
Mn20040.251.54.18.16.27.480,001mg kg−1ICP-AES; NEN 6966 [28]
Cu200420213043373473,128ug kg−1ICP-MS; NEN 17294-2 [29]
Co20042.54.61021172458,556ug kg−1ICP-MS; NEN 17294-2 [29]
B20047510314521920319772,897ug kg−1ICP-AES; NEN 6966 [28]
Mo20123.03.84.04.24.95.245,725ug kg−1ICP-MS; NEN 17294-2 [29]
Se20082.02.12.83.93.52.558,528ug kg−1ICP-MS; NEN 17294-2 [29]
pH2004-5.05.36.25.60.90354,187-Potentiometric ISO 10390 [30]
Table 2. Soil characteristics, number of samples (n), year of introduction into routine soil testing, determination coefficient (R2), RPD, root mean squared error (RMSE), average difference between NIRS and reference (bias), standard deviation of residuals (Sres), and references of the reference methods for the calibration data set.
Soil Characteristic Calibration
nyearR2RPDRMSEBiasSresReference
N-total55,94720040.998.60.530.0020.53ISO 13878 [43]; NEN 6966 [28]
S-total37,78320040.975.50.21−0.0000.21NEN 15587-2 [44]; NEN 6966 [28]
K-CEC16,14420060.792.02.19−0.0402.19ISO 23470 [45]; NEN 6966 [28]
Ca-CEC15,74220060.975.517.530.48317.52ISO 23470 [45]; NEN 6966 [28]
Mg-CEC15,73220060.882.76.32−0.0156.32ISO 23470 [45]; NEN 6966 [28]
pH-CaCl289,07520130.975.30.18−0.0040.18Potentiometric ISO 10390 [30]
Soil organic carbon (SOC)21,97620040.9912.94.930.0664.93ISO 10694 [46]
Soil organic matter (SOM)24,82520041.0017.56.460.0076.46NEN 5754 [47]
Soil inorganic carbon (SIC)15,86420040.975.61.450.0011.45NEN-EN 15936 [48]
Clay (<2 µm)49,12120040.987.017.990.66417.97NEN 5753 [49]
Sand (>50 µm <2000 µm)8,41920150.964.758.391.39058.37NEN 5753 [49]
Effective CEC (ECEC)16,12220050.975.820.440.12520.44ISO 23470 [45], 2018; NEN 6966 [28]
Table 3. Soil characteristic (element), conventional method, reference of conventional method, explained variance of the relation between the conventional methods (CM) and the broad-spectrum soil tests (0.01 M CaCl2 and NIRS), and their references (step 2). The determination coefficient (R2) gives the relation between the CM and the broad-spectrum soil tests. The ‘reference’ in step 2 shows where these results have been reported.
ElementConventional Method (CM)Reference of CMR2Reference Step 2
PPw; 1: 60 (v/v) waterVan der Paauw, 1971 [50]0.79–0.93Houba et al., 1986 [51]; De Haas et al., 2005 [52]; Reijneveld et al., 2014 [22]
KHCl; 1: 10 (w/v) 0.1 M hydrochloric acid–0.02M oxalic acidDe Vries & Hetterschij, 1945 [53]; Anonymous, 2012a; 2012b [54,55]0.77–0.90Houba et al., 1986 [51]; Baier &
Baierova, 1998 [56]; De Haas et al. [52]
MgNaCl; 1: 5 (w/v) 0.5 M sodiumchlorideFerrari & Sluijsmans, 1995 [57];
Anonymous, 2012a; 2012b [54,55]
0.88–0.97Loch et al., 1998 [58];
Van Erp et al., 2001 [59]
NaHCl; 1: 10 (w/v) hydrochloric acid–oxalic acidAnonymous, 2012b [54]0.82–0.93De Haas et al., 2005 [52]
MnMn-reducible; 1: 20 (w/v) ammonium acetate–1N hydroquinoneAnonymous, 2012a [55]0.95De Haas et al., 2005 [52]
CuHNO3; 1: 10 (w/v) 0.43 M Nitric acidHenkens, 1961 [60];
Anonymous, 2012a; 2012b [14,54]
0.87De Haas et al., 2005 [52]
Co1: 40 (w/v) 0.4 M Acetic acidHenkens, 1959 [61];
Anonymous, 2012b [54]
088De Haas et al., 2005 [52]
BHot water; 1: 10 (w/v) hot water Berger & Truog 1939 [62]0.74Novozamsky et al., 1990 [63]
pHKCl; 1: 5 (v/v) 1 M potassiumchlorideAnonymous, 2012a; 2012b [54,55]0.98Houba et al., 1990 [24]; Fotyma et al., 1998 [64]
Table 4. Soil characteristics, number of samples (n), slope (β), determination coefficient (R2), RPD, root mean squared error (RMSE) of the average difference between NIRS and reference (bias), standard error of bias (SE bias), F- and p-values (ANOVA) of the reference versus NIRS, and R2 and RMSE of the reference versus the reference (duplicate) for the validation data set.
Soil Characteristic Reference versus NIRSReference vs. Reference
NβR2RPDRMSEBiasSEFp (0.05)R2RMSE
N-total15020.940.975.40.26−0.050.010.980.320.980.21
S-total14970.930.903.00.11−0.010.000.790.380.950.08
K-CEC19341.050.691.41.680.090.041.170.280.990.28
Ca-CEC19300.940.975.714.21−0.890.320.110.740.995.62
Mg-CEC19221.010.913.14.61−0.050.110.010.920.990.96
pH18430.940.954.40.21−0.040.001.720.190.990.07
SOC18400.980.986.42.98−0.120.070.040.850.983.11
SOM22590.990.9910.64.62−0.020.100.000.990.994.14
SIC18630.980.965.10.61−0.110.011.220.270.990.33
Clay (<2 µm)18520.980.998.513.240.450.310.020.900.998.20
Sand (>50 µm)17960.950.975.346.734.911.100.340.560.9915.71
ECEC19810.950.976.015.260.350.340.010.900.997.79
Publisher’s Note: MDPI stays neutral with regard to jurisdictional claims in published maps and institutional affiliations.

