Article

Variation in the Nutritive Characteristics of Modern Perennial Ryegrass Cultivars in South-Eastern Australian Dairy Environments and Prospects for Inclusion in the Australian Forage Value Index (FVI)

1
Agriculture Victoria, Warrnambool, VIC 3280, Australia
2
Agriculture Victoria, Bundoora, VIC 3083, Australia
3
Agriculture Victoria, Hamilton, VIC 3300, Australia
4
School of Agriculture and Food, Faculty of Veterinary and Agricultural Sciences, University of Melbourne, Parkville, VIC 3010, Australia
*
Author to whom correspondence should be addressed.
Agronomy 2022, 12(1), 136; https://doi.org/10.3390/agronomy12010136
Submission received: 26 November 2021 / Revised: 23 December 2021 / Accepted: 4 January 2022 / Published: 6 January 2022
(This article belongs to the Special Issue Grazing Effects on the Nutritive Value in Grassland Ecosystems)

Abstract

:
Perennial ryegrass (PRG) is an important forage grown on dairy farms in temperate regions globally, including south-eastern Australia. A forage value index (FVI) providing information on the seasonal production of commercially available PRG cultivars is currently available. Despite the importance of the nutritive value of pasture in dairy farm systems, the nutritive characteristics of PRG cultivars are not currently included in the FVI as they are not routinely measured in cultivar evaluation trials. This study investigated differences between cultivar functional groups (diploid and tetraploid). It also examined differences between individual cultivars within seasons at four locations in south-eastern Australia and examined how trial location affects cultivar ranking. Samples were collected from existing cultivar evaluation trials over a 3-year period and analysed for nutritive characteristics. There were differences (p < 0.05) between diploids and tetraploids for metabolisable energy (ME) and neutral detergent fibre (NDF) in each season at each location with a few exceptions in summer and autumn. Crude protein (CP) differed between functional groups in some seasons at some sites. Spearman rank correlations within season were strong for ME between trial locations (r = 0.78–0.96), moderate to high for NDF (0.51–0.86) and variable for CP (−0.69–0.56). These findings provide guidance on methods for implementing nutritive value testing in cultivar evaluation trials and support the imminent inclusion of ME in the Australian FVI. The ranking of cultivars for ME was more consistent across trial sites compared to NDF and CP, suggesting the latter two traits, in particular CP, are more sensitive to environmental influences. Based on these results, we do not recommend the inclusion of CP as an individual trait in the Australian FVI. A significantly larger dataset and further research on the genotype by environment interactions would be needed to reconsider this. The addition of ME in the Australian FVI will lead to better cultivar choices by farmers and could lead to more targeted perennial ryegrass breeding programs.

1. Introduction

Perennial ryegrass (PRG, Lolium perenne L.) is an important forage species grown on many dairy farms in south-eastern Australia, New Zealand, Ireland, the United Kingdom and continental Europe, with many cultivars of the species commercially available that have been developed over several decades of plant breeding. Early plant breeding initiatives concentrated on annual dry matter (DM) yield and plant survival. More recently, factors such as seasonal DM yield and nutritive quality have been addressed by plant breeders [1]. This focus has led to the development of cultivars with a variety of flowering dates. Additionally, cultivars with an increased number of chromosomes (tetraploids) have been developed from diploid PRG as a strategy to increase nutritive value [2]. Commercially available cultivars are now routinely categorised according to their ploidy (diploids or tetraploids) and maturity (heading and flowering) dates, with these characteristics commonly referred to as functional types [3]. Tetraploids were widely used in Europe and the United Kingdom before being adopted in Australia [2], offering a possible explanation for the relatively limited research investigating differences in nutritive characteristics between ploidy type on a seasonal basis and between individual cultivars applicable to Australian dairy environments. The Australian dairy industry is concentrated in the south-eastern states, with Victoria and Tasmania collectively producing 75% of Australia’s milk [4]. Across the dairy regions in these states alone, key environmental elements such as rainfall vary from less than 500 mm to more than 1100 mm annually, with farms in lower rainfall areas requiring irrigation to support PRG pastures. Research in New Zealand has demonstrated differences between early and late maturing diploids and between diploids and tetraploids for metabolisable energy (ME), a key nutritive characteristic trait, with the magnitude of these differences varying between some seasons and in contrasting dairy environments [5]. A recent study in Australia [3] also found differences between PRG functional types but was limited to reporting results from one dairy environment.
Since the establishment of forage value indices in Ireland, New Zealand and Australia, there has been substantial interest in cultivar evaluation data for traits that are important on dairy farms. The Pasture Profit Index (PPI) in Ireland [6,7] was the first of these systems to be established and publishes individual cultivar information on seasonal yield, mid-season quality (digestibility), silage yield and persistence with these traits weighted according to their importance. In this system, the weighting for pasture digestibility is 25% [8]. For the published cultivars, tetraploids on average have dry matter digestibility (DMD) values 6.7 and 7.5 g/kg DM higher than diploids for intermediate and late heading dates, respectively. These differences in DMD are equivalent to 0.11 and 0.13 megajoules (MJ) of ME per kg of DM. The New Zealand Forage Value Index (FVI) [9] has progressively added new traits (ME and persistence) since the first release which ranked cultivars based on the value of seasonal DM yield. It publishes differences in ME between functional groups for two unique environments on a seasonal basis, suggesting a lack of sufficient cultivar-specific data for this trait. In the upper North Island, tetraploids have seasonal ME values 0.23–0.46 and 0.24–0.35 MJ/kg DM greater than mid- and late-heading diploids, respectively. For the rest of New Zealand, based on trial data from the Canterbury region in the upper South Island [10], tetraploids have seasonal ME values 0.42–0.64 and 0.27–0.35 MJ/kg DM greater than mid- and late-heading diploids, respectively. In contrast, the PRG Forage Value Index (FVI) developed in Australia is currently limited to providing information on seasonal dry matter production due to the lack of individual cultivar information on nutritive characteristics relevant to Australian dairy environments [11,12]. In New Zealand, ME concentration is considered an “indicator trait” for nutritive value in the FVI [13], although it is recognised by these researchers that measures of other nutritive characteristics (neutral detergent fibre, NDF and crude protein, CP) should be used in conjunction with ME to comprehensively evaluate the feeding value of forages [13,14].
Phenotypic information on these three traits (ME, CP and NDF) measured on modern cultivars in contrasting dairy environments is therefore needed, as is investigation of the seasonal variability in these traits. Collecting data on nutritive characteristics is labour-intensive and costly. Therefore, a validation of the range and variability of nutritive characteristics and a comparison of the ranking of cultivars at different locations based on their nutritive characteristics are warranted prior to the collection of a more comprehensive data set.
The study reported aimed to (i) investigate the variation in key nutritive characteristics: ME, crude protein (CP) and neutral detergent fibre (NDF) of diploid and tetraploid perennial ryegrass cultivars at four trial sites located in four south-eastern Australian dairy regions at multiple harvests over a 3-year period and (ii) compare the ranking of cultivars between sites and seasons for these characteristics. These results provide information on the amount of variation in nutritive characteristics in modern cultivars across a range of Australian dairy environments. The results will be of benefit to breeding companies, where improved nutritive characteristics have been identified as a target, and to dairy farmers when choosing cultivars to sow. One of the key tools that farmers use to choose varieties is the FVI, and the main impediment to including nutritive characteristics in the FVI is the lack of data. These results illustrate the value of including nutritive characteristics in the FVI and describe a practical methodology to address this lack of data.

2. Materials and Methods

2.1. Trial Sites and Cultivars

Four perennial ryegrass cultivar evaluation trials in each of 4 dairy regions in south-east Australia (Table 1) were used in this study. The trials were all sown in May–June 2015 and ran for 3 years. Seed of cultivars and pre-commercial lines (herein referred to as candidates) were voluntarily submitted by seed companies for trials being established according to the protocols used by the Pasture Trial Network (PTN) [15], which resulted in small differences between candidates sown at each site (Table A1). This study focused on the 28 candidates that were common to all sites. Each trial was an un-grazed small plot trial with each plot measuring 0.8 m × 5 m.

2.2. Trial Design and Sample Collection

A row column design with four replications was used for each trial. Samples for the measurement of nutritive characteristics were collected at regular intervals from each plot. Sampling times were scheduled according to the PTN protocol [15] and were consistent with when farmers would choose to graze. The target for harvests was when the average standing biomass of plots was 3000 kg DM/ha or when 75 days had elapsed since the last harvest, whichever occurred sooner. A representative random sample equating to approximately 50 g of the herbage DM above 5 cm was collected for analysis from each plot. On all occasions, samples were collected between 1000 h and 1200 h.
Following collection, samples were stored on ice prior to oven drying at 60 °C for at least 48 h. A sample mill was used to grind dried samples through a 1 mm screen. Composite samples were generated for candidates as described in Table A1 using the composite sampling strategy of [16]. Briefly, ground subsamples of equal weight from each of the 4 replicate plots corresponding to the individual candidate at each sampling time were combined to create a single composite sample for that candidate. This sample was mixed thoroughly prior to laboratory analysis.
In the laboratory, individual and composite samples were analysed for in vitro dry matter digestibility (IVDMD), CP and NDF using near-infrared spectroscopy (NIRS) as described by [16]. Consistent with [16], ME was estimated [17] by:
ME (MJ/kg DM) = 0.17 × DMD (%) − 2.0

2.3. Statistical Analysis

The data on each nutritive characteristic from each trial were analysed using the linear mixed model (LMM) methodology implemented using restricted maximum likelihood (REML) [18] in ASReml-R (VSN International, Hempstead, UK) [19]. The fixed effects included the main effects of harvests and the linear effects of rows and columns to account for non-stationary global variation across the field within a harvest in a trial. The random effect included candidates within harvests as the treatment structure which enabled best linear unbiased prediction (BLUP) of nutritive characteristics. The temporal genotypic correlation of observations on the same plot from consecutive harvests was modelled by a first-order auto-regressive process (AR1). With multi-harvest data, the repeated measure structure of the data was accounted for using the full variance–covariance structure of residuals from different harvests, which allowed for both the heterogeneity of residual variances at different harvests and heterogeneity in covariance (correlation). Furthermore, we accounted for spatial correlations between observations by including autocorrelation of order one in both the row and column direction. The combined data from all four trials were analysed by LMM methodology like that described previously but with trial as an extra factor. The details of similar multi-harvest, multi-environment analyses can be found in [20].
A year was split into five seasons on a calendar month basis (Table 2) consistent with the dry matter yield values in the FVI [11]. Seasonal BLUP means were computed first by generating a two-way table of predicted means of “candidate” by “harvest”; then, averages were taken to “collapse” the multiple harvest means into seasonal means (for example, all the means from harvest dates in “early spring” were averaged to give the “early spring” predicted mean for that trial entry). The differences between candidates and between ploidy mean values were taken to be statistically significant when they differed by least significant difference (lsd) computed at a 5% level of significance. Spearman’s rank correlation coefficients were used to compare the ranking of candidates for each nutritive characteristic between trial sites within each of the 5 seasonal periods (Table 2).

Power Analysis for Metabolisable Energy

A decision on the amount of replication required to detect significant differences in the key traits of interest must be made when undertaking cultivar evaluation trials. As ME is of primary importance in Australian dairy production systems, a power analysis for this trait was conducted in Genstat (Genstat release 2020, VSN International Ltd., Hemel Hempstead, UK) using the ‘Asamplesize’ procedure to determine the effect of decreasing or increasing replication on the likelihood of detecting significant differences between candidates. The parameters of the power analysis were set as follows: (i) the estimated average residual variance in ME of each trial using current trial data; (ii) an effect size of 0.3 MJ/kg DM of ME. This power analysis was undertaken on average, rather than seasonal values. The effect size of 0.3 MJ/kg DM was guided by what we observed in our trials and from published literature in New Zealand [5].

3. Results

3.1. Variation in Nutritive Characteristics of Perennial Ryegrass

3.1.1. Differences between Candidate Functional Groups (Diploid and Tetraploid) within Seasons

Table 3, Table 4 and Table 5 show the seasonal BLUP estimates for diploid and tetraploid PRG groups for key nutritive characteristics.
Tetraploids had consistently higher ME values than diploids in every season at each location except for Ellinbank in summer (Table 3). Higher ME values for tetraploids were also detected for each season in the combined analysis.
Crude protein differed between functional groups in some seasons at some sites (Table 4). However, there was no consistent trend between functional groups across sites, with the combined sites analysis showing no difference in CP between diploids and tetraploids in any season. At Timboon, CP concentration was higher in tetraploids in all seasons except early spring, where there was no difference between diploids and tetraploids. In contrast, at Elliott, diploids had higher CP concentrations than tetraploids in three of the five seasonal periods. At Tongala, diploids also had a higher CP concentration than tetraploids in summer, but there was no difference between functional groups in any of the other four seasonal periods. No difference in CP concentration between functional groups was found in any season at Ellinbank.
Tetraploid ryegrasses had lower NDF concentrations than diploid ryegrasses in all seasons and at all locations (Table 5). The mean NDF content across seasons and sites was 45.3% DM for tetraploids compared to 46.8% DM for diploids.

3.1.2. Variability of Candidates within Seasons

Seasonal trends in ME, CP and NDF for each site are illustrated in Figure 1. Metabolisable energy values were highest in winter and lowest in summer for all sites. Within sites, CP concentration was highest in winter at Timboon and Tongala, whereas both autumn and winter had the highest seasonal CP concentrations. The lowest CP concentrations occurred in summer at two sites and spring at two sites. Neutral detergent fibre concentrations generally followed an inverse seasonal trend to ME for most sites, although this was least apparent at Timboon, where there were less extremes in NDF concentration across seasons compared to the other sites.
Figure 1 also shows variability between candidates within each seasonal period and according to functional group. For all nutritive characteristics, there is overlap in the boxplots between diploids and tetraploids. For ME, this indicates there are some diploid candidates that have an ME value as high as some tetraploid candidates, even though on average tetraploids were higher in ME (Table 3). Similarly, although tetraploids had lower NDF concentrations throughout the year at all sites, Figure 1 shows there were some diploid candidates with NDF concentrations as low as some of the tetraploid candidates in all seasons and locations.

3.2. Likelihood of Replicated Trials Detecting Differences in Important Nutritive Characteristics

Samples analysed for nutritive characteristics in this study were collected from trials with four replicates. This level of replication indicates that on average, there was an 84% chance of detecting differences of 0.3 MJ/kg DM between any two candidates for ME at Timboon and a 68% chance at Tongala and Elliott, but only 36% at the Ellinbank site (Figure 2). On average, the ME values of more than 75% of the candidates were significantly different to the candidate with the lowest ME at Elliott, Timboon and Tongala and for 56% of the candidates at Ellinbank. The summary statistics and lsd values for metabolisable energy at each site are provided in Table A2.

3.3. Effect of Trial Location on Candidate Ranking

Spearman rank correlations (SRC) within season were strong for ME between trial locations (r = 0.78–0.96), moderate to high for NDF (0.53–0.86) and variable for CP (−0.69–0.56), (Figure 3). The high SRC for ME indicates consistency with the ranking of candidates for ME across dairy environments in south-eastern Australia.

3.4. Relationship between Metabolisable Energy and DM Yield

Moderate correlations between ME and DM yield were evident in 4 out of 5 seasonal periods (r = 0.43–0.66) (Figure 4). The exception was early spring, where a very weak correlation (r = 0.13) was observed. Where diploids had a similar harvest DM yield to tetraploids within a seasonal period, tetraploids generally had a higher ME value.

4. Discussion

This study will facilitate the expansion of the Australian FVI to include nutritive traits of PRG that are economically important in pasture-based dairy production systems and more broadly add to the body of literature on the variation in nutritive characteristics of PRG cultivars used in temperate dairy systems. The lack of any measure of nutritive value in the Australian FVI was identified as a limitation of the index in its development phase [11]. However, the lack of data on the nutritive characteristics of modern PRG cultivars in south-eastern Australian dairy environments precluded the inclusion of this information at that time. In contrast, the PPI in Ireland [6,7] and more recently the DairyNZ FVI [9] have included nutritive characteristic traits. However, the New Zealand system is currently limited to reporting ME at the functional group level rather than for individual cultivars, further indicating the paucity of information available on the nutritive characteristics of modern individual PRG cultivars in the temperate dairying areas of the southern hemisphere.
Metabolisable energy is the primary determinant of milk production [21] and therefore is considered an economically important nutritive characteristic trait. It is widely known that the ME of pastures fluctuates seasonally, and studies have shown that tetraploid PRGs have higher digestibility and ME values than diploid PRGs [3,22,23]. In Australia and New Zealand, most tetraploids are classified as “late” or “very late” heading, enabling them to produce more vegetative growth in late spring [3] compared to some of the diploid cultivars that produce seed heads earlier in spring. Late heading can therefore lead to pastures with superior nutritive characteristics in spring when PRG growth is at its peak. The heading dates of diploids range from early to late, but even the late-heading diploid cultivars have been found to have a lower ME concentration than comparable tetraploids [3]. Tetraploid cultivars have larger cells than diploids, leading to differences in digestibility [2]. However, it is important to note that there is variation amongst cultivars with some diploid candidates in our study having equivalent ME concentrations to some tetraploid candidates in all seasons of the year, even though on average the tetraploid candidates had a higher ME.
Trial design and the method of statistical analysis used can affect whether differences between cultivars for traits of interest are detected [24]. Our analyses accounted for the spatial and repeated measurement structure of the trial data, which was one of the ways suggested [24] to improve the detection of candidate differences. The power analysis of ME was conducted on the average performance of candidates across seasons at each trial site and showed that four replications were adequate for the detection of a 0.3 MJ/kg DM ME difference between candidates. The Ellinbank trial had lower power to detect this change than the other sites mainly due to ME measurements in Ellinbank being more variable than the other sites. Candidate performance varied by season at each site. While it would be possible to perform a seasonally specific power analysis for each site, the result will be a different number of replications needed to achieve a certain power for each season. This could not be practically applied as it is not possible to change the number of replicates each season.
It is never possible to test all cultivars in all environments as even within regions, there is variation in environmental factors such as rainfall and soil type. However, the results comparing candidate rankings for ME from this study indicate that it is possible to use trial data from other dairying areas of south-eastern Australia where necessary for the purpose of ranking cultivars on ME. A multi-environment approach, as is currently done with the DM yield data in the Australian FVI, could also be considered for this trait. Our recommended strategy for the testing of ME across south-eastern Australian dairy environments is to have every cultivar tested in at least one fully replicated trial where all plots are tested individually on each sampling occasion to achieve the greatest accuracy and precision [16], which could then be supported by a network of trials that may adopt the composite sampling strategy (if resources are constrained) to achieve geographic breadth. As the knowledge of the environments in the trial network grows, it would become possible to allocate the fully replicated trials to those environments that are inherently more variable. Farmer confidence in the FVI is likely to be greater if they know that cultivars have been tested in their region.
The results for CP were less conclusive, with trends in CP varying between the trial sites and inconsistent trends, and in some cases, no differences between functional groups were observed. CP is currently not included in either the PPI or the DairyNZ FVI as the CP content of PRG is not considered a limiting nutrient for dairy cows grazing these pastures [25].
In this study, the NDF of most tetraploids was consistently lower (mean across seasons and sites 45.3% DM) than the diploid cultivars (mean across seasons and sites 46.8% DM) throughout the year, which was expected as NDF is inversely related to digestibility and ME. While high ME and low NDF forages may be desirable, there are on-farm pasture and feed management considerations associated with this. Both managing grazing residuals to balance pasture regrowth and utilisation and consideration of the overall NDF concentration of dairy cow diets are important. Recent Irish research found lower post-grazing residuals in tetraploids (3.7 cm) compared to diploids (4.1cm), with the lower residuals in this context associated with a higher grazing efficiency [26]. However, low post-grazing residuals can affect pasture regrowth [27]. Notably, the residuals to achieve high grazing efficiency in Ireland were 26% lower than recommendations in Australian and New Zealand dairy systems [27,28], where a residual grazing height of 5 cm is considered optimal for growth and persistence [29]. In Australian dairy systems, cereal grain supplements low in NDF are commonly fed to cows. The NDF values of these feeds must also be considered when selecting forages in these systems to ensure that the NDF content of cow diets is within the recommended range of 30–40% of DM intake, which is considered sufficient to support rumen function but not limiting total intake. [21].

5. Conclusions

Our study showed that the tetraploid PRGs had consistently higher ME values than diploid PRGs, although the differences were numerically small and there was evidence of variation within diploid and tetraploid groups. These data show that it would be possible for dairy farmers to select cultivars with above-average nutritive characteristics in their environment. In some cases, candidates with the higher ME values were also high yielding candidates that would increase the on-farm benefits of sowing cultivars with these characteristics. High yielding cultivars with high ME may also provide sources of elite germplasm for breeding programs. The inclusion of an economic value for marginal differences in ME may result in greater differentiation between the seasonal performance of cultivars when this trait is added to the Australian FVI. Ascertaining whether this translates into tangible on-farm milk production benefits and profit would require complementary farm systems studies and/or modelling.
The ranking of candidates for ME was more consistent across trial sites compared to CP and NDF, suggesting these two traits, especially CP, are more sensitive to environmental influences. Further research with a larger dataset would enable a greater understanding of the genotype by environmental interactions for these traits.
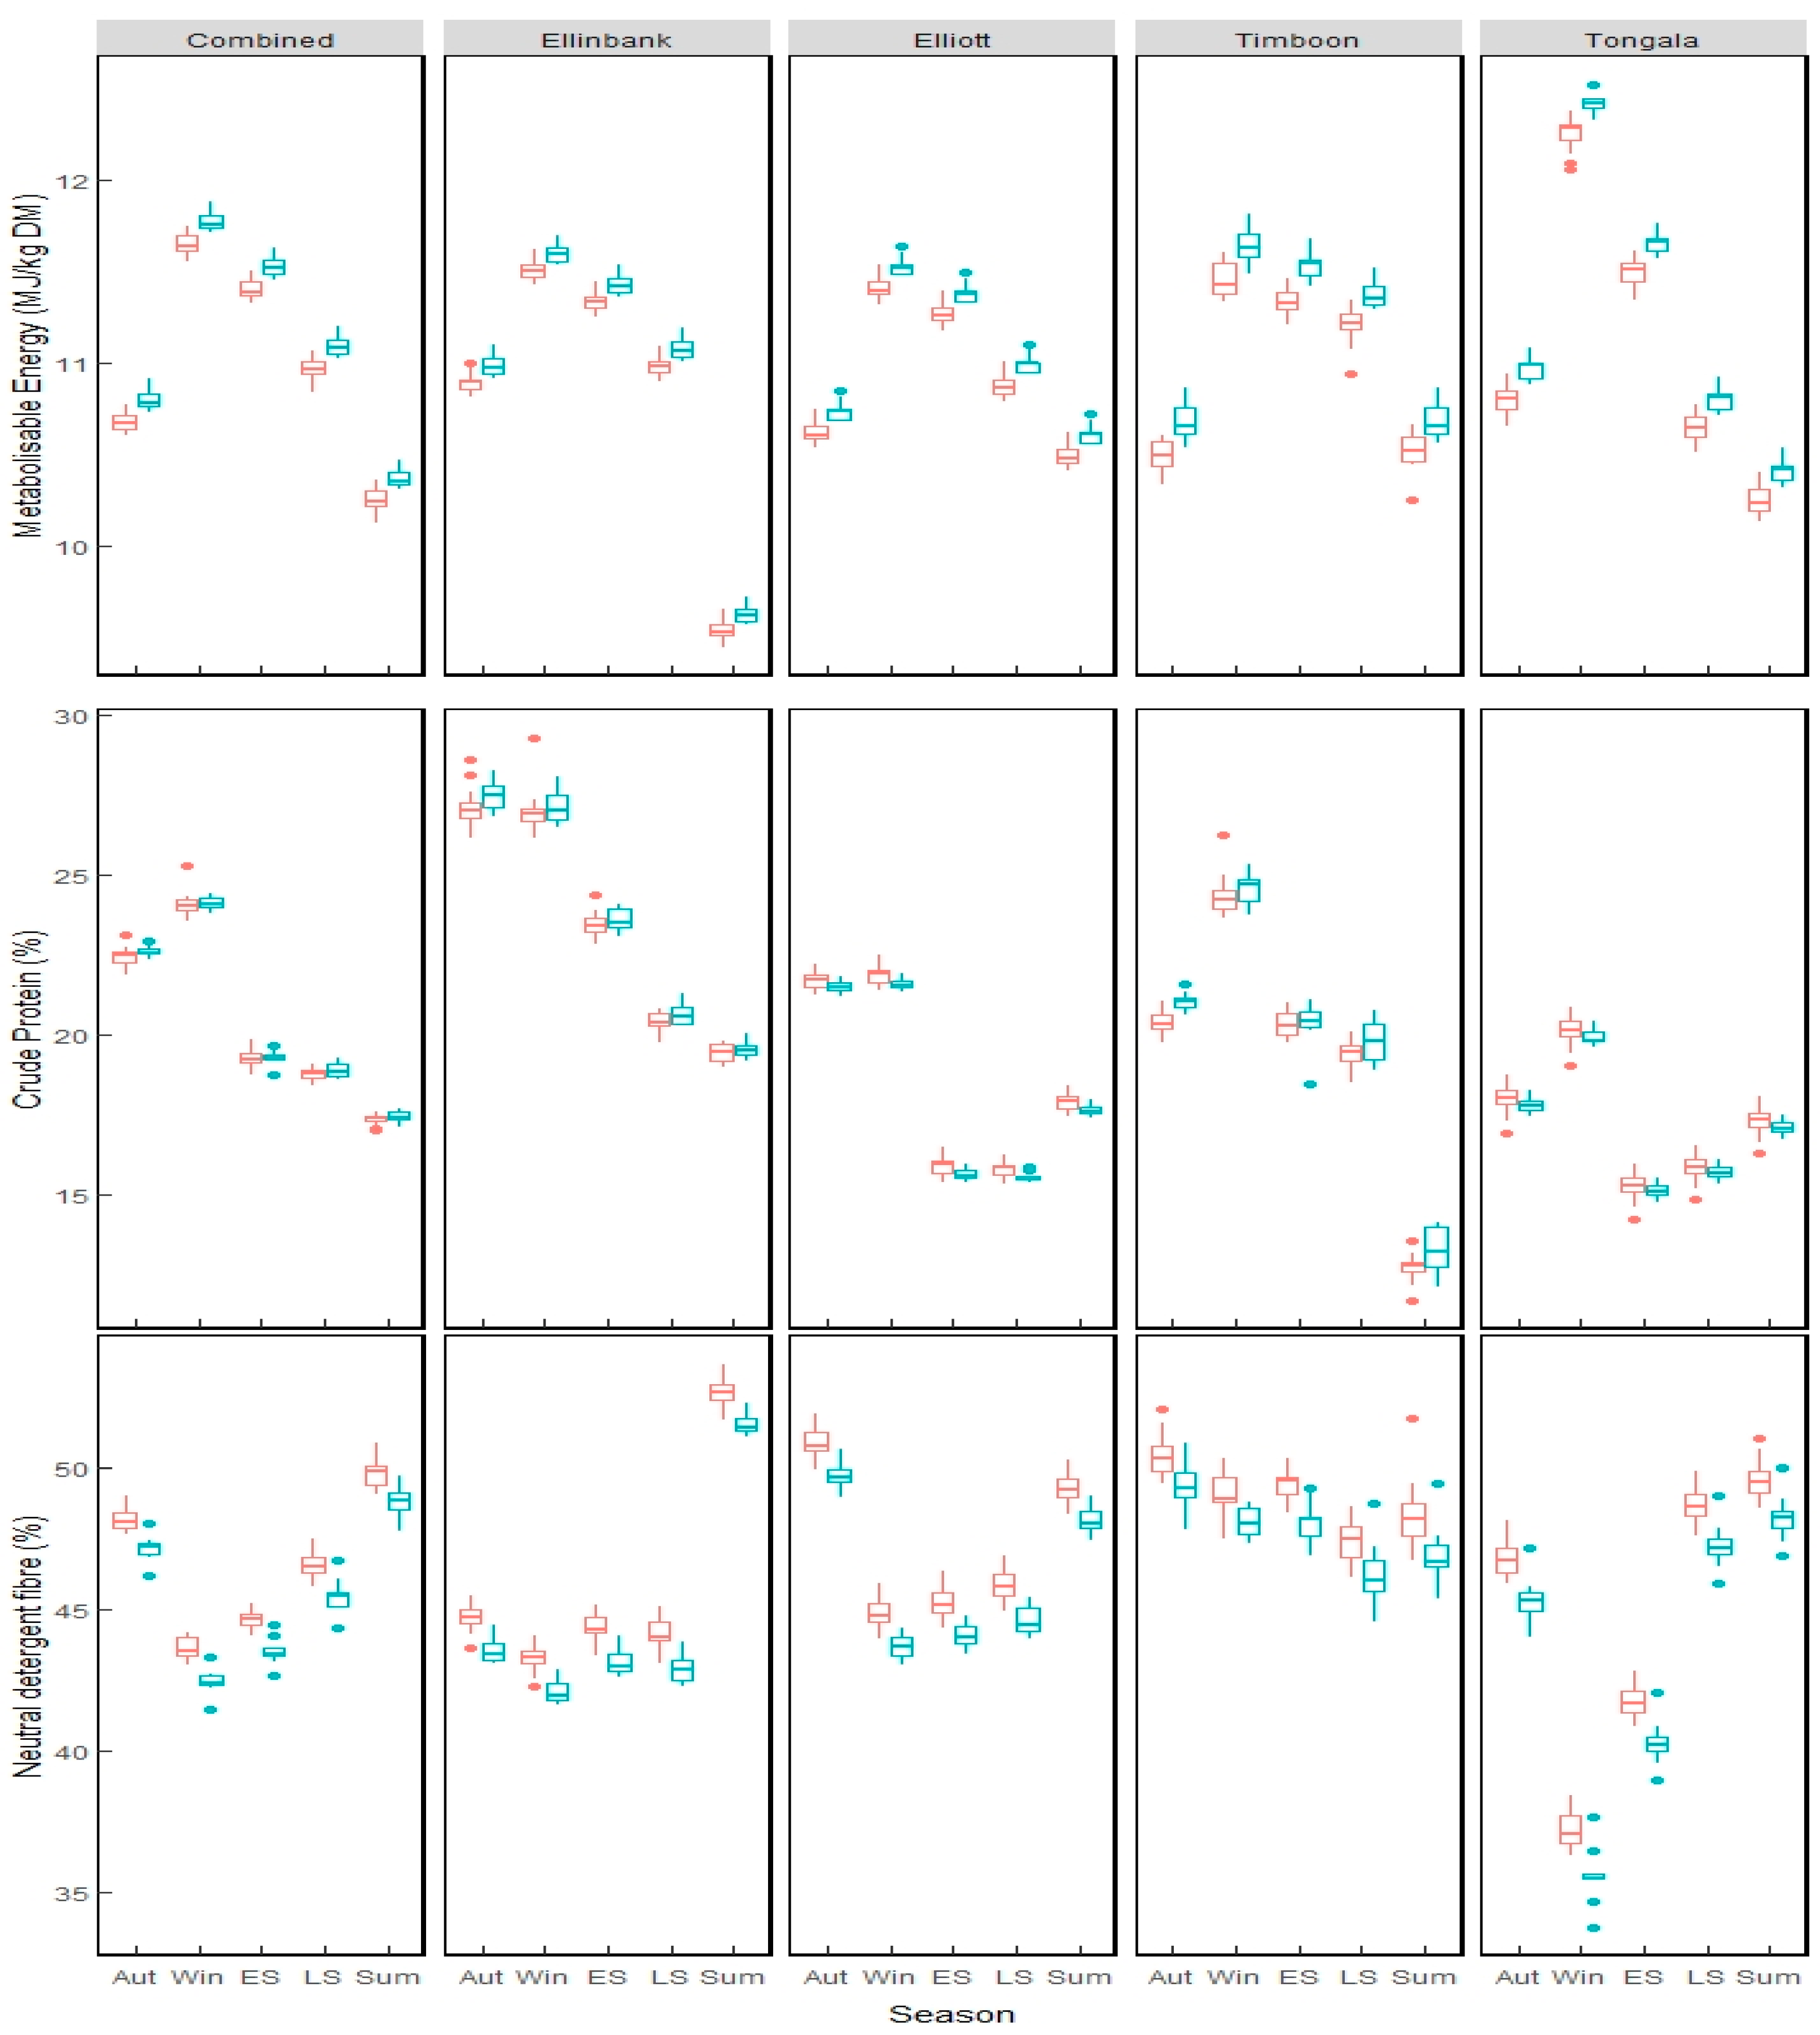
Author Contributions

Conceptualisation, K.S.; data curation, C.L. and K.G.; formal analysis, K.G.; investigation, C.L.; methodology, C.L. and K.S.; writing—original draft, C.L. and K.G.; writing—review and editing, C.L., K.S. and K.G. All authors have read and agreed to the published version of the manuscript.

Funding

Samples for the analysis of nutritive characteristics were collected from trial sites operating as part of the “Forage Value Index” project jointly funded by the State of Victoria through the Department of Jobs, Precincts and Regions and Dairy Australia. Financial support for the trial site at Elliott was also provided by the Tasmanian Institute of Agriculture at the University of Tasmania. The Pasture Trials Network contributed funding for the field sites at Ellinbank and Elliott and co-ordinated the provision of seed from companies entering lines for all trial sites. The analysis of data has occurred as part of the Dairy Feedbase program, an initiative funded by the State of Victoria through Agriculture Victoria, Dairy Australia and the Gardiner Foundation.

Data Availability Statement

The data presented in this study are available on request from the corresponding author for research purposes.

Acknowledgments

The authors acknowledge those involved in managing trial sites and conducting fieldwork at Ellinbank, Elliott, Tongala and Timboon, and the Agriculture Victoria staff at Hamilton and Horsham who analysed the perennial ryegrass samples.

Conflicts of Interest

The authors declare no conflict of interest. The funders had no role in the design of the study; in the collection, analyses, or interpretation of data; in the writing of the manuscript; or in the decision to publish the results.

Appendix A

Table A1. Summary details of candidates sown (✓) in each of the 4 trial sites including whether nutritive characteristics were analysed on individual plots (I) or as composite (C) samples, where subsamples collected from each plot of the candidate were bulked into a single sample for that candidate.
CandidateEndophytePloidyHeading Date Category 1EllinbankElliottTimboonTongala
Ansa AR1AR1DiploidMid-late✓ C✓ C✓ I✓ C
AusVicLowDiploidMid✓ I✓ C
Avalon AR1AR1DiploidMid✓ C✓ I✓ C
Base AR37AR37TetraploidLate✓ I✓ I✓ I✓ I
Bealey NEA2NEA2TetraploidVery late✓ I✓ I✓ I✓ I
EndureStandardTetraploidMid✓ C
Excess AR37AR37DiploidMid✓ C✓ C✓ I✓ C
Expo AR37AR37DiploidLate✓ C✓ C✓ I✓ C
Halo AR37AR37TetraploidLate✓ I✓ I✓ I✓ I
Impact2 NEA2NEA2DiploidLate✓ I✓ I✓ I✓ I
Jackal AR1AR1DiploidMid✓ I✓ I✓ I✓ I
Jeta AR1AR1TetraploidMid✓ C✓ C✓ I✓ C
Kidman AR1AR1DiploidEarly✓ I✓ I✓ I✓ I
MatrixStandardDiploidLate✓ I✓ I✓ I✓ I
One50 AR1AR1DiploidLate✓ I✓ I✓ I✓ I
One50 AR37AR37DiploidLate✓ I✓ I✓ I✓ I
PlatinumLowDiploidLate✓ C✓ C✓ I✓ C
Prospect AR37AR37DiploidLate✓ I✓ I✓ I✓ I
Request AR37AR37DiploidMid✓ C
Reward Endo5Endo5TetraploidVery late✓ C✓ C✓ I✓ C
SF Hustle AR1AR1DiploidMid✓ I✓ I✓ I✓ I
Shogun NEA2NEA2TetraploidLate✓ C✓ C✓ I✓ C
Ultra AR1AR1DiploidLate✓ C✓ C✓ I✓ C
VictorianStandardDiploidEarly✓ I✓ I✓ I✓ I
Wintas IILowDiploidMid✓ C
Coded (Lnc 3)Diploid✓ I✓ I✓ I✓ I
Coded (Lnc 5)Diploid✓ C✓ C✓ I✓ C
Coded (Lnc 6)Diploid✓ C✓ C✓ I✓ C
Coded (Lnc 7)Diploid✓ C✓ C✓ I✓ C
Coded (Lnc 8)Tetraploid✓ C✓ C✓ I✓ C
Coded (Lnc 9)Tetraploid✓ C✓ C✓ I✓ C
Coded (Lnc10)Diploid✓ C
Coded (Lnc11)Diploid✓ C✓ C✓ I✓ C
Coded (Lnc12)Diploid✓ I✓ C
Coded (Lnc13)Tetraploid✓ C✓ C✓ I✓ C
1 According to the flowering activity characteristics published in the Australian Seed Federation database, available at https://www.asf.asn.au/seeds/pasture-seed-database/ (accessed on 8 October 2020).
Table A2. Summary statistics and lsd values for metabolisable energy for each season derived from 3 years of trial data.
TrialSummary StatisticsAutumnWinterEarly SpringLate SpringSummer
EllinbankMean10.9211.5311.3611.019.56
Minimum10.8011.4111.2510.899.45
Maximum11.1111.7011.5411.199.72
Standard error 10.0480.0520.0470.0450.048
lsd0.1040.1040.0980.0970.103
n-candidate 21717161717
ElliotMean10.6611.4511.3110.9210.53
Minimum10.5411.3311.1810.7910.41
Maximum10.8511.6411.4911.1110.72
Standard error 10.0260.0290.0300.0280.026
lsd0.0610.0650.0640.0620.060
n-candidate 22222232222
TimboonMean10.5311.5011.3811.2410.55
Minimum10.3311.3211.1410.9410.25
Maximum10.8711.8211.6811.5210.86
Standard error 10.0490.0340.0320.0290.054
lsd0.1090.0810.0730.0690.107
n-candidate 22321282827
TongalaMean10.8511.5411.5410.6910.30
Minimum10.6611.3511.3510.5110.13
Maximum11.0811.7711.7710.9210.54
Standard error 10.0330.0440.0310.0310.035
lsd0.0730.0990.0690.070.077
n-candidate 22729292622
1 Average standard error, 2 n-candidate means number of candidates that were significantly different to the minimum candidate (minimum value) in that season.

References

  1. McDonagh, J.; O’Donovan, M.; McEvoy, M.; Gilliland, T.J. Genetic gain in perennial ryegrass (Lolium perenne) varieties 1973 to 2013. Euphytica 2016, 212, 187–199. [Google Scholar] [CrossRef] [Green Version]
  2. Smith, K.F.; Simpson, R.J.; Culvenor, R.A.; Humphreys, M.O.; Prud’Homme, M.P.; Oram, R.N. The effects of ploidy and a phenotype conferring a high water-soluble carbohydrate concentration on carbohydrate accumulation, nutritive value and morphology of perennial ryegrass (Lolium perenne L.). J. Agric. Sci. 2001, 136, 65–74. [Google Scholar] [CrossRef]
  3. Lawson, A.R.; Giri, K.; Rogers, M.E.; Muir, S.K.; Kelly, K.B.; Rentsch, K.; Chandra, S.; Jacobs, J.L. Nutritive characteristics of perennial ryegrass cultivars: Have they changed over time? Anim. Prod. Sci. 2020, 60, 127–132. [Google Scholar] [CrossRef]
  4. Dairy Australia Milk Production Reports. Available online: https://www.dairyaustralia.com.au/resource-repository/2020/09/25/milk-production-report#.YX9px7hByUl (accessed on 15 January 2021).
  5. Ludemann, C.I.; Wims, C.M.; Chapman, D.F. Changes in estimated value of perennial ryegrass cultivar/endophyte combinations in the DairyNZ Forage Value Index when metabolizable energy contents specific to cultivar groups are included. J. N. Z. Grassl. 2018, 80, 215–218. [Google Scholar] [CrossRef]
  6. McEvoy, M.; O’Donovan, M.; Shalloo, L. Development and application of an economic ranking index for perennial ryegrass cultivars. J. Dairy Sci. 2011, 94, 1627–1639. [Google Scholar] [CrossRef]
  7. O’Donovan, M.; McHugh, N.; McEvoy, M.; Grogan, D.; Shalloo, L. Combining seasonal yield, silage dry matter yield, quality and persistency in an economic index to assist perennial ryegrass variety selection. J. Agric. Sci. 2017, 155, 556–568. [Google Scholar] [CrossRef]
  8. Department of Agriculture, Food and the Marine. Grass and White Clover Varieties Irish Recommended List 2021. Available online: https://www.gov.ie/en/publication/8dbf3-grass-and-white-clover-recommended-list-varieties-for-ireland-2021/ (accessed on 22 October 2021).
  9. Chapman, D.F.; Bryant, J.R.; Olayem, M.E.; Edwards, G.R.; Thorrold, B.S.; McMillan, W.H.; Kerr, G.A.; Judson, G.; Cookson, T.; Moorhead, A.; et al. An economically based evaluation index for perennial and short-term ryegrasses in New Zealand dairy farm systems. Grass Forage Sci. 2017, 72, 1–21. [Google Scholar] [CrossRef]
  10. Forage Value Index. The DairyNZ FVI Handbook 2021 Edition. Available online: https://www.dairynz.co.nz/media/5794012/forage-value-index-handbook-2021-final.pdf (accessed on 22 October 2021).
  11. Leddin, C.M.; Jacobs, J.L.; Smith, K.F.; Giri, K.; Malcolm, B.; Ho, C.K.M. Development of a system to rank perennial ryegrass cultivars according to their economic value to dairy farm businesses in south-eastern Australia. Anim. Prod. Sci. 2018, 58, 1552. [Google Scholar] [CrossRef]
  12. Dairy Australia Forage Value Index. Available online: https://www.dairyaustralia.com.au/feed-and-nutrition/growing-feed-for-the-herd/growing-pastures/forage-value-index#.YFgR5CQzaUk (accessed on 22 March 2021).
  13. Cosgrove, G.P.; Lee, J.M.; Chapman, D.F.; Stevens, D.R.; Rossi, L.; King, W.M.; Edwards, G.R. Metabolisable energy concentration in perennial ryegrass pastures: Multi-site analysis of effects of cultivar, nitrogen fertilizer and white clover content. New Zealand Grassl. Assoc. 2018, 235–242. [Google Scholar] [CrossRef]
  14. Waghorn, G.C. What is dietary metabolisable energy? Proc. N. Z. Grassl. Assoc. 2007, 69, 153–159. [Google Scholar] [CrossRef]
  15. Kemp, S. Pasture Trials Protocol Manual; Meat and Livestock Australia Limited: North Sydney, Australia, 2011. [Google Scholar]
  16. Leddin, C.; Giri, K.; Smith, K. Application and analysis of a composite sampling strategy to cost-effectively compare nutritive characteristics of perennial ryegrass cultivars in field trials. Agronomy 2020, 10, 1152. [Google Scholar] [CrossRef]
  17. Corbett, J.L.; Freer, M.; Hennessy, D.W.; Hodge, R.W.; Kellaway, R.C.; McMeniman, N.P.; Nolan, J.V. Feeding Standards for Australian Livestock Ruminants; CSIRO: Melbourne, Australia, 1990; p. 9.
  18. Patterson, H.D.; Thompson, R. Recovery of interblock information when block sizes are unequal. Biometrika 1971, 58, 545–554. [Google Scholar] [CrossRef]
  19. Butler, D.; Cullis, B.R.; Gilmour, A.R.; Gogel, B.J. ASReml-R, Reference Manual; Queensland Department of Primary Industries and Fisheries: Toowoomba, Australia, 2007.
  20. Giri, K.; Chia, K.; Chandra, S.; Smith, K.F.; Leddin, C.M.; Ho, C. Modelling and prediction of dry matter yield of perennial ryegrass cultivars sown in multi-environment multi-harvest trials in south-eastern Australia. Field Crop. Res. 2019, 243, 107614. [Google Scholar] [CrossRef]
  21. Wales, W.J.; Heard, J.W.; Ho, C.K.M.; Leddin, C.M.; Stockdale, C.R.; Walker, G.P.; Doyle, P.T. Profitable feeding of dairy cows on irrigated dairy farms in northern Victoria. Aust. J. Exp. Agric. 2006, 46, 743–752. [Google Scholar] [CrossRef]
  22. A Balocchi, O.; López, I.F. Herbage Production, Nutritive Value and Grazing Preference of Diploid and Tetraploid Perennial Ryegrass Cultivars (Lolium perenne L.). Chil. J. Agric. Res. 2009, 69, 331–339. [Google Scholar] [CrossRef] [Green Version]
  23. Wims, C.M.; Ludemann, C.I.; Phillips, H.; Chapman, D.F. The economic value to dairy systems of genetic gains in the nutritive value of perennial ryegrass in grass–clover pastures. Anim. Prod. Sci. 2017, 57, 1357–1365. [Google Scholar] [CrossRef]
  24. Smith, K.F.; Kearney, G.A. Improving the power of pasture cultivar trials to discriminate cultivars on the basis of differences in herbage yield. Aust. J. Agric. Res. 2002, 53, 191–199. [Google Scholar] [CrossRef]
  25. Griffiths, W.M.; Roach, C.G.; Chapman, D.F. Should forage evaluation indices include a feeding value trait? Grass Forage Sci. 2020, 75, 242–252. [Google Scholar] [CrossRef]
  26. Tubritt, T.; Delaby, L.; Gilliland, T.J.; O’Donovan, M. The relationship between the grazing efficiency and the production, morphology and nutritional traits of perennial ryegrass varieties. J. Agric. Sci. 2020, 158, 583–593. [Google Scholar] [CrossRef]
  27. Lee, J.M.; Donaghy, D.J.; Roche, J.R. Effect of Defoliation Severity on Regrowth and Nutritive Value of Perennial Ryegrass Dominant Swards. Agron. J. 2008, 100, 308–314. [Google Scholar] [CrossRef]
  28. Fulkerson, W.J.; Slack, K.; Lowe, K.F. Variation in the response of Lolium genotypes to defoliation. Aust. J. Agric. Res. 1994, 45, 1309–1317. [Google Scholar] [CrossRef]
  29. Fulkerson, W.J.; Donaghy, D.J. Plant-soluble carbohydrate reserves and senescence—Key criteria for developing an effective grazing management system for ryegrass-based pastures: A review. Aust. J. Exp. Agric. 2001, 41, 261–275. [Google Scholar] [CrossRef]
Figure 1. Seasonal variation in the nutritive characteristics of diploid ( Agronomy 12 00136 i001) and tetraploid ( Agronomy 12 00136 i002) candidates common across all trial sites. Results are presented for individual trial sites and for a combined sites analysis. The horizontal line on the box plots indicates the median; the box indicates the inter-quartile range (IQR); the vertical whiskers indicate values within 1.5 times the IQR above the 75th percentile and below the 25th percentile. Outliers represented by dots are greater than 1.5 times the IQR beyond either end of the box.
Agronomy 12 00136 g001
Figure 2. Effect of the number of replicate plots on the likelihood of detecting differences in metabolisable energy between candidates at Timboon (squares), Tongala (circles), Elliott (crosses) and Ellinbank (triangles).
Agronomy 12 00136 g002
Figure 3. Spearman rank correlations demonstrating how consistently candidates ranked between trial sites (EBK = Ellinbank, ELT = Elliott, TIM = Timboon, TON = Tongala) based on seasonal best linear unbiased predictions (BLUPs) calculated from 3 years of trial data for (a) metabolisable energy, (b) crude protein and (c) neutral detergent fibre.
Agronomy 12 00136 g003
Figure 4. Relationship between metabolisable energy (ME, MJ/kg DM) and individual harvest dry matter (DM) yields (kg DM/ha) of candidates grouped by seasonal period: autumn (●), winter (▲), early spring (■), late spring (+), summer (⊠) and ploidy: diploid (), tetraploid (). Each point on the graph combines the seasonal best linear unbiased prediction (BLUP) for DM yield and ME derived from 3 years of data and where all 4 trial sites were combined.
Agronomy 12 00136 g004
Table 1. Location of cultivar evaluation trials in south-eastern Australia.
Dairy RegionLocationLong-Term Average Annual Rainfall 1 (mm)LatitudeLongitude
TasmaniaElliott119241.1° S145.8° E
Gippsland, VictoriaEllinbank109538.3° S145.9° E
South-west VictoriaTimboon95038.5° S142.9° E
Northern VictoriaTongala44036.3° S144.9° E
1 Source: Australian Government Bureau of Meteorology www.bom.gov.au/climate/data/stations (accessed on 26 October 2021).
Table 2. Seasonal periods used in the forage value index.
Seasonal PeriodMonths
AutumnMarch, April, May
WinterJune, July
Early springAugust, September
Late springOctober, November
SummerDecember, January, February
Table 3. Seasonal mean differences in metabolisable energy (MJ/kg DM) across three years between all diploid and tetraploid perennial ryegrass candidates at 4 trial sites in south-eastern Australia.
SeasonPloidyEllinbankElliottTimboonTongalaCombined Sites
AutumnDiploid10.9 a10.6 a10.5 a10.8 a10.6 a
Tetraploid11.0 b10.8 b10.7 b11.0 b10.8 b
lsd0.070.020.040.040.02
WinterDiploid11.5 a11.4 a11.4 a12.3 a11.6 a
Tetraploid11.6 b11.5 b11.6 b12.4 b11.8 b
lsd0.060.020.030.070.02
Early springDiploid11.3 a11.3 a11.3 a11.5 a11.3 a
Tetraploid11.5 b11.4 b11.5 b11.7 b11.5 b
lsd0.050.030.030.030.02
Late springDiploid11.0 a10.9 a11.2 a10.6 a10.9 a
Tetraploid11.1 b11.0 b11.4 b10.8 b11.1 b
lsd0.050.030.030.040.02
SummerDiploid9.5 a10.5 a10.5 a10.2 a10.2 a
Tetraploid9.6 a10.6 b10.7 b10.4 b10.3 b
lsd0.090.140.050.050.02
Different superscripts within a column and season indicate differences greater than the least significant difference (lsd) at a 5% level of significance.
Table 4. Seasonal mean differences in crude protein (% DM) across three years between all diploid and tetraploid perennial ryegrass candidates at 4 trial sites in south-eastern Australia.
SeasonPloidyEllinbankElliottTimboonTongalaCombined Sites
AutumnDiploid27.2 a21.7 a20.5 a18.0 a21.6 a
Tetraploid27.4 a21.5 a21.2 b17.8 a21.7 a
lsd0.330.280.290.250.15
WinterDiploid27.1 a21.9 a24.5 a20.2 a23.5 a
Tetraploid27.1 a21.6 a24.7 b19.9 a23.4 a
lsd0.410.350.320.530.21
Early springDiploid23.5 a16.0 a20.4 a15.2 a18.4 a
Tetraploid23.4 a15.5 b20.4 a15.4 a18.4 a
lsd0.350.350.270.280.16
Late springDiploid20.4 a15.9 a19.4 a15.8 a17.7 a
Tetraploid20.6 a15.4 b19.8 b15.9 a17.8 a
lsd0.270.260.210.220.13
SummerDiploid19.5 a18.0 a12.6 a17.4 a16.9 a
Tetraploid19.5 a17.5 b13.2 b16.8 b16.8 a
lsd0.300.260.270.230.14
Different superscripts within a column and season indicate differences greater than the least significant difference (lsd) at a 5% level of significance.
Table 5. Seasonal mean differences in neutral detergent fibre (% DM) across 3 years between all diploid and tetraploid perennial ryegrass candidates at 4 trial sites in south-eastern Australia.
SeasonPloidyEllinbankElliottTimboonTongalaCombined Sites
AutumnDiploid44.7 a50.9 a50.5 a46.9 a48.5 a
Tetraploid43.7 b49.6 b49.3 b45.2 b47.1 b
lsd0.460.240.460.390.18
WinterDiploid43.2 a44.9 a49.2 a37.7 a43.9 a
Tetraploid42.3 b43.6 b47.8 b34.3 b42.1 b
lsd0.540.280.410.730.23
Early springDiploid44.6 a45.3 a49.5 a41.9 a44.6 a
Tetraploid42.7 b44.0 b47.9 b40.0 b43.1 b
lsd0.440.280.340.360.16
Late springDiploid44.2 a45.9 a47.8 a48.8 a46.6 a
Tetraploid42.8 b44.4 b46.2 b47.1 b45.0 b
lsd0.390.280.370.370.17
SummerDiploid52.7 a49.3 a48.9 a49.6 a50.3 a
Tetraploid51.8 b48.0 b47.0 b48.5 b49.0 b
lsd0.640.240.600.390.21
Different superscripts within a column and season indicate differences greater than the least significant difference (lsd) at a 5% level of significance.
Publisher’s Note: MDPI stays neutral with regard to jurisdictional claims in published maps and institutional affiliations.

