
Heat Waves and Broomrape Are the Major Constraints for Lentil Cultivation in Southern Spain


1
Institute for Sustainable Agriculture, CSIC, Avda. Menéndez Pidal s/n, 14004 Córdoba, Spain
2
Departamento de Ciencias Agroforestales, ETSI Campus El Carmen, Universidad de Huelva, Avda. Fuerzas Armadas s/n, 21007 Huelva, Spain
*
Author to whom correspondence should be addressed.
Agronomy 2021, 11(9), 1871; https://doi.org/10.3390/agronomy11091871
Submission received: 12 August 2021
/
Revised: 10 September 2021
/
Accepted: 15 September 2021
/
Published: 17 September 2021
(This article belongs to the Special Issue Legumes Cultivars and Their Genetic Improvements)
Abstract
:There is potential for expanding lentil cultivation to dry and warm Mediterranean rain-fed environments at low altitudes, where early sowings are recommended to profit from winter rains and escape drought and excessive heat at the grain filling stage. In cooler areas, frost might be a problem in the early sowings, however, in warmer areas such as our low altitude warm southern Spanish environments the most detrimental factor on lentil seed yield appeared to be high temperatures at grain-filling stage, particularly heat waves of more than 5 days with Tmax > 30 °C. This was followed by broomrape infection, the combination of both being dramatic. We detected variation for stress tolerance, with S17 and R7 accessions outstanding for all stress indexes used, followed by S23, Nsir, S6, and S12. Broomrape infection ranked second risk in the area. No complete resistance to broomrape was identified, but there was a significant variation in the level of infection, with accessions S14 and R17 being the more resistant across environments. This offers prospects for combining heat tolerance and broomrape resistance by breeding.
1. Introduction
Lentil (Lens culinaris Medik.) is an annual temperate grain legume highly valued for food grown worldwide over 5 Mha [1]. Although lentil crop originated in the Middle East, the largest lentil producer today is Canada with circa 3 Mton, followed by India with 1 Mton. In spite of the high appreciation of the product in Western Asia and Mediterranean Basin, lentil cultivation is not sufficient to satisfy domestic demand, forcing to imports that in 2019 were of 980 Kton in Western Asia, 230 Kton in Northern Africa, and 104 Kton in Southern Europe [1]. There is therefore, sufficient domestic demand to increase lentil cultivation not only in all Mediterranean Basin and West Asia but in all Europe, which resulted in a true regained interest in the lentil crop.
Average world lentil yields (1200 kg/ha) are small due to biotic and abiotic constraints and to the fact that, generally, lentil is produced on marginal lands with low inputs. Understanding the adaptation constraints of diverse lentil genotypes in differing environments is needed to assist breeders in the expansion of the genetic diversity. Phenology is an important factor influencing adaptation in lentil, by matching the needs of the crop with the available resources and limitations of a particular environment [2]. In temperate environments, lentils are commonly planted in spring and grown during the summer under warm temperatures and long days. By contrast, in Mediterranean Basin and West Asia where winters are mild and summers are too hot and too dry, winter sowings are recommended to profit from winter rains and to avoid high temperatures [3]. However, early sown lentils could suffer from cold in some areas particularly in continental areas or even in Mediterranean ones at high altitudes, which made winter hardiness and frost tolerance the major objectives in lentil breeding [4,5,6].
In Spain, lentil cultivation is concentrated in central plains (Castilla-la-Mancha and Castilla-León), being low in Southern regions like Andalusia and Extremadura, characterized by higher temperatures and high incidence of the parasitic weed broomrape (Orobanche crenata Forsk.). Early sowings are known to favor broomrape infection, which is regarded a major limiting factor for lentil in Mediterranean basin [7]. In fact, broomrape has been suggested as the reason for abandonment of lentil cultivation in southern Spain [8]. In the lack of resistant cultivars and of economically viable chemical control, delaying the sowing date or the use of very early maturing cultivars have been the only recommended methods to escape from infection in broomrape-prone areas. However, in these areas, delayed sowings can expose the lentil to excessive temperatures at flowering, which can be very problematic, as lentil is particularly sensitive to high temperatures during the seed-filling stage [9,10]. Expansion of lentil crop in this area requires therefore a deeper understanding of environmental factors affecting yield and their interactions. The objective of the present experiment was to study the genotypic and environmental effects limiting yield in lentil grown in warm, low altitude, broomrape-prone Andalusian environments.
2. Materials and Methods
2.1. Plant Material and Experimental Design
Performance of 17 lentil accessions (Table 1) was studied at 13 location—year environments (Table 2). Accessions studied included 14 breeding lines derived from local selections made on ICARDA materials, the Spanish landrace Armuña, and the Tunisian cvs. Nefsa, and Nsir, all being Mediterranean types. At each location, a randomized complete block design with three replications was used. The experimental unit consisted of 1-m2 plots with three replications. Each plot consisting of three 1-m long rows, separated by 0.33 m, with 10 plants per row. Sowing took place by middle December each season, according to local practice. Weeds were controlled by hand weeding. Days to flowering (dtf) was estimated by weekly recording the date in which 50% of the plants of each plot had at least one fully opened flower. Number of emerged broomrape plants per row were recorded and referred as number of broomrapes per lentil plant (Oc/pl). Attention was paid to record presence and to quantify naturally occurring pests and disease. The harvest of the plants took place by late April, May, depending on the environment. Harvested plants were threshed and seed yields recorded.
2.2. Statistical Analysis
2.2.1. Variances Analyses
A combined ANOVA for randomized complete-block designs was carried out using SAS® 9.3 (SAS Institute Inc., Cary, NC, USA) for all traits. A mixed model procedure (PROC MIXED) was then fitted by considering genotype (G) as fixed effects; and environment (E), G × E and block as random effects using REML algorithm. Prior to each ANOVA, tests for normality and homogeneity of variance were conducted for each dependent variable. The normality was tested with the UNIVARIATE procedures which have the NORMAL option to produce four test of normality, whereas, with the statement “REPEATED/GROUP=;” option of PROC MIXED we tested for homogeneity of variance among the specified variables. In all cases there was a good fit to the normal distribution and to provide the evidence of acceptance of equality of variances.
2.2.2. HA-GGE Biplots
HA-GGE biplot takes into consideration any heterogeneity among environments by giving weights to the test environments proportional to their root square heritability and is therefore, appropriate for visual evaluation of the test environments and genotypes [11,12,13]. Analyses were made with the SAS® 9.3 (SAS Institute Inc., Cary, NC, USA) program developed by Burgueño et al. [14], to graph GGE biplots. The target environment axis is represented by a corresponding straight line drawn through the biplot origin and the Target Environment Axis abscissa (TEAa) defines the mean ordinates of all environments in the biplot. Genotypes located on the polygon vertices reveal the best or the poorest for a particular environment.
2.2.3. Non-Metric Multi-Dimensional Scaling Ordination (NMDS)
In order to assess their influence on grain yield, numbers of broomrapes per plant, days to flowering, and 11 climate variables were subjected to non-metric multi-dimensional scaling ordination (NMDS) [15]. These climate variables were obtained from the Andalusian Network of Agro-climatic Information [16], and included average maximum and minimum temperature, and accumulated rain during pre-flowering, at flowering and post-flowering period plus average maximum and minimum temperature in post-flowering stage and number of days with maximum temperature higher than 30 °C. To reduce the probability that the result of the NMDS analysis would reflect a local stress minimum rather than the overall minimum, we repeated the NMDS analysis 20 times, each time starting from a different random configuration, and selected the two-dimensional solution with the lowest stress. Analysis was made by PAST software (Version 4.07) [17].
2.2.4. Heat Tolerance Indices
Seven heat tolerance indices were calculated by the given formulae:
- Geometric mean productivity (GMP) = √(Ypi × Ysi) [18]
- Yield index (YI) = Ysi/Ys [19]
- Mean productivity (MP) = (Ypi + Ysi)/2 [20]
- Stress susceptibility index (SSI) = (1 − (Ysi/Ypi))/SI [21]
- Stress tolerance index (STI) = (Ypi × Ysi)/Y2 p [18]
- Harmonic mean (HARM) = 2 (Ypi × Ysi)/(Ypi + Ysi) [22]
- Heat tolerance index (HTI) = (Y2 si/Ypi) × (Yp/Y2 s) [23]
Ysi and Ypi are the mean grain yield of individual genotype in heat stress (HS) and non-HS conditions, respectively. SI is stress intensity, where SI = 1 − (Ys/Yp); Ys = total mean grain yield of all genotypes in HS condition; Yp = total mean grain yield of all genotypes in non HS condition. Tom-09 was selected as the harsh environment for heat (Ys), as it was free of broomrape, so yield penalty could be ascribed to high temperature. Esc-08 was selected as non-stress environment (Yp) as there was little broomrape and no heat damage.
3. Results
Combined analysis of variance on seed yield, broomrape infection, and date flowering from the 13 environments showed that the fixed effects, genotype (G), was significant (p < 0.0001; Table 3). The random effects environment (E), block(environment) (Block(E)) and genotype by environment interaction (G × E) were all also significant.
Average yield over accessions and environments was 445 kg/ha, with great differences across environments. Average yields were higher than 700 kg/ha (Table 4) at Cor-09, Esc-08 and Esc-09, whereas they were lower than 350 kg/ha at Cam-08, Cor-11, Cord-12, Esc-10, Tom-08, and Tom-09, confirming the high effects of the E and of G*E, higher than those of G on seed yield (Table 3). The accession performing better across environments was cv. Nsir with, average 770 kg/ha, ranging between 370 and 1854 kg/ha in different environments. These results are rather in line with the reported yield of this cv. in optimal conditions in Tunisia of circa 1500 kg/ha where long-term average seed yield of lentil is 600 Kg/ha [25]. Nsir was followed by lines S23, S17, S12, R7, and S6, with average yields over environments higher than 500 kg/ha, higher than the local check Armuña (average across environments 423 kg/ha). Average yields achieved are in line with the average regional yields of 825 kg/ha in Castilla-la-Mancha and 717 kg/ha in Andalusia [26].
In HA-GGE biplots, the further to the right to TEA0 axis is the accessions, the higher is the value for the trait; and the closer the accession is to TEAa the more stable is the trait. We can see therefore in Figure 1 that the accessions with higher average grain yield (more to the right: Nsir, S17, S23, Armuña, and S12) are however little stable over environments (far from TEAa). Nsir and Armuña appear to be more adapted to Córdoba environments, and S17 and S23 to Escacena and Tomejil, although with exceptions in some years, further complicating the interaction. S7, Nefza, and R14 are the accessions with more stable yield, although they are below the average.
There was a large variation in flowering date among the studied accessions, with dtf ranging from an average of 79 in the earliest R14 accession, to 113 in the latest Armuña (Table 5). Biplot analysis (Figure 2) shows how precocity of some accession is more influenced by the environment than others, with R4, S24, and R7 being more stable across environments (closer to TEAa) and others, either early (R14 and R17) or late (Armuña and Nsir) being more affected by the environment (further to TEAa).
The most significant biotic constraint recorded in some of the environments was broomrape (Table 6), with little or negligible incidence of any other pest or disease observed (data not shown). There was high variation on average broomrape infection over environments, with no infection at Campillo and Tomejil, but high at Córdoba and Escacena sites, with levels of infection affected by the year due to temperature and rain influence on infection. Like this, average infection over accessions at Córdoba was highest in 2011 (0.87 Oc/pl) and lowest in 2010 (0.11 Oc/pl). At Escacena, average infection over accessions was overall lower and more stable, being highest in 2013 (0.38 Oc/pl) and lowest in 2008 (0.09 Oc/pl). Overall infection of accessions across environments was rather high (0.26 Oc/pl) indicative of the high problem that broomrape represents in the area and of the limited resistance available in breeding lines. Still, accessions S14, R17, R7, R4, and S23 displayed an overall reduced infection (<0.2 Oc/pl), although could still be severely infected in very conducive environments such as Cor-11, with more than 0.4 Oc/pl.
Broomrape response of accessions over environments is further shown by HA-GGE biplot (Figure 3) in which accessions to the left of TEAo axis have lower broomrape infection, this being more stable as the closer they are to TEAa axis. Like this, accessions S14, R17, and R4 are the more resistant and stable, with R7 being also among the more resistant ones, but being more affected by the environment.
Correlations between traits and non-metric multi-dimensional scaling ordination (NMDS) (Table 7 and Figure 4) show that grain yield was little affected by precocity and negativity, but not significantly by broomrape infection. Temperature was the most influential parameter on grain yield, whereas rain had little effect. Mild temperatures at pre-flowering (higher Tmin) favored yield, whereas high temperatures at grain filling were detrimental. The number of days with Tmax > 30 °C during grain filling was the parameter with higher (negative) correlation (r2 = −0.72 **) with grain yield.
Table 8 shows the averages at each environment of the parameters more influential on yield. The lowest yields were achieved at the environments with more than 5 days with Tmax > 30 °C during grain filling (Cor-11, Cor-12, Esc-10, and Tom-09). If this happened in environments with high broomrape infection (Cor-11 and Cor-12), then the consequences were catastrophic.
The stress value for NMDS was low (0.051), indicative a good fit for this kind of analysis (i.e., little distortion between the original data and the scaling axes). NMDS Coordinate 1 showed a separation of environments for its yield with lowest at the positive end, and highest ones, at the negative end (Figure 5). NMDS analysis confirmed the results of the correlation table, showing number of days with Tmax > 30 °C and Tave at grain filling were the climatic factors more detrimental to grain yield (longer green vectors to the right). Broomrape infection also had a detrimental effect on yield. On the contrary, mild temperatures before and during flowering (higher Tmin and Taver) favored yield although the effect was smaller, as shown by the smaller length of the vectors. Rain had little effect.
Table 9 shows the grain yield at this no stress (Esc-08) and heat stressed (Tom-09) environments and the calculated heat tolerance indices. According to the authors proposing the various indexes, desirable accessions would be those with higher value for MP, GMP, HARM, YI, and STI indices, and low for SSI, indicative of heat sensitivity.
In order to determine the desirable selection indices for stress tolerance, correlation coefficient among all indices were calculated (Table 10). There was positive and high significant correlation between Ys and Yp (r = 0.83 ***), suggesting that a high potential yield under optimum condition results in high yield also under stress condition. High and significant positive correlation of grain yield (Yp) under normal condition and Ys under heat stress with all other indices viz., HARM, MP, STI, YI, HTI, and GMP were recorded, which ranged from 0.70 to 0.99 (Table 10), except SSI which exhibited a significant negative correlation with Ys. The significant and positive correlation of Yp and HARM, MP, STI, YI, HTI, and GMP indices showed that these criteria were more effective in identifying high-yielding cultivars under different stress conditions. The low correlation coefficients of Ys and Yp with SSI (−0.49 * and 0.05, respectively) indicates that any of the other indices studied (HARM, MP, STI, YI, HTI, and GMP) were better predictor of Yp and Ys than SSI.
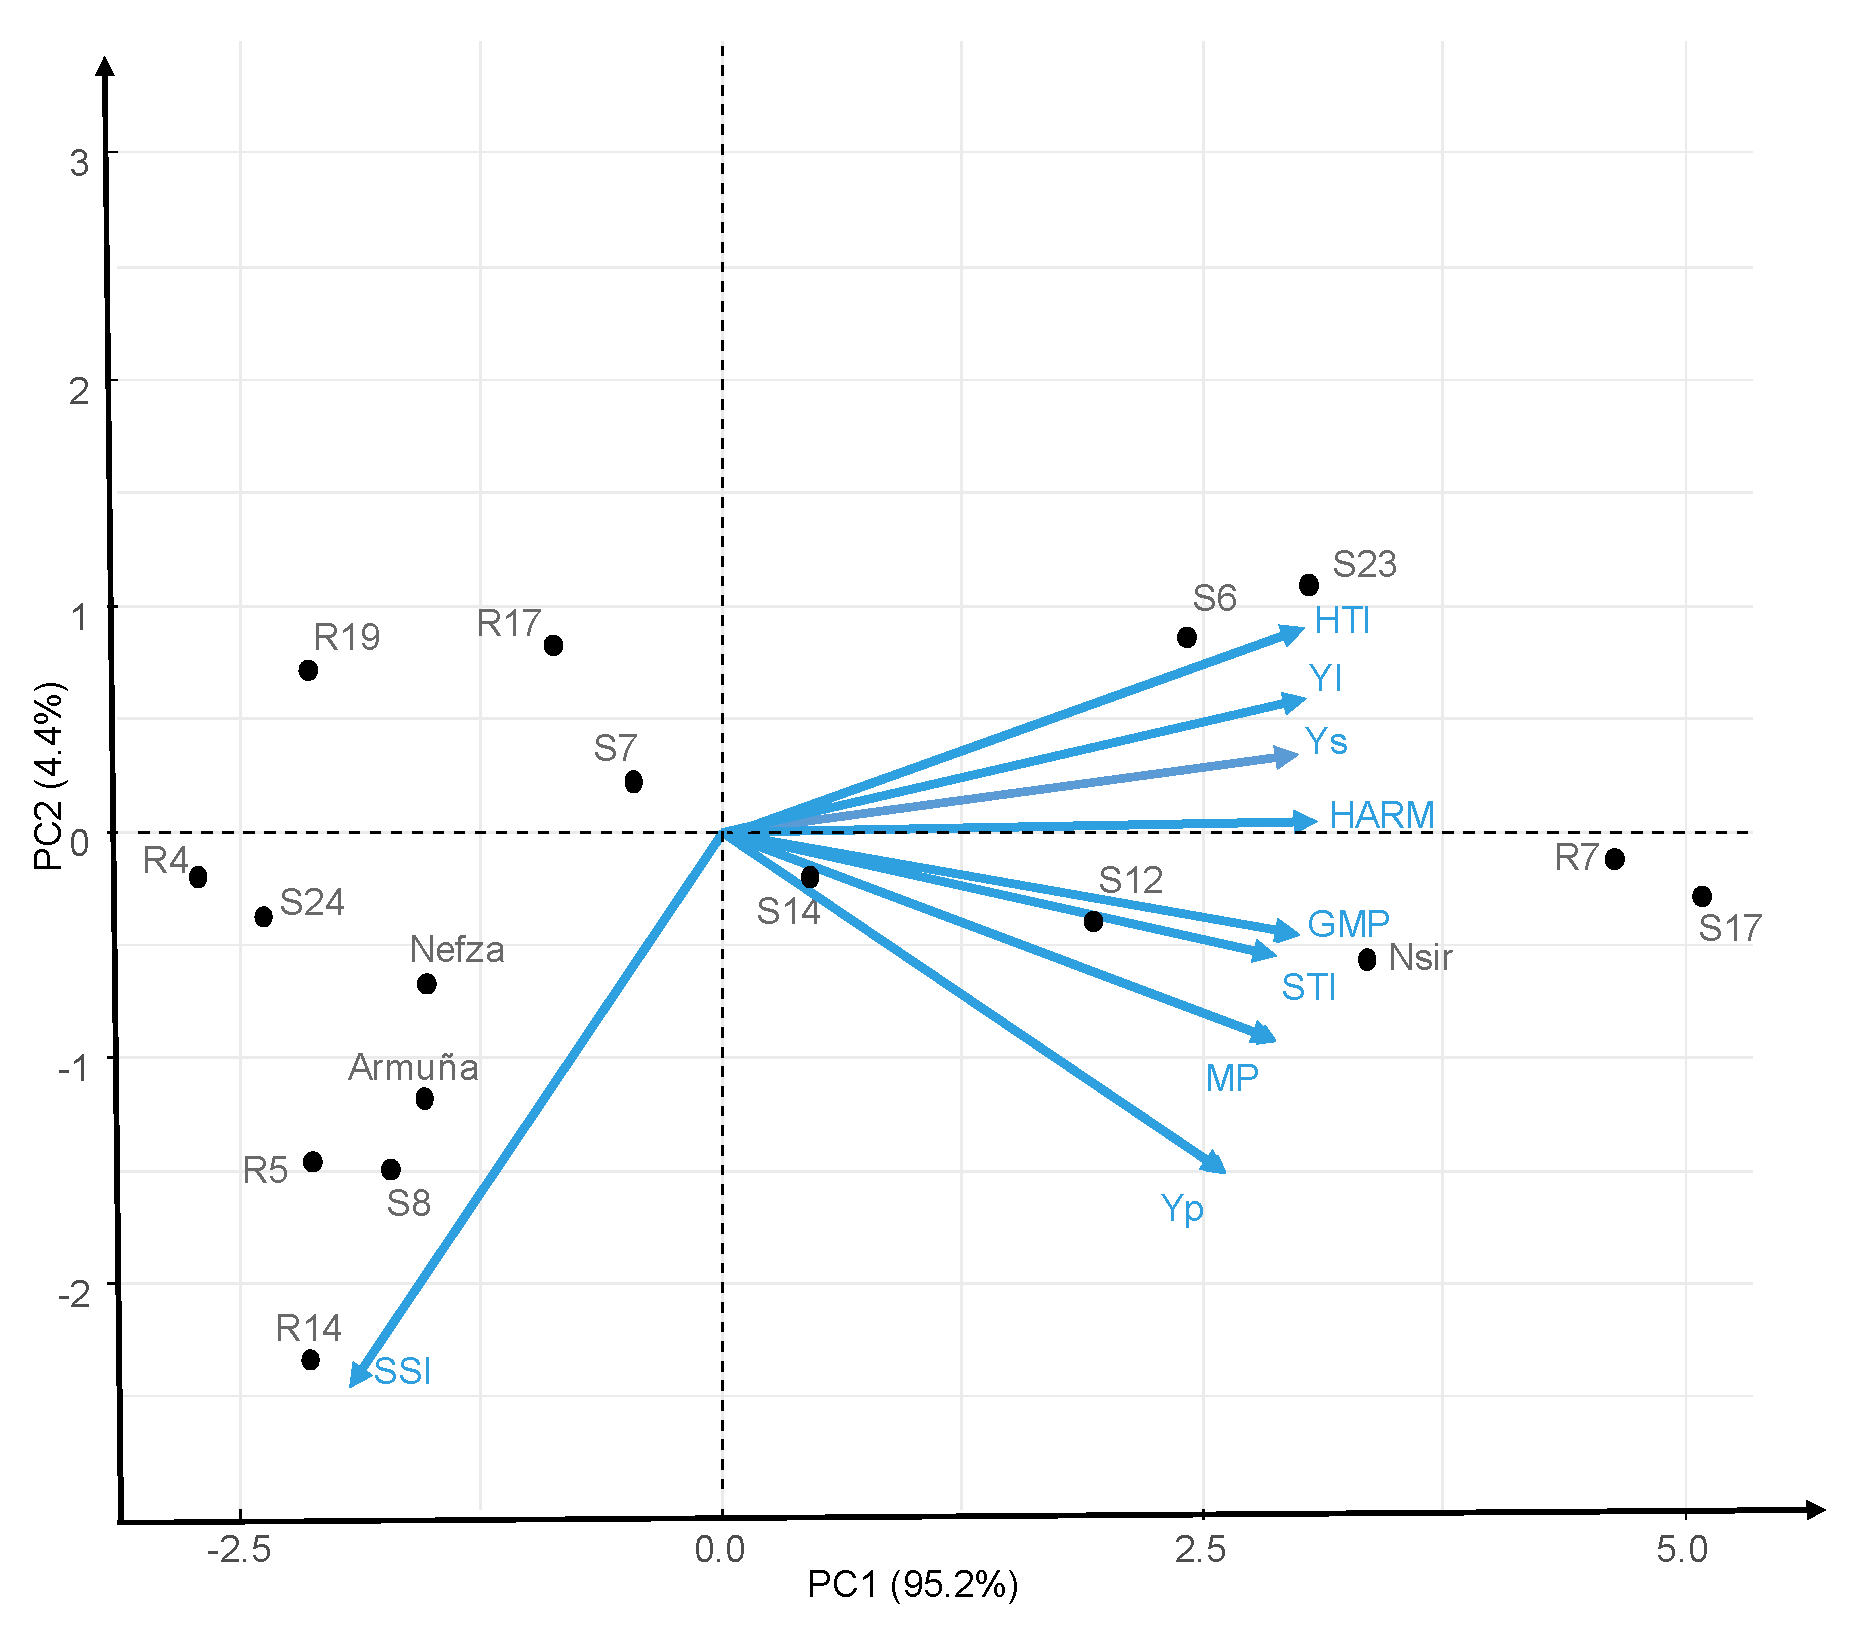
Different indices gave different values, but the general picture did not change, with a number of accessions (S17, R7, Nsir, S23, S12, and S6) at the top of the rankings for any index, and others at the bottom (R5, R19, S24, and R4). As no single index is perfect we performed a biplot of principal component analysis (PCA). The relationship among the genotypes and heat tolerance indices, are graphically depicted by PCA analysis. The PCA reduced all the indices into two components. Principal component analysis biplot of Ys, Yp and heat indices (Figure 6) revealed the correlation coefficient among them [27]. The first component (PC1) explained 95.2% of the total variation, being positively correlated with Ys, Yp, MP, GMP, HARM, STI, YI, and HTI (Figure 6). The second component (PC2) explained 4.4% of the total variation and correlated negatively with SSI (stress susceptibility index). In summary, biplot graph (Figure 6) confirmed correlation analysis (Table 10). Accessions with high positive PC1 (S17, R7, Nsir, S23, S12, S6, and S14) are the more productive both under stress and non-stress conditions (Figure 6).
4. Discussions
Winter sowings are expected to provide greater yield potential than spring sowings in dry and warm areas by taking advantage of winter rains and escaping drought and excessive heat at late spring. Lentil is known to be highly sensitive to high temperatures at the grain-filling stage when exposure to heat shock for several days affects many physiological processes leading to substantial yield losses [9,28,29,30,31] which can be avoided by early sowings. Although early sown lentils could suffer from cold in some areas [3,4,5,6], this is not the case in the area of study where winters are very mild and we did not observe a significant effect of low temperatures at any plant stage on seed yield. On the contrary, our results show that even at December sowings, high temperature at grain-filling stage was the factor most detrimental on grain yield. This was followed by broomrape infection, with precocity and rain having little effect. Tolerance to heat stress appears therefore as a top lentil breeding priority for the region, as it seems to be in other areas for spring-sown lentils [3,9,28,29,30,31,32]. The most critical period for lentil yield has been established between 50 and 126 degree days after flowering, at the time of pod formation [33]. Site-specific combinations of sowing date and phenology are necessary to reduce the likelihood of excessive heat to coincide with this critical period.
Some variation in response to heat stress appears to be available as assessed by a number of indexes [29]. These indexes have been mainly used to identify tolerance against abiotic stresses in a number of crops [34]. Our results confirm variation for stress tolerance index with S17 and R7 accessions outstanding for all indices used, followed by S23, Nsir, S6, and S12. High correlation was observed among indices, in agreement with previous reports on tolerance to high temperature [34,35] or to drought [36,37]. Although heat stress tolerance is a complex trait, significant progress is being achieved in deciphering the genetics and pathways underlying the heat stress tolerance in lentil [38,39,40].
Early sowings are known to increase the risk of broomrape infection [41,42,43,44] that is acknowledged as a major constraint for most legume crops in the Mediterranean basin [45]. Our results confirm this risk, but ranking second after the one of scenarios of excessive temperatures at grain filling. The use of very early maturing cultivars has been suggested to escape O. crenata in several legumes as precocity use to be correlated with reduced infection [46,47]. This could also help to escape from high temperatures. However, we did not find such correlation in the lentil germplasm studied, which is in agreement with a previous field study [48]. No complete resistance to broomrape was identified, but there was a significant variation in the level of infection, with accessions S14 and R17 being the more resistant across environments, which might be further exploited in breeding.
We conclude that the lentil has potential for reintroduction into rain-fed farming systems in Mediterranean Basin, but expanding cultivation to warmer areas requires specific breeding. Contrary to traditional lentil cultivation areas where frost can be a problem in early sowings, high temperatures during grain filling and broomrape infection appear as the two most serious constraints in Southern Spain, the combination of both being dramatic. There is variation for tolerance to both stresses, offering potential for breeding.
Author Contributions
D.R. and A.M. designed and performed the trials; D.R. and F.F. analyzed the data and wrote the manuscript. All authors have read and agreed to the published version of the manuscript.
Funding
This research was funded by the Junta de Andalucía grant P20_00986 and to Agencia Española de Investigación (AEI) grant PID2020-11468RB-100.
Acknowledgments
Authors are deeply indebted to ICARDA for providing nurseries from which the studied accessions were selected.
Conflicts of Interest
The authors declare no conflict of interest.
References
- FAOSTAT 2021. Available online: http://www.fao.org/faostat (accessed on 4 July 2021).
- Wright, D.M.; Neupane, S.; Heidecker, T.; Haile, T.A.; Chan, C.; Coyne, C.J.; McGee, R.J.; Udupa, S.; Henkrar, F.; Barilli, E.; et al. Understanding photothermal interactions will help expand production range and increase genetic diversity of lentil (Lens culinaris Medik.). Plants People Planet 2021, 3, 171–181. [Google Scholar] [CrossRef]
- Erskine, W.; Tufail, M.; Russell, A.; Tyagi, M.C.; Rahman, M.M.; Saxena, M.C. Current and future strategies in breeding lentil for resistance to biotic and abiotic stresses. Euphytica 1994, 73, 127–135. [Google Scholar] [CrossRef]
- Ali, A.; Johnson, D.L.; Stushnoff, C. Screening lentil (Lens culinaris) for cold hardiness under controlled conditions. J. Agric. Sci. 1999, 133, 313–319. [Google Scholar] [CrossRef]
- Muehlbauer, F.J.; Cho, S.; Sarker, A.; McPhee, K.E.; Coyne, C.J.; Rajesh, P.N.; Rebecca, R. Application of biotechnology in breeding lentil for resistance to biotic and abiotic stress. Euphytica 2006, 147, 149–165. [Google Scholar] [CrossRef]
- Sellami, M.H.; Pulvento, C.; Lavini, A. Selection of Suitable Genotypes of Lentil (Lens culinaris Medik.) under Rainfed Conditions in South Italy Using Multi-Trait Stability Index (MTSI). Agronomy 2021, 11, 1807. [Google Scholar] [CrossRef]
- Rubiales, D.; Fernández-Aparicio, M.; Haddar, A. Parasitic plants. In The Lentil: Botany, Production and Uses; Erskine, W., Muehlbauer, F.J., Sarker, A., Sharma, B., Eds.; CABI: Wallingfore, UK, 2009; pp. 343–349. ISBN 978-1-84593-487-3. [Google Scholar]
- Beniwal, S.P.S.; Bayaa, B.; Weigand, S.; Makkouk, K.H.; Saxena, M.C. Field Guide for Lentil Diseases and Insect Pests; ICARDA: Aleppo, Syria, 1993. [Google Scholar]
- Bhandari, K.; Siddique, K.H.; Turner, N.C.; Kaur, J.; Singh, S.; Agrawal, S.K.; Nayyar, H. Heat stress at reproductive stage disrupts leaf carbohydrate metabolism, impairs reproductive function, and severely reduces seed yield in lentil. J. Crop Improv. 2016, 30, 118–151. [Google Scholar] [CrossRef]
- Sehgal, A.; Sita, K.; Kumar, J.; Kumar, S.; Singh, S.; Siddique, K.H.; Nayyar, H. Effects of drought, heat and their interaction on the growth, yield and photosynthetic function of lentil (Lens culinaris Medikus) genotypes varying in heat and drought sensitivity. Front. Plant Sci. 2017, 8, 1176. [Google Scholar] [CrossRef] [PubMed] [Green Version]
- Yan, W.K.; Holland, J.B. A heritability-adjusted GGE biplot for test environment evaluation. Euphytica 2010, 171, 355–369. [Google Scholar] [CrossRef] [Green Version]
- Aznar-Fernández, T.; Carrillo-Perdomo, E.; Flores, F.; Rubiales, D. Identification and multi-environment validation of resistance to pea weevil (Bruchus pisorum) in Pisum germplasm. J. Pest Sci. 2018, 91, 205–214. [Google Scholar] [CrossRef]
- Rubiales, D.; Emeran, A.A.; Flores, F. Adaptation of grass pea (Lathyrus sativus) to Mediterranean environments. Agronomy 2020, 10, 1295. [Google Scholar] [CrossRef]
- Burgueño, J.; Crossa, J.; Vargas, M. SAS Programs for Graphing GE and GGE Biplots; CIMMYT: El Batan, Mexico, 2003. [Google Scholar]
- Kruskal, J.B. Multidimensional scaling by optimizing goodness of fit to a nonmetric hypothesis. Psychometrika 1964, 29, 1–27. [Google Scholar] [CrossRef]
- Red de Información Agroclimática de Andalucía (RIA). Available online: https://www.juntadeandalucia.es/agriculturaypesca/ifapa/ria/servlet/FrontController (accessed on 7 August 2021).
- Hammer, Ø.; Harper, D.A.T.; Ryan, P.D. PAST: Paleontological statistics software package for education and data analysis. Palaeontol. Electron. 2001, 4, 9. [Google Scholar]
- Fernandez, G.C. Effective Selection Criteria for Assessing Plant Stress Tolerance. In Proceedings of the International Symposium on Adaptation of Vegetables and other Food Crops in Temperature and Water Stress, Shanhua, Taiwan, 13–16 August 1992; pp. 257–270. [Google Scholar]
- Gavuzzi, P.; Rizz, F.; Palumbo, M.; Campaline, R.G.; Ricciardi, G.L.; Borghi, B. Evaluation of field and laboratory predictors of drought and heat tolerance in winter cereals. Can. J. Plant Sci. 1997, 77, 523–531. [Google Scholar] [CrossRef]
- Rosielle, A.A.; Hamblin, J. Theoretical aspects of selection for yield in stress and non-stress environment. Crop Sci. 1981, 21, 943–946. [Google Scholar] [CrossRef]
- Fischer, R.A.; Maurer, R. Drought resistance in spring wheat cultivars, I. Grain yield response. Austr. J. Agric. Res. 1978, 29, 897–912. [Google Scholar] [CrossRef]
- Schneider, K.A.; Rosales-Serna, R.; Ibarra-Perez, F.; Cazares-Enriquez, B.; Acosta-Gallegos, J.A.; Ramirez-Vallejo, P.; Wassimi, N.; Kelly, J.D. Improving common bean performance under drought stress. Crop Sci. 1997, 37, 43–50. [Google Scholar] [CrossRef]
- Li, Q.; Wang, Z.R.; Li, D.; Wei, J.W.; Qiao, W.C.; Meng, X.H.; Sun, S.L.; Li, H.M.; Zhao, M.H.; Chen, X.M.; et al. Evaluation of a new method for quantification of heat tolerance in different wheat cultivars. J. Integr. Agric. 2018, 17, 786–795. [Google Scholar] [CrossRef] [Green Version]
- Poarch, T.G. Application of stress indices for heat tolerance screening of common bean. J. Agron. Crop Sci. 2006, 192, 390–394. [Google Scholar] [CrossRef]
- Ouji, A.; Sayar, R.; Mouelhi, M.; Amri, M.; Bouhadida, M.; Omri, N.; Abbes, Z.; Ben Salah, H.; Halila, M.H.; Kumar, S.; et al. Advances in lentil (Lens culinaris L.) breeding in Tunisia. In Proceedings of the International Conference on Pulses, Marrakesh, Morocco, 18–20 April 2016; p. 76. [Google Scholar]
- MAPA. 2021. Available online: https://www.mapa.gob.es/en/ (accessed on 13 June 2021).
- Yan, W.; Rajcan, I. Biplot analysis of test sites and trait relations of soybean in Ontario. Crop Sci. 2002, 42, 11–20. [Google Scholar] [CrossRef]
- Barghi, S.S.; Mostafaii, H.; Peighami, F.; Zakaria, R.A. Path analysis of yield and its components in lentil under end season heat condition. Int. J. Agric. Res. 2012, 2, 969–974. [Google Scholar]
- El Haddad, N.; Rajendran, K.; Smouni, A.; Es-Safi, N.E.; Benbrahim, N.; Mentag, R.; Nayyar, H.; Maalouf, F.; Kumar, S. Screening the FIGS Set of Lentil (Lens culinaris Medikus) Germplasm for Tolerance to Terminal Heat and Combined Drought-Heat Stress. Agronomy 2020, 10, 1036. [Google Scholar] [CrossRef]
- Choukri, H.; Hejjaoui, K.; El-Baouchi, A.; El Haddad, N.; Smouni, A.; Maalouf, F.; Thavarajah, D.; Kumar, S. Heat and drought stress impact on phenology, grain yield, and nutritional quality of lentil (Lens culinaris Medikus). Front. Nutr. 2020, 7, 596307. [Google Scholar] [CrossRef]
- Delahunty, A.; Nuttall, J.; Nicolas, M.; Brand, J. Response of lentil to high temperature under variable water supply and carbon dioxide enrichment. Crop Pasture Sci. 2018, 69, 1103–1112. [Google Scholar] [CrossRef]
- Kumar, J.; Sen Gupta, D.; Djalovic, I. Breeding, genetics, and genomics for tolerance against terminal heat in lentil: Current status and future directions. Legume Sci. 2020, 2, e38. [Google Scholar] [CrossRef] [Green Version]
- Lake, L.; Kutchartt, D.G.; Calderini, D.F.; Sadras, V.O. Critical developmental period for grain yield and grain protein concentration in lentil. Field Crops Res. 2021, 270, 108203. [Google Scholar] [CrossRef]
- Choudhury, D.R.; Tarafdar, S.; Das, M.; Kundagrami, S. Screening lentil (Lens culinaris Medik.) germplasms for heat tolerance. Trends Biosci. 2012, 5, 143–146. [Google Scholar]
- Kumar, J.; Kant, R.; Kumar, S.; Basu, P.S.; Sarker, A.; Singh, N.P. Heat tolerance in lentil under field conditions. Legume Genom. Genet. 2016, 7, 1–11. [Google Scholar]
- Chakherchaman, A.; Mostafaei, S.H.; Imanparast, L.; Eivazian, M.R. Evaluation of drought tolerance in lentil advanced genotypes in Ardabil region, Iran. J. Food Agric. Environ. 2009, 7, 283–288. [Google Scholar]
- Siahsar, B.A.; Ganjali, S.; Allahdoo, M. Evaluation of drought tolerance indices and their relationship with grain yield of lentil lines in drought-stressed and irrigated environments. Austr. J. Basic Appl. Sci. 2010, 4, 4336–4346. [Google Scholar]
- Singh, D.; Singh, C.K.; Singh, T.; Pal, M. Genetics and molecular mapping of heat tolerance for seedling survival and pod set in lentil. Crop Sci. 2017, 57, 3059–3067. [Google Scholar] [CrossRef]
- Sita, K.; Sehgal, A.; Kumar, J.; Kumar, S.; Singh, S.; Siddique, K.H.; Nayyar, H. Identification of high-temperature tolerant lentil (Lens culinaris Medik.) genotypes through leaf and pollen traits. Front. Plant Sci. 2017, 8, 744. [Google Scholar] [CrossRef] [PubMed] [Green Version]
- Kumar, J.; Basu, P.S.; Gupta, S.; Dubey, S.; Gupta, D.S.; Singh, N.P. Physiological and molecular characterisation for high temperature stress in Lens culinaris. Funct. Plant Biol. 2018, 45, 474–487. [Google Scholar] [CrossRef] [PubMed]
- Silim, S.N.; Saxena, M.C.; Erskine, W. Effect of sowing date on the growth and yield of lentil in a rainfed Mediterranean environment. Expl. Agric. 1991, 27, 145–154. [Google Scholar] [CrossRef] [Green Version]
- Rubiales, D.; Alcántara, C.; Pérez-de-Luque, A.; Gil, J.; Sillero, J.C. Infection of chickpea (Cicer arietinum) by crenate broomrape (Orobanche crenata) as influenced by sowing date and weather conditions. Agronomie 2003, 23, 359–362. [Google Scholar] [CrossRef]
- Pérez-de-Luque, A.; Sillero, J.C.; Moral, A.; Cubero, J.I.; Rubiales, D. Effect of sowing date and host resistance on the establishment of Orobanche crenata in faba bean and common vetch. Weed Res. 2004, 44, 282–288. [Google Scholar] [CrossRef]
- Pérez-de-Luque, A.; Flores, F.; Rubiales, D. Differences in crenate broomrape parasitism dynamics on three legume crops using a Thermal Time Model. Front. Plant Sci. 2016, 7, 1910. [Google Scholar] [CrossRef] [Green Version]
- Rubiales, D.; Fernández-Aparicio, M. Innovations in parasitic weeds management in legume crops. A review. Agron. Sustain. Devel. 2012, 32, 433–449. [Google Scholar] [CrossRef]
- Grenz, J.H.; Manschadi, A.M.; Uygur, F.N.; Sauerborn, J. Effects of environment and sowing date on the competition between faba bean (Vicia faba) and the parasitic weed Orobanche crenata. Field Crop Res. 2005, 93, 300–313. [Google Scholar] [CrossRef]
- Rubiales, D.; Barilli, E.; Flores, F. Broomrape (Orobanche crenata) as a major constraint for grass pea (Lathyrus sativus) production in Mediterranean rain-fed environments. Agronomy 2020, 10, 1931. [Google Scholar] [CrossRef]
- Fernández-Aparicio, M.; Sillero, J.C.; Pérez-de-Luque, A.; Rubiales, D. Identification of sources of resistance to crenate broomrape (Orobanche crenata) in Spanish lentil (Lens culinaris) germplasm. Weed Res. 2008, 48, 85–94. [Google Scholar] [CrossRef]
Figure 1.
HA-GGE biplot based on the seed yield (kg/ha) of 17 lentil accessions grown at 13 field-year environments, from 2008 to 2013.
Figure 1.
HA-GGE biplot based on the seed yield (kg/ha) of 17 lentil accessions grown at 13 field-year environments, from 2008 to 2013.
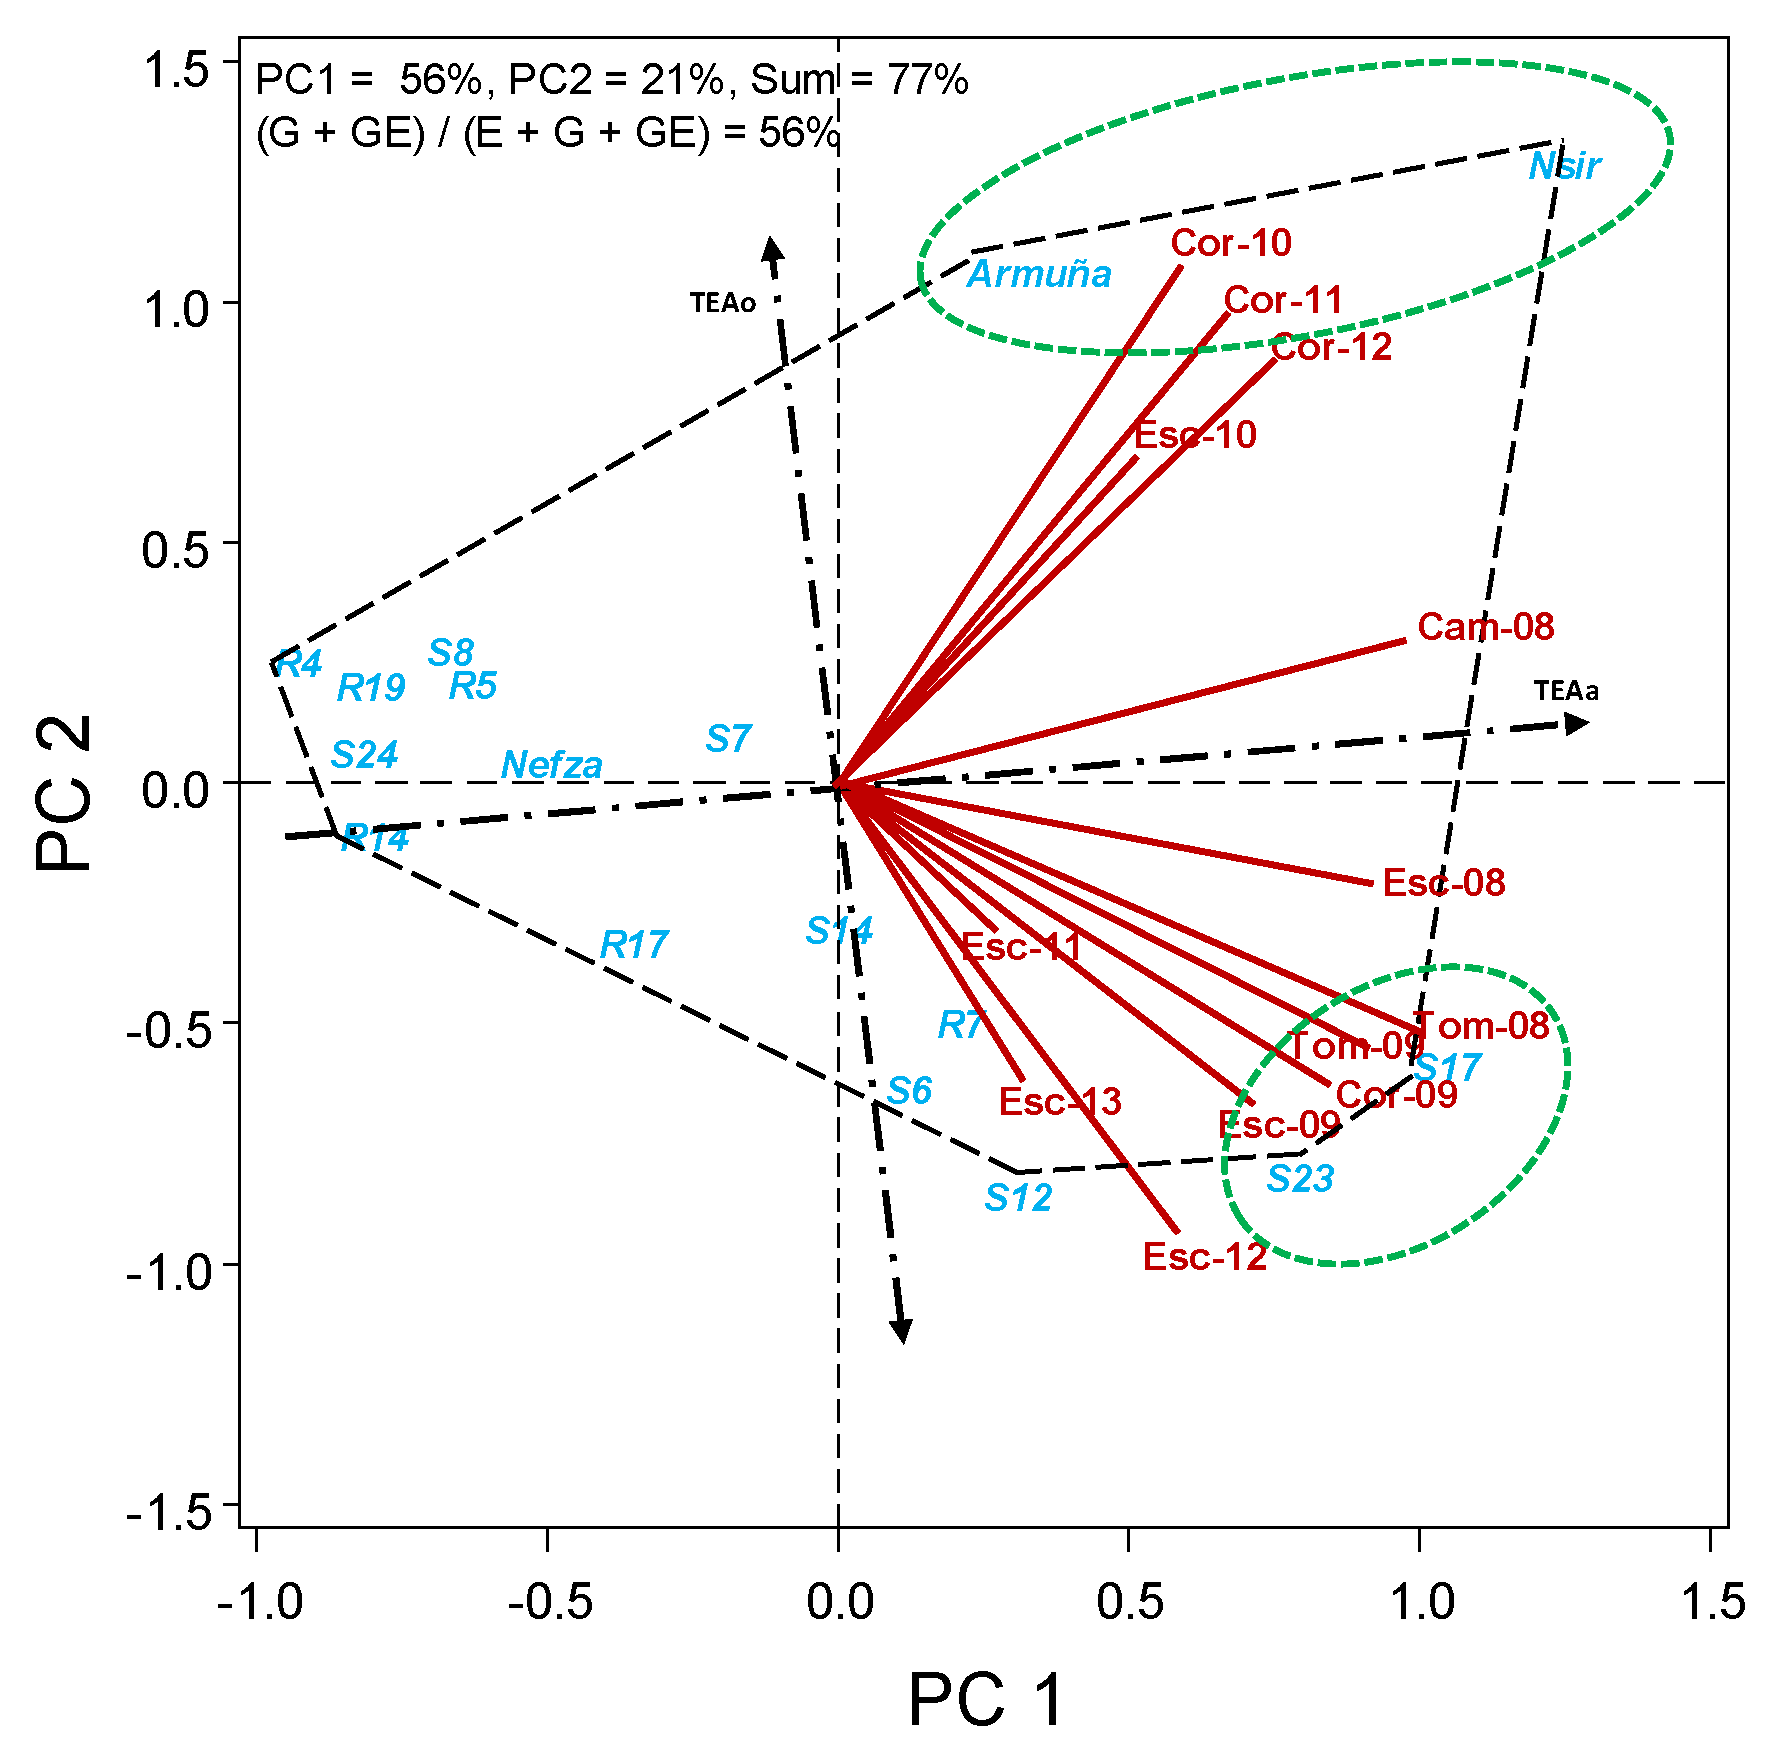
Figure 2.
HA-GGE biplot based on days to flowering (dtf) of 17 lentil accessions grown at 10 field–year environments, from 2009 to 2013.
Figure 2.
HA-GGE biplot based on days to flowering (dtf) of 17 lentil accessions grown at 10 field–year environments, from 2009 to 2013.

Figure 3.
HA-GGE biplot based on the number of broomrape per plant of 14 lentil accessions and 3 elite cultivars grown at 13 field-year environments, from 2008 to 2013.
Figure 3.
HA-GGE biplot based on the number of broomrape per plant of 14 lentil accessions and 3 elite cultivars grown at 13 field-year environments, from 2008 to 2013.
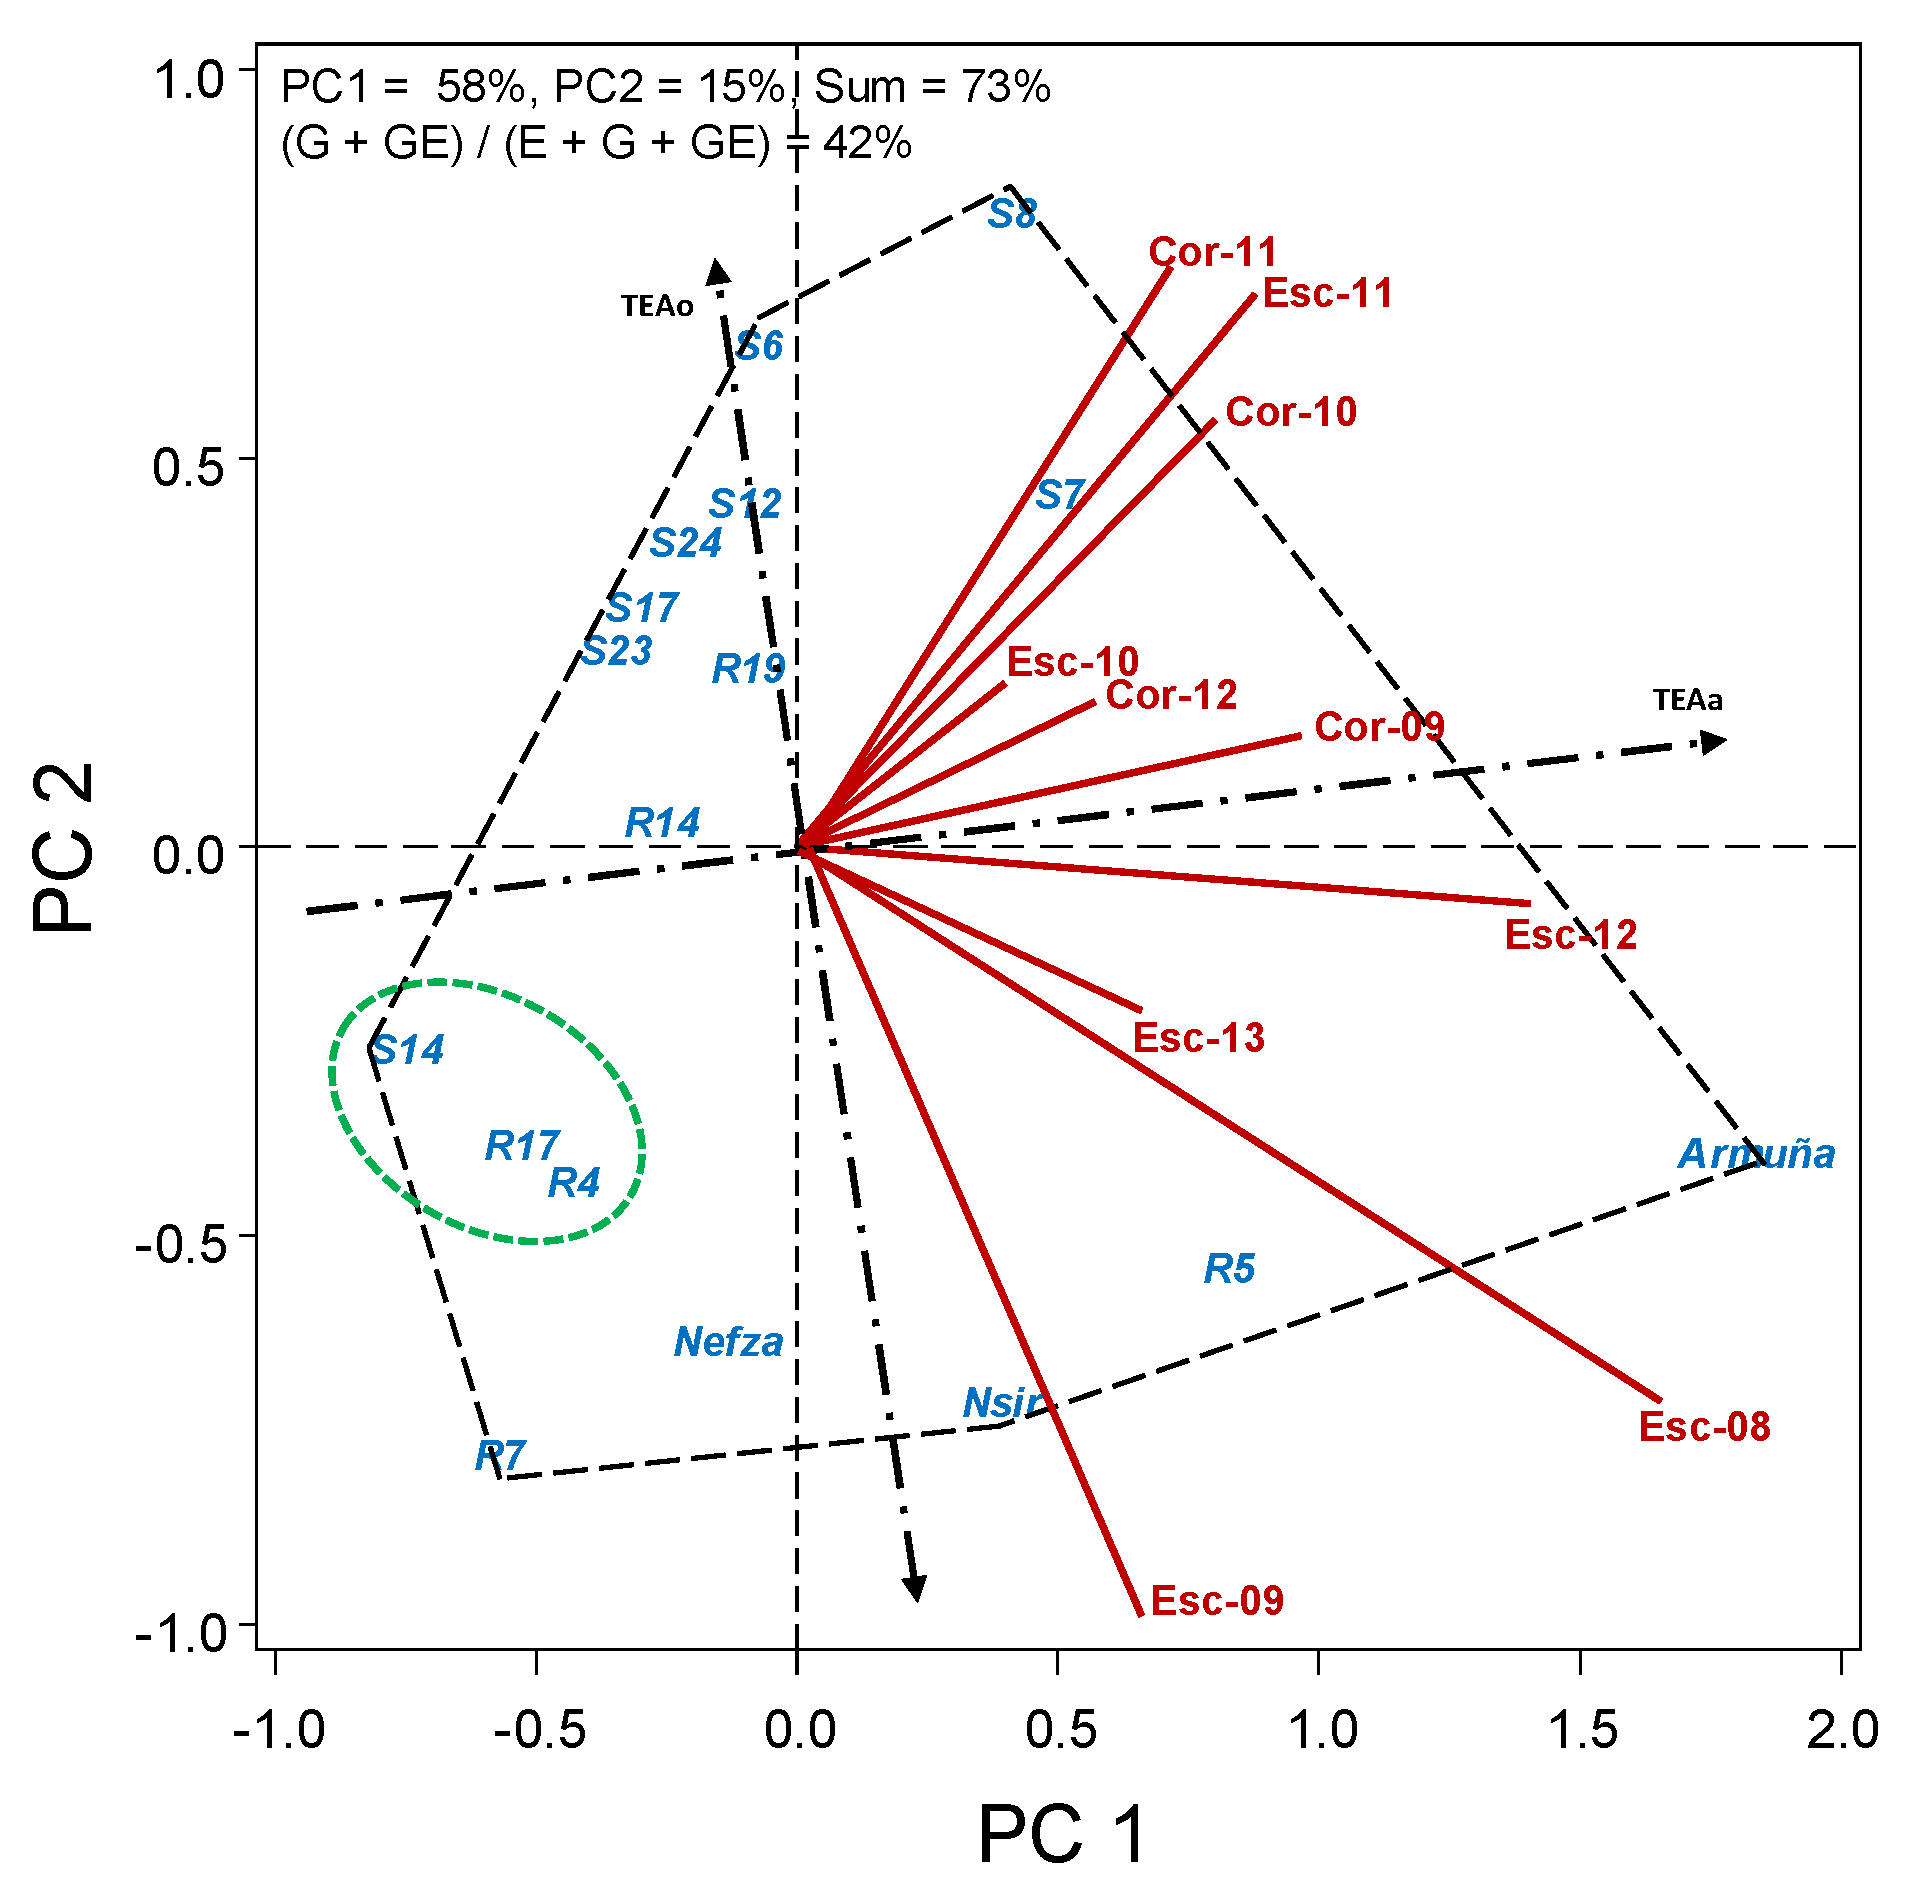
Figure 4.
Graphical representation of the effects of climatic parameters on flowering date, broomrape infection, and grain yield. Size of the dot indicates its effect on the trait, blue when positive, red when negative. Only encircled ones are statistically significant.
Figure 4.
Graphical representation of the effects of climatic parameters on flowering date, broomrape infection, and grain yield. Size of the dot indicates its effect on the trait, blue when positive, red when negative. Only encircled ones are statistically significant.
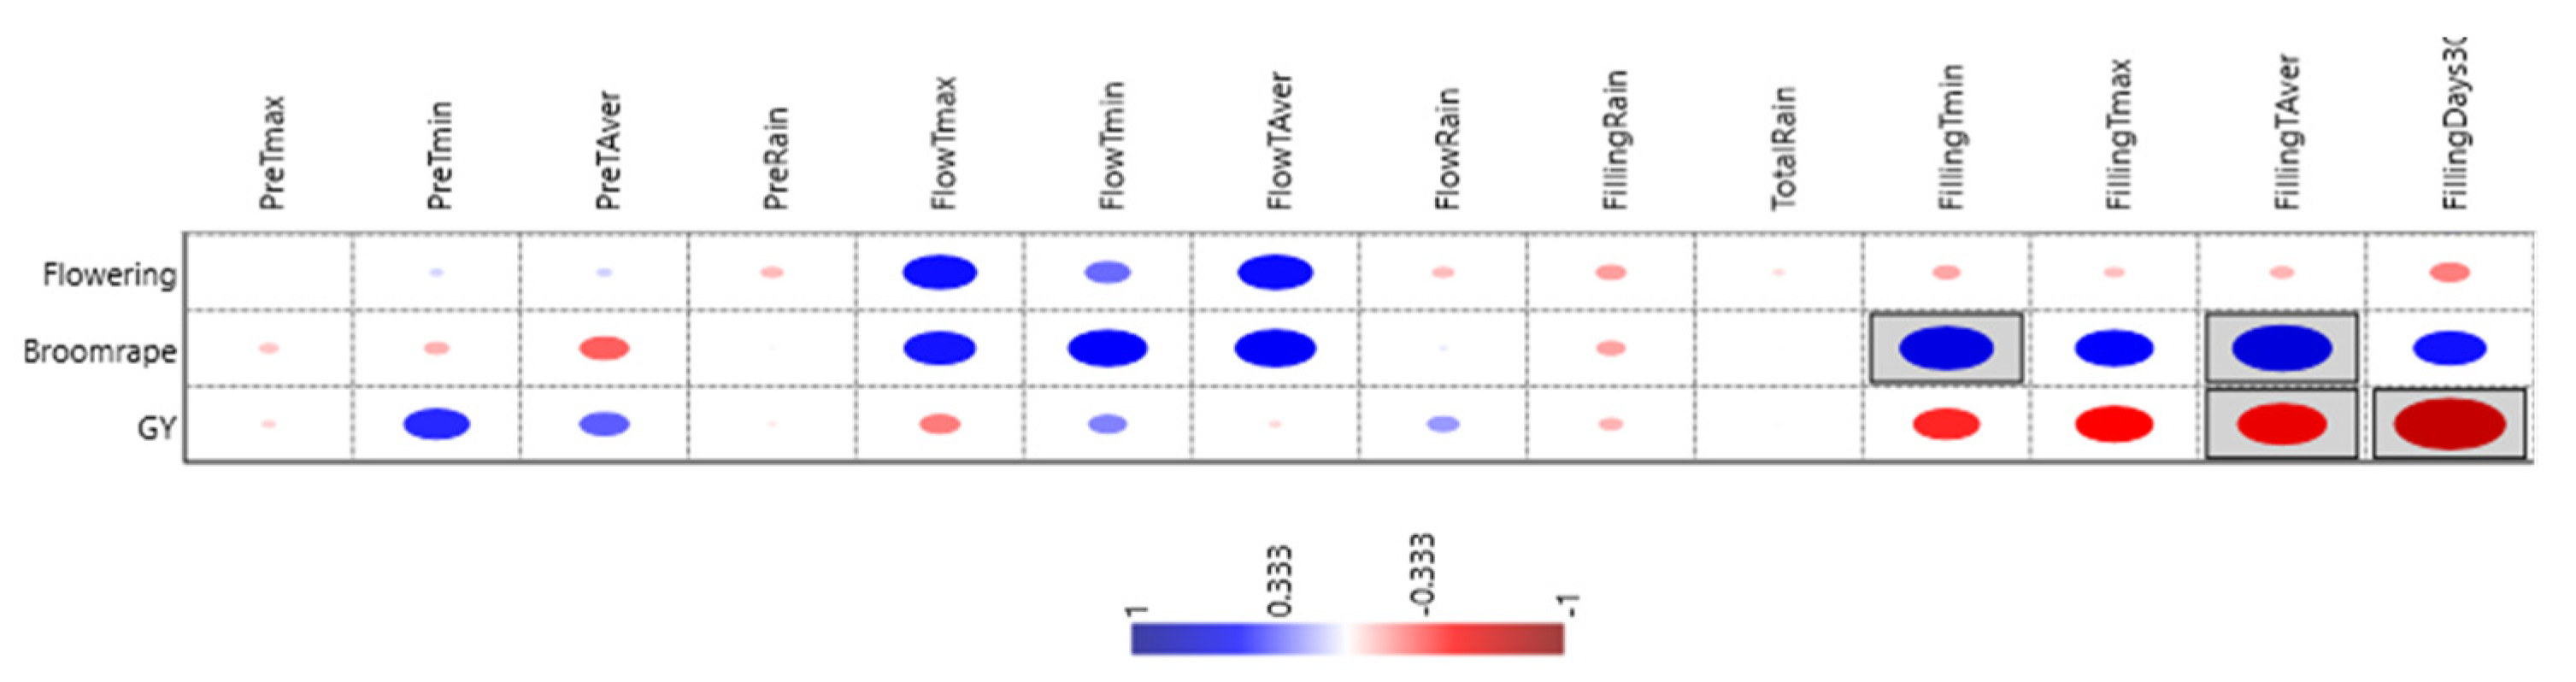
Figure 5.
NMDS combined analysis of climate variables including: maximum temperature (Tmax), minimum temperature (Tmin) and rain during different growing stages [pre-flowering (Pre), flowering (Flow), grain filling (Filling)], and number of days with Tmax > 30 °C at grain filling and traits assessed on grain yield.
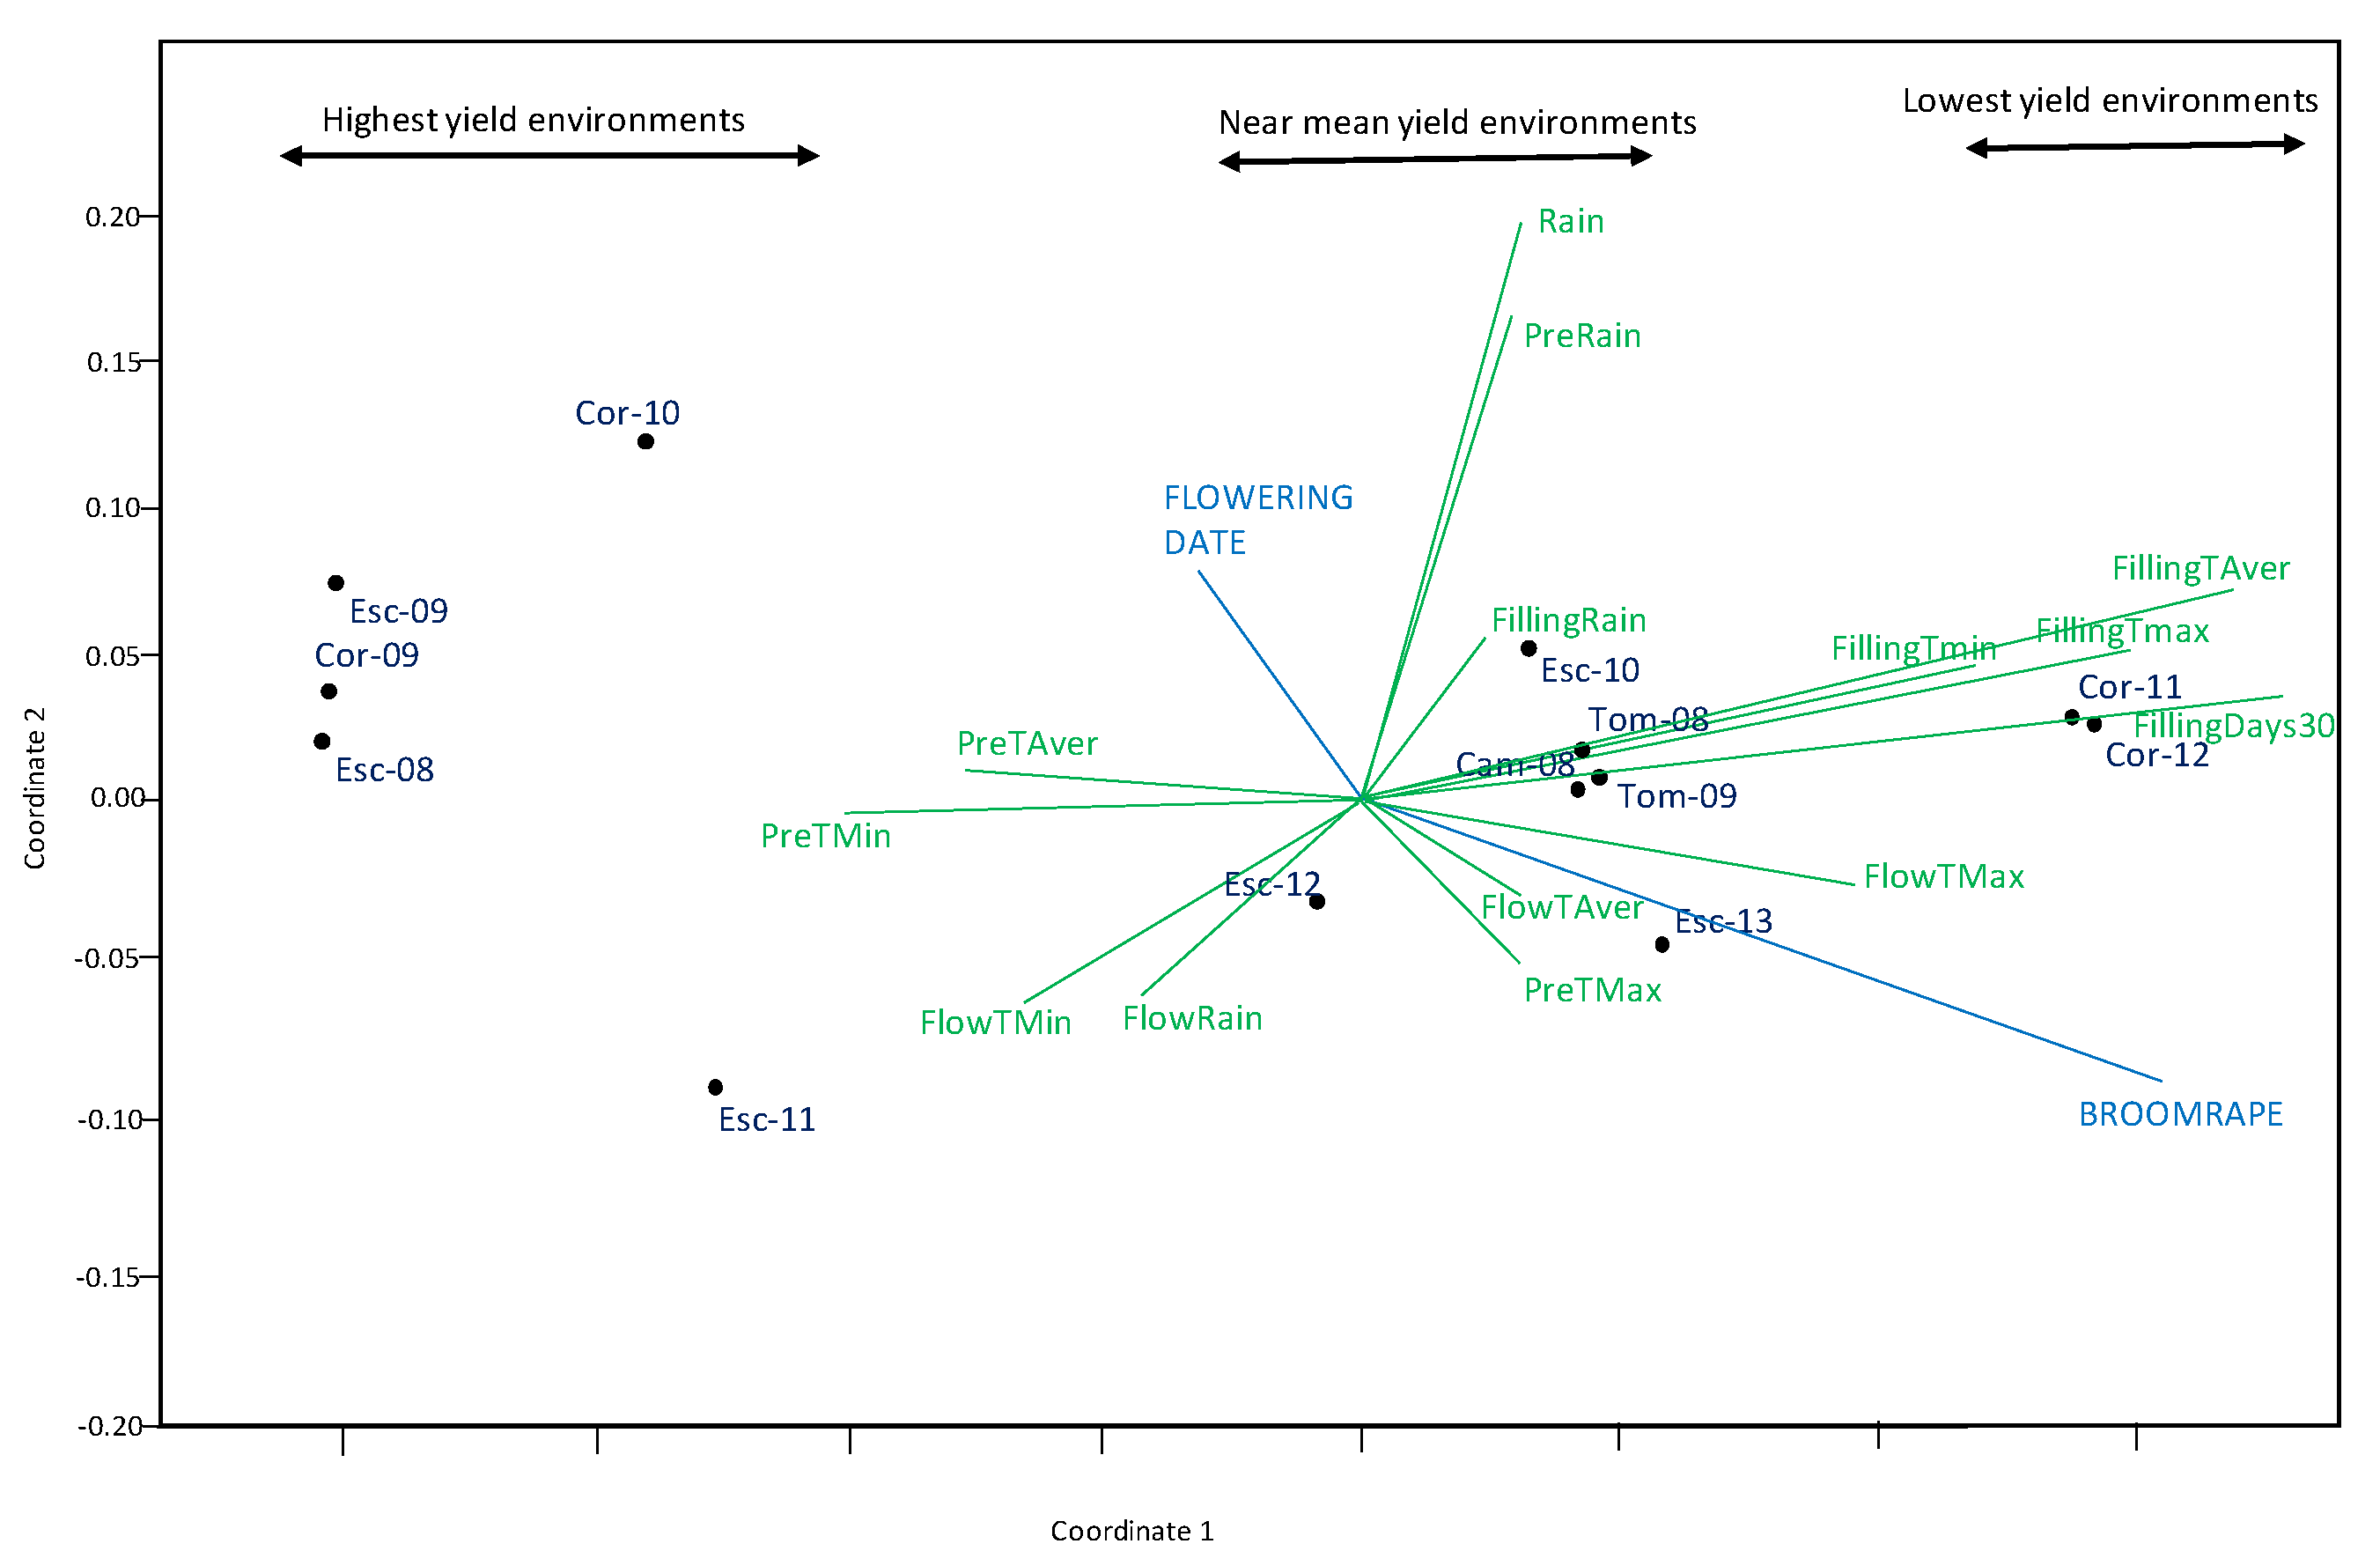
Figure 6.
Biplot of principal component analysis of 17 lentil lines for productivity and stress indices.
Figure 6.
Biplot of principal component analysis of 17 lentil lines for productivity and stress indices.

Table 1.
Lentil accessions included in the study.
| Accession | Origin/Derived from Accession no. |
|---|---|
| R4 | ILL5755 |
| R5 | ILL6002 |
| R7 | ILL6258 |
| R14 | ILL7517 |
| R17 | ILL8707 |
| R19 | ILL9903 |
| S6 | ILL10074 |
| S7 | ILL10079 |
| S8 | ILL10170 |
| S12 | ILL10174 |
| S14 | ILL10273 |
| S17 | ILL10278 |
| S23 | ILL10648 |
| S24 | ILL10653 |
| Armuña | Spanish landrace |
| Nefza | Tunisian cv. |
| Nsir | Tunisian cv. |
Table 2.
Description of the environments (combination of location and season) of the trials for the multi-environment study. Summary climatic data corresponding to each growing season are provided.
Table 2.
Description of the environments (combination of location and season) of the trials for the multi-environment study. Summary climatic data corresponding to each growing season are provided.
| Environment | Season | Site, Level of Broomrape (Oc) Infestation | Soil type | Soil pH | Latit. | Longit. | Altit. | Average Tmax (°C) | Average Tmin (°C) | Rain (mm) |
|---|---|---|---|---|---|---|---|---|---|---|
| Cam-08 | 2007–2008 | Campillo: low Oc | Vertisol | 7.5–8 | 37°20′ N | 4°51′ W | 461 | 18.0 | 6.8 | 264 |
| Cor-09 | 2008–2009 | Córdoba: high Oc | Cambisol | 6.5–7 | 37°50′ N | 4°50′ W | 90 | 19.2 | 6.9 | 279 |
| Cor-10 | 2009–2010 | Córdoba: high Oc | Cambisol | 6.5–7 | 37°50′ N | 4°50′ W | 90 | 20.1 | 8.4 | 1053 |
| Cor-11 | 2010–2011 | Córdoba: high Oc | Cambisol | 6.5–7 | 37°50′ N | 4°50′ W | 90 | 22.5 | 10.3 | 513 |
| Cor-12 | 2011–2012 | Córdoba: high Oc | Cambisol | 6.5–7 | 37°50′ N | 4°50′ W | 90 | 20.8 | 5.9 | 163 |
| Esc-08 | 2007–2008 | Escacena: high Oc | Fluvisol | 7–7.5 | 37°25′ N | 6°15′ W | 88 | 20.1 | 9.3 | 391 |
| Esc-09 | 2008–2009 | Escacena: high Oc | Fluvisol | 7–7.5 | 37°25′ N | 6°15′ W | 88 | 20.3 | 8.8 | 252 |
| Esc-10 | 2009–2010 | Escacena: high Oc | Fluvisol | 7–7.5 | 37°25′ N | 6°15′ W | 88 | 19.2 | 9.4 | 1206 |
| Esc-11 | 2010–2011 | Escacena: high Oc | Fluvisol | 7–7.5 | 37°25′ N | 6°15′ W | 88 | 21.6 | 11.4 | 534 |
| Esc-12 | 2011–2012 | Escacena: high Oc | Fluvisol | 7–7.5 | 37°25′ N | 6°15′ W | 88 | 20.5 | 9.1 | 134 |
| Esc-13 | 2012–2013 | Escacena: high Oc | Fluvisol | 7–7.5 | 37°25′ N | 6°15′ W | 88 | 19.4 | 9.2 | 411 |
| Tom-08 | 2007–2008 | Tomejil: low Oc | Vertisol | 7–7.5 | 37°30′ N | 5°57′ W | 12 | 21.7 | 8.7 | 399 |
| Tom-09 | 2008–2009 | Tomejil: low Oc | Vertisol | 7–7.5 | 37°30′ N | 5°57′ W | 12 | 21.3 | 7.1 | 219 |
Table 3.
Combined environment variance analysis of seed yield (kg/ha), broomrape infection (Oc/plant), and flowering date (dtf) of a lentil performance trials, consisting of 17 genotypes (G) grown in 13 environments (E), from 2008 to 2013.
Table 3.
Combined environment variance analysis of seed yield (kg/ha), broomrape infection (Oc/plant), and flowering date (dtf) of a lentil performance trials, consisting of 17 genotypes (G) grown in 13 environments (E), from 2008 to 2013.
| Grain yield (kg/ha) | Random Effects | Estimate | Standard Error | Z value | Pr > Z |
| E | 45084 | 20177 | 2.23 | 0.0127 | |
| Block(E) | 4073 | 1915 | 2.13 | 0.0167 | |
| G × E | 34344 | 5238 | 6.56 | <0.0001 | |
| Residual | 47537 | 3296 | 14.42 | <0.0001 | |
| Fixed Effects | Numerator df | Denominator df | F value | Pr > F | |
| G | 16 | 192 | 5.3 | <0.0001 | |
| Broomrape infection (Oc/plant) | Random Effects | Estimate | Standard Error | Z value | Pr > Z |
| E | 0.0483 | 0.0247 | 1.95 | 0.0255 | |
| Block(E) | 0.0080 | 0.0035 | 2.28 | 0.0113 | |
| G×E | 0.0078 | 0.0032 | 2.39 | 0.0084 | |
| Residual | 0.0524 | 0.0041 | 12.65 | <0.0001 | |
| Fixed Effects | Numerator df | Denominator df | F value | Pr > F | |
| G | 16 | 144 | 5.18 | <0.0001 | |
| Dates to flowering (dtf) | Random Effects | Estimate | Standard Error | Z value | Pr > Z |
| E | 28.19 | 12.22 | 2.31 | 0.0105 | |
| Block(E) | 0 | . | . | . | |
| G × E | 23.57 | 3.05 | 7.73 | <0.0001 | |
| Residual | 18.17 | 1.22 | 14.87 | <0.0001 | |
| Fixed Effects | Numerator df | Denominator df | F value | Pr > F | |
| G | 16 | 192 | 30.63 | <0.0001 |
Table 4.
Mean seed yield (kg/ha) of 17 lentil accessions grown at 13 location–year environments.
| Accession | Cam-08 | Cor-09 | Cor-10 | Cor-11 | Cor-12 | Esc-08 | Esc-09 | Esc-10 | Esc-11 | Esc-12 | Esc-13 | Tom-08 | Tom-09 | Mean | SE |
|---|---|---|---|---|---|---|---|---|---|---|---|---|---|---|---|
| Nsir | 635 | 901 | 1854 | 370 | 437 | 1125 | 933 | 921 | 871 | 567 | 387 | 510 | 493 | 770 | 71 |
| S23 | 476 | 1450 | 358 | 139 | 150 | 966 | 1413 | 516 | 775 | 938 | 247 | 470 | 461 | 643 | 85 |
| S17 | 424 | 1215 | 684 | 163 | 170 | 1254 | 965 | 332 | 342 | 982 | 251 | 630 | 635 | 619 | 73 |
| S12 | 416 | 794 | 145 | 135 | 144 | 974 | 1174 | 139 | 829 | 1504 | 487 | 404 | 385 | 579 | 76 |
| R7 | 128 | 970 | 669 | 108 | 105 | 1204 | 577 | 174 | 847 | 602 | 264 | 625 | 606 | 529 | 66 |
| S6 | 342 | 748 | 227 | 89 | 93 | 892 | 1127 | 162 | 1189 | 429 | 429 | 406 | 388 | 502 | 68 |
| S14 | 345 | 800 | 325 | 105 | 84 | 888 | 917 | 269 | 480 | 306 | 596 | 318 | 318 | 442 | 55 |
| Armuña | 268 | 608 | 1311 | 325 | 225 | 807 | 640 | 261 | 171 | 276 | 119 | 283 | 200 | 423 | 54 |
| R17 | 293 | 395 | 420 | 74 | 85 | 594 | 516 | 166 | 396 | 978 | 836 | 303 | 261 | 409 | 53 |
| Nefza | 216 | 609 | 829 | 53 | 41 | 741 | 643 | 244 | 311 | 276 | 409 | 244 | 204 | 371 | 43 |
| S8 | 234 | 292 | 469 | 76 | 76 | 771 | 536 | 588 | 558 | 233 | 618 | 203 | 164 | 371 | 44 |
| S7 | 183 | 847 | 339 | 117 | 109 | 780 | 546 | 355 | 164 | 239 | 336 | 330 | 272 | 355 | 42 |
| S24 | 313 | 315 | 312 | 62 | 69 | 579 | 1017 | 202 | 591 | 169 | 429 | 163 | 146 | 336 | 50 |
| R5 | 157 | 549 | 589 | 108 | 72 | 733 | 581 | 257 | 191 | 211 | 220 | 209 | 142 | 309 | 36 |
| R14 | 174 | 557 | 120 | 73 | 66 | 806 | 265 | 166 | 725 | 250 | 342 | 218 | 141 | 300 | 48 |
| R4 | 162 | 454 | 541 | 68 | 98 | 553 | 291 | 108 | 575 | 231 | 689 | 237 | 135 | 319 | 37 |
| R19 | 146 | 559 | 404 | 87 | 95 | 533 | 444 | 240 | 389 | 208 | 356 | 174 | 163 | 292 | 37 |
| Mean | 289 | 710 | 564 | 127 | 125 | 835 | 740 | 300 | 553 | 494 | 412 | 337 | 301 | 445 | |
| SE | 20 | 50 | 67 | 22 | 23 | 31 | 51 | 47 | 67 | 59 | 44 | 21 | 28 | 15 |
Table 5.
Days to flowering (dtf) of 17 lentil accessions grown at 13 location–year environments.
| Accession | Cam-08 | Cor-09 | Cor-10 | Cor-11 | Cor-12 | Esc-08 | Esc-09 | Esc-10 | Esc-11 | Esc-12 | Esc-13 | Tom-08 | Tom-09 | Mean | SE |
|---|---|---|---|---|---|---|---|---|---|---|---|---|---|---|---|
| Armuña | 115 | 121 | 122 | 125 | 99 | 111 | 115 | 102 | 107 | 109 | 108 | 115 | 117 | 113 | 1.2 |
| Nsir | 105 | 110 | 106 | 118 | 96 | 102 | 105 | 94 | 103 | 95 | 100 | 107 | 107 | 104 | 1.1 |
| Nefza | 100 | 105 | 102 | 113 | 90 | 97 | 99 | 90 | 99 | 87 | 94 | 101 | 102 | 98 | 1.2 |
| S8 | 97 | 95 | 106 | 120 | 90 | 94 | 90 | 84 | 93 | 91 | 90 | 99 | 96 | 96 | 1.5 |
| S7 | 95 | 95 | 106 | 119 | 93 | 90 | 90 | 78 | 86 | 87 | 87 | 98 | 92 | 94 | 1.7 |
| R4 | 95 | 96 | 106 | 113 | 77 | 93 | 95 | 75 | 92 | 96 | 90 | 98 | 96 | 94 | 1.7 |
| R19 | 96 | 94 | 106 | 116 | 90 | 90 | 88 | 76 | 98 | 86 | 88 | 97 | 95 | 94 | 1.8 |
| R7 | 91 | 91 | 92 | 88 | 79 | 90 | 86 | 80 | 99 | 86 | 88 | 91 | 90 | 89 | 1.0 |
| S12 | 91 | 95 | 99 | 98 | 85 | 87 | 84 | 74 | 95 | 85 | 85 | 92 | 88 | 89 | 1.4 |
| S17 | 91 | 95 | 101 | 90 | 83 | 88 | 84 | 72 | 101 | 82 | 85 | 94 | 86 | 89 | 1.4 |
| S14 | 88 | 91 | 92 | 88 | 79 | 89 | 84 | 87 | 90 | 84 | 89 | 88 | 86 | 87 | 0.7 |
| S23 | 87 | 91 | 92 | 88 | 81 | 87 | 84 | 74 | 96 | 84 | 85 | 90 | 86 | 87 | 1.0 |
| S24 | 88 | 91 | 98 | 88 | 82 | 87 | 90 | 76 | 87 | 85 | 86 | 87 | 86 | 87 | 0.9 |
| R5 | 86 | 91 | 92 | 77 | 67 | 89 | 85 | 88 | 91 | 81 | 87 | 87 | 88 | 85 | 1.3 |
| S6 | 87 | 95 | 101 | 88 | 80 | 84 | 84 | 61 | 101 | 85 | 82 | 88 | 86 | 86 | 1.8 |
| R17 | 82 | 85 | 76 | 77 | 65 | 84 | 84 | 75 | 89 | 78 | 83 | 82 | 86 | 81 | 1.4 |
| R14 | 81 | 89 | 59 | 78 | 74 | 81 | 84 | 75 | 74 | 81 | 80 | 81 | 86 | 79 | 1.4 |
| Mean | 93 | 96 | 97 | 99 | 83 | 91 | 90 | 80 | 94 | 87 | 89 | 94 | 93 | 91 | |
| SE | 1.2 | 1.2 | 2.0 | 2.4 | 1.3 | 1.0 | 1.2 | 1.8 | 1.3 | 1.0 | 1.0 | 1.2 | 1.2 | 0.4 |
Table 6.
Mean broomrape infection (Oc/plant) of 17 lentil accessions grown at 13 location–year environments.
Table 6.
Mean broomrape infection (Oc/plant) of 17 lentil accessions grown at 13 location–year environments.
| Accession | Cam-08 | Cor-09 | Cor-10 | Cor-11 | Cor-12 | Esc-08 | Esc-09 | Esc-10 | Esc-11 | Esc-12 | Esc-13 | Tom-08 | Tom-09 | Mean | SE |
|---|---|---|---|---|---|---|---|---|---|---|---|---|---|---|---|
| Armuña | 0.00 | 0.35 | 0.33 | 1.03 | 0.72 | 0.41 | 0.96 | 0.41 | 0.67 | 0.67 | 0.62 | 0.00 | 0.00 | 0.49 | 0.10 |
| Nsir | 0.00 | 0.20 | 0.07 | 0.99 | 0.65 | 0.19 | 0.81 | 0.53 | 0.13 | 0.41 | 0.43 | 0.00 | 0.00 | 0.34 | 0.10 |
| S7 | 0.00 | 0.11 | 0.13 | 1.07 | 0.73 | 0.20 | 0.08 | 0.62 | 0.63 | 0.47 | 0.42 | 0.00 | 0.00 | 0.34 | 0.08 |
| R5 | 0.00 | 0.26 | 0.10 | 1.01 | 0.52 | 0.20 | 0.87 | 0.06 | 0.47 | 0.47 | 0.51 | 0.00 | 0.00 | 0.34 | 0.08 |
| S8 | 0.00 | 0.21 | 0.23 | 1.02 | 0.68 | 0.07 | 0.11 | 0.26 | 0.80 | 0.43 | 0.27 | 0.00 | 0.00 | 0.31 | 0.08 |
| Nefza | 0.00 | 0.06 | 0.07 | 0.94 | 0.28 | 0.06 | 0.67 | 0.11 | 0.17 | 0.32 | 0.43 | 0.00 | 0.00 | 0.25 | 0.07 |
| S6 | 0.00 | 0.18 | 0.23 | 1.24 | 0.37 | 0.04 | 0.00 | 0.33 | 0.17 | 0.22 | 0.44 | 0.00 | 0.00 | 0.25 | 0.08 |
| S12 | 0.00 | 0.11 | 0.10 | 0.90 | 0.46 | 0.03 | 0.08 | 0.37 | 0.43 | 0.36 | 0.46 | 0.00 | 0.00 | 0.25 | 0.07 |
| S24 | 0.00 | 0.15 | 0.13 | 0.73 | 0.77 | 0.04 | 0.05 | 0.41 | 0.33 | 0.25 | 0.18 | 0.00 | 0.00 | 0.24 | 0.07 |
| S17 | 0.00 | 0.08 | 0.03 | 1.24 | 0.33 | 0.02 | 0.19 | 0.11 | 0.23 | 0.23 | 0.52 | 0.00 | 0.00 | 0.23 | 0.09 |
| R19 | 0.00 | 0.09 | 0.20 | 0.97 | 0.39 | 0.05 | 0.39 | 0.13 | 0.37 | 0.24 | 0.22 | 0.00 | 0.00 | 0.23 | 0.07 |
| R14 | 0.00 | 0.10 | 0.03 | 0.56 | 0.26 | 0.06 | 0.08 | 0.11 | 0.47 | 0.28 | 0.56 | 0.00 | 0.00 | 0.21 | 0.06 |
| S23 | 0.00 | 0.09 | 0.13 | 0.88 | 0.33 | 0.08 | 0.01 | 0.22 | 0.27 | 0.19 | 0.35 | 0.00 | 0.00 | 0.20 | 0.06 |
| R4 | 0.00 | 0.03 | 0.03 | 0.63 | 0.53 | 0.03 | 0.36 | 0.09 | 0.20 | 0.26 | 0.37 | 0.00 | 0.00 | 0.19 | 0.06 |
| R7 | 0.00 | 0.00 | 0.03 | 0.59 | 0.24 | 0.05 | 0.69 | 0.20 | 0.17 | 0.23 | 0.10 | 0.00 | 0.00 | 0.18 | 0.09 |
| R17 | 0.00 | 0.12 | 0.00 | 0.59 | 0.48 | 0.06 | 0.16 | 0.11 | 0.07 | 0.15 | 0.28 | 0.00 | 0.00 | 0.15 | 0.06 |
| S14 | 0.00 | 0.06 | 0.03 | 0.41 | 0.30 | 0.01 | 0.17 | 0.06 | 0.20 | 0.12 | 0.28 | 0.00 | 0.00 | 0.13 | 0.03 |
| Mean | 0.00 | 0.13 | 0.11 | 0.87 | 0.47 | 0.09 | 0.33 | 0.24 | 0.34 | 0.31 | 0.38 | 0.00 | 0.00 | 0.26 | |
| SE | 0.00 | 0.02 | 0.02 | 0.04 | 0.06 | 0.01 | 0.06 | 0.04 | 0.04 | 0.02 | 0.04 | 0.00 | 0.00 | 0.02 |
Table 7.
Pearson correlations among accessed traits.
| Grain Yield | Dtf | Broomrape | Rain | Tmin Preflowering | TAver Filling | Numb. Days Tmax > 30 °C | |
|---|---|---|---|---|---|---|---|
| Grain yield | 0.19 | −0.36 | 0.02 | 0.42 | −0.58 * | −0.72 ** | |
| Dtf | −0.07 | −0.06 | 0.08 | −0.15 | −0.25 | ||
| Broomrape | 0.01 | −0.15 | 0.64 * | 0.46 |
*, ** Significant at the 0.05 and 0.001 level of probability, respectively.
Table 8.
Description by environment of the major drivers on yield: levels of broomrape infection, Tmin at pre-flowering, Taver at flowering, Taver at grain filling, and number of days with Tmax > 30 °C at grain filling.
Table 8.
Description by environment of the major drivers on yield: levels of broomrape infection, Tmin at pre-flowering, Taver at flowering, Taver at grain filling, and number of days with Tmax > 30 °C at grain filling.
| Environments | GY Mean | Broomrape Mean | Tmin at Pre-Flowering | Taver at Flowering | Tmax at Grain Filling | Num. Days Tmax > 30 °C |
|---|---|---|---|---|---|---|
| Cam-08 | 289 | 0.00 | 4.8 | 9.8 | 20.6 | 0 |
| Cor-09 | 710 | 0.13 | 4.1 | 8.8 | 25.5 | 2 |
| Cor-10 | 564 | 0.11 | 5.4 | 10.1 | 24.1 | 2 |
| Cor-11 | 127 | 0.87 | 5.6 | 10.0 | 28.9 | 8 |
| Cor-12 | 125 | 0.47 | 1.2 | 7.7 | 29.1 | 9 |
| Esc-08 | 835 | 0.09 | 8.0 | 12.6 | 22.2 | 0 |
| Esc-09 | 740 | 0.33 | 6.2 | 10.3 | 24.8 | 2 |
| Esc-10 | 300 | 0.24 | 7.3 | 10.9 | 27.9 | 7 |
| Esc-11 | 553 | 0.34 | 7.3 | 11.1 | 26.1 | 3 |
| Esc-12 | 494 | 0.31 | 5.2 | 10.5 | 21.7 | 2 |
| Esc-13 | 412 | 0.42 | 6.7 | 10.6 | 24.3 | 2 |
| Tom-08 | 337 | 0.00 | 6.8 | 12.8 | 24.2 | 3 |
| Tom-09 | 301 | 0.00 | 4.9 | 10.2 | 28.1 | 8 |
Table 9.
Grain yield under stress and non-stress environments, and heat stress tolerance indices of the studied accessions.
Table 9.
Grain yield under stress and non-stress environments, and heat stress tolerance indices of the studied accessions.
| Accession | Ys | Yp | GMP | YI | MP | SSI | STI | HARM | HTI |
|---|---|---|---|---|---|---|---|---|---|
| S17 | 635 | 1254 | 892 | 2.11 | 944 | 0.79 | 1.25 | 843 | 2.86 |
| R7 | 606 | 1204 | 854 | 2.01 | 905 | 0.80 | 1.14 | 806 | 2.71 |
| Nsir | 493 | 1125 | 745 | 1.64 | 809 | 0.90 | 0.87 | 686 | 1.92 |
| S23 | 461 | 966 | 668 | 1.53 | 714 | 0.84 | 0.70 | 625 | 1.96 |
| S12 | 385 | 974 | 613 | 1.28 | 680 | 0.97 | 0.59 | 552 | 1.36 |
| S6 | 388 | 892 | 589 | 1.29 | 640 | 0.91 | 0.54 | 541 | 1.51 |
| S14 | 318 | 888 | 531 | 1.06 | 603 | 1.03 | 0.44 | 468 | 1.01 |
| S7 | 272 | 780 | 461 | 0.90 | 526 | 1.05 | 0.33 | 403 | 0.84 |
| Armuña | 200 | 807 | 402 | 0.66 | 504 | 1.20 | 0.25 | 321 | 0.44 |
| R17 | 261 | 594 | 394 | 0.87 | 428 | 0.90 | 0.24 | 363 | 0.89 |
| Nefza | 204 | 741 | 389 | 0.68 | 473 | 1.16 | 0.24 | 320 | 0.50 |
| S8 | 164 | 771 | 355 | 0.54 | 467 | 1.26 | 0.20 | 270 | 0.31 |
| R14 | 141 | 806 | 337 | 0.47 | 474 | 1.32 | 0.18 | 240 | 0.22 |
| R5 | 142 | 733 | 323 | 0.47 | 438 | 1.29 | 0.16 | 238 | 0.25 |
| R19 | 163 | 533 | 295 | 0.54 | 348 | 1.11 | 0.14 | 250 | 0.44 |
| S24 | 146 | 579 | 290 | 0.48 | 362 | 1.19 | 0.13 | 233 | 0.33 |
| R4 | 135 | 553 | 273 | 0.44 | 344 | 1.21 | 0.11 | 217 | 0.29 |
Ys = grain yield of individual genotype in the selected stress environment (Tom-09); Yp = grain yield in the non-stress environment (Esc-08); GMP = geometric mean productivity; YI = yield index; MP = mean productivity; SSI = stress sensitivity index; STI = stress tolerance index; HARM = harmonic mean; HTI = heat tolerance index.
Table 10.
Correlation coefficient of Ys, Yp, and heat tolerance indices.
| Ys | Yp | HARM | MP | SSI | STI | YI | HTI | |
|---|---|---|---|---|---|---|---|---|
| Yp | 0.83 *** | |||||||
| HARM | 0.99 *** | 0.88 *** | ||||||
| MP | 0.93 *** | 0.98 *** | 0.96 *** | |||||
| SSI | −0.49 * | 0.05 | −0.42 | −0.15 | ||||
| STI | 0.98 *** | 0.87 *** | 0.99 *** | 0.95 *** | −0.41 | |||
| YI | 0.98 *** | 0.83 *** | 0.99 *** | 0.93 *** | −0.50 * | 0.99 *** | ||
| HTI | 0.97 *** | 0.70 ** | 0.95 *** | 0.84 *** | −0.65 ** | 0.95 *** | 0.98 *** | |
| GMP | 0.98 *** | 0.93 *** | 0.99 *** | 0.99 *** | −0.31 | 0.98 *** | 0.98 *** | 0.91 *** |
*, **, *** Significant at the 0.05, 0.001 and 0.0001 level of probability, respectively.
Publisher’s Note: MDPI stays neutral with regard to jurisdictional claims in published maps and institutional affiliations. |
© 2021 by the authors. Licensee MDPI, Basel, Switzerland. This article is an open access article distributed under the terms and conditions of the Creative Commons Attribution (CC BY) license (https://creativecommons.org/licenses/by/4.0/).
Share and Cite
MDPI and ACS Style
Rubiales, D.; Moral, A.; Flores, F. Heat Waves and Broomrape Are the Major Constraints for Lentil Cultivation in Southern Spain. Agronomy 2021, 11, 1871. https://doi.org/10.3390/agronomy11091871
AMA Style
Rubiales D, Moral A, Flores F. Heat Waves and Broomrape Are the Major Constraints for Lentil Cultivation in Southern Spain. Agronomy. 2021; 11(9):1871. https://doi.org/10.3390/agronomy11091871
Chicago/Turabian StyleRubiales, Diego, Ana Moral, and Fernando Flores. 2021. "Heat Waves and Broomrape Are the Major Constraints for Lentil Cultivation in Southern Spain" Agronomy 11, no. 9: 1871. https://doi.org/10.3390/agronomy11091871
Note that from the first issue of 2016, this journal uses article numbers instead of page numbers. See further details here.