
Sound Splits as Influenced by Seed Size for Runner and Virginia Market Type Peanut Shelled on a Reciprocating Sheller


1
Edisto Research and Education Center, Plant and Environmental Sciences, Clemson University, Blackville, SC 29817, USA
2
School of Plant and Environmental Sciences, Tidewater Agricultural Research and Extension Center, Virginia Tech, Suffolk, VA 23437, USA
3
Crop and Soil Sciences, North Carolina State University, Raleigh, NC 27695, USA
4
Crop and Soil Sciences, University of Georgia, Tifton, GA 31793, USA
*
Author to whom correspondence should be addressed.
Agronomy 2021, 11(9), 1869; https://doi.org/10.3390/agronomy11091869
Submission received: 30 July 2021
/
Accepted: 13 September 2021
/
Published: 17 September 2021
(This article belongs to the Special Issue Peanut: A Promising Star to Feed the Future)
Abstract
:The objective of this study was to examine peanut (Arachis hypogaea L.) kernel percent sound splits as a function of sound mature kernel seed size when shelled on a reciprocating sheller. Data were compiled from a total of 139 field experiments conducted in the Virginia-Carolina region and Georgia from 2005 to 2020. Runner and Virginia peanut market types were graded according to United States Department of Agriculture (USDA) standards using standard sheller screens with upper grid sizes corresponding to the red pan from the pre-sizer of 10.3 × 19.1 mm (26/64 × 3/4 ″) and 13.5 × 25.4 mm (34/64 × 1 ″) with minimum bar grid clearances of 8.7 (11/32 ″) and 12.7 mm (1/2 ″), respectively. A subset of runner market type samples was graded using the Virginia sheller screen. Grade data per market type and sheller screen was analyzed separately. Among runner market types shelled with the standard runner-type screen, percent sound splits increased linearly with increasing seed size at the logit rate of 1.16 per sound mature kernel g (p < 0.001). Sound splits for Virginia and runner market types shelled on the standard Virginia-type screen did not significantly vary by kernel size (p = 0.939 and 0.687, respectively). Extra-large kernels (proportion) for Virginia types linearly increased with seed size at 1.91 per sound mature kernel g (logit scale) (p < 0.001). Runner market types sized 75 to 91 g/100 sound mature kernels (605 to 500 seed/lb) were estimated to have a 50% probability of a 2.3 to 4.5% or greater increase in sound splits when shelled with the standard runner-type screen compared to runner-type seed sized 55 g/100 sound mature kernels (820 seed/lb), respectively, equivalent to a potential deduction increase of 1.8 to 4.4 USD /1000 kg. For both Virginia and runner market types, seed weight linearly increased with pod weight at 0.169 and 0.195 g/g (p < 0.001), respectively. Results from this study may be used as a reference to suggest runner-type seed sizes above which larger reciprocating sheller screen utilization in line with USDA grading practices is warranted to reduce mechanically induced sound splits during grading and subsequent economic deduction penalties for corresponding farmer stock peanut.
1. Introduction
Economic value of harvested farmer stock peanut for a farmer is primarily a function of the total produced yield and corresponding grade as determined at the buying point. The United States Department of Agriculture (USDA) grading system in use today has its origins in the 1950s [1,2], with only relatively minor changes (e.g., modification of the Segregation I damaged kernel allowance) introduced since then [3]. Net loan values per farmer stock load are calculated following USDA grading standards [4,5], for which premiums are added according to kernel designation (e.g., total sound mature, extra large, and other). Discounts for Segregation I loads are analogously applied as a subtraction from the loan rate and include penalties for excessive foreign material or sound splits (SS). A SS is an otherwise sound mature kernel (SMK) for which the cotyledons have separated. Sound splits are assessed at the buying point following shelling of the grading sample on a reciprocating sheller. Prior to shelling, cleaned pods are run through a pre-sizer to sort pods by size. Standard sheller screens for use in the reciprocating sheller for runner and Virginia market type cultivars have upper grid sizes, corresponding to the red pan from the pre-sizer, of 10.3 × 19.1 mm (26/64 × 3/4 ″) and 13.5 × 25.4 mm (34/64 × 1 ″), respectively [6]. Variability exists in peanut seed size among cultivars [7,8,9], which also influences the cost to deliver a specific seeding rate, and the number of cultivars in active U.S. commercial production has increased over the years.
Historical runner market type production in the southeastern U.S. has traditionally been characterized by single-cultivar domination [10]. Dixie Runner [11] and Early Runner [12] were released in 1943 and 1952, respectively, and were the most widely grown runner cultivars between the time of their release and the early 1970s [13,14]. From 1972 to 1993, Florunner [15] was the predominant cultivar grown and represented between 60 and 95% of the peanut acreage [10]. Georgia Green followed Florunner as the most prevalent cultivar through to the early 2000s [10,16]. Each of the most widely grown runner market type cultivars in the U.S. from 1940 to 2000 exhibited seed sizes within a relatively small window, ranging from 0.45 to 0.59 g/kernel (1010 to 770 seed/lb) [17,18,19]. Currently, single-cultivar production widely remains the case across states such as Georgia (e.g., Georgia-06G [20], 0.70 g/kernel), whereas states such as South Carolina exhibit a greater variety of cultivars grown [7].
Recently released runner cultivars have included those designated extra large seeded runners, a term lacking codification [19], with reported seed sizes in upwards of 0.77 to 0.84 g/kernel (590 to 540 seed/lb) [21,22,23]. The USDA definition for Virginia market type categorization is based upon a minimum of 40% fancy pods [6,24]. As such, several recently released runner market types [21,22,23] exhibit enough fancy pods to be classified as a Virginia type according to this criterion, though in practice the accepted fancy pod threshold for commercially desirable Virginia market type cultivars is much higher, circa 70 to 90% [21,25,26,27,28]. Rather, for runner-type peanut, more commercial relevance has been placed on the amount of medium and jumbo kernels [21].
While anecdotal observations have suggested that larger runner seed sizes may incur a greater amount of SS following shelling during grading, published reports documenting this data are lacking. The objective of this work was to examine the relationship of peanut seed size and SS measured in conjunction with processing on a reciprocating sheller to determine if larger seed sizes per market type were associated with a greater proportion of SS than genotypes with smaller seed sizes and to estimate the deduction penalty of this potential increase. The relationship of extra large kernels (ELK) with Virginia market type seed size was additionally examined.
2. Materials and Methods
Data from field trials designed to examine agronomic performance of cultivars and breeding lines and conducted in North Carolina, South Carolina, Virginia, and Georgia (runner-type SMK wt–pod wt data) from 2005 to 2020 was examined for meeting selection criteria for inclusion in the analysis. Within these trials, randomized complete block designs were utilized and production practices followed Extension recommendations [7,29,30]. Peanut grade was determined according to USDA standards [6]. To be used in the analysis, studies had to have reported SS and ELK (for Virginia market types) as a percent or proportion, cultivar/line, and include information (e.g., location and year) to uniquely identify each experiment. Following screening, data from 139 trials were compiled (Table 1). Where not measured within an experiment, seed size estimates were obtained from reported literature (e.g., cultivar releases) or estimated from the collected data (Table 2 and Table 3).
Data were analyzed using the following formula:
where SSij is the proportion sound splits at the ith SMKwt for the jth study, b is a slope parameter, SMKwti is the weight (g) per SMK of size i, I is an intercept, Sj is the random effect of study j, and eij is the residual. Data for runner and Virginia market types were analyzed separately after being processed on different sheller screens [6]. The GLIMMIX procedure of SAS 9.4 (SAS Institute, Cary, NC, USA) was used to fit the model to the data according to a beta distribution with logit link for the proportion response data. Reliability of Equation (1) in predicting observed SS was assessed with the concordance correlation coefficient (CCC) [31].
SSij = b × SMKwti + I + Sj + eij
The estimated effect size of SSij at varying seed size i was obtained using the estimate statement in GLIMMIX. The probability of increased SSij for a given extra large seeded runner (e.g., 605 seed/lb, TUFRunner ‘297′ [22]) in relation to a small-seeded runner (e.g., 820 seed/lb, Georgia-13M [32]) in future gradings was estimated using the inter-trial standard deviation and cumulative standard-normal function following previously reported methodology [33,34,35,36]. Probabilities, pi, of SS differences in future gradings were estimated using Equation (2):
where C is a given SS increase, DSSi is SS above the small-seeded runner control for seed size i (e.g., 605 seed/lb), Φ is the cumulative standard-normal function, and is the square-root of the estimated between-study variance as estimated from Equation (1). Probabilities were calculated on the logit scale and back-transformed for presentation on the data scale. Sound split deduction increases were estimated following USDA standards at the rate of 0.88 USD /1000 kg per percent increase [6]. Deduction increase calculations assumed farmer stock loads with a minimum of 4% SS.
For Virginia market types, ELK was predicted using an analogous form of Equation (1) where proportion ELKij was the response. Predicted SMKwtij as a function of pod wt for genotype i and study j was estimated by:
where podwti is the corresponding wt (g) of a pod of genotype i, and b, I, Sj, and eij are as described for Equation (1). Cultivar seed size (100 SMK wt) for runner and Virginia market type cultivars was estimated from the North and South Carolina data where seed size was reported using the GLIMMIX procedure with cultivar as a fixed effect and cultivar within study as a random effect with first-order multiplicative structure [37], selected by way of Akaike’s information criterion (AIC) minimization. Cultivars with data from at least three studies were included in the analysis.
SMKwtij = b × podwti + I + Sj + eij
To examine kernel width with respect to sheller screen size tolerance (0.8 mm or 2/64 ″ larger slot width compared to largest kernel width size per [9]) for extra large seeded runner market type cultivars, kernel geometric and density data were obtained from reported literature [38,39,40,41,42,43]. Kernel length was predicted as a linear function of SMK wt using the ROBUSTREG procedure in SAS. Aspect ratios for kernel width and thickness were similarly estimated as linear functions of kernel length. Peanut kernel volume was approximated as an ellipsoid with volume = 1/6 × π × length × width × thickness. For purposes of this study, extra large seeded runner type cultivars were considered those with seed sizes ≥ 73.8 g/100 SMK (615 seed/lb).
3. Results
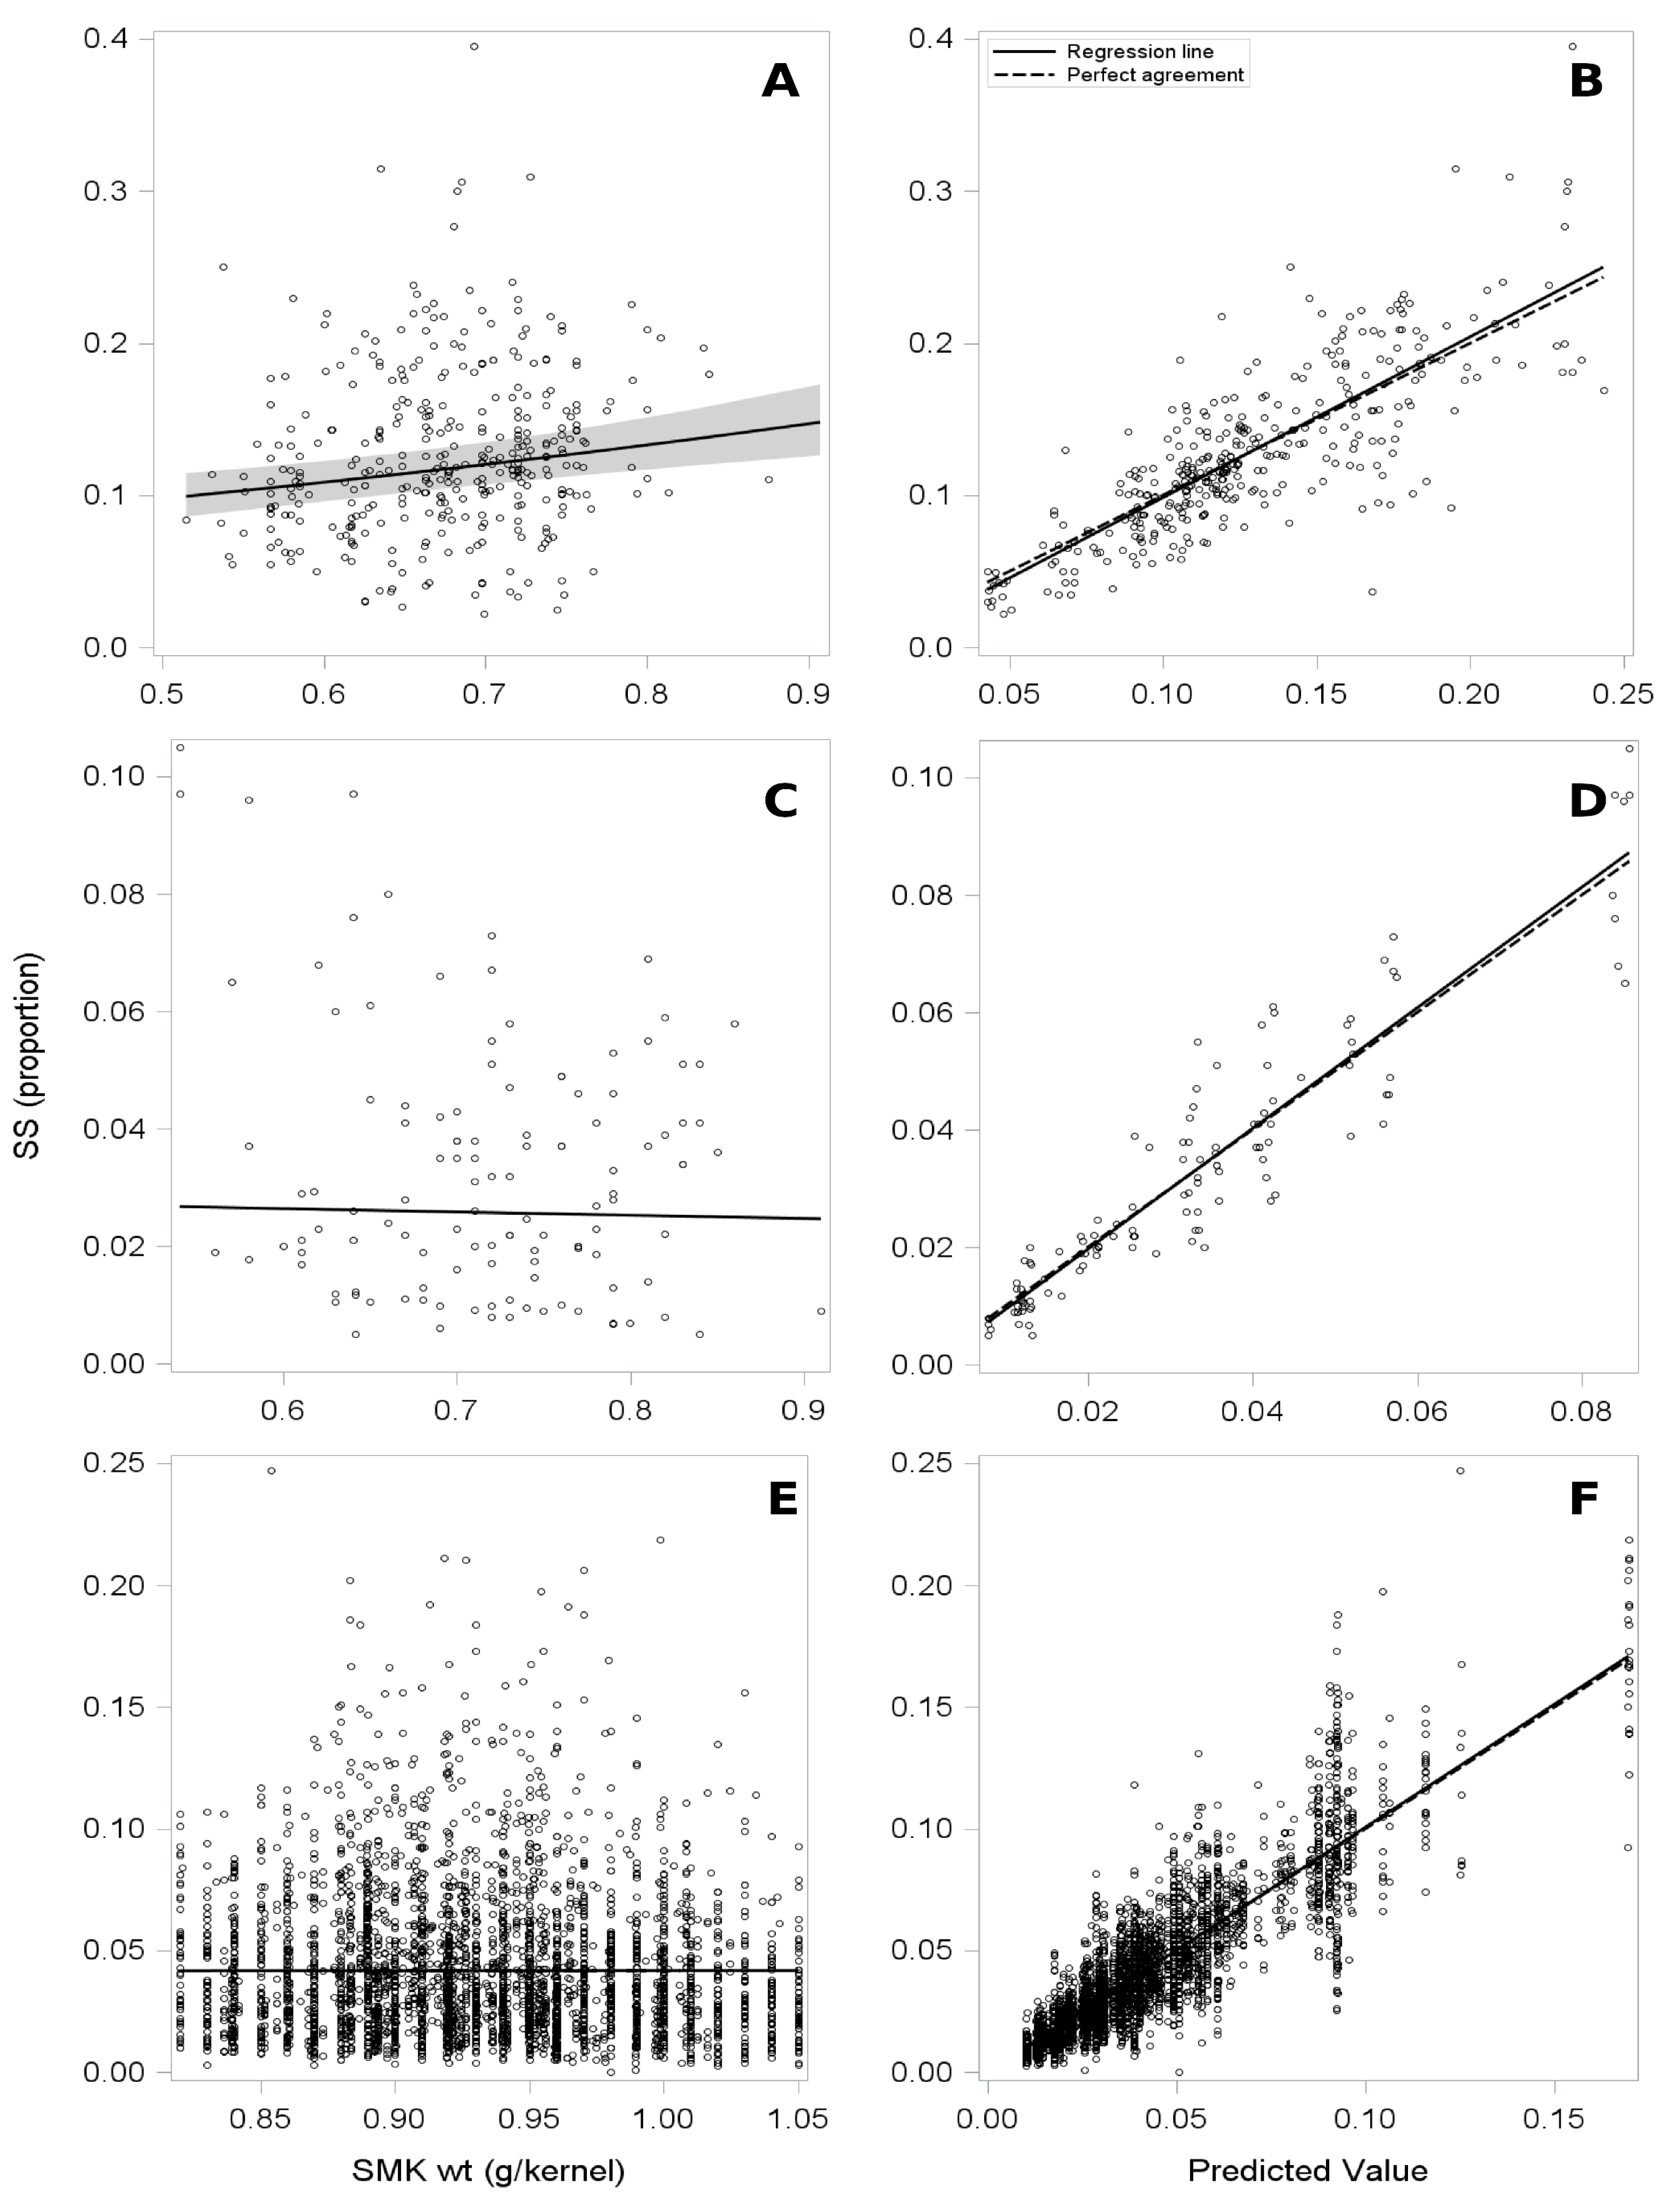
Sounds splits linearly increased with SMK wt for runner market types shelled with the runner sheller screen (p < 0.001, model-scale slope = 1.16) but not when shelled with the Virginia sheller screen (p = 0.687) (Figure 1). Reliability (CCC) of SS prediction by the two models was 77.5 and 93.0%, respectively. Virginia market types shelled on the Virginia sheller screen did not exhibit a significant relationship for SS versus seed size (p = 0.938, CCC = 85.4%).
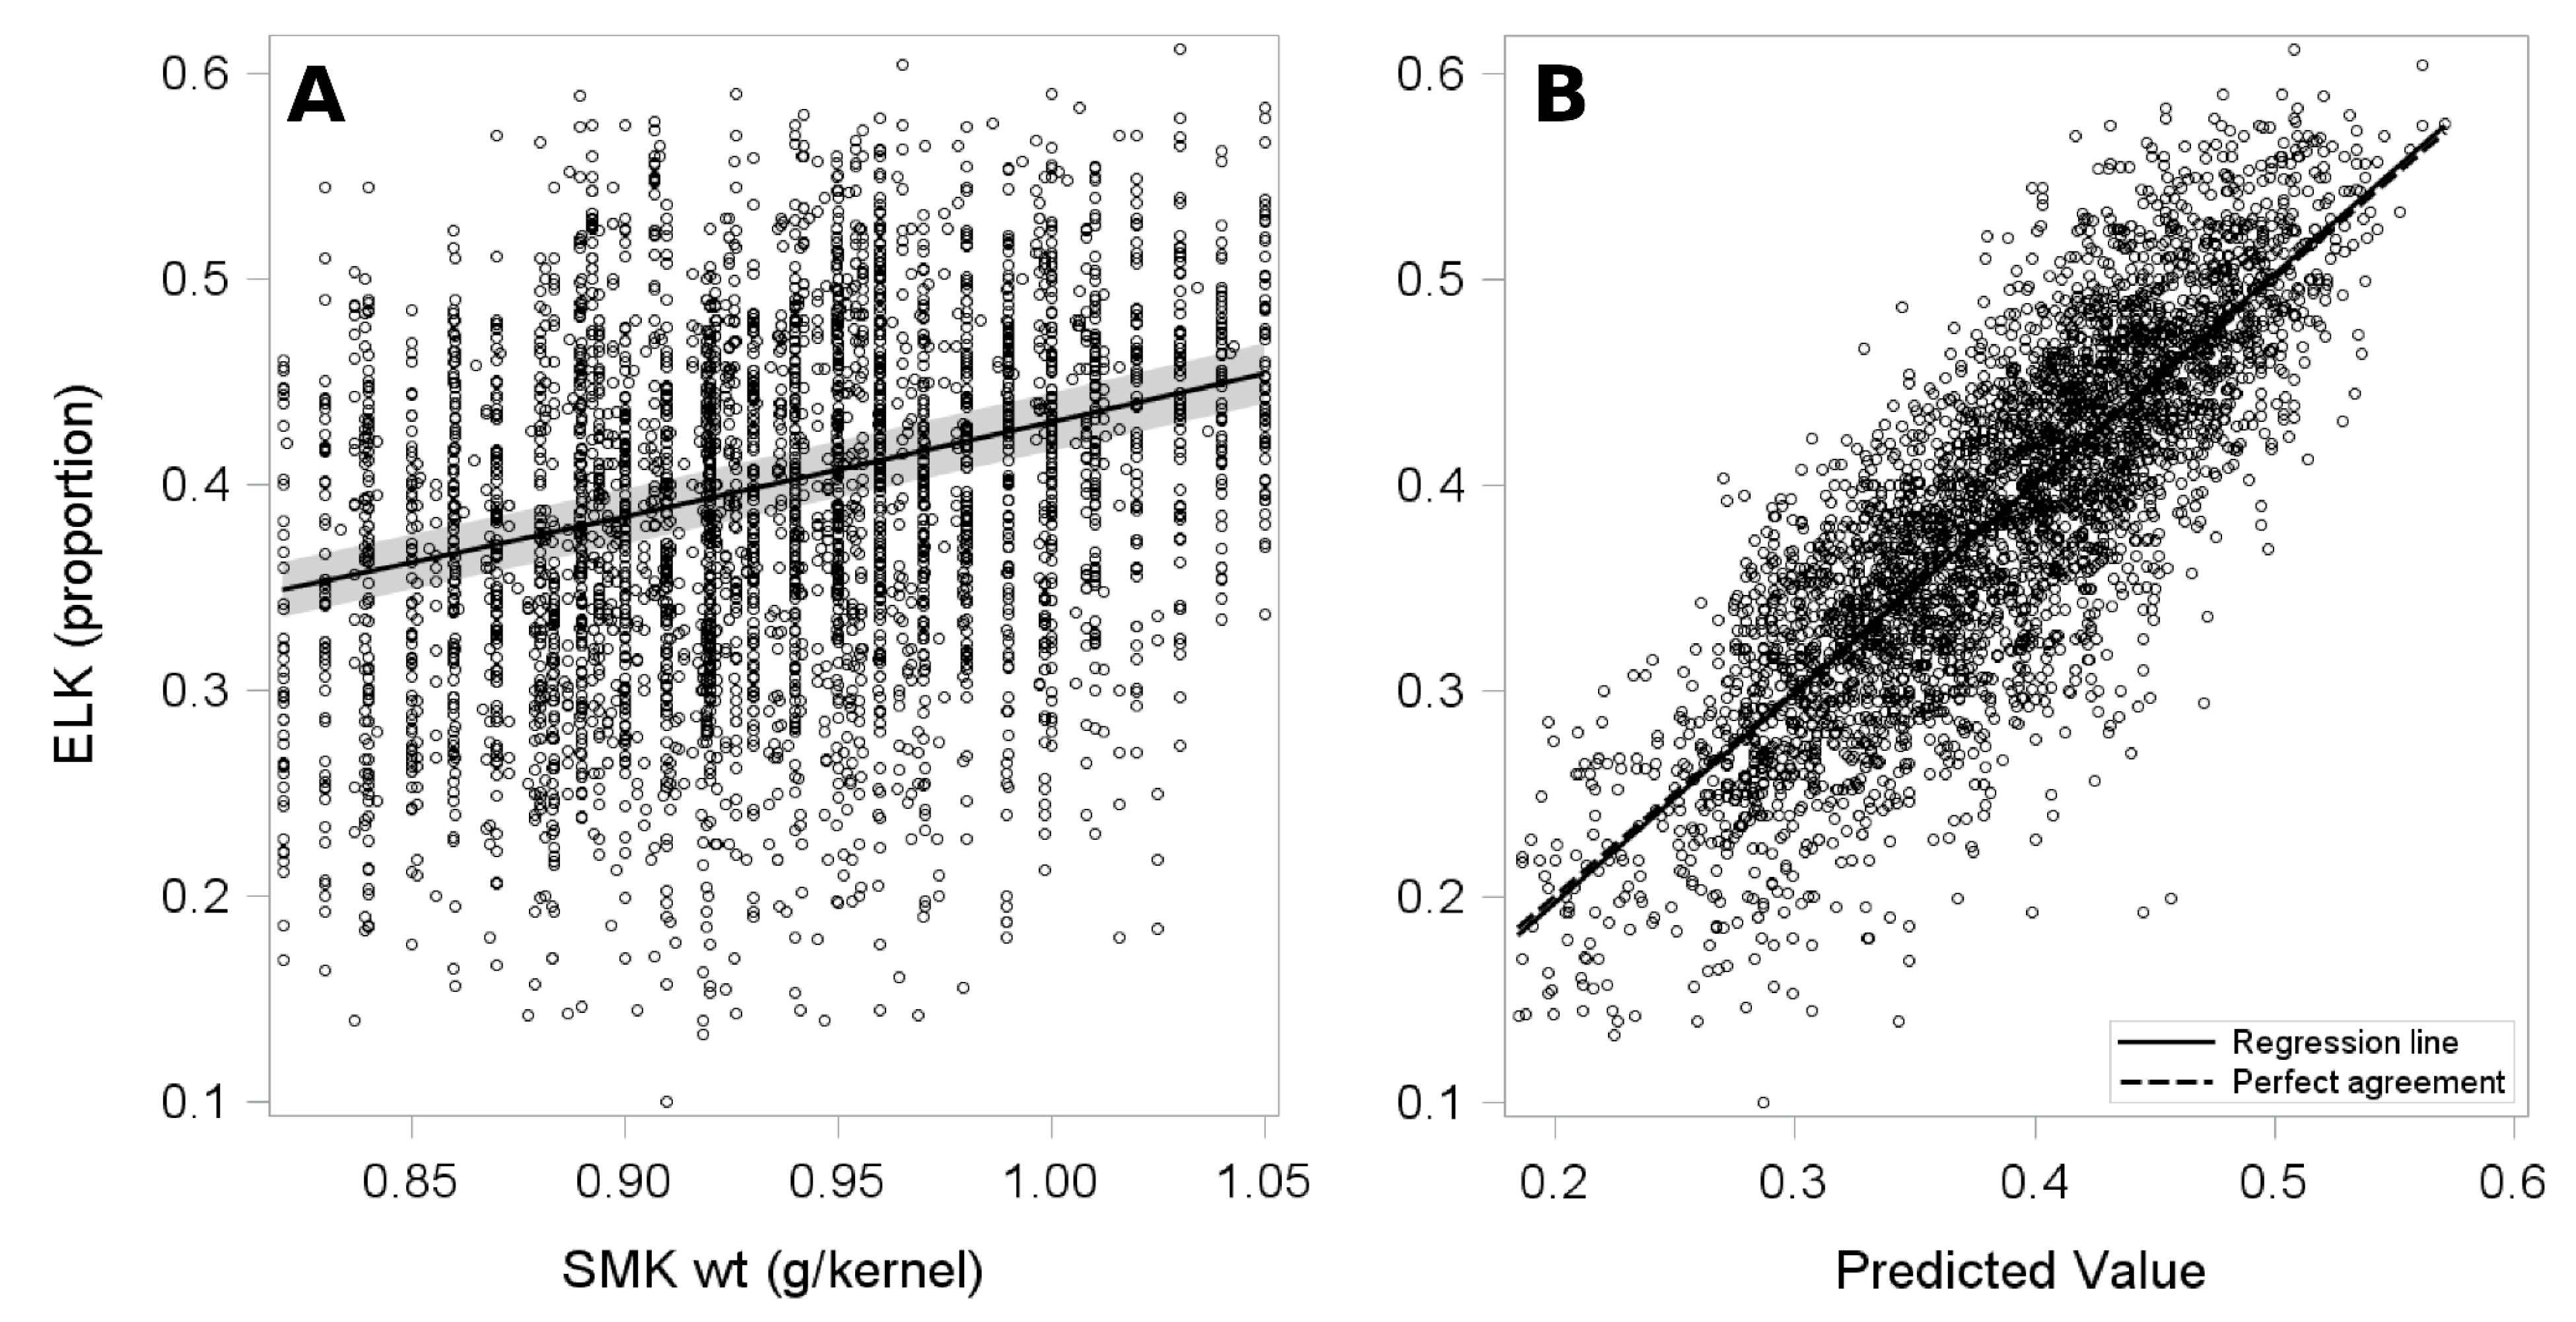
Proportion ELK linearly increased with SMK wt for Virginia market types (p < 0.001, model-scale slope = 1.909) (p < 0.001) (Figure 2). Reliability (CCC) of ELK prediction was 80.4%. This general relationship was anticipated, following how ELK designation is, by definition, dependent on SMK size facilitating riding an 8.3 × 25.4 mm (21.5/64 × 1 ″) screen [6].
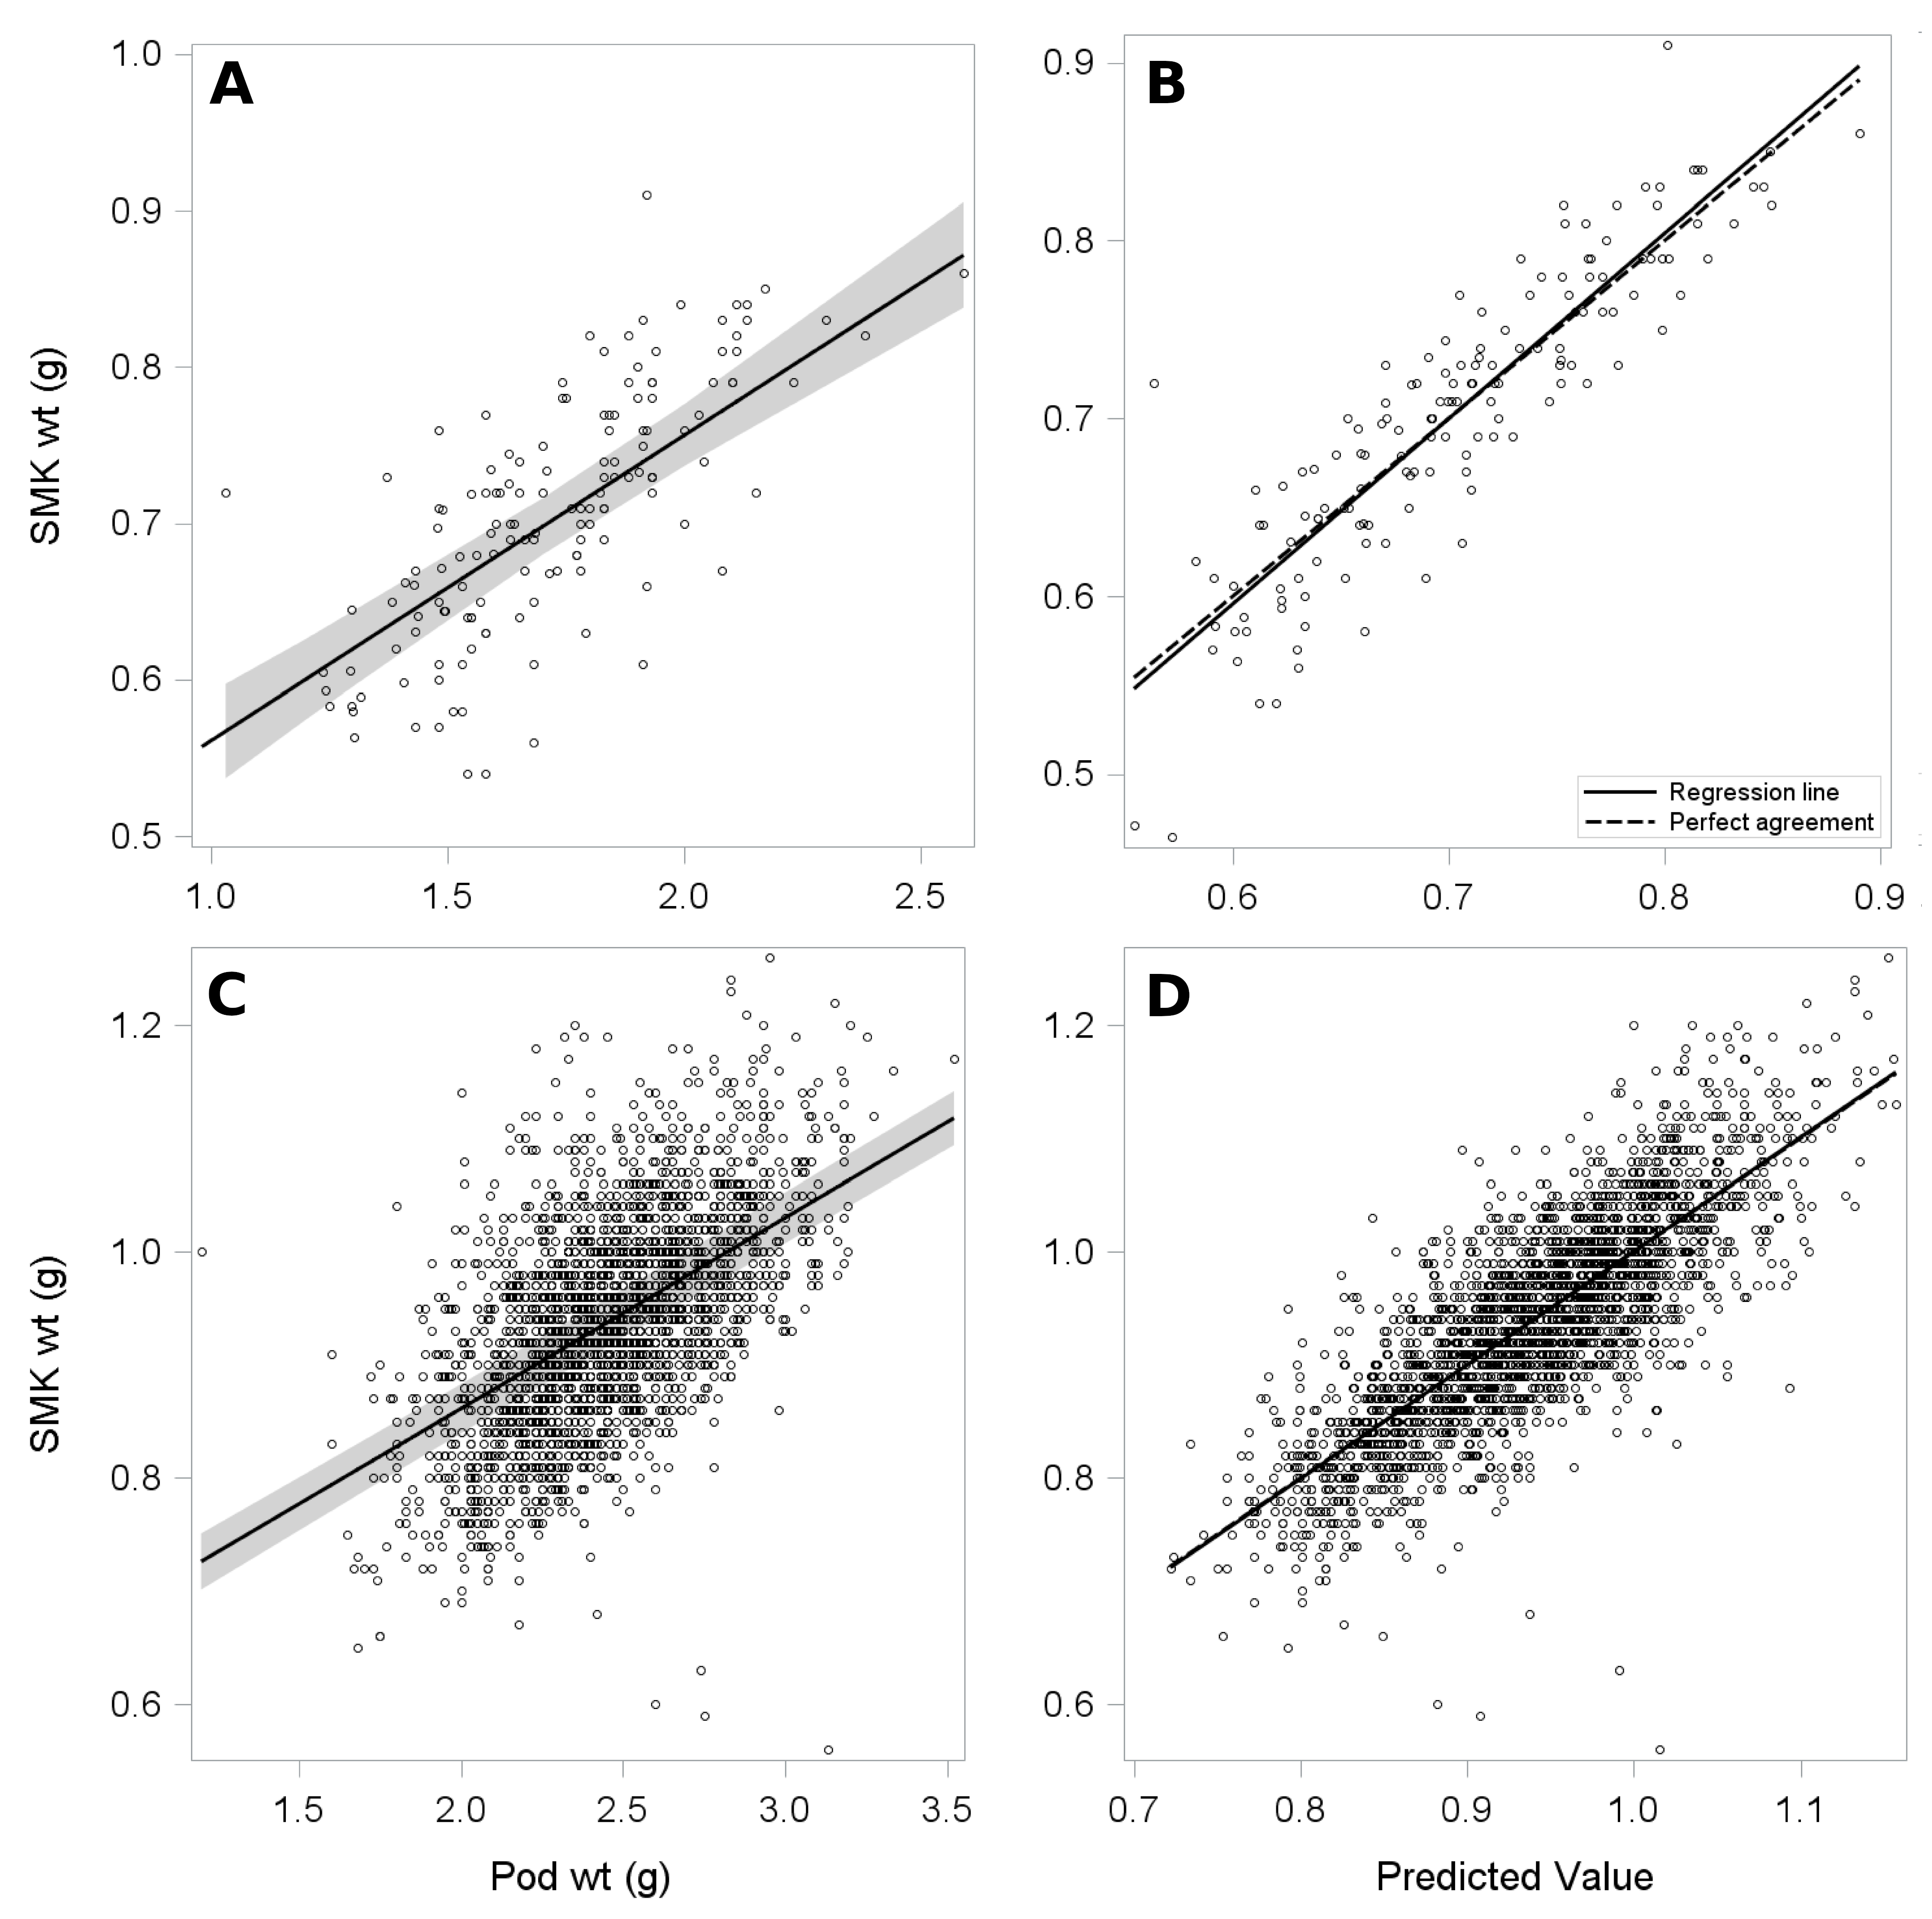
Strong linear relationships were evident for runner and Virginia market type SMK wt as a function of pod wt (Figure 3; CCC = 0.881 and 0.780, respectively). Among runner market type cultivars, SMK wt increased with pod wt at the rate of 0.195 g/g, whereas SMK wt for Virginia market type cultivars increased by 0.169 g/g (both: p < 0.001). The 95% confidence interval of the estimated SMK wt for the largest seeded runner cultivars (0.72 to 0.78 g/kernel, Florida-07 and TUFRunner ‘297′, Table 2) from the data corresponded to pod wt amounts of 1.8 to 2.1 g (Figure 3). Seed sizes from the data for runner market type samples with pod wt ≥ 1.8 g averaged 0.77 g/kernel (SE = 0.007).
Runner market-type cultivars with 75, 82, and 91 g/100 SMK were estimated to have a 50% probability of incurring 2.3, 3.3, and 4.5% greater SS than the small seeded runner-type check (e.g., 55 g/100 SMK (820 seed/lb) (Figure 4). Following standard grading rounding in calculating deduction penalties, these amounts translate to 1.8, 2.6, and 4.4 USD /1000 kg. These three kernel sizes were estimated to have an approximate 25% probability of 5.6 (5.3 USD /1000 kg), 6.8 (6.2 USD /1000 kg), and 8.2% (7.1 USD /1000 kg) increase in SS over the small seeded runner-type check, respectively (Figure 4).
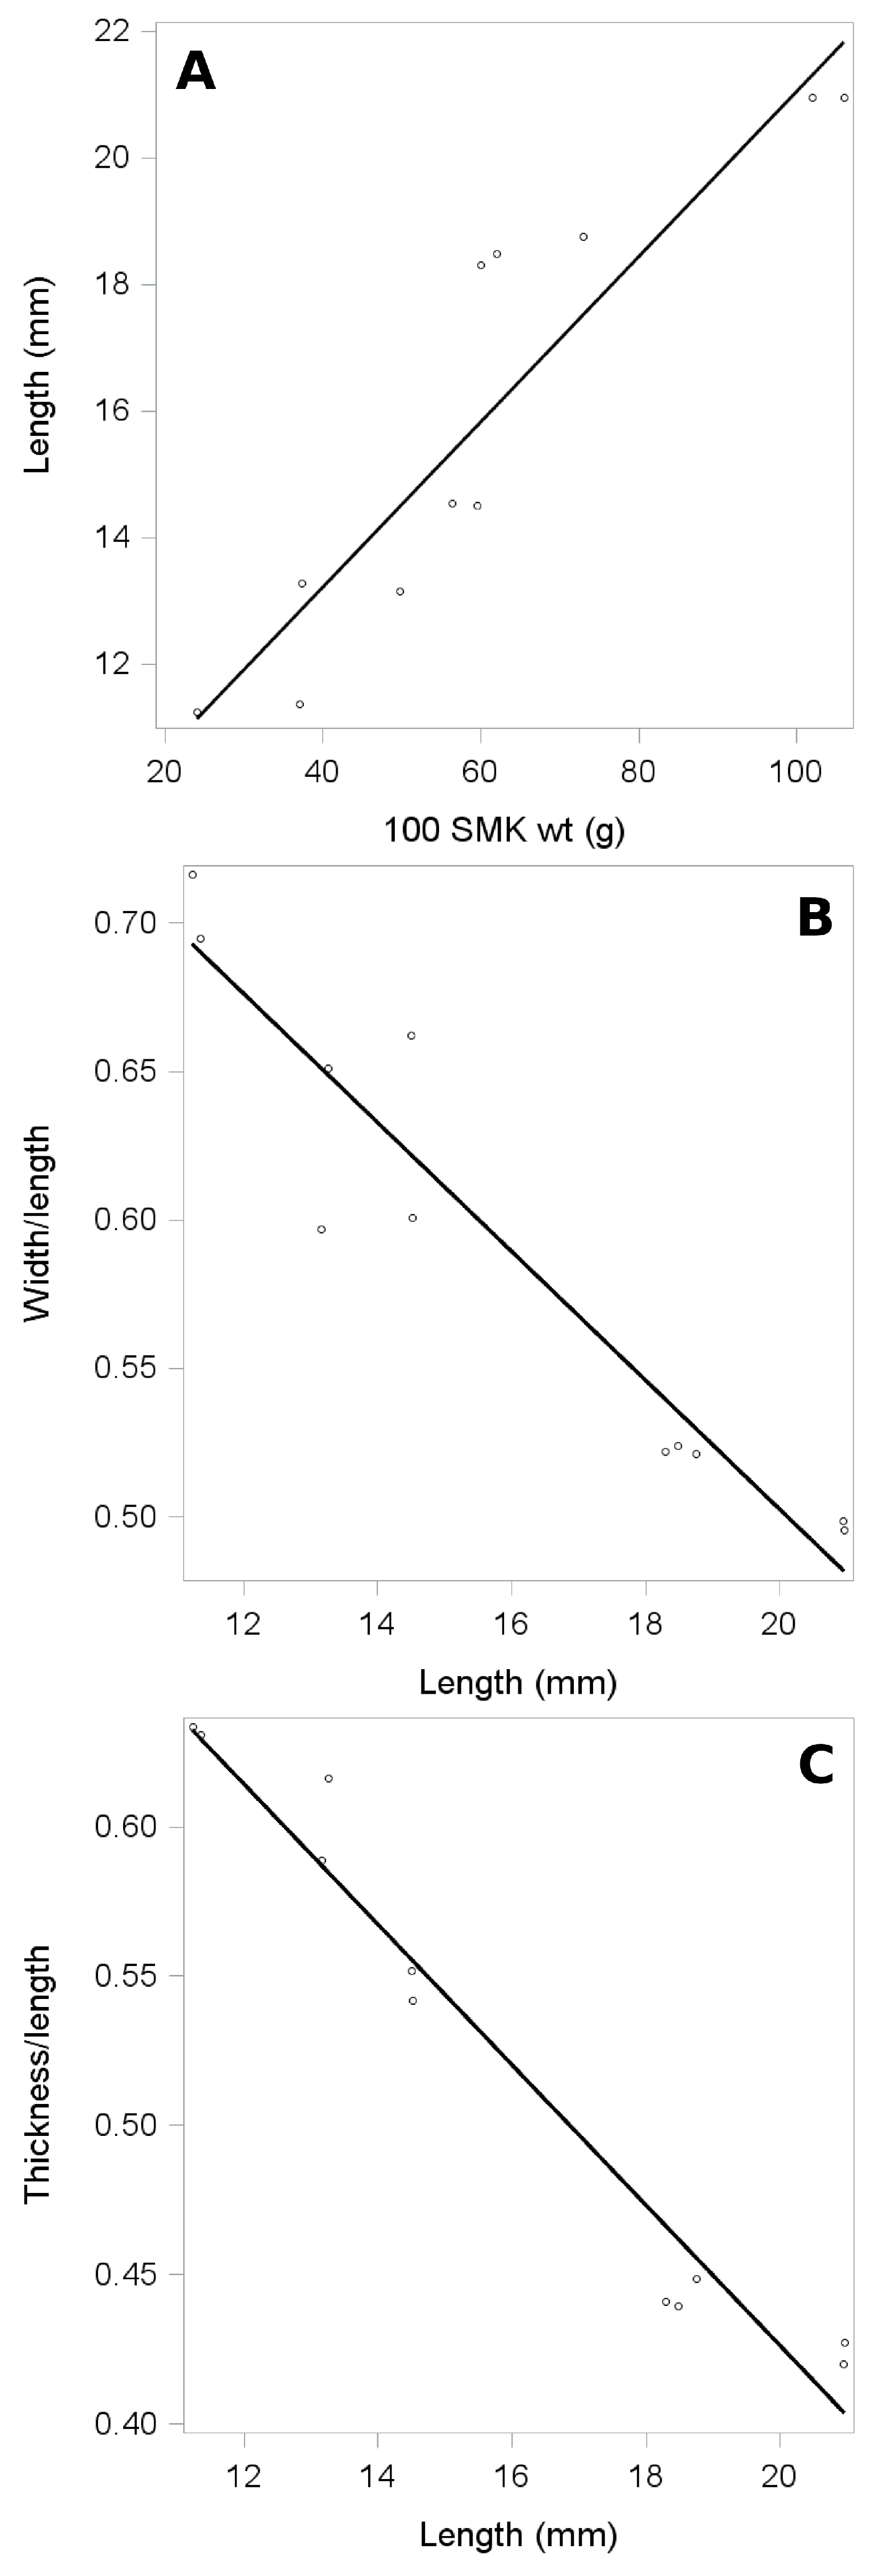
Linear robust regression models for kernel length as a function of SMK wt, and width and thickness aspect ratios predicted by kernel length were all highly significant (p < 0.001) with respective robust R2 values of 0.81, 0.83, and 0.89 (Figure 5). Mean kernel density among reported estimates was 978 kg/m3, which did not significantly vary with SMK wt (p = 0.589). Estimated kernel length, width, and thickness dimensions for selected kernel sizes calculated via SMK wt- and dimension-based regression or density were similar between the two methods and are listed in Table 4.
4. Discussion
This work documents the relationship of peanut seed size (SMK wt) to SS when runner and Virginia market type peanut were shelled on a reciprocating sheller as part of standard USDA grading practices [6]. The relationship of ELK and seed size for Virginia-type peanuts may be useful information for breeding programs. For runner market types, the negation of the linear relationship of increased SS with increasing SMK wt when processed with the Virginia-type sheller screen, as opposed to the runner-type sheller screen, has implications for grading practices, specifically for extra large seeded runner cultivars. Based on the data, the recommendation for USDA grading consideration would be for cultivar identification to be linked to each farmer stock load (at a minimum for runner market type peanut), from which references of standard kernel sizes may be used to select the screen for the reciprocating sheller. This would be more efficient compared to introducing an additional pod/seed sizing stage during the grading process. Alternatively, if cultivar identification is not adopted, a pod/seed sizing step could be added to aid in sheller screen size selection. Should this latter approach be utilized, which would lengthen the grading process, based on the results of this study we recommend farmer stock loads of runner market type pods with 100 pod wt of ≥180 g to be shelled on the reciprocating sheller using the standard Virginia-type sheller screen (or the 11.1 × 19.1 mm = 28/64 × 3/4 ″ runner-type sheller screen) to avoid increased creation of SS in the grading room and subsequent economic penalty to the farmer. A third option that could be used to avoid assigning grading-room-associated increased economic losses to a load of farmer stock peanut would be to attenuate the calculated SS deduction according to the reference SMK wt of the applicable cultivar (i.e., lowering the deduction prior to rounding by 2.3 to 4.5% for runner-type cultivars with 100 SMK wt of 75 to 91 g, respectively); this approach might be desirable for efficiency considerations, particularly for grading rooms where only one reciprocating sheller is setup or available.
Low humidity (<40%) and particularly elevated temperature (>35 to 38 °C, 95 to 100 °F) during drying have been reported to contribute to increased SS during shelling for farmer stock peanut [44,45,46] and have been associated with decreased milling quality, marketable weight, and flavor characteristics, specifically with regard to peanut harvested when immature or cured with temperature between 45 to 50 °C (113 to 122 °F) [47,48]. However, as the results of this study show, current default grading practice when extra large runners are shelled on the standard runner sheller screen actually increases the amount of SS, subsequently introducing artificial loss of value to the farmer. More than 56% of U.S. peanut produced is used for peanut butter [47,49]. For such food products where peanut kernels are crushed, the presence of SS is irrelevant. This is further documented by the sheller sale price of SS and whole kernels (mediums and jumbos) being the same [50], reflecting a disconnect between the penalty-based grading system and value-based market applications.
Although the current study did not examine runner-type peanut shelling data associated with the 11.1 × 19.1 mm (28/64 × 3/4 ″) runner-type sheller screen, the results of the kernel geometry calculations in reference to the 0.8 mm (2/64 ″) width tolerance [9] for reciprocating sheller slot width supports the viability of the 11.1 × 19.1 mm sheller screen as being large enough to avoid undue creation of SS as seen with the 10.3 × 19.1 mm sheller screen. These results are supported by kernel distribution sizing data previously reported [9,51], in which 8% of TUFRunner ‘297′ kernels and 7% of Georgia-06G kernels exceeded the width buffer allowance for the 10.3 × 19.1 mm sheller screen in 2012 and 2015, respectively, yet only 1% of each of these cultivars’ kernels exceeded the corresponding width allowance for the 11.1 × 19.1 mm sheller screen. For context, jumbo kernels for these cultivars across locations during those production years ranged from 76 to 90 g/100 SMK (599 to 506 seed/lb) and 74 to 93 g/100 SMK (615 to 487 seed/lb), respectively [9,51], kernel sizes corresponding to the range examined in Figure 4 and reported previously [22].
While extra large seeded runner-type cultivars did exhibit a greater amount of SS compared to small seeded runner-type cultivars, this was determined to be a function of the grading process and does not represent an agronomic disadvantage of such extra large seeded cultivars. Although it was outside the scope of the current study to analyze differences in yield potential or production across environments and years, ample data exists to support the overall economic advantage of newer cultivars, including the extra large seeded TUFRunner ‘297′, compared to individual cultivars that may have smaller seed. Analogously, the estimated increase in SS, while preventable based on the results of the current study via utilization of the larger sheller screen on the reciprocating sheller, had comparatively much less impact on overall economic value per ha when yield production was considered [52,53]. Nevertheless, if farmers receive a lower price as a byproduct of a grading system that has not been markedly updated in 65 years when there exists definitive remediating action at the ready (screen size swapping or SS deduction attenuation) to prevent the increased creation of splits and economic loss to the farmer, then the approach to grading farmer stock loads should be updated based on these results which reflect characteristics of modern cultivars in common commercial production today.
Author Contributions
Conceptualization, D.J.A.; methodology, D.J.A.; software, D.J.A.; validation, D.J.A.., M.B., J.C.D., and N.B.; formal analysis, D.J.A.; investigation, D.J.A., M.B., J.C.D., and N.B.; resources, D.J.A., M.B., J.C.D., and N.B.; data curation, D.J.A., M.B., J.C.D., and N.B.; writing—original draft preparation, D.J.A.; writing—review and editing, D.J.A., M.B., J.C.D., and N.B.; visualization, D.J.A.; supervision, D.J.A.; project administration, D.J.A.; funding acquisition, D.J.A. All authors have read and agreed to the published version of the manuscript.
Funding
This research was funded by South Carolina Peanut Board grant number 2013242 and GA Peanut Commission grant UGAT-26-19/21. This material is based upon work supported by NIFA/USDA, under project numbers SC-1700532 and SC-1700554.
Data Availability Statement
Not applicable.
Acknowledgments
Georgia Seed Development contributed portions of selected runner cultivar seed. Much appreciation is extended to Bryan Lawson, SCDA. Technical Contribution No. 6961 of the Clemson University Experiment Station.
Conflicts of Interest
The authors declare no conflict of interest. The funders had no role in the design of the study; in the collection, analyses, or interpretation of data; in the writing of the manuscript, or in the decision to publish the results.
References
- USDA AMS. United States Standards for Grades of Shelled Runner Type Peanuts. 1956. Available online: https://www.ams.usda.gov/sites/default/files/media/Shelled_Runner_Type_Peanuts_Standard%5B1%5D.pdf (accessed on 20 June 2021).
- USDA AMS. United States Standards for Grades of Shelled Virginia Type Peanuts. 1959. Available online: https://www.ams.usda.gov/sites/default/files/media/Shelled_Virginia_Type_Peanuts_Standard%5B1%5D.pdf (accessed on 20 June 2021).
- USDA AMS. Minimum quality and handling standards for domestic and imported peanuts marketed in the United States; Change to the quality and handling requirements. Fed. Regist. 2016, 81, 2775–2782. [Google Scholar]
- USDA FSA. Peanut Buyers and Handlers Program Guidelines; United States Department of Agriculture: Washington, DC, USA, 2018; pp. 1–118.
- USDA FSA. Peanut Premiums and Discounts for 2018 Crop Year. 2018. Available online: https://www.fsa.usda.gov/Assets/USDA-FSA-Public/usdafiles/Price-Support/pdf/2018/2018_peanuts.pdf (accessed on 20 June 2021).
- USDA AMS. Inspection Instructions for Farmers’ Stock Peanuts. 2019. Available online: https://www.ams.usda.gov/grades-standards/farmers-stock-peanut-inspection-instructions (accessed on 20 June 2021).
- Anco, D.; Thomas, J.S.; Marshall, M.; Kirk, K.R.; Smith, N. Peanut Money-Maker 2019 Production Guide, Circular; Clemson University Extension: Clemson, SC, USA, 2019; p. 588. [Google Scholar]
- Chu, Y.; Chee, P.; Isleib, T.G.; Holbrook, C.C.; Ozias-Akins, P. Major seed size QTL on chromosome A05 of peanut (Arachis hypogaea) is conserved in the US mini core germplasm collection. Mol. Breed. 2020, 40, 6. [Google Scholar] [CrossRef] [Green Version]
- USDA ARS. Uniform Peanut Performance Tests 2012–Shelling & Physical Properties. 2012. Available online: https://www.ars.usda.gov/ARSUserFiles/60440500/UPPT_2012.pdf (accessed on 20 June 2021).
- Isleib, T.G.; Holbrook, C.C.; Gorbet, D.W. Use of plant introductions in peanut cultivar development. Peanut Sci. 2001, 28, 96–113. [Google Scholar] [CrossRef]
- Carver, W.A.; Hull, F.H. Dixie Runner peanuts. Florida Agric. Exp. Sta. Circ. 1950, S-16, 3. [Google Scholar]
- Carver, W.A.; Hull, F.H.; Clark, F. The Early Runner peanut variety. Florida Agric. Exp. Sta. Circ. 1952, S-52, 4. [Google Scholar]
- Blackstone, J.H. Peanut production practices in southeastern Alabama. Agricultural Experiment Station of the Alabama Polytechnic Institute. Circular 1952, 3, 108. [Google Scholar]
- McGraw, R.L. Yield Physiology of Peanuts (Arachis hypogaea L.). Ph.D. Dissertation, University of Florida, Gainesville, FL, USA, 1979. [Google Scholar]
- Norden, A.J.; Lipscomb, R.W.; Carver, W.A. Registration of Florunner peanuts (Reg. No. 2). Crop Sci. 1969, 9, 850. [Google Scholar] [CrossRef]
- Branch, W.D. Registration of ‘Georgia Green’ peanut. Crop Sci. 1996, 36, 806. [Google Scholar] [CrossRef]
- Culbreath, A.K.; Todd, J.W.; Demski, J.W. Productivity of Florunner peanut infected with tomato spotted wilt virus. Peanut Sci. 1992, 19, 11–14. [Google Scholar] [CrossRef]
- Norden, A.J. Effect of curing method on peanut seed quality. Peanut Sci. 1975, 2, 33–37. [Google Scholar] [CrossRef]
- UGA. UGA Peanut Production 2020 Quick Reference Guide. UGA Extension AP-118. 2020. Available online: https://peanuts.caes.uga.edu (accessed on 20 June 2021).
- Branch, W.D. Registration of ‘Georgia-06G’ peanut. J. Plant. Reg. 2007, 1, 120. [Google Scholar] [CrossRef]
- Gorbet, D.W.; Tillman, B.L. Registration of ‘Florida-07′ peanut. J. Plant. Reg. 2009, 3, 14–18. [Google Scholar] [CrossRef]
- Tillman, B.L. Registration of ‘TUFRunner ‘297′’ peanut. J. Plant Regist. 2018, 12, 31–34. [Google Scholar] [CrossRef]
- Tillman, B.L.; Gorbet, D.W. Registration of ‘TUFRunner ‘511′’ peanut. J. Plant Regist. 2017, 11, 235–239. [Google Scholar] [CrossRef]
- Knauft, D.A.; Norden, A.J.; Gorbet, D.W. Principles of Cultivar Development; Fehr, W.A., Peanut, P., Eds.; McMillan: New York, NY, USA, 1987; Volume 2, pp. 346–384. [Google Scholar]
- Balota, M.; Dunne, J.; Cazenave, A.B.; Anco, D. Peanut Variety and Quality Evaluation Results, 2018: I. Agronomic and Grade Data; Information Series 512; Virginia Polytechnic Institute and State University, Tidewater Agricultural Research and Extension Center: Suffolk, VA, USA, 2019. [Google Scholar]
- Coker, D.L.; Shokes, F.M. Peanut Variety and Quality Evaluation Results, 2006: I. Agronomic and Grade Data; Information Series 483; Virginia Polytechnic Institute and State University, Tidewater Agriculture Research and Extension Center: Suffolk, VA, USA, 2007. [Google Scholar]
- Mozingo, R.W.; Coffelt, T.A.; Phipps, P.M.; Coker, D.L. Registration of ‘CHAMPS’ peanut. Crop Sci. 2006, 46, 2711–2712. [Google Scholar] [CrossRef] [Green Version]
- Shokes, F.M.; Isleib, T.G.; Chapin, J.W. Peanut Variety and Quality Evaluation Results, 2007: I. Agronomic and Grade Data; Information Series No. 485; Virginia Polytechnic Institute and State University, Tidewater Agriculture Research and Extension Center: Suffolk, VA, USA, 2008. [Google Scholar]
- Balota, M.; Jordan, D.; Langston, D.; Shortridge, J.; Taylor, S. 2021 Virginia Peanut Production Guide; Virginia Cooperative Extension: Suffolk, VA, USA, 2021. [Google Scholar]
- Jordan, D.L.; Brandenburg, R.L.; Brown, A.B.; Buol, G.; Foote, B.; Roberson, G.T.; Shew, B.; Washburn, D. 2021 Peanut Information; NC State Extension: Raleigh, NC, USA, 2021. [Google Scholar]
- Lin, L.I.-K. A concordance correlation coefficient to evaluate reproducibility. Biometrics 1989, 45, 255–268. [Google Scholar] [CrossRef]
- Branch, W.D. Registration of ‘Georgia-13M’ peanut. J. Plant Reg. 2014, 8, 253–256. [Google Scholar] [CrossRef]
- Anco, D.J.; Thomas, J.S.; Monfort, S.W. Efficacy and profitability of insecticide treatments for tomato spotted wilt management on peanut in South Carolina. Plant Dis. 2020, 104, 1096–1104. [Google Scholar] [CrossRef]
- Madden, L.V.; Paul, P.A. Meta-analysis for evidence synthesis in plant pathology: An overview. Phytopathology 2011, 101, 16–30. [Google Scholar] [CrossRef] [PubMed] [Green Version]
- Paul, P.A.; Lipps, P.E.; Hershman, D.E.; McMullen, M.P.; Draper, M.A.; Madden, L.V. Efficacy of triazole-based fungicides for Fusarium head blight and deoxynivalenol control in wheat: A multivariate meta-analysis. Phytopathology 2008, 98, 999–1011. [Google Scholar] [CrossRef] [PubMed] [Green Version]
- van Houwelingen, H.C.; Arends, L.R.; Stijnen, T. Advanced methods in meta-analysis: Multivariate approach and meta-regression. Stat. Med. 2002, 21, 589–624. [Google Scholar] [CrossRef]
- Madden, L.V.; Piepho, H.-P.; Paul, P.A. Statistical models and methods for network meta-analysis. Phytopathology 2016, 106, 792–806. [Google Scholar] [CrossRef] [Green Version]
- Aydin, C. Some engineering properties of peanut and kernel. J. Food Eng. 2007, 79, 810–816. [Google Scholar] [CrossRef]
- Bagheri, I.; Payman, S.H.; Rahimi-Ajdadi, F. Mechanical behavior of peanut kernel under compression loading as a function of moisture contents. Elixir Agric. 2011, 36, 3552–3557. [Google Scholar]
- Ghanem, T.H.; Shetawy, M.E.-S.; Zaalouk, A.K. Physical properties of hulled peanuts and kernels. MISR J. Agric. Eng. 2009, 26, 1598–1609. [Google Scholar] [CrossRef]
- Gojiya, D.K.; Dobariya, U.D.; Pandya, P.A.; Gojiya, K.M. Studies on physical properties of peanut seed. Acta Sci. Agric. 2020, 4, 1–5. [Google Scholar] [CrossRef]
- Hoque, M.A. Physical and engineering properties of BARI released three groundnut varieties. Bangladesh J. Agril. Res. 2019, 44, 609–620. [Google Scholar] [CrossRef] [Green Version]
- Nelson, S.O. Dimensional and density data and relationships for seeds of agricultural crops. Seed Technol. 2002, 24, 76–88. [Google Scholar]
- Blankenship, P.D.; Person, J.L. Effects of restoring peanut moisture with aeration before shelling. Peanut Sci. 1974, 1, 99–104. [Google Scholar] [CrossRef]
- Bloome, P.D.; Allen, W.S. Comparisons of low temperature with commercial curing of peanuts. J. Amer. Peanut Res. Educ. Assoc. 1974, 6, 41–44. [Google Scholar]
- Bloome, P.D.; Kletke, D.D.; Sholar, J.R. Comparisons of on-farm peanut drying systems in the southwest. Peanut Sci. 1983, 10, 69–72. [Google Scholar] [CrossRef]
- St. Angelo, A.J.; Arant, F.S.; Bass, M.H.; Buchanan, G.A.; Cobb, W.Y.; Cox, F.R.; Davidson, J.M.; Dickens, J.W.; Diener, U.L.; Garren, K.H.; et al. Peanuts–Culture and Uses; American Peanut Research and Education Association, Inc.: Stillwater, OK, USA, 1973. [Google Scholar]
- Singleton, J.A.; Pattee, H.E.; Johns, E.B. Influence of curing temperature on the volatile components of peanuts. J. Am. Peanut Res. Educ. Assoc. 1969, 1, 99. [Google Scholar] [CrossRef]
- USDA NASS. USDA NASS. 2021. Available online: http://www.nass.usda.gov/ (accessed on 20 June 2021).
- Zimmer, K.; (Premium Peanut, Douglas, GA, USA); Izmirlian, A.; (Alimenta Agri, Alpharetta, GA, USA). Personal communication, 2021.
- USDA ARS. Uniform Peanut Performance Tests 2015–Shelling & Physical Properties. 2015. Available online: https://www.ars.usda.gov/ARSUserFiles/60440500/UPPT_2015.pdf (accessed on 20 June 2021).
- Anco, D.J.; Hiers, J.B. Peanut (Arachis hypogaea L.) cultivar pod yield production in South Carolina. Peanut Sci. 2021. submitted. [Google Scholar]
- Branch, W.D.; Balota, M.; Isleib, T.G.; Dunne, J.C.; Anco, D.J.; Balkcom, K.; Chen, C.Y.; Tillman, B.L.; Burow, M.D.; Baring, M.R.; et al. Uniform Peanut Performance Tests 2018; University of Georgia: Tifton, GA, USA, 2019. [Google Scholar]
Figure 1.
(A,C,E) Proportion sound splits (SS) predicted by sound mature kernel (SMK) wt (g/kernel) for (A,C) runner market types shelled with a (A) runner-type or a (C) Virginia-type sheller screen and (E) Virginia market types shelled with a Virginia-type sheller screen on a reciprocating sheller. Corresponding plots of observed versus predicted proportion sound splits are shown in panels (B,D,F), respectively. (A) Where the estimated slope parameter was significant, the shaded band corresponds to the 95% confidence interval. Predictions were estimated according to the following function with a beta distribution for the response: SSij = b × SMKwti + I + Sj + eij. Sj and eij were the random effect of study and the residual, respectively. Estimated slope (b) and intercept (I) model-scale parameters, slope, and intercept parameter p values, study variance (Sj), and concordance correlation coefficients for each model were (A,B) 1.16, −2.80, <0.001, <0.001, 0.161, and 0.775, (C,D) −0.222, −3.475, 0.687, <0.001, 0.398, and 0.930, and (E,F) 0.00957, −3.145, 0.939, <0.001, 0.413, and 0.854.

Figure 2.
(A) Proportion extra large kernels (ELK) predicted by sound mature kernel (SMK) wt (g/kernel) for Virginia market types shelled with a Virginia-type sheller screen on a reciprocating sheller. Corresponding observations versus predicted ELK are shown in panel (B) The shaded band corresponds to the 95% confidence interval. Predictions were estimated according to the following function with a beta distribution for the response: ELKij = b × SMKwti + I + Sj + eij. Sj and eij were the random effect of study and the residual, respectively. The estimated slope (b) and intercept (I) model-scale parameters, slope and intercept parameter p values, study variance (Sj), and concordance correlation coefficient were 1.909, −2.190, <0.001, <0.001, 0.105, and 0.804.

Figure 3.
Estimated sound mature kernel (SMK) wt (g/kernel) predicted by corresponding pod weight (g/pod) for (A) runner and (C) Virginia market types. Corresponding observations plotted against predictions are in panels (B,D), respectively. Bands represent the 95% confidence interval. Predictions were estimated according to the following function: SMKwtij = b × podwti + I + Sj + eij. Sj and eij were the random effect of study and the residual, respectively. The estimated slope (b) and intercept (I) parameters, slope and intercept parameter p values, study variance (Sj), and concordance correlation coefficients were (A) 0.195, 0.366, <0.001, <0.001, 0.00148, and 0.881 and (C) 0.169, 0.523, <0.001, <0.001, 0.00275, and 0.780.

Figure 4.
Estimated probability of increased sound splits (SS) and corresponding SS deduction following shelling runner market type pods with a standard runner-type sheller screen on a reciprocating sheller for genotypes with sound mature kernels (SMK) sized 75, 82, and 91 g/kernel (605, 550, and 500 seed/lb, respectively) compared to 55 g/kernel (820 seed/lb). Selected sizes were based on estimated means from the current study and values reported in cultivar registrations for extra-large (e.g., TUFRunner ‘297′ and Florida-07) and small-seeded (e.g., Georgia-13M) runner-type cultivars.

Figure 5.
Estimated (A) kernel length predicted by 100 sound mature kernel (SMK) wt and (B) width and (C) thickness aspect ratios predicted by kernel length. Respective slope and intercept parameter estimates, corresponding p values, and model robust R2 were: (A) 0.131, 7.982, <0.001, <0.001, and 0.809, (B) −0.0217, 0.937, <0.001, <0.001, and 0.828, and (C) −0.0235, 0.897, <0.001, <0.001, and 0.886.


Table 1.
Number of studies and years within datasets for models to predict proportion sound splits (SS), proportion extra large kernels (ELK), and sound mature kernel (SMK) wt (g) as functions of 100 SMK wt (SS and ELK models) or pod wt (g).
Table 1.
Number of studies and years within datasets for models to predict proportion sound splits (SS), proportion extra large kernels (ELK), and sound mature kernel (SMK) wt (g) as functions of 100 SMK wt (SS and ELK models) or pod wt (g).
| Model Response | Studies | Years |
|---|---|---|
| SSrunner types on runner screen | 43 | 14 |
| SSrunner types on Virginia screen | 24 | 8 |
| SSVirginia types on Virginia screen | 133 | 16 |
| ELKVirginia types | 133 | 16 |
| SMKwtrunner types | 25 | 10 |
| SMKwtVirginia types | 26 | 9 |
Table 2.
Runner market type cultivar 100 sound mature kernel (SMK) weight and corresponding number of seed per pound estimated from field trials conducted in North and South Carolina.
Table 2.
Runner market type cultivar 100 sound mature kernel (SMK) weight and corresponding number of seed per pound estimated from field trials conducted in North and South Carolina.
| Cultivar | 100 SMK wt (g) | Seed Per Pound | ||||||
|---|---|---|---|---|---|---|---|---|
| Estimate | 95% CIl 1 | 95% CIu | Estimate | 95% CIl | 95% CIu | Studies | Years | |
| ACI 3321 | 71.5 | 67.6 | 75.4 | 634 | 671 | 601 | 4 | 3 |
| AU-NPL 17 | 71.0 | 67.1 | 74.9 | 639 | 676 | 605 | 5 | 3 |
| Florida-07 | 74.6 | 71.7 | 77.5 | 608 | 632 | 585 | 21 | 7 |
| FloRun 107 | 67.5 | 61.6 | 73.4 | 672 | 737 | 618 | 6 | 3 |
| FloRun 157 | 66.4 | 63.4 | 69.4 | 683 | 716 | 654 | 11 | 4 |
| FloRun 331 | 67.9 | 65.2 | 70.6 | 668 | 695 | 643 | 14 | 4 |
| Georgia-06G | 72.4 | 69.9 | 74.9 | 626 | 648 | 606 | 23 | 9 |
| Georgia-09B | 66.0 | 63.4 | 68.6 | 688 | 716 | 662 | 21 | 9 |
| Georgia-12Y | 62.9 | 59.9 | 65.8 | 722 | 757 | 690 | 7 | 4 |
| Georgia-13M | 55.6 | 51.6 | 59.5 | 816 | 878 | 762 | 4 | 4 |
| Georgia-14N | 58.3 | 54.8 | 61.8 | 778 | 827 | 734 | 3 | 3 |
| Georgia-16HO | 71.2 | 68.4 | 74 | 637 | 663 | 613 | 9 | 5 |
| Georgia-18RU | 66.9 | 64.1 | 69.8 | 678 | 708 | 650 | 7 | 3 |
| Georgia Green | 65.8 | 61.9 | 69.7 | 690 | 733 | 651 | 10 | 5 |
| TUFRunner ‘297′ | 75.0 | 72.2 | 77.8 | 605 | 628 | 583 | 16 | 6 |
| TUFRunner ‘511′ | 73.8 | 71.1 | 76.5 | 615 | 638 | 593 | 18 | 6 |
| TUFRunner ‘727′ | 71.9 | 66.2 | 77.6 | 631 | 685 | 585 | 6 | 3 |
| TifNV-High O/L | 70.0 | 66.4 | 73.5 | 648 | 683 | 617 | 4 | 2 |
1 95% CIl and CIu, respectively, are the lower and upper 95% confidence intervals.
Table 3.
Virginia market type cultivar 100 sound mature kernel (SMK) weight and corresponding number of seed per pound estimated from field trials conducted in North and South Carolina.
Table 3.
Virginia market type cultivar 100 sound mature kernel (SMK) weight and corresponding number of seed per pound estimated from field trials conducted in North and South Carolina.
| Cultivar | 100 SMK wt (g) | Seed Per Pound | ||||||
|---|---|---|---|---|---|---|---|---|
| Estimate | 95% CIl 1 | 95% CIu | Estimate | 95% CIl | 95% CIu | Studies | Years | |
| Bailey | 90.1 | 87.7 | 92.5 | 503 | 517 | 490 | 39 | 12 |
| Bailey II | 92.3 | 89.6 | 95.0 | 491 | 506 | 478 | 25 | 8 |
| Brantley | 94.5 | 89.5 | 99.4 | 480 | 507 | 456 | 6 | 2 |
| CHAMPS | 95.6 | 92.6 | 98.7 | 474 | 490 | 460 | 18 | 7 |
| Contender | 93.9 | 90.2 | 97.6 | 483 | 503 | 465 | 3 | 3 |
| Emery | 95.4 | 92.7 | 98.1 | 476 | 490 | 462 | 31 | 11 |
| FL Fancy | 92.7 | 87.7 | 97.7 | 489 | 517 | 464 | 9 | 3 |
| Gregory | 94.5 | 91.1 | 98.0 | 480 | 498 | 463 | 18 | 6 |
| N.C. 20 | 91.0 | 87.8 | 94.2 | 498 | 517 | 481 | 16 | 7 |
| NC-V11 | 83.6 | 80.5 | 86.6 | 543 | 563 | 524 | 16 | 6 |
| Perry | 88.6 | 84.5 | 92.6 | 512 | 537 | 490 | 12 | 4 |
| Phillips | 90.4 | 86.3 | 94.5 | 502 | 526 | 480 | 12 | 4 |
| Sugg | 97.0 | 94.4 | 99.5 | 468 | 480 | 456 | 27 | 9 |
| Sullivan | 87.1 | 84.8 | 89.4 | 521 | 535 | 508 | 32 | 11 |
| Walton | 88.8 | 86.4 | 91.3 | 511 | 525 | 497 | 4 | 2 |
| Wynne | 97.5 | 94.8 | 100.2 | 465 | 478 | 453 | 27 | 9 |
1 95% CIl and CIu, respectively, are the lower and upper 95% confidence intervals.
Table 4.
Length (L), thickness (T), width (W), and aspect ratios for width (W/L) and thickness (T/L) estimated for selected extra large seeded runner market type sizes as linear functions of sound mature kernel (SMK) wt or density.
Table 4.
Length (L), thickness (T), width (W), and aspect ratios for width (W/L) and thickness (T/L) estimated for selected extra large seeded runner market type sizes as linear functions of sound mature kernel (SMK) wt or density.
| Dimension-SMK wt-Based | Density-Based | ||||||||
|---|---|---|---|---|---|---|---|---|---|
| SMK wt (g) | L (mm) | T (mm) | W (mm) | W/L | T/L | V (mm3) 1 | L (mm) | T (mm) | W (mm) |
| 75 | 17.8 | 8.5 | 9.8 * | 0.55 | 0.48 | 767 | 17.7 | 8.6 | 9.7 * |
| 82 | 18.7 | 8.6 | 9.9 * | 0.53 | 0.46 | 838 | 18.6 | 8.7 | 9.9 * |
| 91 | 19.9 | 8.5 | 10.0 * | 0.51 | 0.43 | 930 | 19.9 | 8.9 | 10.1 * |
1 Kernel volume (V) was approximated as an ellipsoid: V = 1/6·π·L·W·T based on 978 kg/m3 density; * = kernel W exceeding 0.8 mm (2/64 ″) tolerance (i.e., 9.5 mm) for the standard runner-type sheller screen slot size W allowance per [9] (i.e., slot size for the red pan from the pre-sizer = 10.3 × 19.1 mm (26/64 × 3/4 ″)).
Publisher’s Note: MDPI stays neutral with regard to jurisdictional claims in published maps and institutional affiliations. |
© 2021 by the authors. Licensee MDPI, Basel, Switzerland. This article is an open access article distributed under the terms and conditions of the Creative Commons Attribution (CC BY) license (https://creativecommons.org/licenses/by/4.0/).
Share and Cite
MDPI and ACS Style
Anco, D.J.; Balota, M.; Dunne, J.C.; Brown, N. Sound Splits as Influenced by Seed Size for Runner and Virginia Market Type Peanut Shelled on a Reciprocating Sheller. Agronomy 2021, 11, 1869. https://doi.org/10.3390/agronomy11091869
AMA Style
Anco DJ, Balota M, Dunne JC, Brown N. Sound Splits as Influenced by Seed Size for Runner and Virginia Market Type Peanut Shelled on a Reciprocating Sheller. Agronomy. 2021; 11(9):1869. https://doi.org/10.3390/agronomy11091869
Chicago/Turabian StyleAnco, Daniel J., Maria Balota, Jeffrey C. Dunne, and Nino Brown. 2021. "Sound Splits as Influenced by Seed Size for Runner and Virginia Market Type Peanut Shelled on a Reciprocating Sheller" Agronomy 11, no. 9: 1869. https://doi.org/10.3390/agronomy11091869
Note that from the first issue of 2016, this journal uses article numbers instead of page numbers. See further details here.