1. Introduction
Elaeis guineensis Jacq (African oil palm) is mostly found along the coast of its native land including Sierra Leone, Guinea, Liberia, Ghana, Nigeria, Cameroon, Tanzania, Ivory Coast, Angola, and Guinea Bissau [
1]. Oil palm is the highest oil-producing crop among all oilseed crops, which accounted for over 40% of total edible oil production [
2]. In Malaysia, African oil palm is considered as the backbone of the oil palm industry. Hence, it is nicknamed as ‘‘a gift of nature,” and its oil is called “the Golden Oil” [
3]. In Ghana, oil palm is a major economic crop that accounts for more than 75 percent of its export revenue and will remain one of the leading contributors for years to come [
4]. Oil palm has changed from a survival cropping system to pure commercial production due to its importance to the growing populations of African and Southeast Asia countries. Oil palm alone accounts for 19.04 million hectares (ha) of total cultivated area (0.36% agricultural land) worldwide [
5]; the palm oil and kernel oil contribute approximately one-third (34%) of global fats and oils production, hence, world population growth has been supported by the high productivity of oil palm [
5]. Therefore, its importance cannot be overemphasized. Currently, palm oil-producing countries like Sierra Leone, Nigeria, Colombia, Thailand, Malaysia, and Indonesia face declining oil palm fruit set (FS). The continuous decline in fresh fruit bunch (FFB) and oil yield may result from a decline in the oil palm fruit set, which is a great concern among Malaysia oil palm growers. Low fruit set and increased ISR range from 70% to 90% have been reported in several places across Malaysia [
6]. As a result, fresh fruit bunch yield has significantly declined from 17.16 tons(t) ha
−1 in 2018 to 17.89 t ha
−1 in 2017 [
7]. Breure [
8] reported that ISR is a key yield-determining factor and an important selection criterion in a breeding program. In progeny evaluation for fruit set, ISR is undisputedly essential. Progenies may differ in their performance due to their genetic structure. Hence, it is significant that biparental progenies are examined. The Malaysian Palm Oil Board (MPOB) [
9] reported 65% to 70% could be the range of a healthy sex ratio. This is supported by the report of the International Society of Oil Palm Agronomist (ISOPA) [
10] that the normal fruit set should be greater than 60%.
However, sufficient viable pollen supply by male inflorescences and pollination activities primarily depend on the availability of male flowers. Norman et al. [
6] reported inadequate pollen availability due to insufficient male flower production and breeding sites for the pollinating insects. Therefore, decreased male inflorescence production led to insufficient pollen availability and decreased the efficiency of pollinating weevils. Variations in any of these may result in an increase or decrease in fruit set level and fresh fruit bunch coupled with oil yield. Harun and Noor [
11] reported that poor fruit set occurred due to insufficient pollination, hence bunch failure consequently rose, resulting in the ultimate loss in oil yield.
In 1981, the weevil,
Elaeidobius kamerunicus from Cameroon, was introduced into Malaysia to increase oil palm plantations’ pollination efficiency. Later, the weevil population increased and spread rapidly to Sarawak, Sabah and throughout Peninsula Malaysia [
6]. Earlier researchers and oil palm growers had implemented several other measures such as assisted hand-pollination and efficient oil palm pollinator weevils to combat declining fruit set. After introducing
E. kamerunicus in Malaysia oil palm plantations, an increase in fruit set from 50 to 70 percent was achieved, which led to an increase in fruit to bunch and fruit bunch weight [
11]. Even though Malaysia palm plantations are largely cultivated with improved planting materials, the decline in the oil palm fruit set is still prevalent, which is contributing to decreasing oil yield, value, and export. Against this background, we hypothesized that the inflorescence sex ratio and fruit set differ between different oil palm D (
dura) × P (
pisifera) progenies, given the present yield decline in the palm fruit set cultivated on peat soil. The inflorescence sex ratio and fruit set ratio among D × P biparental progenies cultivated on fibric peat soil were compared in this current study.
3. Results
3.1. Fruit Set Ratio, Inflorescence Sex Ratio, and Its Components
Analysis of variance among the 24 biparental progenies showed highly significant differences in male inflorescence (M), female inflorescence (F), the abortion rate (AB), average bunch weight (ABW), fruit to bunch (FTB), fruit set ratio (FSR), and sex ratio (ISR) (
Table 2). The significant differences among the progenies showed a substantial quantity of genetic variations, which can be further exploited for future oil palm breeding programs. However, the results indicated no significant difference among the replications in all the traits except for ABW, which was found to be statistically significant.
Based on variance components, the results showed greater genetic distinctions among the progenies. The lowest variance component was manifested by error variance (σ2e) ranging from 8.24% to 72.32%. Among the nine traits analyzed, four of the traits (M, F, AB, and ISR) were influenced by σ2e, which suggested that environmental effects played more roles in M, F, AB, and ISR production. The highest variance component was observed in genetic variance (σ2g) and varied from 27.68% in F production to 91.76% in FSR, which suggested that the performance of ABW, FF, PCF, FTB, and FSR traits could be possibly attributed to genetic effects.
3.2. Female and Male Inflorescences Production and Abortion Rate among Biparental Progenies
The performance of genetic origins of 24 D × P progenies for all the evaluated traits is presented in
Table 3, which shows highly significant differences (
p ≤ 0.01) based on Duncan’s new multiple range test (DNMRT). The production of F ranged in performance from 13.60 to 19.55 palm
−1 yr
−1 with a trial mean of 16.38 palm
−1 yr
−1, of which 45.83% of the progenies performed above the trial mean. DNMRT at a 5% level of probability showed that progeny PK4651 had the highest female production, followed by PK4465; however, PK4651 had no significant differences with 37.5% or nine out of 24 progenies for F production (
Table 3). In the production stage of oil palm yield, both sexes play significant roles in an increase in palm fruit set for better FFB yield and oil yield. The analysis showed that progeny PK4841 with mean value of 5.85 palm
−1 yr
−1 had the highest M production, followed by PK4118 and ECPHP415, while PK4621 produced the lowest mean value of 1.40 palm
−1 yr
−1. However, no significant difference was observed in progeny PK4841 with 41.67% of the progenies for M production (
Table 3). The male production for individual biparental progenies had a trial mean of 3.34 palm
−1 yr
−1, of which 45.83% of the progenies were above the trial mean, and the M production ranged from 1.40 to 5.85 palm
−1 yr
−1 (
Table 3).
The lowest AB rate for the progenies was found in PK4651 with a mean value of 1.20 palm
−1 yr
−1, and progeny PK4548 had the highest at 4.95 palm
−1 yr
−1. The DNMRT proved that 54.17% of the biparental progenies were above the trial mean of 3.15 palm
−1 yr
−1. The present results indicate that the abortion rate among the progenies was low. However, for 54.17% of the progenies, the abortion rate recorded was higher than the rate obtained for production of male flowers. (
Table 3). The oil palm INF could be male after shaking, female after a fling, or hermaphrodite flower after boiling. The present study established that 54.17% of the progenies had ISR above the trial mean of 83.93% and ranged in performance from 72.22% to 90.20%. No significant difference was observed among progenies PK4621, PK4529, PK4539, and PK4548 at 92.12%, 90.74%, 90.58%, and 90.20%, respectively, for ISR, and they recorded the highest. Even though these progenies recorded the highest ISR, in terms of good and healthy oil palm sex ratio, they were regarded as the poor-performance progenies for ISR. The lowest ISR was recorded in progeny PK4841 with a mean value of 72.22%, and it was regarded as the best based on the range of good and healthy sex ratio. High ISR was prevalent among the progenies and contributed to the decline in oil palm fruit set, which could be as a result of low male production.
Accordingly, based on the results obtained in this current study, the trial mean for ISR was above the normal range and 20.83%, or five progenies (PK4841, PK4674, ECPHP415, ECPHP550, and PK4118) out of 24, had good ISR (
Table 3). The good performance in ISR enhanced progeny PK4674 to have the highest fruit set ratio and FTB. Therefore, progeny PK4674 can be used for future breeding and selection programs to widen the narrow oil palm genetic base.
Poor fruit set, coupled with a decrease in oil yield, is one of the consequences currently faced by oil palm growers in Malaysia, which could be due to inefficient pollination and bunch failure. The ABW had a trial mean value of 7.15 kg bunch
−1 and varied from 4.43 to 14.09 kg bunch
−1 among the progenies, in which 10 had ABW greater than the trial mean. However, the least ABW was observed in PK4539 and PK4529, with no significant difference between them. Progeny PK4674 recorded the highest ABW, and this was significantly different to all the other progenies analyzed (
Table 3).
The trial means performance for FTB was 330.98 fruits bunch
−1 and had a range of 273.07 to 393.63 fruits bunch
−1 with 41.67% of the progenies above the trial average value. The DNMRT showed that progeny PK4482 had the highest FTB with no significant difference with progenies ECPHP415, ECPHP550, PK4674 PK4465, PK4118 PK4474, and ECPHP500 (
Table 3).
The trial means performance for both FF and PCF was 165.37 and 165.61 fruits bunch
−1, respectively. The FF ranged between 103.73 and 255.17 fruits bunch
−1, while PCF among the progenies ranged between 128.13 and 225.35 fruits bunch
−1. The DNMRT showed that progeny PK4674 recorded the highest FF; however, there were no significant differences with progenies PK4465 and PK4482 for FF, while the lowest FF was recorded in PK4621 (
Table 3). The highest PCF was recorded by progeny PK4621 with mean value of 165.61 fruits bunch
−1. However, PK4621 had a significant difference with all the progenies in this study, and progeny PK4674 produced the least number of infertile fruits with nonsignificant differences with PK4465, PK4591, PK4548, PK4539, and PK4482.
Oil palm fruit set is one of the key indicators towards yield improvement of fresh fruit bunch and oil yield. The trial mean value of 49.28% for FSR fell within the category of moderate/poor, and 45.83% or 11 of the progenies had FSR above the trial mean value. The mean performance of the progenies ranged from 32.48% to 65.78%, of which progeny PK4674 with mean value of 65.78% recorded the highest FSR, however, there were no significant differences with progeny PK4465 with mean value of 62.62%, and progeny PK4570 with mean value of 32.48% recorded the lowest FSR (
Table 3). Based on the FSR categorization, only progenies PK4674, PK4465, and PK4482 were within the normal fruit set range, while 87.5% of the 24 progenies were within the range of poor fruit set. Among the progenies, 12.50% or three out of 24 progenies were below the critical level of ISR, while 12.50% out of 100% progenies were above the FSR critical level and had good FSR. It was also observed that progeny PK4674 had the highest FSR, with no significant difference with PK4482 for FTB, and it also had a low ISR, which may have led to its high performance in FSR. Therefore, progeny PK4674 could be advantageous for imminent breeding programs.
3.3. Performance of Genetic Origins for Male Flower, Fruit Set Ratio, and Inflorescence Sex Ratio
The performance of 24 biparental progenies based on male flower production, fruit set, and sex ratio were grouped based on their parental lines to delineate their performance (
Figure 2). The parental means for M, ISR, and FSR were 17.43%, 83.93%, and 49.28%, respectively. The male flowers produced by parental lines ranged from 10.43% to 29.40% and Deli Serdang × Cameroon had the highest production of M inflorescences with mean value of 29.40%.
Moreover, among the parents, the mean for ISR ranged from 72.22% to 90.51%, and one (10%) out of 10 parental lines had ISR below the critical level of 75% ISR. Deli Serdang × Cameroon produced the least ISR (72.22%), which was considered as the best among others based on the range of good and healthy ISR. The best ISR occurred in Deli Serdang × Cameroon, because of its high male flower production with mean value of 5.85% or 29.40% palm−1 yr−1. Indefinite sexual phases result from distinct alternating male and female inflorescence phases and are based on the genetic makeup of individual progeny palms, and they differ in terms of quantity and timing. Parent Deli Ulu Remis × Yangambi had the highest ISR of 90.51%, followed by Deli Johor Labis × AVROS at 88.26%.
Individual parental lines’ fruit set ratio ranged from 38.84% to 54.00% with a parental origin mean of 49.28%. Among the 10 genetic origins, only five, or 50%, had FSR above the parental mean. The highest FSR performance among the parental lines was found in Deli Banting × AVROS (54.00%) and Angola × AVROS (53.78%), which were moderate in their performances. Tanzania × AVROS recorded the lowest FSR mean value of 38.84%.
Additionally, the parental origins had similar trend performance for M, ISR, and FSR, as shown in
Figure 2. An increase in male production enhanced a decline in ISR, and because of this negative relationship between M and ISR, enhanced an increase in FSR; the more male inflorescences that are produced, the better for pollination. Therefore, normal fruit set in oil palm could be realized when ISR reaches a 75% critical level availability of
E. kamerunicus, backed by favorable environmental factors with good management practices. As illustrated in
Figure 2, Deli Serdang × Cameroon was statistically different from other parental lines.
3.4. Frond Production and Abortion Rate in Dura and Pisifera Genetic Origins
The frond production means and abortion rates among the 10
dura and
pisifera genetic origins are presented in
Figure 3. The parental mean for frond production was 26.40 fronds palm
−1 yr
−1. The frond production range was 25.42 to 27.12 palm
−1 yr
−1, and the highest number of fronds was produced by the genetic origin of Angola × AVROS with mean value of 27.12 palm
−1 yr
−1, followed by Tanzania × AVROS at 26.96 palm
−1 yr
−1. Deli Johor Labis × AVROS produced the least fronds mean value of 25.42 palm
−1 yr
−1. Nonsignificant difference in the frond production rate among the genetic origins was found because most of the parental lines were hybridized using the same
dura as the female parent or
pisifera as the male parent.
Frond production rate could be a useful indicator to determine inflorescence production and abortion rate in oil palm. The abortion rate of 3.13 palm
−1 yr
−1 was the parental mean, and the abortion rate of the genetic origins ranged from 1.80 to 4.57 palm
−1 yr
−1. The result of the abortion rate in this present study was not prevalent among the genetic origins. The lowest abortion rate was observed in Tanzania × Nigeria at 1.80 palm
−1 yr
−1, which indicated that this parental line may resist abortion even in drought conditions. Deli Ulu Remis × Yangambi had the highest abortion rate at 4.57 palm
−1 yr
−1 (
Figure 3).
3.5. Selected Traits Performance among Parental Origins
In the present study, the performance of average bunch weight (ABW), fruit to bunch (FTB), fertile fruit (FF), and infertile fruit (PCF) among the parental origins is presented in
Figure 4, which exhibits a positive relationship between ABW, FTB, and FF. An increase in FTB led to an increase in ABW coupled with an increase in FF. The parental origin means for ABW, FTB, FF, and PCF were 7.03 kg bunch
−1, 330.71 fruits bunch
−1, 163.45 fruits bunch
−1, and 167.27 fruits bunch
−1. However, 40% of the parental origins had ABW and FF above their respective parental means, while 60% had FTB higher than the general parental FTB mean. The ABW in
Figure 4 exhibited that Deli Banting × AVROS recorded the highest ABW at 10.26 kg bunch
−1, followed by Angola × AVROS (8.84 kg bunch
−1), Deli Ulu Remis × AVROS (8.45 kg bunch
−1), and Deli Johor Labis × AVROS (8.42 kg bunch
−1). Analogous values of their ABWs occurred because the same AVROS
pisifera was used as a male parent in their hybridization process. The lowest ABW was observed in Deli Serdang × Cameroon at 4.75 (kg bunch
−1).
Among parental origins, the highest FTB was recorded by Deli Banting × AVROS at 390.09 fruit bunch
−1 and the lowest FTB with a mean value of 280.51 fruit bunch
−1 was observed in Deli Ulu Remis × Yangambi.
Figure 4 further shows that Tanzania × AVROS had the lowest FF at 114.75 fruits bunch
−1, while Deli Banting × AVROS had the best mean value of 210.82 fruits bunch
−1 for FF, followed by Angola × AVROS (195.41 fruits bunch
−1). In general, PCF was high in all the parental origins (
Figure 4), and data on the PCF among the parental origins showed a high PCF effect. Fifty percent of the parents recorded higher PCF above the general parental PCF mean. The highest PCF was observed in Tanzania × AVROS with a mean value of 182.81 fruits bunch
−1, and the lowest value of 151.28 fruits bunch
−1 was observed in Deli Ulu Remis × Yangambi.
3.6. Genetic Performance of Fruit Set Ratio, Inflorescence Sex Ratio and Their Traits
Genetic parameters such as heritability, phenotypic, and genotypic coefficients of variations, and genetic advance are considered the basic tools for breeding and selection programs. The biparental progenies used in the present study exhibited wide genetic variations coupled with estimated heritability value on the environment.
Broad-sense heritability and variance components were used to estimate values for fruit set ratio and inflorescence sex ratio, and their traits are shown in
Table 4. Broad-sense heritability (h
2B) value ranged from 27.68% to 91.76%, and its value for traits in this study was generally moderate (h
2B = 30–60%). The magnitude of h
2B (>60%) was exhibited in ABW, FF, PCF, FTB, and FSR. Moderate h
2B was observed in M, AB, and ISR, while the lowest h
2B was found in female flower production (
Table 4). The lowest (<10%) phenotypic coefficient of variation (PCV) was observed with mean value of 9.14% for ISR. However, PCV for F, PCF, FTB, and FSR was found to be moderate (10–20%), whereas the higher magnitude (>20%) PCV was found in M, AB, ABW, and FF. An immense environmental influence was indicated by phenotypic variation in the mean of these traits (M, AB, ABW, and FF) (
Table 4).
Moreover, the genotypic coefficient of variation (GCV) was found to be low (<10%) in F and ISR, and ISR recorded the lowest of 5.48%. Meanwhile, PCF, FTB, and FSR had moderate (10–20%) GCV. Conversely, the highest (>20%) GCV was observed in ABW (34.53%), followed by M at 31.41%, and FF (24.62%) and AB with a value of 20.63%. The ABW, M, FF and AB affected with less influence through genetic effects. PCV and GCV analyses showed that ABW, M, FF, and AB were greatly influenced by the environment, hence progeny PK4841 followed by progeny ECPHP415 in male flower production can be suitable for use in selection. FF and FSR emphasized the important role played by the environment in traits inheritance. Moreover, genetic advance (GA) was observed to be low (<10%) in F and ISR, but it was found to be high (>20%) in M, AB, ABW, FF, PCF, FTB, and FSR (
Table 4). Similarly, the genetic variation of male flower, ISR, and fruit set ratio contributed at 62.39%, 59.90%, and 95.79%, respectively, to phenotypic variations.
3.7. Analysis of Correlation among Morphological Traits of Oil Palm
The correlation coefficient analyses for the nine characters were carried out, and the determination of the strength of an association was based on the interpretation of the correlation coefficient (r) with an estimated coefficient of correlation as perfect relationship (0.9 < r = 1), good (0.75 ≤ r ≤ 0.9), moderate (0.5 ≤ r ≤ 0.75), and “r” poor correlation (r < 0.5). The significance level (
p ≤ 0.05) and high significance (
p ≤ 0.01) were determined through Pearson’s correction. Phenotypically, inflorescence sex ratio (ISR) had a perfect negative significant relationship with male flower (M), a poor negative significant correlation with fertile fruit (FF), fruit to bunch (FTB), and fruit set ratio (FSR), but ISR had a moderate positive significant relationship with female flower (F) (
Table 5). An increase in female inflorescence enhanced an increase in ISR. Conversely, it was observed that FSR had a good positive significant correlation with FF and a moderate positive relationship with FTB and ABW, and FSR had a weak positive significant relationship with M (r = 0.29 **). On the contrary, FSR had a weak negative significant relationship with ISR (r = −0.29 **) and a moderate negative significant correlation with PCF (r = −0.55 **). A decrease in PCF will increase oil palm FSR and, on the contrary, when PCF increases, FSR will decrease.
3.8. Principal Component and Cluster Analysis of Parental Origins and their Progenies
In oil palm improvement strategies, efficient and effective utilization of D × P progenies has been a prerequisite and therefore must be correctly assessed, categorized based on performance, and documented for future breeding and selection. To further evaluate the genetic variation among the 10 parents and their 24 biparental progenies of oil palm, principal component analysis (PCA), as well as cluster analysis (CA), was used. The average relationship and Euclidean distance were used in the hierarchical cluster analysis for both parents and their progenies.
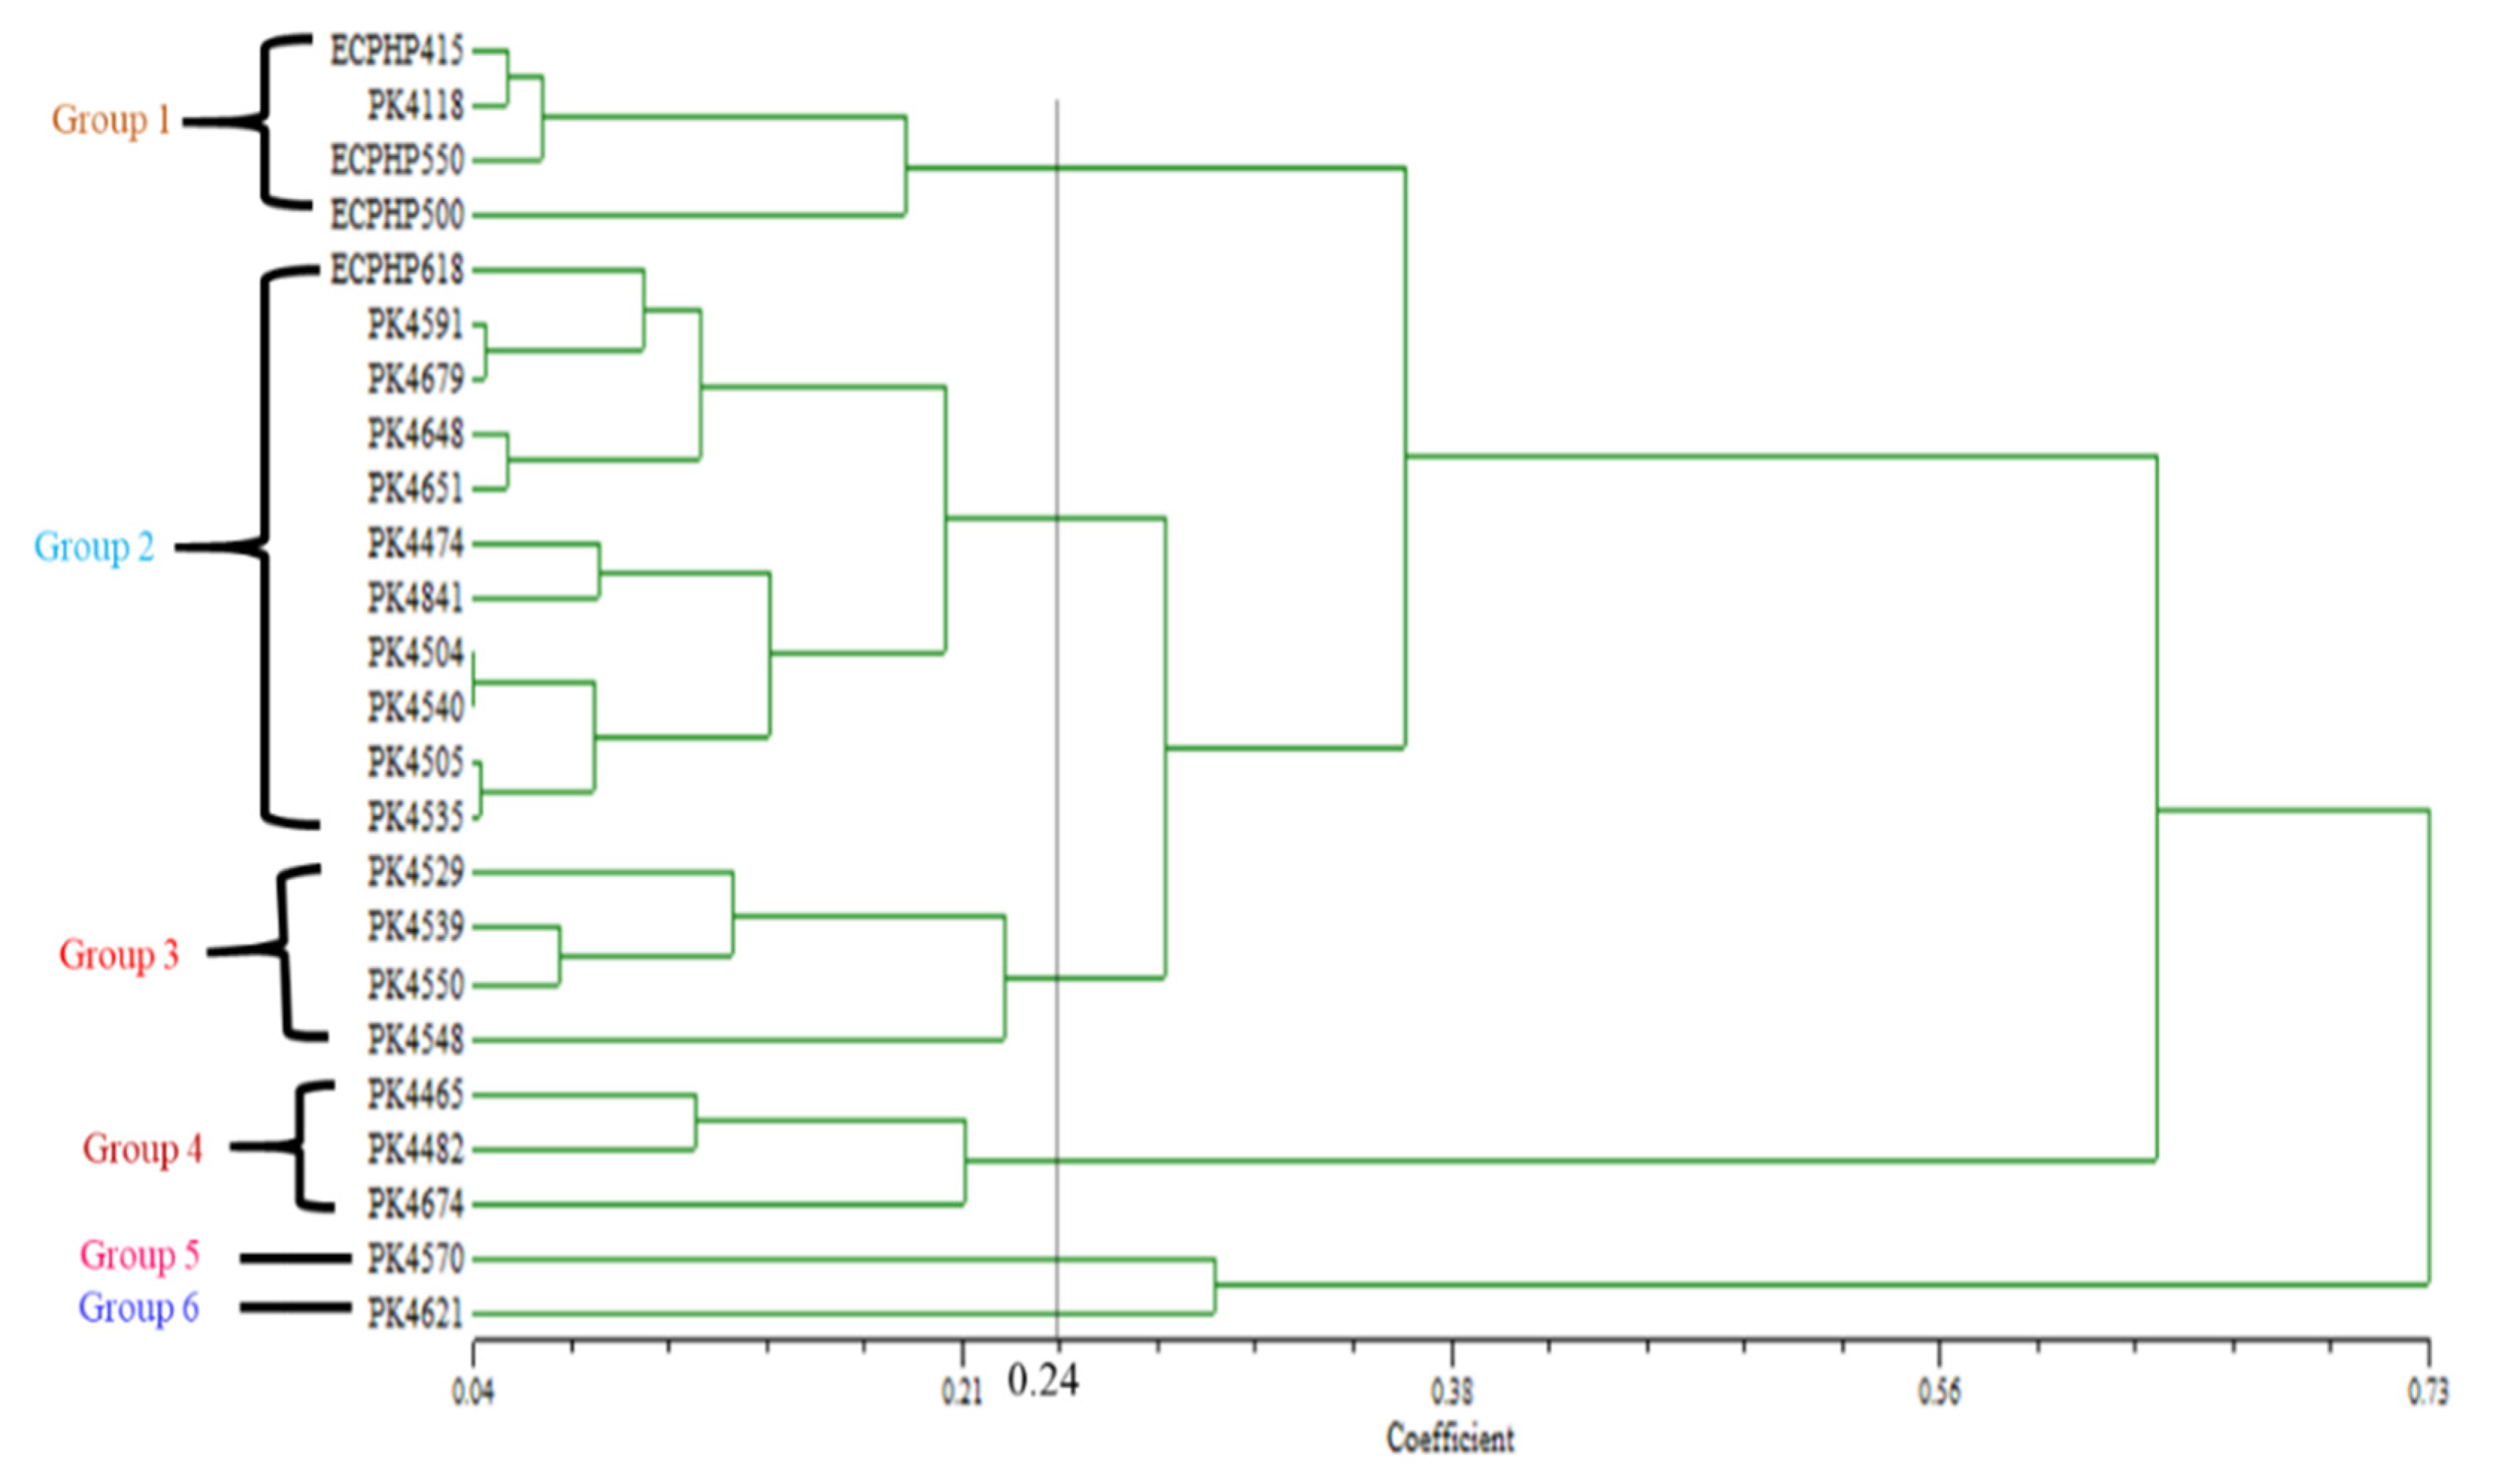
The UPGMA dendrogram was formed based on nine morphological traits. The parental origins were clustered into five major groups at 0.15 coefficient level (
Figure 5), which exhibited genetic variation among parents. Similarly, the 24 progenies were clustered into six major groups at a 0.24 coefficient level, which indicated a high level of genetic influence among the progenies (
Figure 6). For parents, Cluster I and II unified three parents’ subclusters. Cluster III had two parents, while Clusters IV and V had one parent each. In regards to progenies, Clusters I and III comprised four progenies each with subclusters. Clusters II integrated 11 members with the highest subclusters of progenies, Cluster IV had three progenies with subclusters individually, while V and VI had one progeny each with no subcluster.
The distributions of parents and progenies into five and six dissimilar major clusters, respectively, brought about the sensible mean values of nine morphological quantitative traits (
Table 6). The highest mean value of male flower (M) was found in Cluster I in both parents and progenies. However, Cluster V recorded the highest female flower (F) in parental origins and their progenies, and Cluster I for both categories had the lowest.
The lowest inflorescence sex ratios (ISRs) for parents and progenies were found in Cluster I with mean values of 80.08% and 78.74%, respectively. While the highest mean ISR was noticed in Cluster IV with value of 90.47%, followed by Cluster III at 87.61% for parents and progenies, the highest was recorded in Cluster VI with mean value of 92.12%, followed by Cluster III (89.84%). However, all clusters in parental origins and their progenies exceeded the range of normal ISR (70% to 80%), except for Cluster I for progenies with a mean value of 78.74%, which was found within the normal range of ISR.
Moreover, the highest average bunch weight (ABW) at 9.81 kg bunch
−1 was observed in Cluster I for parents with the least ABW at 5.40 kg bunch
−1 in Cluster IV. Similarly, Cluster IV recorded the highest ABW (12.24 kg bunch
−1), followed by Cluster I at 9.86 kg bunch
−1, and the lowest ABW was noticed in Cluster III at 5.32 kg bunch
−1. In addition, among the parental origins, the highest fruit to bunch (FTB) and fruit set ratio (FSR) were found in Cluster I, followed by Cluster III (
Table 6), with the lowest in Clusters IV and V, respectively, for both traits. Similarly, for progenies, Cluster IV recorded the highest number of FTB and FSR at 385.50 fruits bunch
−1 and 62.97%, respectively, followed by Cluster I (FTB: 381.62 fruits bunch
−1 and FSR: 54.65%). Whereas, the least number of FTB and FSR were observed in Clusters III and VI (
Table 6).
The substantial production of male flower increased pollen availability, which aided an increase in FTB and FSR in Cluster I for parents, and in Cluster IV for progenies. Therefore, in this study, parental origins Deli Banting × AVROS, Deli Ulu Remis × AVROS, and Angola × AVROS in Cluster I had the best performance for FTB and FSR. Additionally, progenies PK4465, PK4482, and PK4674 in Cluster IV, in terms of FTB and FSR yields, had the best performance. All the clusters were within the range of moderate/poor (30–60%) fruit set, including Cluster VI, which had the lowest fruit set at 41.49%; however, the results obtained for this trait indicated that substantial genetic influence existed among the progenies. The existence of variations among parents and their biparental progenies was further validated through PCA based on the data of nine morphological traits, which presented the general assortment of parents and progenies into seven groups (
Figure 7 and
Figure 8).
In this study, seven groups were formed on the two-dimensional PCA for parents and progenies, which exhibited variances in results with that of the cluster analysis of each category. For parents, Group II of PCA had two parents, whereas Group III comprised three parents and Groups I, IV, V, VI, and VII had one parent each. For the progenies, Group I of PCA comprised three progenies, Group II had nine progenies, Groups III and IV comprised four progenies each, Group V had two progenies, and Groups VI and VII had one progeny each (
Figure 8).
The distances of parents, as well as progenies, from the center of origins indicated the amount of variation. Therefore, parents in Group VII (Tanzania × AVROS), Group VI (Deli Ulu Remis × Yangambi), Group II (Deli Ulu Remis × AVROS and Angola × AVROS), and Group I (Deli Banting × AVROS) showed variation in their performance, which exhibited that there is a room for selection for future breeding programs. Likewise, for progenies, PK4621 in Group VII, PK4841 and PK4674 in Group V, and progenies PK4674, PK4465, and PK4482 in Group IV are different in their performance from other progenies. The PCA validated the high performance of progeny PK4621 in ISR, and the normal range of ISR was recorded by PK4841 and PK4674, in which they were regarded as the best for ISR. Progenies PK4674, PK4465, and PK4482 had an outstanding FSR, and PK4674 had the highest FSR. Hence, progenies PK4841 of Deli Serdang × Cameroon and PK4674 of Deli Ulu Remis × AVROS could be of interest in breeding programs, especially in hybridization and selection. The PCA analysis exhibited that origin one (87.35%) and two (11.59%) accounted for approximately 98.94% total variation underlying the traits of parental origins. Equally, progenies one (91.47%) and two (7.38%) accounted for about 98.85% variation.
4. Discussion
Oil palm sex ratio and fruit set are key yields determining traits for both fresh fruit bunch and oil yield. Variations of sex ratio and fruit set as well as other agronomic traits were analyzed among the progenies. The present findings agree with the previous reports by Noh et al. [
28] and Junaidah et al. [
29], where they reported highly significant effects in all traits of the progenies. The oil palm frond is considered a vital production trait for ISR determination. Arolu et al. [
30] reported that oil palm bunch stalks, attached to an axil of a palm frond, produced flowers of both sexes that occurred separately with distinct male and female inflorescences. According to Rival [
31], the floral biology of oil palm is monoecious, which means it produces both male and female inflorescences on the same palm in an alternate cycle. The relationship among the components for sex determination ratio can be established based on fronds production and inflorescence development. In oil palm, anthesis or pollination normally occurs at frond 17 or 20; however, anthesis at frond 20 was prevalent among the progenies. Based on the parental genetic origins of the palm, maturity can occur on frond 30 to 33 [
32], indicating that the fruit bunch is ready for harvest with at least five loose fruits.
From the findings of this study, it is evident that there was a decline in male inflorescence production in oil palm plantations under peat soil, especially those planted with tissue-cultured planting materials. For breeding and selection in oil palm, the emphasis depends on oil palm fresh fruit bunch and oil yield [
28]. Therefore, a decrease in male production enhances the high ISR and consequently, a low fruit set will be realized, coupled with low fresh fruit bunch yield and oil yield. According to Norman et al. [
6], an increase in the number of female inflorescences could compromise the production of male inflorescences.
However, environmental factors have been documented to greatly influence the production of male flowers. Information on weather patterns as well as evaluation of genetic instability of a given crop are considered vital in assessing progenies and their genetic origins on yield [
33]. On the other hand, oil palm yield is generally determined by five agronomic traits, i.e., production of fronds, level of floral abortion, sex ratio, the extent of floral survival after anthesis, and bunch weight [
34], which, in turn, depend on the availability of water supply. Climate change is one of the factors impacting the growth and ultimately the yield of oil palm [
35]. The variations in fruit set yield and yield traits performance could have been due to rainfall patterns and field temperatures. The potential of agricultural production is substantially affected by changes in rainfall patterns and temperatures, as well as related impacts of extreme weather events, availability of water supply, pests, and diseases [
36]. Due to climate change, which greatly damages agricultural production, the frequency and intensity of severe weather events have been cited to be on the increase, and with the increase in temperature, Southeast Asia is expected to face the greatest loss in crop production [
37], in which oil palm is no exception. Climate change has major nonlinear effects on oil palm production’s net revenue [
38]. The Malaysian Palm Oil Board reported a decline in the production of oil palm fruit set and fresh fruit bunch (FFB) due to indirect and direct discrepancies of climate change [
39]. Especially in tropical countries, adverse effects of climate change on oil palm growth and yield have been reported by Paterson et al. [
40]. Paterson and Lima [
41] predicted that, if the temperature rose 2 °C above the optimum level and rainfalls fall by 10% in Malaysia, a 30% yield decline in oil palm could be expected.
Similarly, an increase in oil palm yield must be initiated in order to evaluate oil palm component traits that have direct and significant relation with oil palm yield [
42,
43]. To achieve a normal inflorescence sex ratio (70 to 80%) and a normal range of fruit set (>60%), oil palm breeders should breed and select planting materials of good quality to produce male flowers with viable pollen. The ISR refers to the number of female inflorescences in proportion to the entire number of inflorescences (INF) produced from a palm tree [
31]. High ISR was prevalent among the progenies and contributed to the decline in oil palm fruit set, which could be a result of low male production. The prevalent decline in fruit set among progenies in the present study was also a result of the decrease in male flower production. ISR had influenced the decline in FSR. In high-ISR cultivated palm areas especially in peat soil, poor fruit set formation was highly manifested [
10] and the normal range for ISR was 70% to 80% [
10]. MPOB [
9] reported that the range of healthy inflorescence sex ratio could be 65% to 70%. According to Norman et al. [
6], a survey from 2016 to 2017 estimated 88,381 ha, or 15% of oil palm cultivated areas, in Malaysia were pretentious due to low fruit set. As a result of seasonal disparity in bunch numbers, the oil palm ISR is a significant contributing factor towards oil yield improvement; however, both sexes may not be equally affected by the INF abortion (AB). Hence, an apparent alteration in ISR could truly be owed to an alteration in AB rate, together with preferential AB of one sex in oil palm [
21]. On that note, Corley and Gray [
44] reported that oil palm ISR declined as the palm advanced in age from 90% to below 60% when cultivated on Malaysia’s coastal soils with cultivation ages of four and 15 years, respectively, after planting. ISR was about 70% and 40% respectively in three- and five-year-old oil palm plantation after planting on inland soils. Moderate ABW with a high bunch number could result in a high FFB yield [
45]; however, most of the progenies recorded a low ABW.
In oil palm, the prerequisite for high oil to bunch is FTB; however, fruit to bunch, mesocarp to fruit, oil to wet mesocarp, and oil to dry mesocarp are derived traits for oil to bunch. Therefore, Noh et al. [
27] stated that, for oil palm bunch, fruit to bunch is an estimation of the FSR, i.e., the higher the FF, the better the FSR. The results produced by progeny PK4674 as the highest in FF yield were attributed to high ABW and FTB; hence, a high fruit set was achieved, and progenies with low PCF production could be appropriate for selection. ISOPA [
10] categorized oil palm fruit set as normal (>60%), moderate/poor (30–60%), and very poor (<30%). Therefore, the findings of this study agreed with Byerlee and Deininger [
46], who reported that the decline in bunch fruit set has become dreadful in oil palm cultivated regions based on yields produced/hectare. An increase in low oil extraction rate (OER) occurred because of poor fruit set, which has been reported throughout Malaysia [
6] and recently reported by Swaray et al. [
12]. Based on a survey conducted from 2016 to 2017, Norman et al. [
6] further cited that peat soil had lower fruit set formation than that of mineral soil. Other likely pretentious factors for poor fruit set formation include high rainfall, poor female flowers’ productiveness, high vermin infestations, less attractive male flowers, less pollen viability, and low weevil population density [
10].
However, ISOPA [
10] established that the critical levels for FSR and ISR are 60% and 75%, respectively. FSR with 60% and above is considered good FSR, whereas ISR above 75% is regarded as high, which may result in poor FSR, and therefore, healthy ISR could be within the range of 65% to 70%. A decrease in ISR below the critical level to the range of healthy ISR could increase FSR at the critical level stage with a positive increase in fruit to bunch. On the contrary, an increase in ISR above 75% critical level forced the FSR to decline below the 60% critical level, followed by a decline in FTB. Planting materials should possess good breeding and agronomic yield improvement characters. Laghetti et al. [
47] reported that there has been an unexpected loss of genetic variations continuously in field crops due to the fast spreading of insufficient modern cultivars through international trade. Trade in field crop seeds is cost-effective; however, crop seeds are only dominated by few multinationals in the international scene (Laghetti et al. [
47]).
Oil palm sex ratios can be increased or decreased based on genotype and the production of male inflorescence [
48]. According to Henson [
49], the sex of the oil palm inflorescence produced changes with time in response to both external and internal influences, resulting in male and female periodic cycles. Junaidah et al. [
29], in their previous studies, reported that, compared to
pisifera sources, the Yangambi
pisifera differed with outstanding performance. The Yangambi
pisifera was also reported by Amiruddin et al. [
50] and Junaidah et al. [
29] to be a high-oil-yielding parent. In an earlier study by Noh et al. [
28], they reported that fruit to bunch was an estimate for oil palm fruit set. Their high FF performances occurred due to AVROS
pisifera, which was used as the male parent in crosses of both mother parents of Deli Banting and Angola. High fertile fruit to bunch is an indication for oil yield improvement. Therefore, for fertile fruit, these two parents were identified to be outstanding parents; hence, they could be recommended in oil palm selection and breeding programs.
In yield improvement of oil palm in any selection and breeding program, fresh fruit bunch and oil yield are the primary motives. However, fruit set that enhances yield improvement of both fresh fruit bunch and oil yield is greatly influenced by parthenocarpic fruit (PCF), with a series of contributing factors such as planting materials, pollinating weevils, the ratio of sex inflorescence, as well as environmental factors [
12,
13]. In plant breeding, for rapid advancement to take place, a substantial amount of heritability and variation should provide adequate scope intended for a rejoinder to selection in the characters selected [
28]. Yusop et al. [
51] and Rafii et al. [
52] cited that the environment strongly influences polygenes that control the quantitative characters.
To be equipped with an idea of any trait for selection, the ultimate goal is variability and heritability study [
53]. Distinctively, the high h
2B indicated that there was a minimal environmental influence on ABW, FF, PCF, FTB, and FSR, and therefore, such traits could be used as characters for selection. In earlier studies conducted by Ali et al. [
54] and Najeeb et al. [
55], it was reported that heritability might not continuously be associated with high genetic advances. High heritability in the plant does not constantly show large genetic gain, and therefore, heritability is suggested to be measured in line with genetic advance as a means of predicting selection effects of superior crops’ diversities [
56]. The correlation clearly showed that the sex ratio was more influenced by female production and the FSR was influenced by male production, which indicated the existence of a substantial genetic relationship.
The high ISR performance among the clusters of parents and their progenies could be due to low male inflorescence production, i.e., the higher the female inflorescence production, the higher the ISR. The substantial performance of Cluster I in ISR for progenies occurred because of its moderate male production. Twenty to thirty percent of male production could result in good ISR, and then a higher fruit set could be achieved. Inclusive variation for fruit set among progenies was due to their genetic origin makeup (Deli Ulu Remis × AVROS and Angola × AVROS). The female
duras (Deli Ulu Remis and Angola) and male
pisifera (AVRUS) had been reported as good combiner in the hybridization process because of their outstanding performance. Ulu Remis
dura is a widely disseminated genetic palm material used in breeding and is a good combiner with
pisifera AVROS [
57]. The AVROS
psiferas are well known for their precocious bearing and conferring attributes of high oil yield and are closely related to the Yangambi
pisifera, which has been used in many breeding programs and is a descendant from
tenera SP540 [
57]. In identifying limited characters to be used in breeding programs such as hybridization and selection, the principal component analysis information could help plant breeders during the process [
4]. The effectiveness of accessions is an indicator of differential of higher coefficient irrespective of the sign [
58]. The PCA analysis revealed that parental origins and their progenies within the same group are similar in their genetic performance and those far away from the center of origin have higher potential for genetic variation.
5. Conclusions
This study showed that there were differences among the oil palm dura × pisifera progenies in their yield performance for inflorescence sex ratio and fruit set with a yield decline in fruit set. For progeny materials grown on Malaysia peat soil, the performance of the 24 D × P progenies for sex ratio on fruit set was quite worthy, indicating that a drop in fruit set ratio was influenced by inflorescence sex ratio. The findings showed that 16.67% of the progenies recorded the highest ISR with no significant difference among them, which was not suitable for the production of high fruit set yield. However, five of the progenies produced good ISR, which was good for better fruit set yield. Similarly, 12.5% of the progenies (PK4674, PK4465, and PK4482) were above the 60% critical level of good FSR, and PK4674 had the highest (65.78%). There was a noticeable influence through the environmental effect, rather than through genetic variance, among the biparental progenies. The ISR had moderate heritability and low phenotypic and genotypic coefficient of variations, and genetic advance. However, FSR had high heritability, with moderate PCV and GCV with high GA, which showed that higher variation was caused by the genetic effect, of which there is room for selection. The principal component and cluster analysis also validated that there is variation among the parental origins as well as their biparental progenies.
Correlation indicated that the influence of ISR highly depended on female flower and fruit set was greatly influenced by fertile fruit. The outstanding performance of progeny PK4674 in FSR was due to its good ISR achievement; hence, it could be used in future breeding programs. In terms of normal ISR and M production, Deli Serdang × Cameroon was statistically the best among the 10 dura and pisifera genetic origins, while Deli Banting × AVROS and Angola × AVROS had the best FSR yield and were regarded as the most outstanding parental line for FSR. A breeding program’s long-term success hinges on having enough genetic variety to make genetic improvements in each selection cycle of oil palm. Therefore, these two parental lines could as well be selected and exploited for breeding; however, the results would have been more detailed and advantageous if complemented with molecular studies. Pollination efficiency is one of the most important factors in oil palm fruit setting; hence, there should be enough male inflorescences with viable pollen. Thus, based on the findings of this study, future economical merit on breeding is that progenies with good and healthy sex ratios with high fruit setting performance could be selected and bred as planting materials for oil yield improvement. Accordingly, for future studies, progenies and their parental origins can be determined via microsatellite molecular markers as a selection criterion, allowing for the breeding of novel genotypes with competitive benefits for the oil palm sector.

 ,
, 


