Article

Protein Hydrolysates and Mo-Biofortification Interactively Modulate Plant Performance and Quality of ‘Canasta’ Lettuce Grown in a Protected Environment

by
Leo Sabatino
1,*,†,
Beppe Benedetto Consentino
1,†,
Youssef Rouphael
2,
Claudio De Pasquale
1,*,
Giovanni Iapichino
1,
Fabio D’Anna
1 and
Salvatore La Bella
1
1
Dipartimento Scienze Agrarie, Alimentari e Forestali (SAAF), University of Palermo, Viale Delle Scienze, ed. 5, 90128 Palermo, Italy
2
Department of Agricultural Sciences, University of Naples Federico II, 80055 Portici, Italy
*
Authors to whom correspondence should be addressed.
These authors are equally contributed.
Agronomy 2021, 11(6), 1023; https://doi.org/10.3390/agronomy11061023
Submission received: 30 March 2021 / Revised: 14 May 2021 / Accepted: 19 May 2021 / Published: 21 May 2021
(This article belongs to the Special Issue Toward Sustainability in Horticultural Crop Production Systems)

Abstract

:
Since the use of protein hydrolysates (PHs) enhances overall plant performance and quality of vegetables, they might be considered as a toll to face a number of concerns essentially associated to the growing request of premium quality foodstuff realized in agreement with eco-friendly agriculture practices. Molybdenum (Mo) is considered a fundamental trace element for human body. Thus, its shortage determines several disorders mainly related to neurological lesion and esophageal cancer. Biofortification of fruiting and leafy vegetables is a promising tool to prevent Mo deficiency in the human diet. The current study was carried out to assess the interactive effect of plant-derived PHs and Mo dosage (0.0, 0.5, 3.0, and 6.0 µmol L−1) on yield, morphology, nutritional and functional features, and nitrogen indices of ‘Canasta’ lettuce. Head fresh weight (HFW), head height (HH), ascorbic acid, K, Mg, total chlorophyll, as well as nitrogen use efficiency (NUE) index were positively correlated to PHs application. Furthermore, ascorbic acid and total chlorophyll were also improved by Mo supply. A great improvement in terms of soluble solid content (SSC), total sugars, total phenolic, carotenoids, Mo and N concentrations, nitrogen uptake efficiency (UE), and nitrogen physiological efficiency (PUE) indices was recorded when PHs application was combined with the highest Mo dosage (6.0 µmol L−1). Consequently, our results suggest that Mo-biofortification and PHs application can positively modulate ‘Canasta’ lettuce plant performance and quality.

1. Introduction

Nowadays, the agriculture production sector must face both the multiple challenges to serve an increasing global population, and the pressing need to improve food quality and reduce the impact of cultivation on human health and environment [1]. In this scenario, the use of plant biostimulants is a technology with innovative application potentiality [2]. Several authors [3,4,5,6,7,8,9,10,11] have appraised that plant biostimulants are an eco-friendly means to enhance plant production and quality under favourable or unfavourable growth conditions. In this regard, the protein hydrolysates (PHs), represent a promising group of plant biostimulants [12]. Furthermore, PHs, when derived from enzymatic hydrolysis, are suitable plant biostimulants for an organic farm management [13]. PHs are either applied by foliar spraying and/or by root fertigation. As reported by Fernández and Eichert [14], when furnished via foliar spray, PHs are absorbed by (i) cuticle, (ii) epidermal cells and (iii) stomata, and finally reach the foliar mesophyll. Several studies [15,16,17,18] have confirmed that PHs elicit crop performances due to hormone-like activities (i.e., gibberellins and auxin). Additionally, PHs enhance minerals absorption and translocation throughout modification of the biomass, density and lateral branching [15,19,20].
Macro- and micro-nutrients are essential to provide a balanced diet and to contribute to human health. Biofortification of edible plants can be achieved via plant breeding improvement (i.e., exploiting the genetic variability of the local populations) or through fertilizer application [21,22,23]. Molybdenum (Mo) is a trace element which is required in minor quantities, less than 100 mg per day [24,25]. As reported by Tsongas et al. [26] the daily optimal Mo intake ranges from 120 to 240 μg, in relation to age, sex, and income. The importance of the disorder linked with the simple shortage of sulfite oxidase [27,28] established the necessity of Mo for standard human health. Furthermore, Johnson et al. [29] remarked the neurological lesion caused by deficiency of Mo containing enzymes and reinforced the prominence of this metal in human well-being. Moreover, there are reports regarding the fundamental function of Mo in the prevention of esophageal cancer and mammary adenocarcinoma [30,31]. Interestingly, as reported by Schwarz and Belaidi [31], Mo is the only metal of the 2nd transition row of the periodic table with a biological function for humans.
Mo can be found in foods as a trace element in form of soluble molybdates. Legumes, nuts, cereals and cereal derivate are common foods with a high Mo concentration [32]. Bread and pasta are the main foodstuff suppliers to alimentary Mo intake, followed by dairy products and leafy vegetables [32,33].
Mo is a crucial constituent of biological structures. However, it can be toxic at concentrations higher than those requested for their biological purposes [34]. Schwarz et al. [35] report that Mo is active only when is a portion of an organic pterin complex named pterin-based molybdenum cofactor (Moco). Currently, four mammalian Mo-enzymes are recognized, all including Moco in their active site. In all of these enzymes, Mo catalyses the transfer of oxygen from or to substrates via water as oxygen donor or acceptor [31].
Plant benefits from Mo supply are well acknowledged and recognized [36,37,38,39]. Indeed, Mo-enzymes partake in fundamental metabolic processes, comprising the phytohormone biosynthesis, purine metabolism, sulfite detoxification, and nitrate assimilation. Thus, its scarcity or excess obstructs the plant growth and development [37]. Moreover, Mo supply prevents alteration in plant morphology, flower formation reduction and inhibition in plant growth and also improves fruit quality. According to Moncada et al. [40], Mo supply is effective to increase production and qualitative aspects of lettuce, curly endive, and escarole cultivated in soilless systems. Furthermore, Sabatino et al. [41] found that Mo bifortification increases plant performance, yield and quality in different tomato genotypes. Longbottom et al. [42] also report that Mo foliar application on ‘Merlot’ grapevines is a promising technique to improve yield in addition to yield-related traits.
Lettuce (Lactuca sativa L.) is among the most consumed green leafy vegetable [43,44] although it is frequently underestimated in terms of nutritional and functional value. Lettuce contributes significantly to improve the human diets, being a notable source of minerals, carotenoids, folates, flavonoids, phenolic acids, and vitamins B9, C, and E [45,46]. The species includes numerous horticultural groups displaying a high phenotypical variation. The leaves are used in ready to eat salads and sandwiches, cooked or raw. Lettuce is considered a cool-season crop cultivated on all continents, especially in temperate and subtropical climates [47].
PHs application and Mo biofortification are easy, effective and concrete approaches to lettuce production. Nevertheless, since plant reaction to PHs and Mo biofortification are influenced by genotype, cultivation conditions and practices, a particular investigation is imperative to appraise methods and doses. Based on the aforesaid evidence, the aim of our study was to assess the interactive influence of PHs application and Mo supply dose on yield, morphology, as well as the nutritional and functional features of an established lettuce variety in a typical cultivation area.

2. Materials and Methods

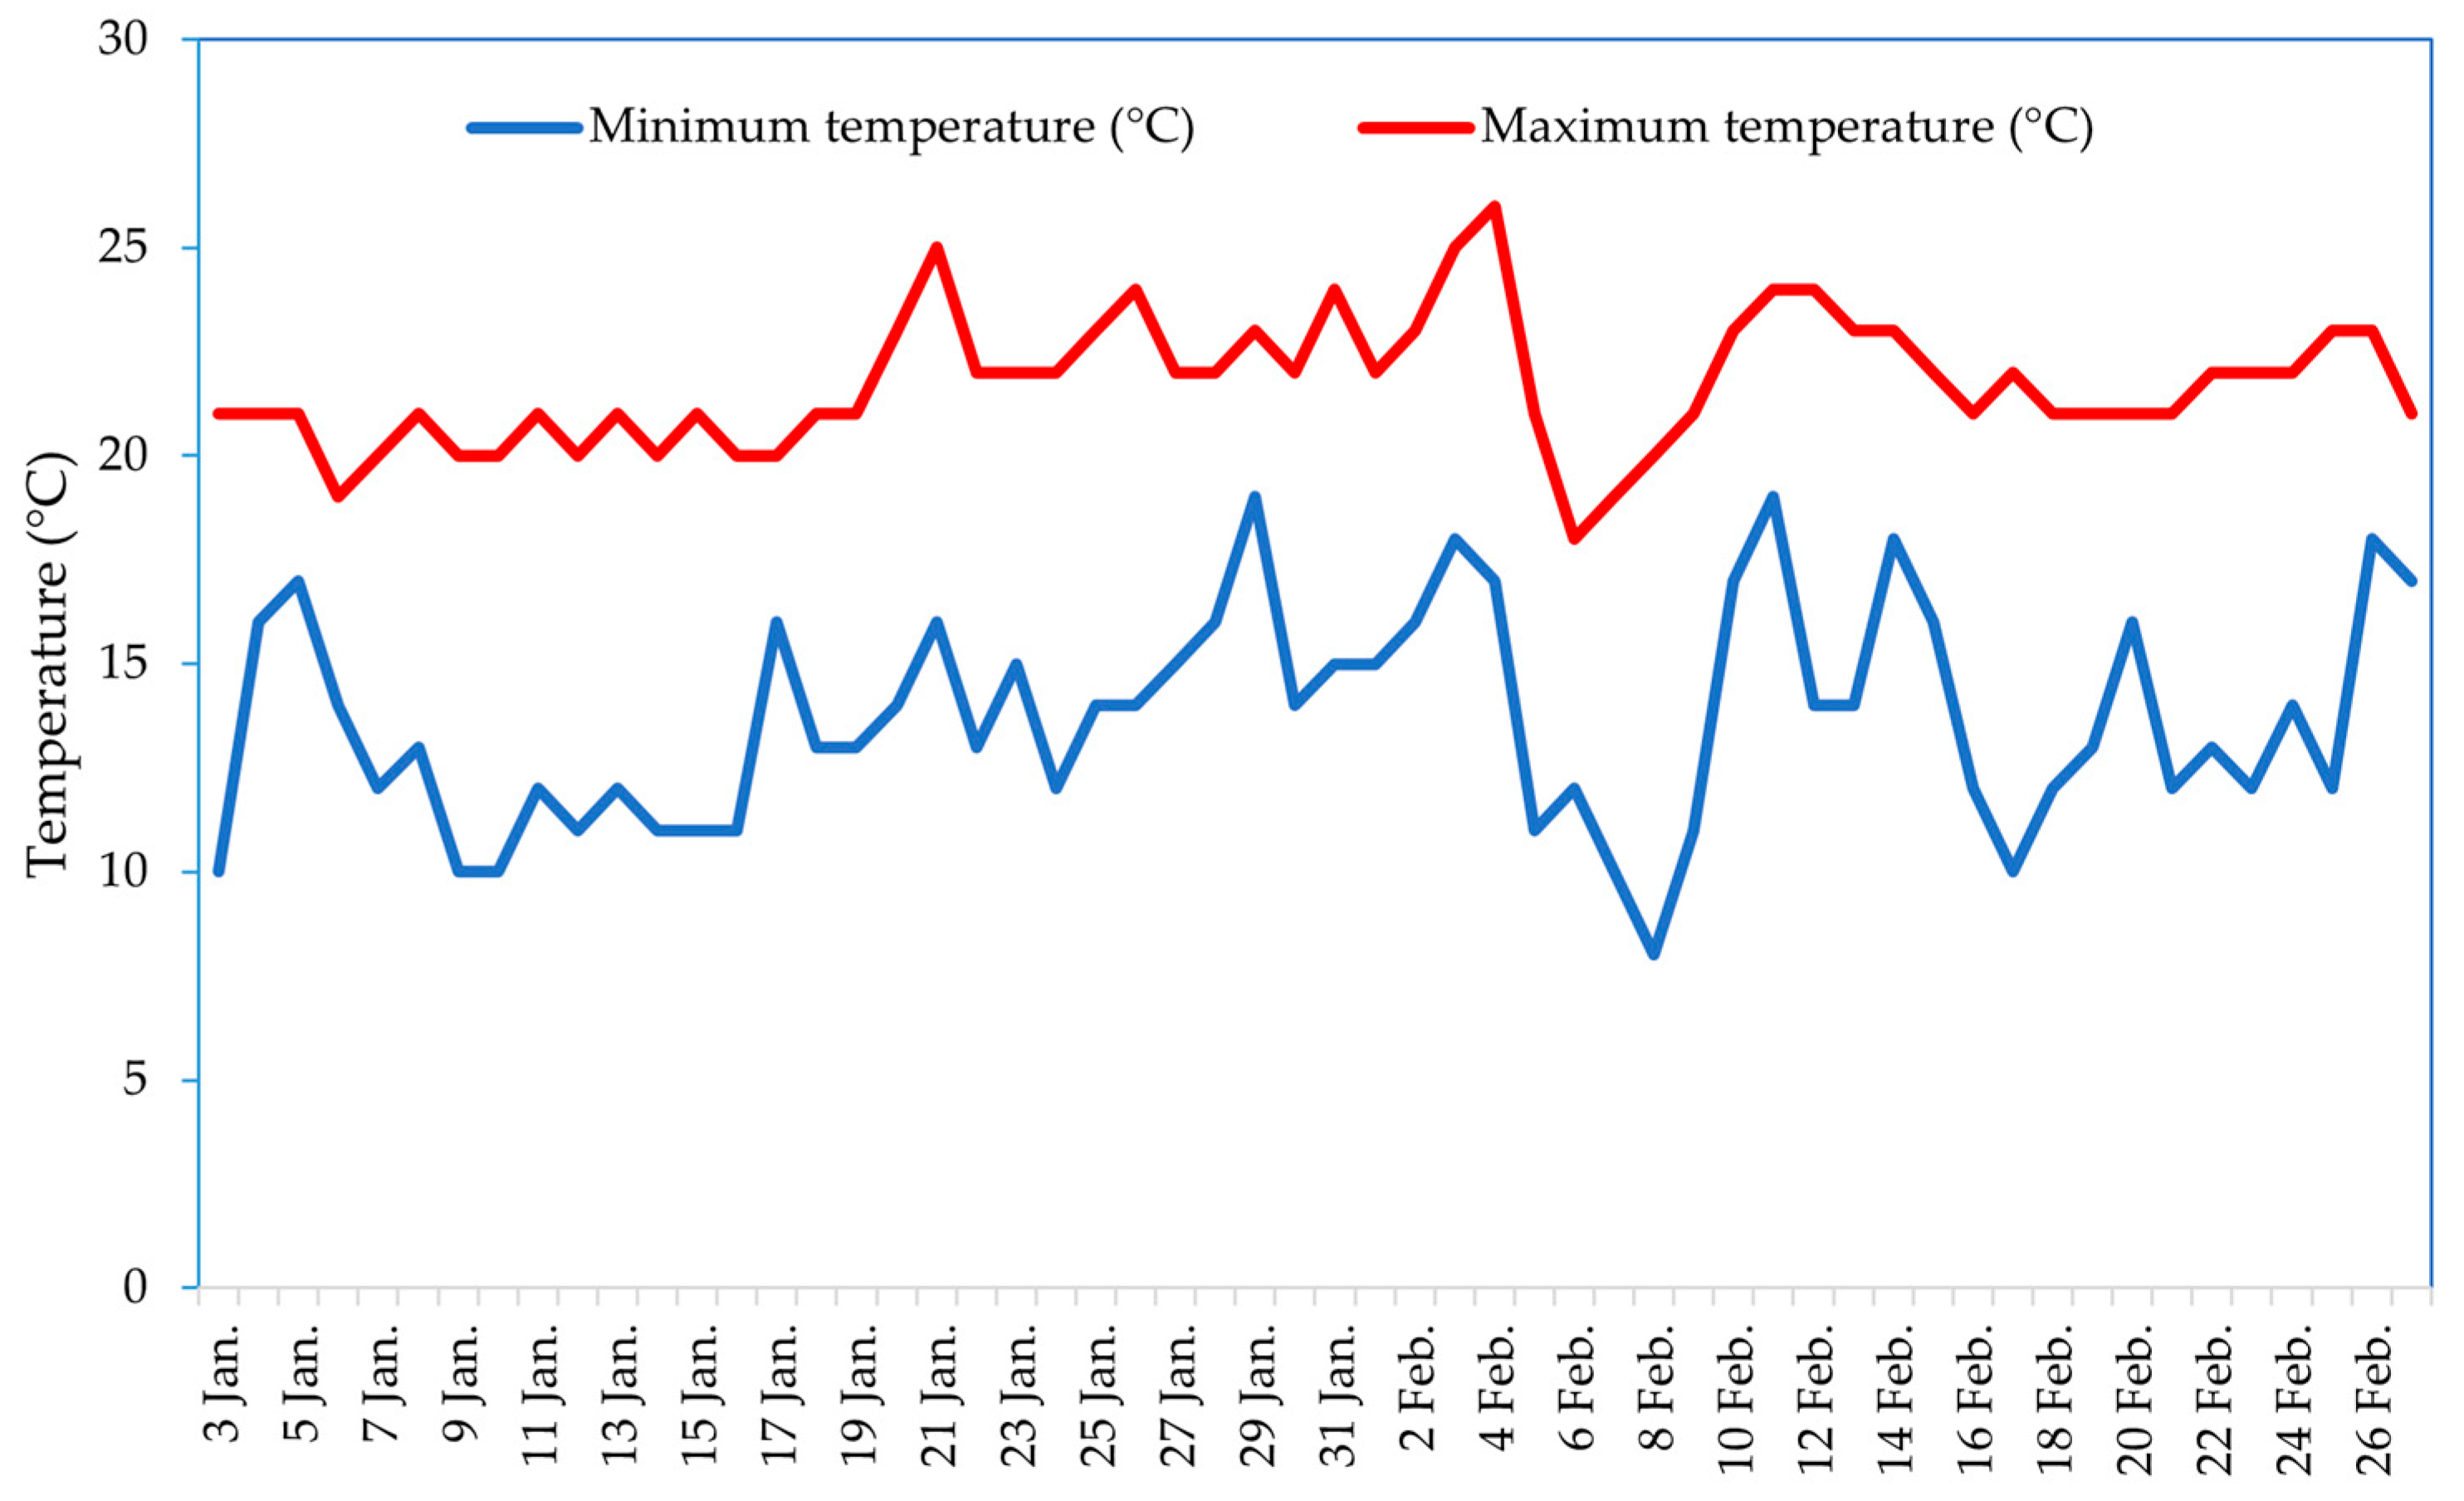
2.1. Plant Genetic Material and Experimental Site

The study was performed at the Department of Agricultural, Food and Forestry Sciences of the University of Palermo (SAAF), sited in Palermo (latitude 38°12′ N, longitude 13°36′ E, altitude 65 m). The trial was carried out in a tunnel 30.0 × 5.0 × 2.0 m3, length × width × height, respectively. The tunnel was covered with a transparent polyethylene film and equipped with a drip irrigation system. A data logger placed inside the tunnel collected daily minimum and maximum temperatures (Figure 1).
On 5 January 2020, 360 plug plants of ‘Canasta’ lettuce (Lactuca sativa L.) (Syngenta Seed, Basel, Switzerland), at the stage of four-five true leaves, were transplanted with 0.25 m and 0.20 m inter-rows and intra-rows spacing, respectively, making a density of 20 plants m−2. During the entire cultivation period, all lettuce plant needs were assured in adherence to all the recommended cultivation practices [48]. The soil was basically sandy clay loam at pH 7.2, composed by 1.6% of total nitrogen and 3.2% of organic matter. All lettuce plants were harvested 55 days after transplant.

2.2. Plant-Derived Protein Hydrolysates Application and Molybdenum Biofortification

The protein hydrolysates (PHs) treatments were performed using TYSON® (Mugavero fertilizers, Palermo, Italy), an organic biostimulant composed by 5% of total nitrogen (4.5% organic nitrogen), 25% of organic carbon and 31% of amino acids, obtained through enzymatic hydrolysis of soy plants at low temperature. PHs treatment was started one week after transplant, and it was accomplished weekly. Two doses of PHs were applied, 0 (control) or 3 mL L−1 (standard dose) and distributed via foliar spray. Four different doses of molybdenum (Mo) [0.0 (control), 0.5, 3.0 and 6.0 µmol Mo L−1], in form of sodium molybdate (Na2MoO4), were supplied via foliar spray. Mo fertilizations started one week after transplant and were applied every ten days.

2.3. Yield, Nutritional and Bioactive Attributes of Lettuce Plants

All the analyzes on the agronomic and functional features of the ‘Canasta’ lettuce plants were carried out on five plant samples, randomly selected from each replicate. Measurements of head fresh weight (HFW), head height (HH), stem diameter (SD), and number of leaves (NL) were taken immediately after plant harvest. To assess soluble solids content (SSC), 120 g of leaf samples were juiced and clarified; the measure of SSC was acquired by a refractometer (MTD-045 nD, Three-In-One Enterprises Co. Ltd. New Taipei, Taiwan). SSC was expressed as Brix°. To determine the head dry matter (HDM) percentage, the samples were placed in a thermo-ventilated oven at 105 °C till reaching steady weight. The HDM values were expressed as percentage.
Immediately after plant harvest, color coordinates were recorded through a colorimeter (Chroma-meter CR-400, Minolta corporation Ltd., Osaka, Japan) on five undamaged leaves arbitrarily designated from each replicate. CIELab colour coordinates a*, b* and L * indicate, respectively, the red-green axis, the yellow-blue axis and the lightness.
Ascorbic acid concentration was determined in leaf samples implementing a Reflectometer Merck RQflex10 Reflectoquant® (Sigma-Aldrich, Saint Louis, MO, USA) and Reflectoquant Ascorbic Acid Test Strips (Merck, Darmstadt, Germany).
Total phenolic concentration was assessed following the Folin-Ciocalteu method [49]. Briefly, the leaf sample was mixed with deionized water, sodium carbonate and Folin-Ciocalteau reagent, then the solution was incubated at ambient temperature for 30 min. The 750 nm wavelength was used to measure the mixture’s absorbance with the means of a spectrophotometer. After a conversion, total phenolic concentration was expressed as µg g−1 fresh weight.
Sugar concentration in lettuce plants was evaluated as reported by Serna et al. [50]. Briefly, three grams of the plant sample were centrifuged at 15,000× g for 20 min with 10 mL of distilled water. Then, a 10 µL aliquot was analyzed by high-performance liquid chromatography (HPLC). Results were shown as a percentage of fresh weight.

2.4. Plant Pigments and Mineral Profile

Total chlorophyll and carotenoid concentrations in leaf tissues were evaluated as reported by Costache et al. [51]. Briefly, 1 g of fresh leaf sample was mixed with methanol and homogenized, then the measure was accomplished with a spectrophotometer. Total chlorophyll was expressed as mg 100 g−1 fresh weight, whereas carotenoid concentration was shown as µg g−1 fresh weight.
Potassium (K), calcium (Ca), and magnesium (Mg) concentrations were determined following the method of Morand and Gullo [52]. The phosphorous (P) concentration in leaf tissues was measured as described by Fogg and Wilkinson [53]. Total nitrogen (N) concentration was assessed following the Kjeldahl method. Molybdenum (Mo) concentration was appraised by inductively coupled plasma-mass spectrometry (ICP-MS) (Plasma Quant MS Elite, Jena, Germany), as detailed by Sabatino et al. [41]. All the mineral concentrations in leaf tissues were expressed as mg g−1 dry weight.

2.5. Nitrogen Indices

Nitrogen use efficiency (NUE), nitrogen uptake efficiency (UE) and nitrogen physiological efficiency (PUE) were calculated using the following formulas: NUE = yield (t)/N application rate (kg); UE = plant N content (kg)/N application (kg); PUE = yield (t)/plant nitrogen content (kg).

2.6. Statistics and Experimental Design

A randomized complete block design was adopted for this experiment, with each block replicated three times. Two doses of PHs (0.0 or 3.0 mL L−1) were combined with four doses of Mo (0.0, 0.5, 3.0 or 6.0 µmol Mo L−1) in a two factorial trial displaying eight treatments in total (2 PHs doses × 4 Mo doses). Each treatment included 15 plants, rendering a total of 360 plants. All data were analyzed by implementing the SPSS software v.20 (StatSoft, Inc., Chicago, IL, USA) package through a two-way analysis of variance (ANOVA), setting PHs and Mo doses as fix factors. A Tukey honestly significant difference (HSD) test (p < 0.05) was used to separate the means. Percentage data were converted via arcsin transformation prior ANOVA analysis (Ø = arcsin(p/100)1/2).
To summarize all plant traits, a heat map was also provided through the online program package clustvis (https://biit.cs.ut.ee/clustvis/ (accessed on 15 January 2021).) with Euclidean distance as the similarity measure and hierarchical clustering with complete linkage.

3. Results

3.1. Crop Yield and Biometric Features

ANOVA for HFW, HH, SD and NL showed no significant interaction between PHs and Mo treatments (Table 1).
Irrespective of the Mo treatments, PHs significantly increased HFW. Regardless of the PHs application, Mo dosage did not significantly affect HFW of lettuce plants. Data on HH supported the trend described for HFW (Table 1). Disregarding Mo fertilization, PHs application did not significantly influence SD values. Conversely, regardless of the PHs treatment, SD was significantly higher in non-biofortified plants than in plants supplied with Mo (Table 1). ANOVA for NL did not display a significant influence of the main factors and of their interaction (Table 1).

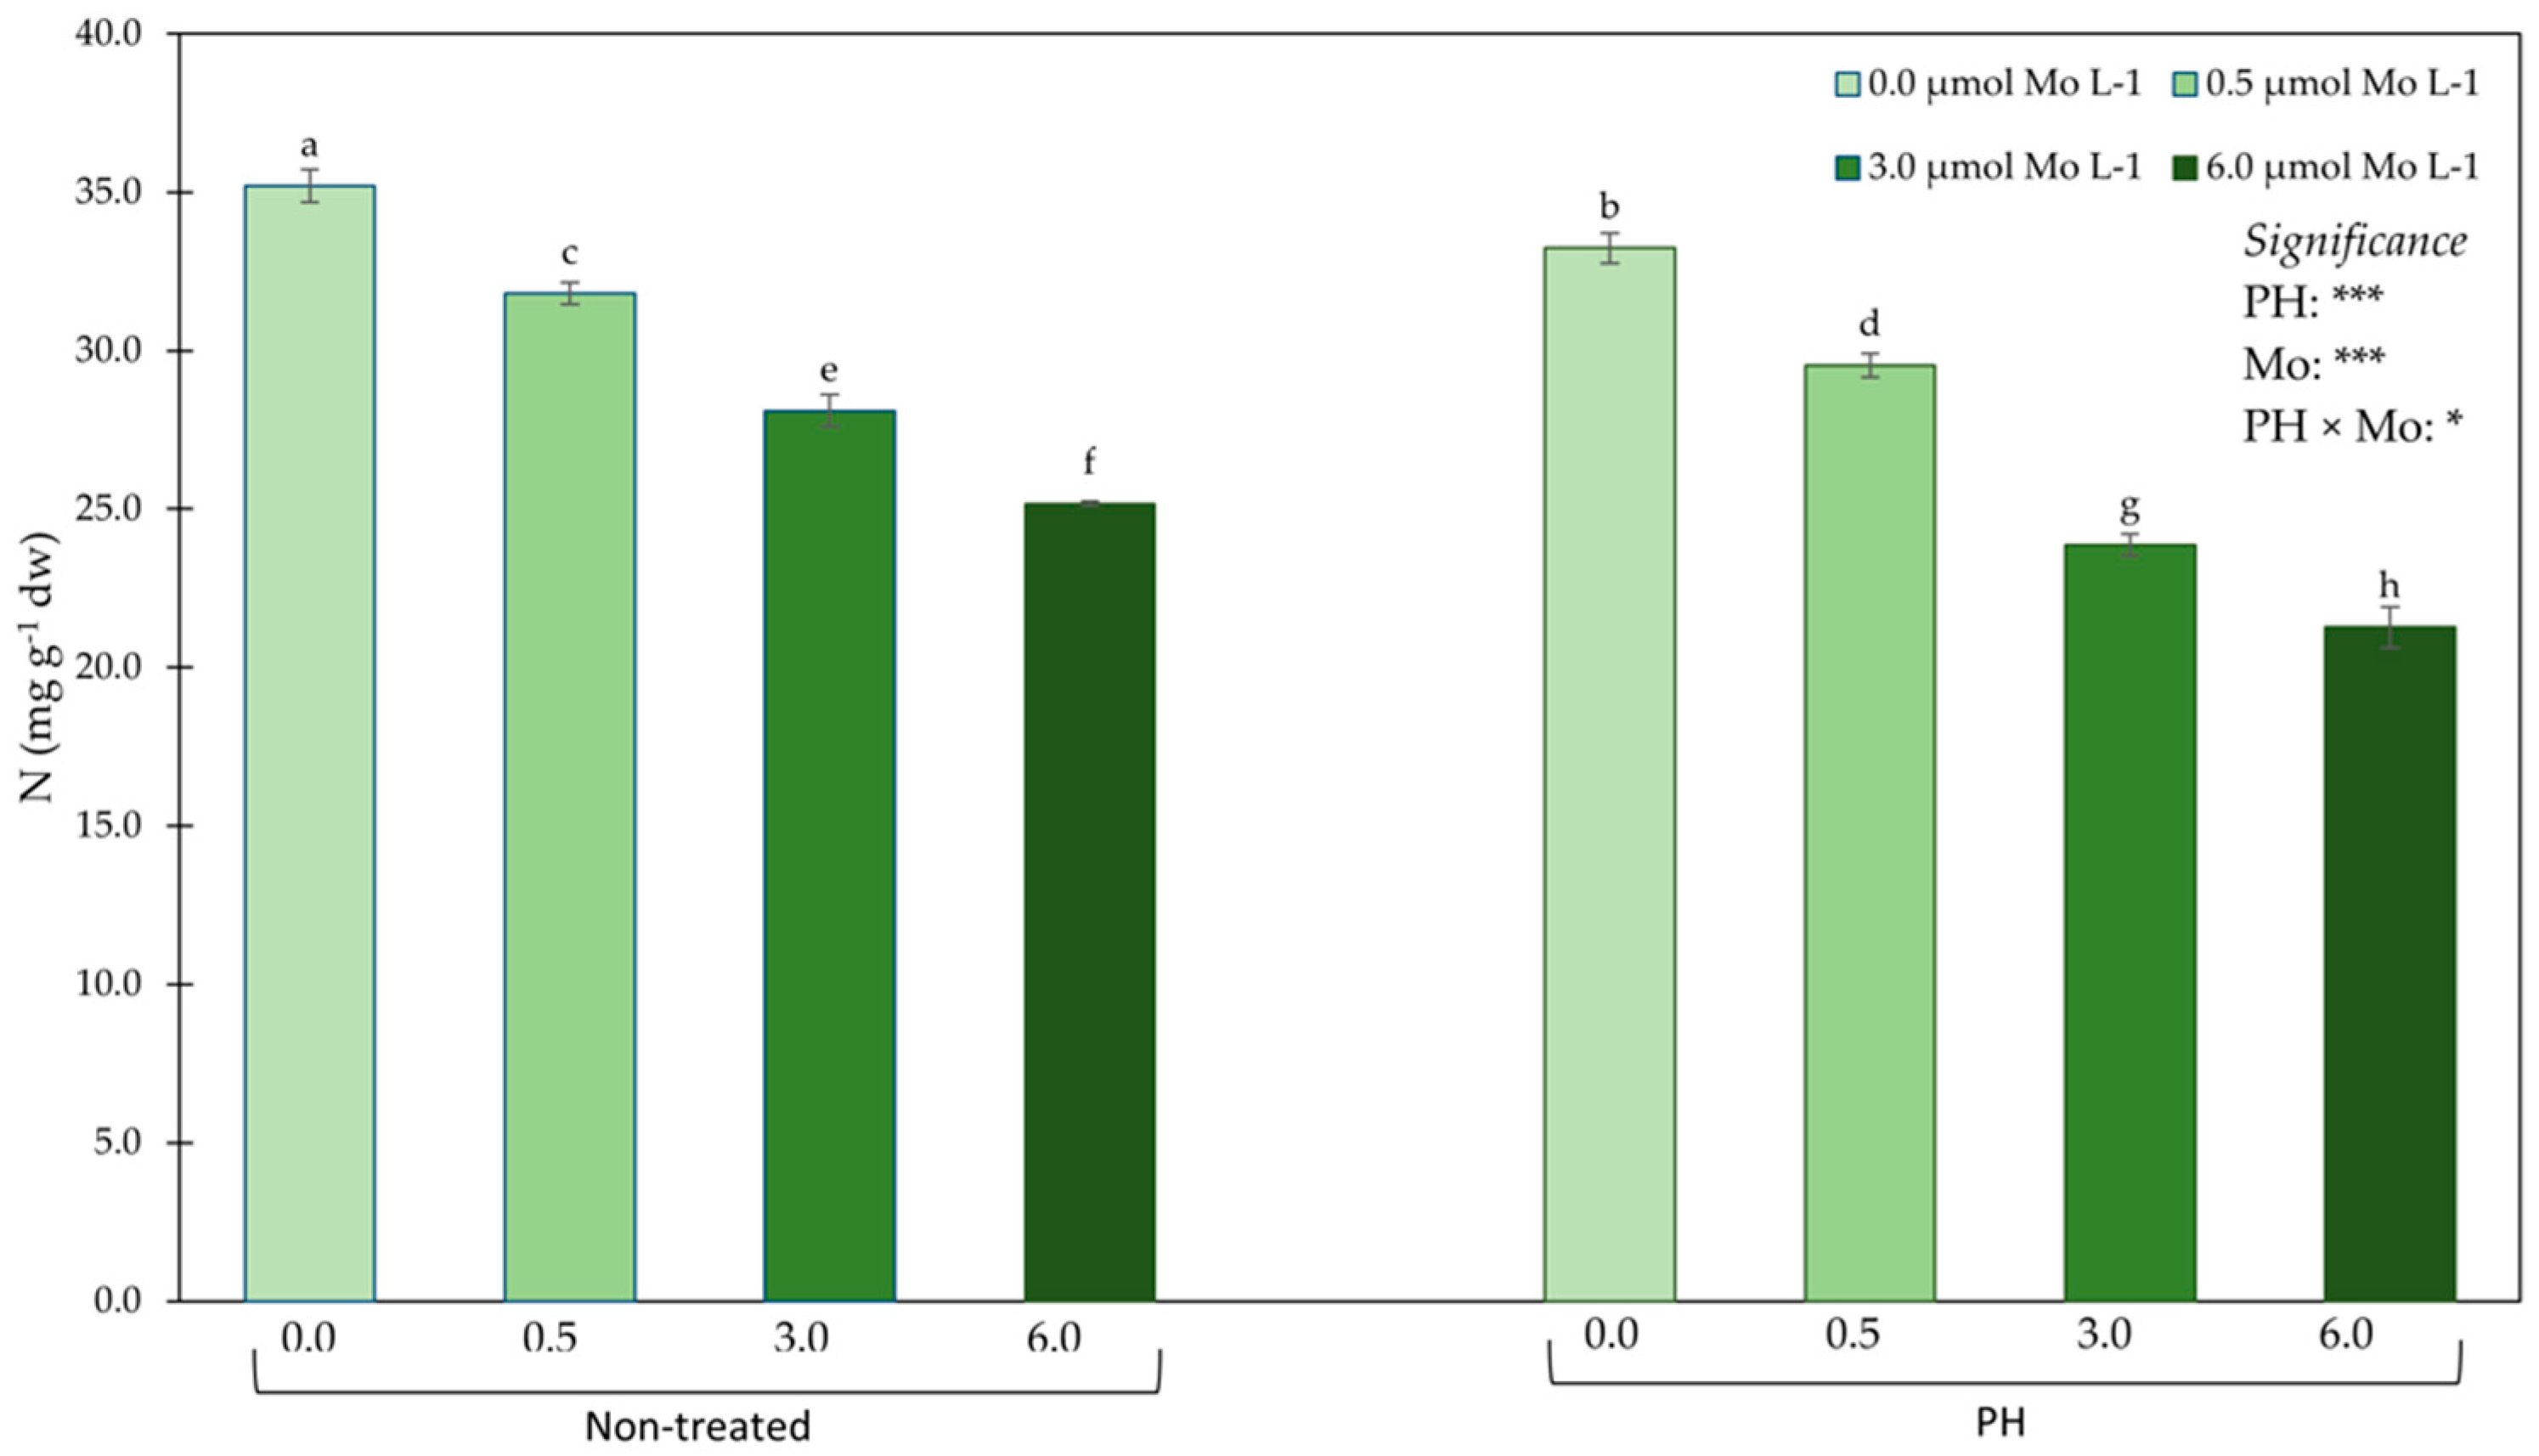
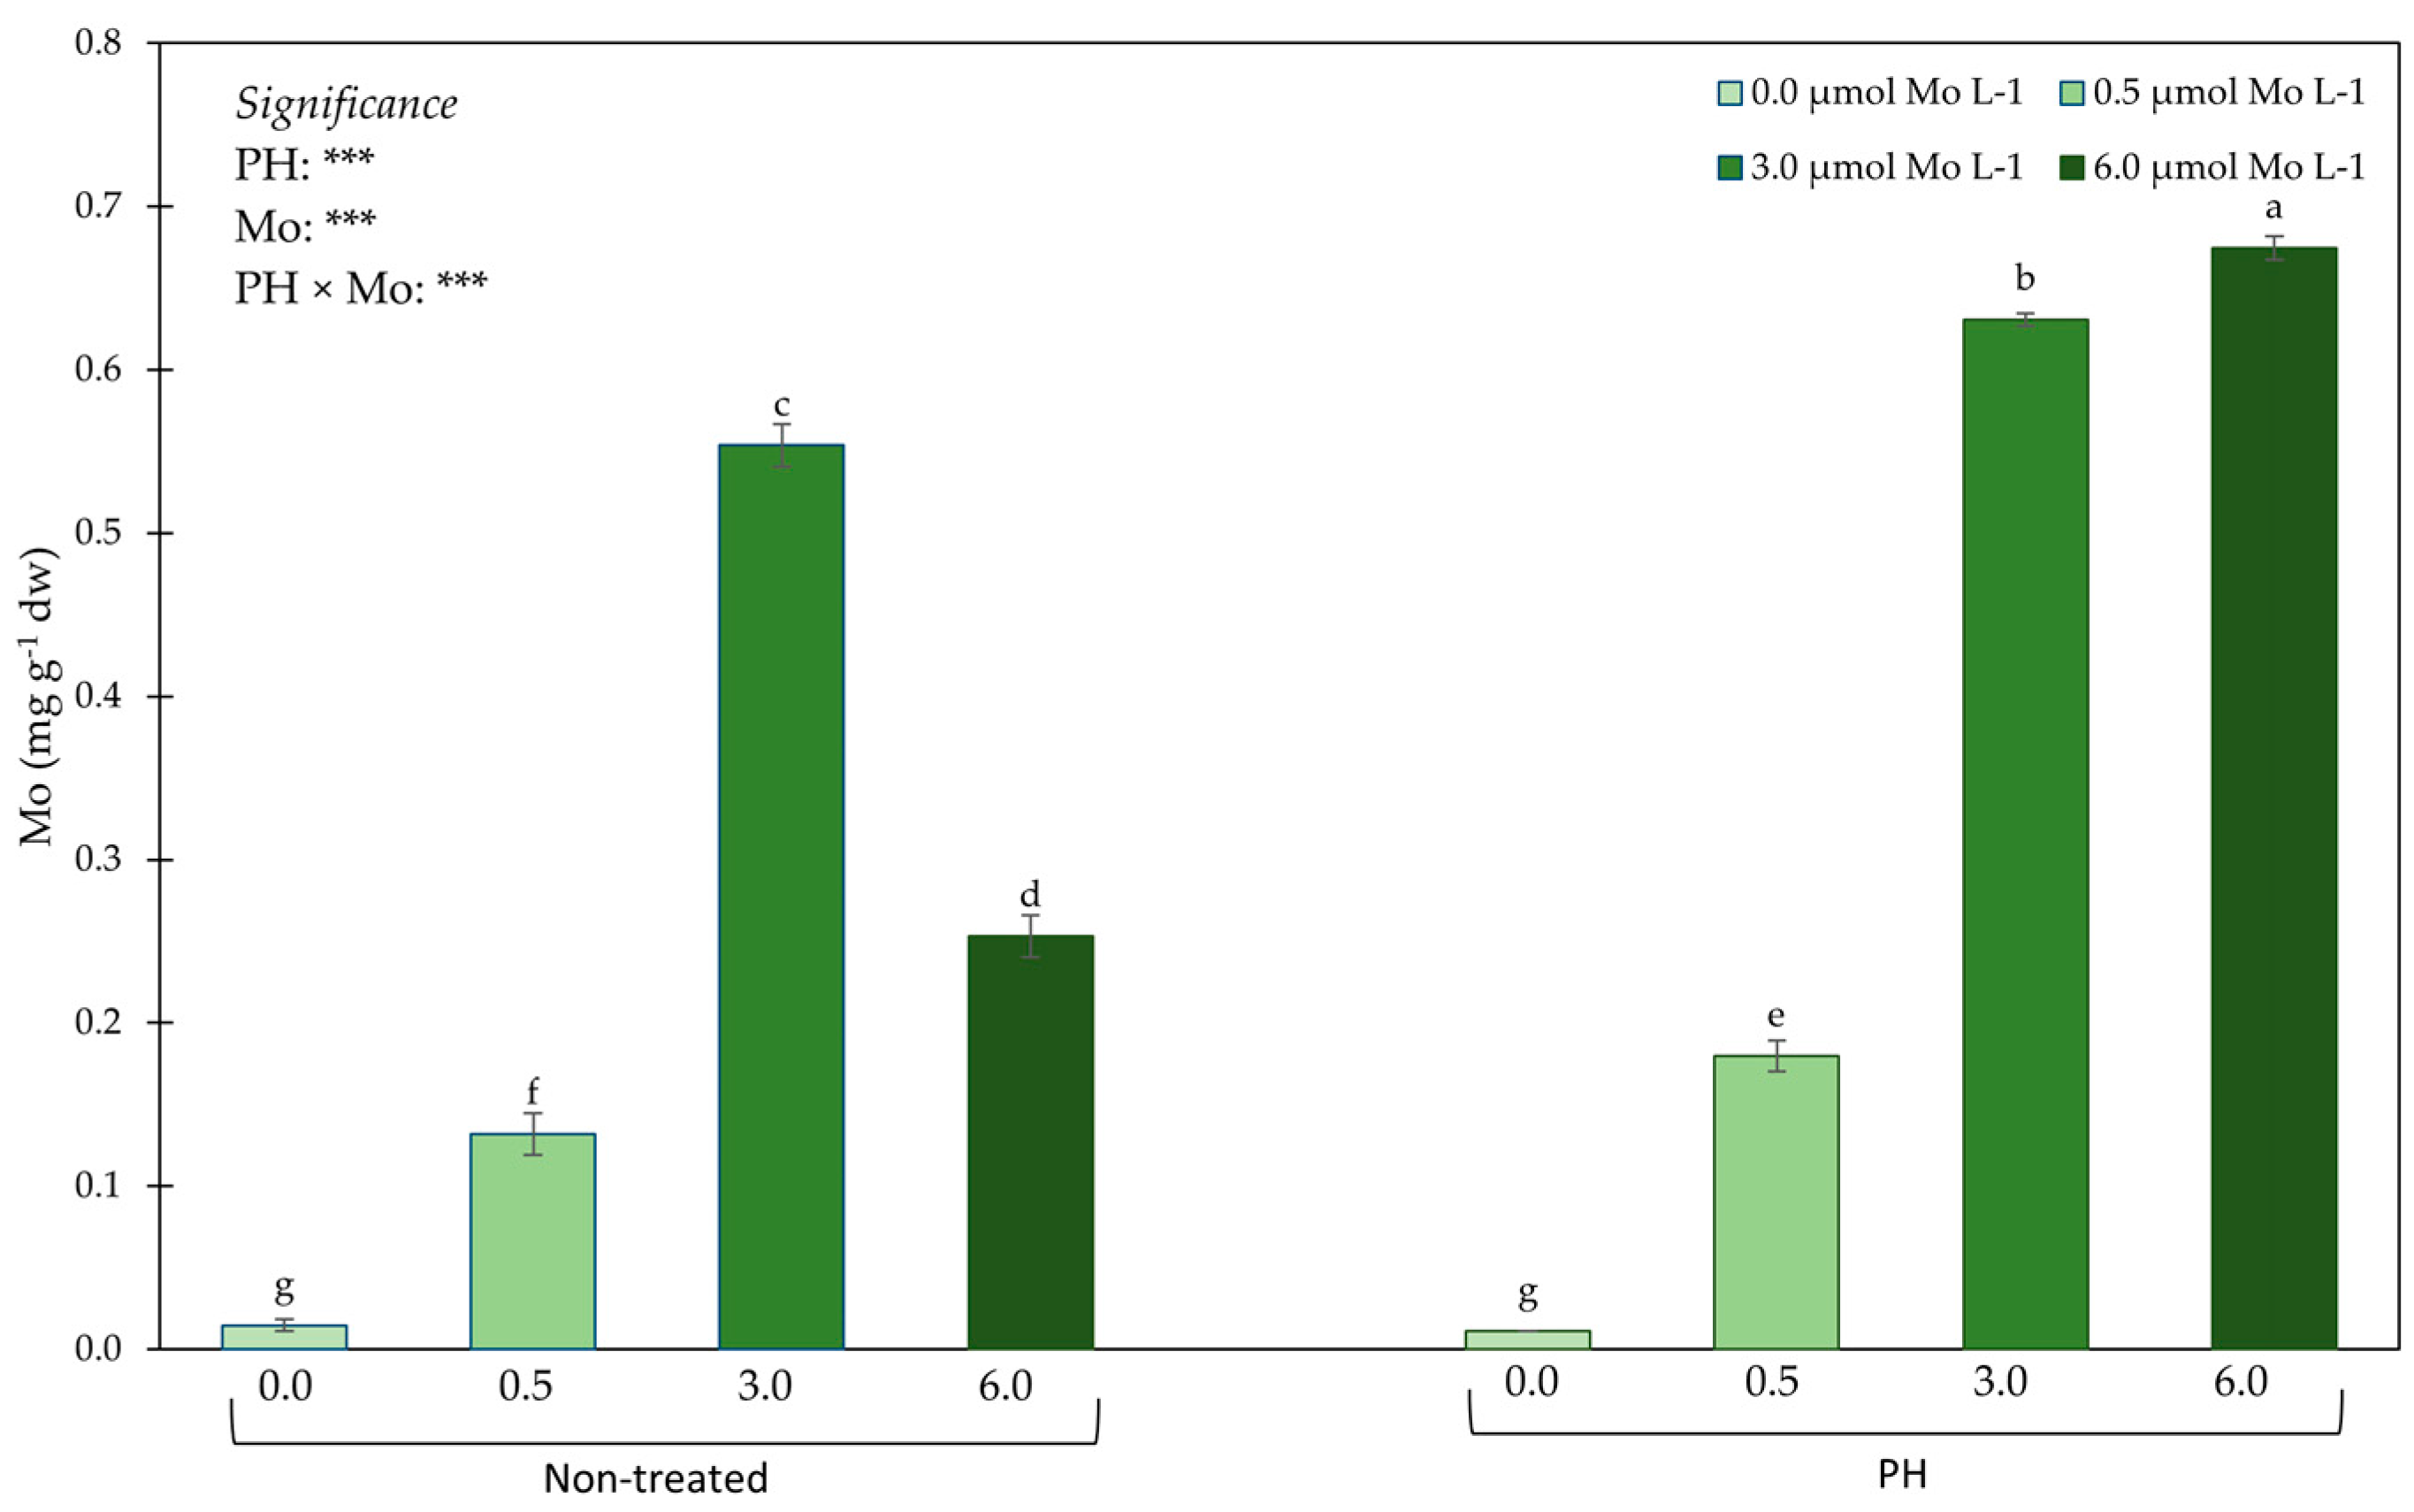
3.2. Mineral Profile in Leaf Tissues

ANOVA analysis for P, K, Ca, and Mg did not reveal a significant interaction PHs × Mo (Table 2).
PHs application and Mo concentration did not significantly affect P and Ca concentration in plant tissues (Table 2). Irrespective of the PHs treatments, Mo dosage did not influence leaf K concentration. Conversely, regardless of the Mo dosage, plants treated with PHs showed a higher K concentration than non-treated ones (Table 2). Data on Mg concentration sustained the tendency described for K concentration (Table 2).
ANOVA and mean separation for plant N concentration showed a significant interaction PHs × Mo (Figure 2).
Plants not treated with PHs and without Mo supply had the highest leaf nitrogen concentration followed by those treated with PHs and without Mo supply which in turn revealed a higher N concentration than those supplied with 0.5 µmol Mo L−1 and not treated with PHs. The lowest N concentration was assessed in plants from the combination PHs × 6.0 µmol Mo L−1 (Figure 2).
Statistical analysis for Mo concentration revealed a significant interaction PHs × Mo (Figure 3); the highest Mo concentration was observed in plants treated with the PHs and 6.0 µmol Mo L−1 followed by that recorded in the combination PHs × 3.0 µmol Mo L−1. Meanwhile, the lowest values were recorded in plants not treated with PHs and without Mo supply and in those treated with PHs and without Mo supply (Figure 3).

3.3. Nutritional and Bioactive Compounds
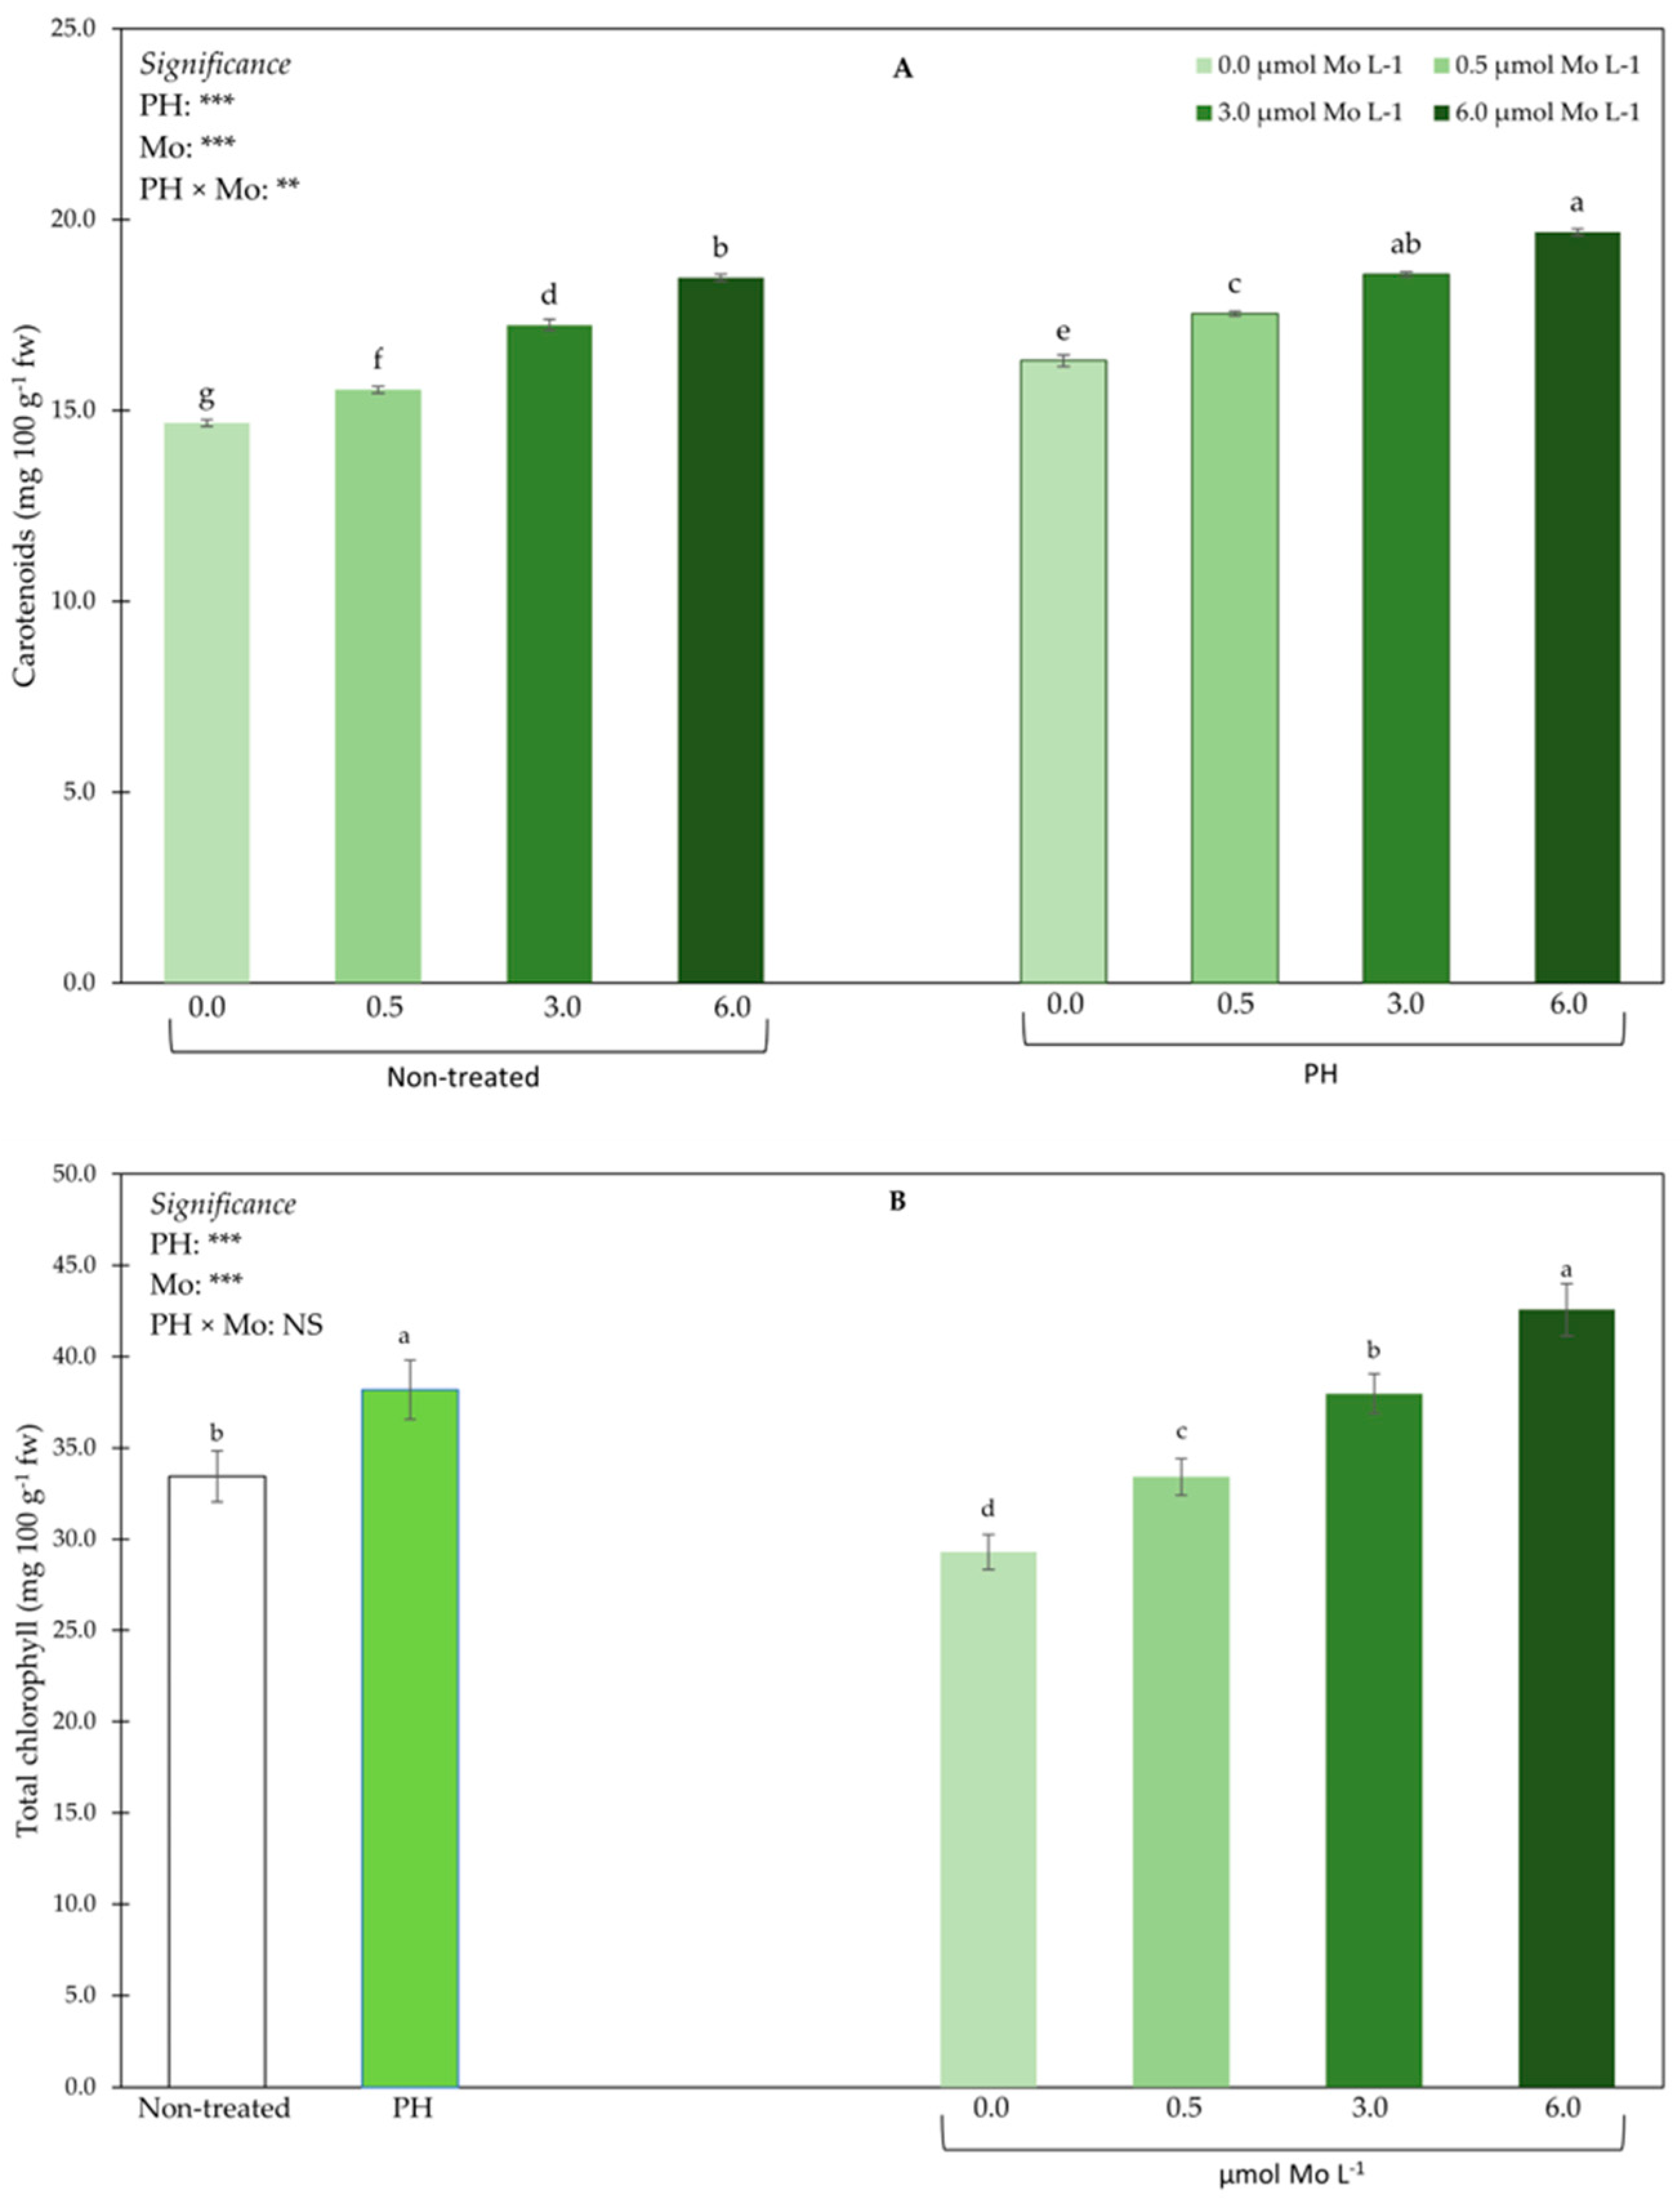
Statistical analysis for ascorbic acid and CIELab parameters displayed no significant interaction PHs × Mo (Table 3).
Disregarding the Mo concentration, PHs treated plants showed a higher ascorbic acid concentration than untreated ones. Irrespective of PHs treatments, our outcomes revealed that augmenting the Mo concentration resulted in a significant increase in ascorbic acid leaf content (Table 3). Results on a* colour parameter showed that, irrespective of the PHs treatment, Mo biofortification did not significantly influence a* coordinate (Table 3). Contrariwise, PHs significantly decreased a* coordinate (Table 3). ANOVA and means separation revealed that both PHs application and Mo concentration did not significantly affect b* and L* CIELab parameters. (Table 3).
ANOVA for HDM, SSC, total sugars and total phenolics showed an interactive effect PHs × Mo (Table 4).
Plants of the combination PHs × 0.0 µmol Mo L−1 had the highest HDM percentage followed by the plants not treated with PHs and supplied with 6.0 µmol Mo L−1. The lowest HDM value was recorded in plants treated with PHs and supplied with the highest dose of Mo (Table 4).
PHs treated plants and subjected to the highest Mo dosage had the highest SSC followed by the plants of the combinations PHs × 0.5 µmol Mo L−1 and PHs × 3.0 µmol Mo L−1. In contrast, the lowest SSC values were recorded in plants not treated with PHs and not supplied with Mo and in those treated with PHs and supplied with 0.5 µmol Mo L−1 (Table 4).
The highest total sugars concentration was exhibited in plants from the combination PHs × 6.0 Mo (Table 3). Meanwhile, the lowest total sugars values were observed in plants not treated with PHs and not supplied with Mo and in those treated with PHs and without Mo supply (Table 4).
Plants from the combination PHs × 6.0 revealed the highest total phenolic content, followed by those not treated with PHs and supplied with the highest dosage of Mo. The lowest total phenolic concentration was registered in plants not treated with PHs and not supplied with Mo and in PHs treated plants and without Mo supply (Table 4).

3.4. Pigments

ANOVA for carotenoids showed a significative interaction PHs × Mo (Figure 4A); plants from the PHs × 6.0 µmol Mo L−1 combination had the highest values, followed by the plants not treated with PHs and supplied 6.0 µmol Mo L−1. However, PHs treated plants and supplied with a dosage of 3.0 µmol Mo L−1 did not significantly differ neither from plants belonging to the PHs × 6.0 µmol Mo L−1 combination, nor from those not treated with PHs and supplied with 6.0 µmol Mo L−1. The lowest carotenoids concentration was observed in plants not treated with PHs and not supplied with Mo (Figure 4A).
Results on leaf total chlorophyll showed no interaction between PHs and Mo treatments (Figure 4B). Irrespective of the Mo treatments, total chlorophyll concentration was higher in plants treated with PHs. Averaged over PHs treatment, total chlorophyll concentration increased with the increase of the Mo concentration (Figure 4B).

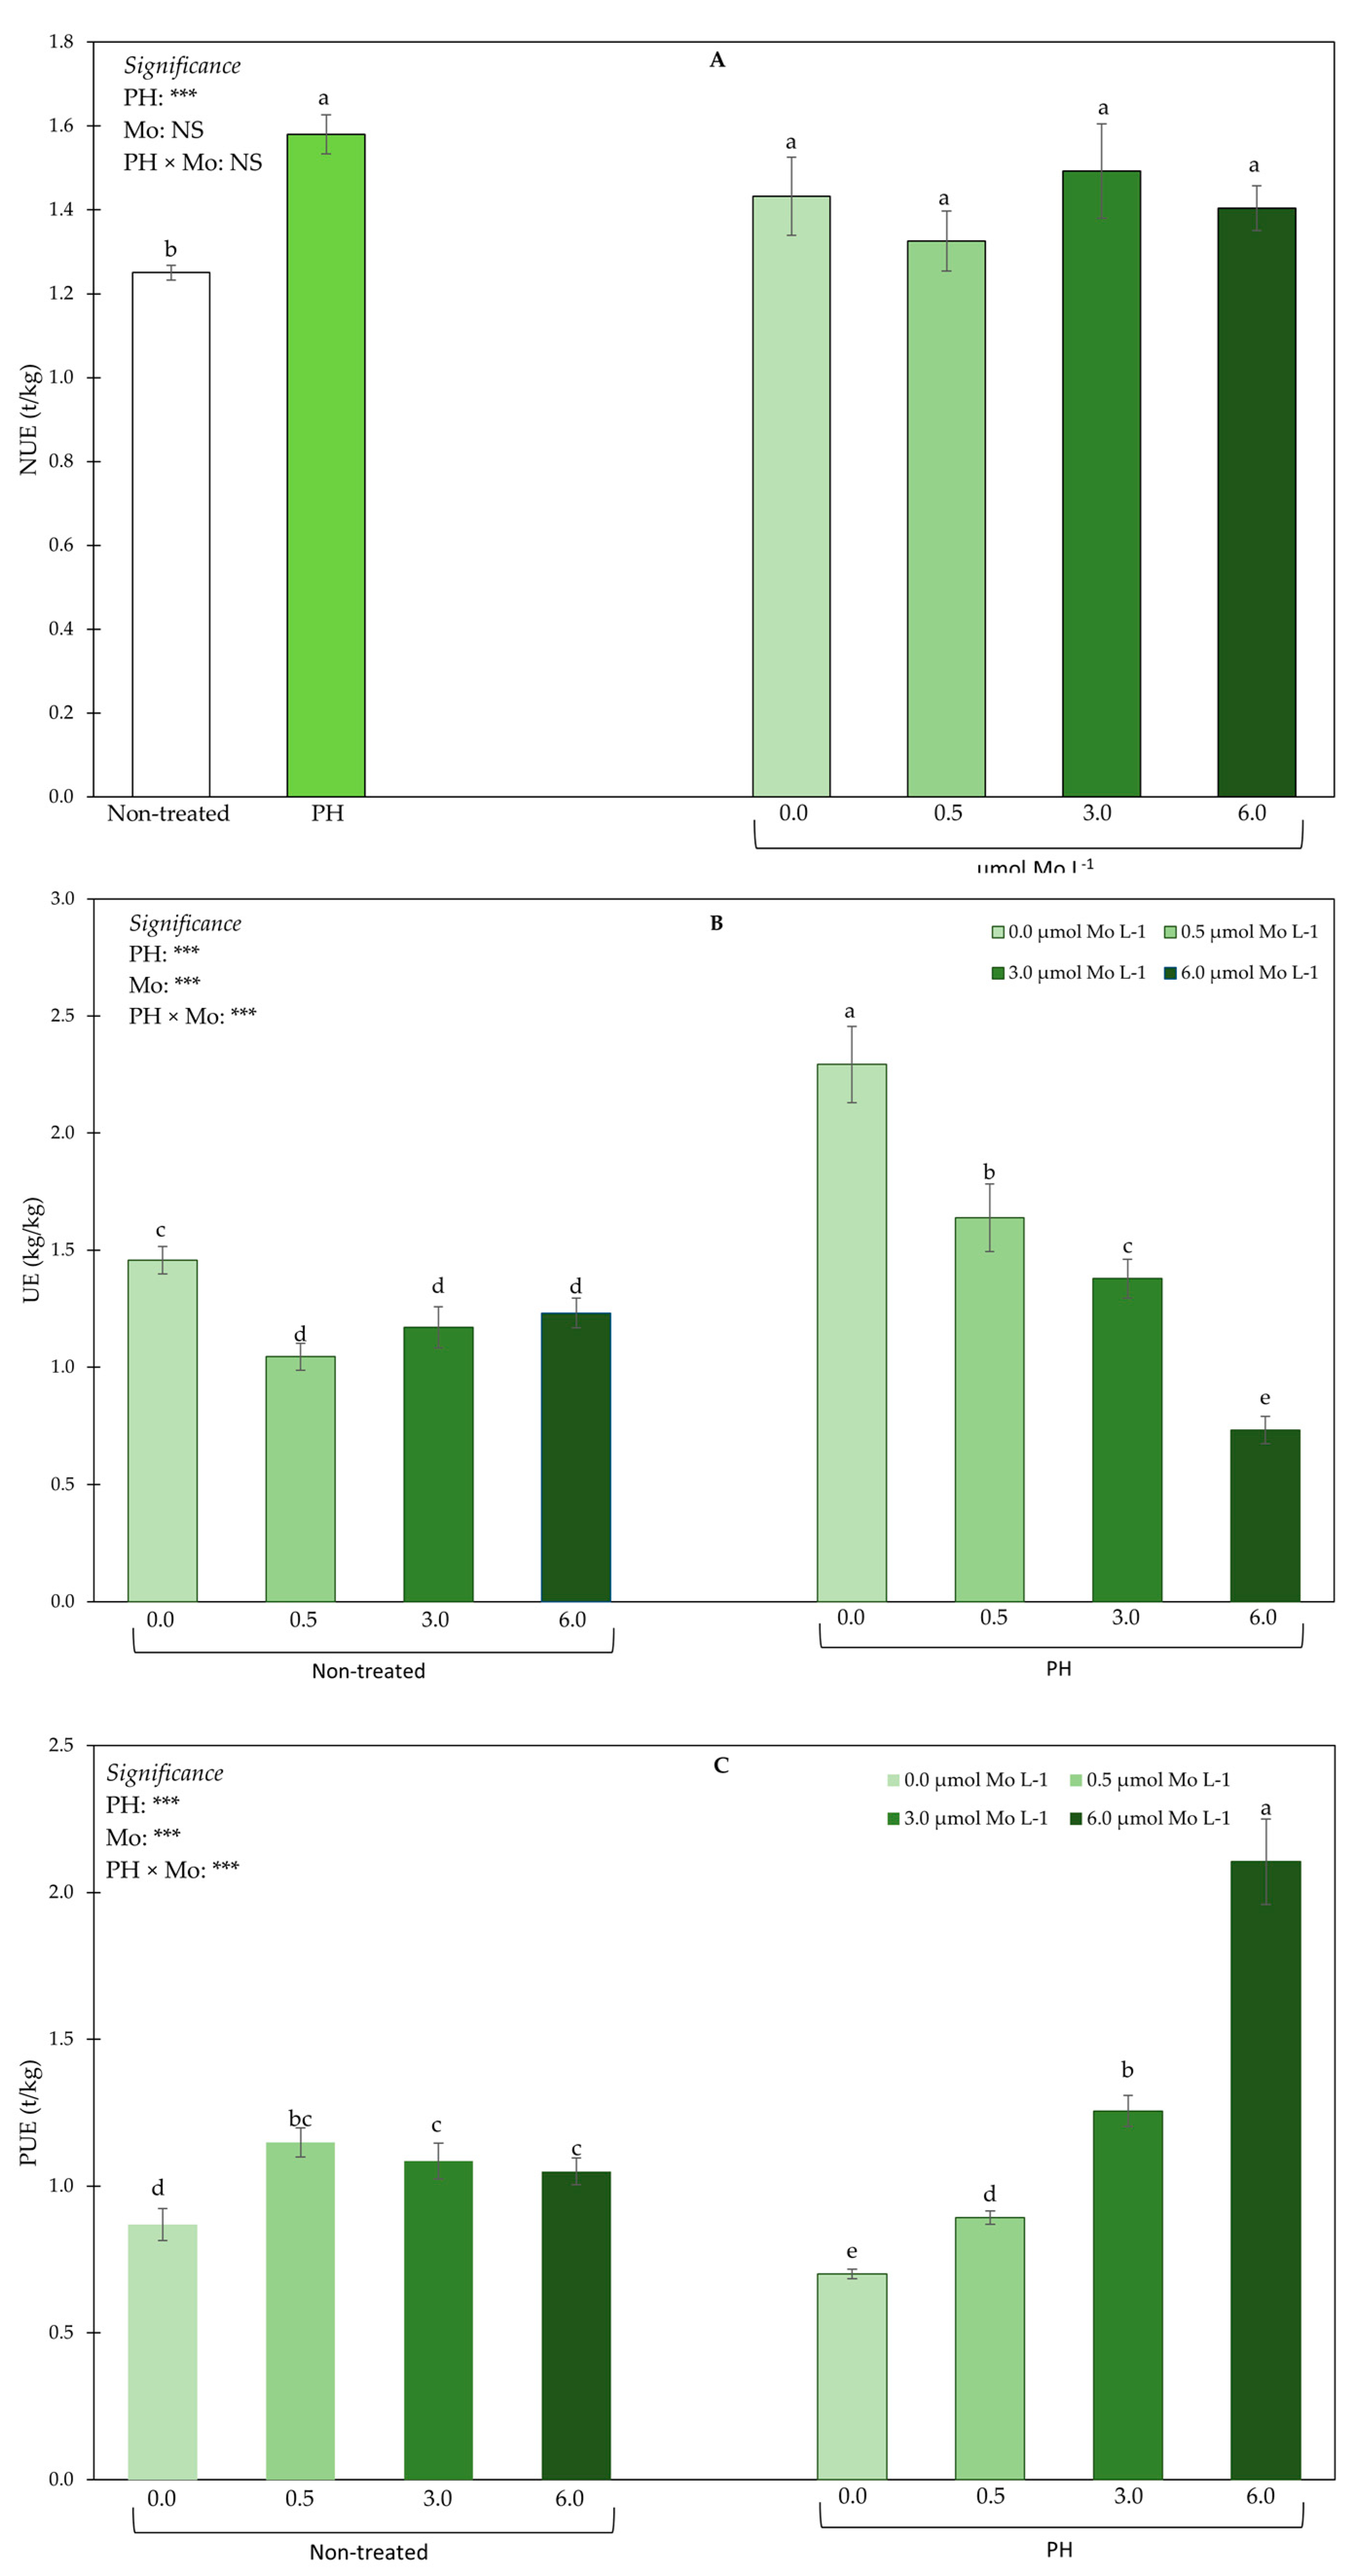
3.5. Nitrogen Indices

Statistical analysis for NUE did not display a significant interaction PHs × Mo (Figure 5A). Regardless of the Mo treatments, plants supplied with PHs revealed a higher NUE values than non-treated ones. Averaged over PHs, Mo application did not influence the NUE (Figure 5A).
Statistics on UE underlined a significant interaction PHs × Mo (Figure 5B); the highest UE index was obtained in plants supplied with PHs and not treated with Mo, followed by those recorded in plants supplied with PHs and treated with a dosage of 0.5 µmol Mo L−1. Inversely, the combination PHs × 6.0 µmol Mo L−1 showed the lowest UE values (Figure 5B).
ANOVA for PUE highlighted a significant interaction between PHs and Mo (Figure 5C). The highest PUE values were recorded in the PHs × 6.0 µmol Mo L−1 combination, followed by those collected in the PHs × 3.0 µmol Mo L−1 combination. However, plants not treated with PHs and supplied with 0.5 µmol Mo L−1 did not significantly differ in terms of PUE neither from plants non treated with PHs and supplied with 3.0 or 6.0 µmol Mo L−1, nor from those treated with PHs and supplied with 3.0 µmol Mo L−1. The lowest PUE values were observed in PHs treated plants and not supplied with Mo (Figure 5C).

3.6. Heat Map Analysis of All Recorded Plant Traits

A heat map analysis of all plant traits was carried out to reveal a chromatic assessment of the PHs and Mo treatments on plant traits. The heat map displayed two dendrograms, one situated on the top and called Dendrogram 1, and another placed on the left side, named Dendrogram 2 (Figure 6).
Dendrogram 1 enclosed the combinations of PHs and Mo treatments, whereas, Dendrogram 2 showed all investigated traits that affected this distribution. Dendrogram 1 showed two main clusters: on the left, it gathered the PHs untreated × 0.0, 0.5, 3.0, and 6.0 µmol Mo L−1 combinations, while on the right side the cluster includes the PHs treated × 0.0, 0.5, 3.0, and 6.0 µmol Mo L−1 combinations (Figure 6).
In particular, two clusters were recognized on the left side of Dendrogram 1. The first on left side enclosed the PHs untreated × 0.0 µmol Mo L−1 and PHs untreated × 0.5 µmol Mo L−1 combinations, separated from PHs untreated × 3.0 µmol Mo L−1 and PHs untreated × 6.0 µmol Mo L−1 combination, which revealed in particularly lower values for SD, N, HDM, UE, NL and P, but higher values for b*, L*, Ca, PUE, Mo, total phenolic, SSC, ascorbic acid, carotenoids, total sugars, and total chlorophyll. The group on the left comprised untreated × 0.0 and non-treated × 0.5 combination. Within this cluster, PHs untreated × 0.0 µmol Mo L−1 combination is clearly separated by higher SD, N, HDM, UE, Mg, HFW, and NUE and lower a*, P, HH, Ca, PUE, Mo, total phenolic, SSC, ascorbic acid, carotenoids, total sugars, and total chlorophyll. Meanwhile, the grouping on the right contained the PHs untreated × 3.0 µmol Mo L−1 and the PHs untreated × 6.0 µmol Mo L−1 combinations. Within this cluster, the PHs untreated × 3.0 µmol Mo L−1 combination was parted by higher SD, N, b*, a*, L*, NL, P, Mg, and Mo and lower HDM, HFW, NUE, Ca, total phenolic, carotenoids, total sugars, and total chlorophyll.
On the right side of the Dendrogram 1 two clusters were identified, the first on the left comprised PHs treated × 0.0 µmol Mo L−1 and PHs treated × 0.5 µmol Mo L−1 combinations separately from the PHs treated × 3.0 µmol Mo L−1 and PHs treated × 6.0 µmol Mo L−1 combination, which had, particularly, higher SD, N, b*, HDM, UE and L*, but lower NL, HFW, NUE, PUE, Mo, total phenolic, SSC, ascorbic acid, carotenoids, total sugars, and total chlorophyll. The cluster on the left included the PHs treated × 0.0 µmol Mo L−1 combination. In this cluster, the PHs treated × 0.0 µmol Mo L−1 combination is noticeably separated by lower NL, P, HH, Ca, PUE, Mo, total phenolic, SSC, ascorbic acid, carotenoids, total sugars, and total chlorophyll, whereas the cluster on the right includes PHs treated × 3.0 µmol Mo L−1 and PHs treated × 6.0 µmol Mo L−1 combinations. Inside this cluster, the PHs treated × 3.0 µmol Mo L−1 combination is separated by lower L*, P, HH, PUE, total phenolic, SSC, ascorbic acid, carotenoids, total sugars, and total chlorophyll, and higher SD, N, b*, HDM, UE, a*, NL, K, Mg, HFW, NUE, and Ca. The clusters in Dendrogram 2 evidently point out the differential effects of PHs application and Mo supply.

4. Discussion

In recent years, PHs have acquired importance as plant biostimulants owing to their capacity to enhance the seed germination, yield, and quality of vegetables [2]. Concomitantly, plant mineral nutrition organization, including the supply of trace elements such as molybdenum, is a key pre-harvest aspect for yield and quality improving many vegetable crops. In the present research, the possible use of PHs and Mo biofortification, alone or combined, to improve yield and quality of lettuce was apprised. The study revealed that PHs significantly increased HFW and HH traits. These results are coherent with those listed by Di Mola et al. [54] who, by studying the influence of plant-based biostimulants on agronomical, physiological, and qualitative responses of baby rocket leaves under varied nitrogen levels, found that legume-derived PHs positively affected yield trait. Our outcomes are also in line with those indicated by Consentino et al. [10] in celery. There are also reports that PHs have a biostimulant role via the variation of plant molecular and physiological mechanisms that elicit growth and plant productivity [4,55]. PHs effects on plants comprise carbon and nitrogen metabolism stimulation. Furthermore, as reported by a number of authors [3,13,20], PHs have a significant role in the regulation of plant nitrogen uptake, via key enzymes included in the nitrogen assimilation mechanism, and in the regulation of the activity of three enzymes involved in the tricarboxylic acid cycle. Moreover, as specified by Colla et al. [17] and Colla et al. [20], bioactive peptides included in PHs could also interact with plant hormonal actions. Numerous researches have revealed that PHs can stimulate hormone-like activities (gibberellins and auxin), encouraging plant organ growth, and consequently crop yield [15,16,17,18]. In this study, the improved yield of plants treated with PHs could be also attributed to the certainty that PHs TYSON® contains tryptophan (forerunner of indole−3-acetic acid) which determines shoot and root expansion in plants. Data indicated that although Mo biofortification did not affect HFW, HH, and NL, but it significantly influenced SD. These findings are consistent with those of Moncada et al. [40] on lettuce and with those of Biacs et al. [56] and Vieira et al. [57] on carrot and common bean.
Plant N concentration indicated that the PHs application reduced N accumulation in leaf tissue. These findings concur with those reported by Liu and Lee [58], who stated that amino acids mix treatments significantly reduced nitrate accumulation in several leafy vegetables. Moreover, data presented are in line with that reported by Tsouvaltzis et al. [59] who found that lettuce nitrate build-up reduces as PHs dose increases. PHs action in limiting the relevant accumulation of nitrogen in plants might be related to the huge regulation attitude of many metabolic pathways involved in the metabolism of nitrogen [2]. Additionally, other authors [20] pointed out that PHs with a high level of free amino acids guide to stout phloem loaded with amino acids which, accordingly, diminish root nitrate absorption and accumulation. Thus, as suggested by Consentino et al. [10] in celery, the reduction of N concentration in plants treated with PHs could be attributed to the use of their own nitrogen deposits without supplemental nitrogen uptake. Generally, the imperative function of amino acids is the modulation of a number of mechanisms and metabolic pathways related to the nitrogen metabolism in plants [55,58]. The present study revealed that N leaf concentration decreased as Mo dosage increased. These findings are coherent with those obtained by Moncada et al. [40], who report that a higher Mo dosage is effective in N leaf concentration reduction in lettuce, escarole and curly endive plants. Our results support those of Zhen et al. [60] who found that Mo supply reduces N content in lettuce plant tissues. There are reports of a negative relation between Mo dosage and N concentration in spinach and poinsettia plants [61,62,63]. As stated by Schwarz [64], molybdenum cofactors (Moco) contribute to the active site of nitrate reductase which has an imperative function in nitrate absorption and may enhance the nitrogen use efficiency.
PHs did not significantly affect P and Ca leaf concentration. On the contrary, PHs application resulted an effective tool to enhance K and Mg concentration. This is in accordance with the findings of Rouphael et al. [5], who indicated that plant-derived PHs meaningfully augment K and Mg concentrations in tomato fruits, and it also concurs with the results of Consentino et al. [10] who found that plant or animal-derived PHs significantly improve K and Mg concentrations in celery, although they do not affect P and Ca concentration. Furthermore, data on mineral profile revealed that Mo-biofortification did not significantly affect P, K, Ca and Mg concentration in lettuce.
PHs application enhanced Mo concentration in plant tissues. This output is in line with other studies [2,15,20] which report that PHs enhance plant macro- and micronutrient uptake. Additionally, while PHs non-treated plants showed a decrease in Mo concentration when Mo concentration in the nutrient solution was higher than 3.0 µmol L−1, PHs treated plants revealed a positive relation between Mo supply dosage (up to 6.0 µmol Mo L−1) and Mo concentration in leaf tissues. Thus, we may hypothesize that PHs applications improves plant Mo tolerance.
PHs significantly increased ascorbic acid concentration. This is in accordance with other studies, which found that foliar application of plant-derived PHs enhances ascorbic acid in tomato and celery [2,5,10]. The ascorbic acid concentration could be linked to the improved mineral uptake of plants treated with PHs, which could in turn enhance the synthesis of some amino acids, like tyrosine and phenylalanine [5]. In our study, Mo supply positively affected ascorbic acid content. This is consistent with the report of Moncada et al. [40] on lettuce, escarole, and curly endive. As described by Valenciano et al. [65], ascorbic acid concentration can be influenced by Mo supply. In this regard, the intensification of enzymes responsible for ascorbic acid oxidation (phenol oxidase and peroxidase) is associated with Mo plant concentration. Contrariwise, Sabatino et al. [41] studying the interactive effect of genotype and Mo supply on tomato yield and fruit quality found a decrease in ascorbic acid concentration with an increase in Mo level. This contrasting result might be related to the different Mo plant organ distributions among plant species [66].
Colour of vegetables is a fundamental visual quality feature that often influences consumer’s choice. Colour parameters revealed that PHs application increased leaf greenish, whereas it did not significantly affect b* and L* colour traits. This is consistent with the findings of Consentino et al. [10]. These results are partially coherent with those of other authors [67,68] who reported that PHs treatment does not significantly influence colour traits in perennial wall rocket. In this study, Mo biofortification did not affect colour traits. Our results partially differ from those of Moncada et al. [40], who found that Mo-enrichment does not affect L* coordinate, but significantly influences Chroma and Hue angle.
HDM indicated that PHs application combined with Mo biofortification (up to 3.0 µmol L−1), enhanced HDM. In contrast, PHs application combined with the highest Mo dosage (6.0 µmol L−1) negatively affected HDM parameter. This is in accordance with the findings of Sabatino et al. [41] who revealed that Mo supply decreases fruit water content in tomato. Moreover, the results presented are consistent with those of Moncada et al. [40], who stated that Mo-biofortification significantly increases head dry matter in lettuce, escarole and curly endive. Similar results are also reported by Boertje [69], Valenciano et al. [65] and Randall et al. [70] on lettuce, chickpea and grain, respectively. However, it can be hypothesized that the higher mineral uptake efficiency of PHs treated plants combined with the highest Mo level caused a HDM reduction, which in turn can be considered a plant toxicity signal.
SSC was positively influenced by the interactive effect of PHs and Mo and the best results were recorded in plants from the combination PHs × 6.0 µmol Mo L−1. These results are partially in line with those of Moncada et al. [40] who reported that a Mo supply up to 1.5 µmol L−1 positively affects lettuce SSC, whereas a Mo supply at 3.0 µmol L−1 reduces SSC content. In the present study, Mo levels up to 3.0 µmol L−1 enhanced SSC in PHs non-treated plants, whereas Mo at 6.0 µmol L−1 did not determine a further increase. Contrariwise, PHs treated plants showed a positive relation between Mo dosage and SSC values. Thus, it seems that PHs application can boost plant Mo tolerance.
PHs and Mo supply significantly interacted enhancing total sugars. In particular, plants from the PHs × 6.0 µmol Mo L−1 combination had the highest sugar content. This is in accordance with the finding of Carillo et al. [71] who, by investigating the effect of PHs biostimulant and nitrogen fertilization level on morphological and physiological traits of spinach grown in a greenhouse, found that irrespective of the nitrogen fertilization level, PHs significantly increased sucrose concentration in spinach. Furthermore, the study underlined that Mo supply improved total sugars in ‘Canasta’ lettuce up to the highest dosage (6.0 µmol Mo L−1). Concurrently, the best results were observed in plants treated with PHs and supplied with the highest Mo dosage. This is partially consistent with the reported of Liu et al. [72] who, studying the effect of Mo-biofortification on nutrition, quality and volatile compounds of strawberry fruits, found that total sugars increased when Mo supply ranged from 0 to 135 g ha−1, but decreased at the highest dosages. Thus, considering that a dose of 6.0 µmol Mo L−1 is not harmful for several plant physiological activities in lettuce and since Xi et al. [73] found that carbon dioxide supplementation could enhance total sugars concentration with a higher net photosynthesis, we may assume that Mo and carbon dioxide could increase total sugars concentration via the modulation of photosynthesis.
In addition, the study demonstrated that Mo-biofortification increased total phenolics in lettuce. However, the highest concentration of total phenolics was recorded in PHs treated plants enriched with 6.0 µmol Mo L−1. There are reports that PHs plant or animal derived, increase total phenolic content in celery [10]. Our outcomes also agree with those of Colla et al. [2] who stated that both amino acids and peptides increase phenolic concentration in banana plants and they are also coherent with those reported by Sabatino et al. [41], who stated that Mo-biofortification increases polyphenolic content in tomato. A similar increase was also reported by Bergmann [74] and Gupta [75] in tomato and cauliflower. Thus, it seems that both PHs and Mo supply have a synergistic effect on total phenolics synthesis and accumulation.
PHs application and Mo supply improved carotenoids concentration. Similar results were observed in another study on the response of baby rocket to a legume-derived PHs [54]. We also highlighted that Mo-enrichment improved carotenoid concentration in lettuce.
PHs treatment increased total chlorophyll. There are reports that PHs determine an increase in total chlorophyll in baby rocket and lettuce [54,76]. This is perhaps due to the high amino acid increase measured in plants subjected to plant-derived PHs, which in turn supports the increase in total chlorophyll concentration and net photosynthesis rate [77]. Increasing Mo level corresponded a total chlorophyll upsurge. This is in line with the finding of Liu et al. [72], who report a chlorophyll increase with a Mo increase up to 135 g ha−1. This suggest that, in ‘Canasta’ lettuce, a Mo dose of 6.0 µmol L−1 did not negatively affect the physiological mechanisms involved in chlorophyll synthesis. These results are also coherent with those of Yu et al. [78] and Zhang et al. [79] who declared a positive relation between Mo dose and chlorophyll concentration in winter wheat and Chinese cabbage.
PHs application positively affected NUE indices. This is in line with the results by Di Mola et al. [80] who investigated the effect of plant-based biostimulant on NUE indices and crop performance of lamb’s lettuce and baby spinach. The current results also underlined that Mo-biofortification enhanced the physiological use efficiency of ‘Canasta’ lettuce. Based on our acquaintance, this is the first investigation on the influence of Mo-biofortification on nitrogen indices in a vegetable crop.

5. Conclusions

In the current research, the tested PHs significantly improved yield and yield-related features, nutritional and functional traits, as well as nitrogen indices. Simultaneously, Mo-biofortification considerably enhanced nutritional and bioactive parameters, like ascorbic acid and SSC. Combining plant-derived PHs with 3.0 or 6.0 µmol Mo L−1 meaningfully improved plant nutritional and functional features, such as SSC, total sugars, total phenolics, carotenoids, plant Mo and N concentrations, and nitrogen indices as compared with untreated plants. We may also hypothesize the highest dosage of PHs had a buffer effect on plant Mo toxicity.

Author Contributions

Conceptualization, L.S., G.I., F.D. and S.L.B.; methodology, L.S., B.B.C., Y.R. and S.L.B.; software, L.S. and B.B.C.; validation, L.S., Y.R., G.I., F.D. and S.L.B.; formal analysis, L.S. and B.B.C.; investigation, L.S., B.B.C., Y.R., C.D.P. and S.L.B.; resources, F.D.; data curation, L.S., B.B.C., Y.R., C.D.P. and S.L.B.; writing—original draft preparation, L.S., B.B.C., Y.R., G.I. and S.L.B.; writing—review and editing, L.S., Y.R. and G.I.; visualization, L.S., Y.R., G.I., F.D. and S.L.B.; supervision, L.S., Y.R., G.I., G.I. and S.L.B.; project administration, L.S. and S.L.B.; funding acquisition, F.D. All authors have read and agreed to the published version of the manuscript.

Funding

This research received no external funding.

Institutional Review Board Statement

Not applicable.

Informed Consent Statement

Not applicable.

Data Availability Statement

Not applicable.

Acknowledgments

The authors thank Mugavero fertilizer company for providing the protein hydrolysates used in this study and the farm VIVAIO Conca D’Oro F.lli Romano for hosting the trial.

Conflicts of Interest

The authors declare no conflict of interest.

References

  1. Duhamel, M.; Vandenkoornhuyse, P. Sustainable agriculture: Possible trajectories from mutualistic symbiosis and plant neodomestication. Trends Plant Sci. 2013, 18, 597–600. [Google Scholar] [CrossRef] [PubMed] [Green Version]
  2. Colla, G.; Hoagland, L.; Ruzzi, M.; Cardarelli, M.; Bonini, P.; Canaguier, R.; Rouphael, Y. Biostimulant action of protein hydrolysates: Unraveling their effects on plant physiology and microbiome. Front. Plant Sci. 2017, 8, 2202. [Google Scholar] [CrossRef] [PubMed] [Green Version]
  3. Du Jardin, P. Plant biostimulants: Definition; concept; main categories and regulation. Sci. Hortic. 2015, 196, 3–14. [Google Scholar] [CrossRef] [Green Version]
  4. Yakhin, O.I.; Lubyanov, A.A.; Yakhin, I.A.; Brown, P.H. Biostimulants in plant science: A global perspective. Front. Plant Sci. 2017, 7, 2049. [Google Scholar] [CrossRef] [PubMed] [Green Version]
  5. Rouphael, Y.; Colla, G.; Giordano, M.; El-Nakhel, C.; Kyriacou, M.C.; De Pascale, S. Foliar applications of a legume-derived protein hydrolysate elicit dose dependent increases of growth, leaf mineral composition, yield and fruit quality in two greenhouse tomato cultivars. Sci. Hortic. 2017, 226, 353–360. [Google Scholar] [CrossRef]
  6. Sabatino, L.; Fabio, D.; Torta, A.L.; Ferrara, G.; Iapichino, G. Effects of arbuscular mycorrhizal fungi on Gazania rigens pot plant cultivation in a mediterranean environment. Not. Bot. Horti Agrobot. Cluj Napoca 2019, 47, 221–226. [Google Scholar] [CrossRef] [Green Version]
  7. Sabatino, L.; D’anna, F.; Torta, L.; Ferrara, G.; Iapichino, G. Arbuscular mycorrhizal inoculation and shading enhance crop performance and quality of greenhouse Begonia semperflorens. Acta Sci. Pol. Hortorum Cultus 2019, 18, 17–33. [Google Scholar] [CrossRef]
  8. Sabatino, L.; Iapichino, G.; Consentino, B.B.; D’Anna, F.; Rouphael, Y. Rootstock and Arbuscular Mycorrhiza Combinatorial Effects on Eggplant Crop Performance and Fruit Quality under Greenhouse Conditions. Agronomy 2020, 10, 693. [Google Scholar] [CrossRef]
  9. Rouphael, Y.; Carillo, P.; Colla, G.; Fiorentino, N.; Sabatino, L.; El-Nakhel, C.; Cozzolino, E. Appraisal of Combined Applications of Trichoderma virens and a Biopolymer-Based Biostimulant on Lettuce Agronomical, Physiological, and Qualitative Properties under Variable N Regimes. Agronomy 2020, 10, 196. [Google Scholar] [CrossRef] [Green Version]
  10. Consentino, B.B.; Virga, G.; La Placa, G.G.; Sabatino, L.; Rouphael, Y.; Ntatsi, G.; Iapichino, G.; La Bella, S.; Mauro, R.P.; D’Anna, F.; et al. Celery (Apium graveolens L.) Performances as Subjected to Different Sources of Protein Hydrolysates. Plants 2020, 9, 1633. [Google Scholar] [CrossRef]
  11. Di Mola, I.; Conti, S.; Cozzolino, E.; Melchionna, G.; Ottaiano, L.; Testa, A.; Sabatino, L.; Rouphael, Y.; Mori, M. Plant-Based Protein Hydrolysate Improves Salinity Tolerance in Hemp: Agronomical and Physiological Aspects. Agronomy 2021, 11, 342. [Google Scholar] [CrossRef]
  12. Schaafsma, G. Safety of protein hydrolysates, fractions thereof and bioactive peptides in human nutrition. Eur. J. Clin. Nutr. 2009, 63, 1161–1168. [Google Scholar] [CrossRef] [Green Version]
  13. Nardi, S.; Pizzeghello, D.; Schiavon, M.; Ertani, A. Plant biostimulants: Physiological responses induced by protein hydrolyzed-based products and humic substances in plant metabolism. Sci. Agric. 2016, 73, 18–23. [Google Scholar] [CrossRef] [Green Version]
  14. Fernández, V.; Eichert, T. Uptake of hydrophilic solutes through plant leaves: Current state of knowledge and perspectives of foliar fertilization. Crit. Rev. Plant Sci. 2009, 28, 36–68. [Google Scholar] [CrossRef] [Green Version]
  15. Ertani, A.; Cavani, L.; Pizzeghello, D.; Brandellero, E.; Altissimo, A.; Ciavatta, C.; Nardi, S. Biostimulant activities of two protein hydrolysates on the growth and nitrogen metabolism in maize seedlings. J. Plant. Nutr. Soil Sci. 2009, 172, 237–244. [Google Scholar] [CrossRef]
  16. Matsumiya, Y.; Kubo, M. Soybean peptide: Novel plant growth promoting peptide from soybean. In Soybean and Nutrition; H El-Shemy, R., Ed.; Tech Europe Publisher: Giza, Egypt, 2011; pp. 215–230. [Google Scholar]
  17. Colla, G.; Rouphael, Y.; Canaguier, R.; Svecova, E.; Cardarelli, M. Biostimulant action of a plant-derived protein hydrolysate produced through enzymatic hydrolysis. Front. Plant Sci. 2014, 5, 448. [Google Scholar] [CrossRef] [Green Version]
  18. Lucini, L.; Rouphael, Y.; Cardarelli, M.; Canguier, R.; Kumar, P.; Colla, G. The effect of a plant-derived biostimulant on metabolic profiling and crop performance of lettuce grown under saline conditions. Sci. Hortic. 2015, 182, 124–133. [Google Scholar] [CrossRef]
  19. Halpern, M.; Bar-Tal, A.; Ofek, M.; Minz, D.; Muller, T.; Yermiyahu, U. The use of biostimulants for enhancing nutrient uptake. Adv. Agron. 2015, 130, 141–174. [Google Scholar]
  20. Colla, G.; Nardi, S.; Cardarelli, M.; Ertani, A.; Lucini, L.; Canaguier, R.; Rouphael, Y. Protein hydrolysates as biostimulants in horticulture. Sci. Hortic. 2015, 96, 28–38. [Google Scholar] [CrossRef]
  21. Bouis, H.E.; Welch, R.M. Biofortification-a sustainable agricultural strategy for reducing micronutrient malnutrition in the global south. Crop Sci. 2010, 50, S-20–S-32. [Google Scholar] [CrossRef] [Green Version]
  22. D’Anna, F.; Sabatino, L. Morphological and agronomical characterization of eggplant genetic resources from the Sicily area. J. Food Agric. Environ. 2013, 11, 401–404. [Google Scholar]
  23. Azeez, M.A.; Adubi, A.O.; Durodola, F.A. Landraces and crop genetic improvement. In Rediscovery of Landraces as a Resource for the Future; InTechOpen Europe Publisher: Rijeka, Croatia, 2018. [Google Scholar]
  24. Fraga, C.G. Relevance, essentiality and toxicity of trace elements in human health. Mol. Aspects Med. 2005, 26, 235–244. [Google Scholar] [CrossRef] [PubMed]
  25. Ierna, A.; Mauro, R.; Mauromicale, G. Improved yield and nutrient efficiency in two globe artichoke genotypes by balancing nitrogen and phosphorus supply. Agron. Sustain. Dev. 2012, 32, 773–780. [Google Scholar] [CrossRef]
  26. Tsongas, T.A.; Meglen, R.R.; Walravens, P.A.; Chappel, W.R. Molybdenum in the diet: An estimate of average daily intake in the United States. Am. J. Clin. Nutr. 1980, 33, 1103–1107. [Google Scholar] [CrossRef] [PubMed] [Green Version]
  27. Bender, D.; Kaczmarek, A.T.; Santamaria-Araujo, J.A.; Stueve, B.; Waltz, S.; Bartsch, D.; Kurian, L.; Cirak, S.; Schwarz, G. Impaired mitochondrial maturation of sulfite oxidase in a patient with severe sulfite oxidase deficiency. Hum. Mol. Genet. 2019, 28, 2885–2899. [Google Scholar] [CrossRef] [PubMed]
  28. Cohen, H.J.; Fridovich, I.; Rajagopalan, K.V. Hepatic sulfite oxidase. A functional role for molybdenum. J. Biol. Chem. 1971, 246, 374–382. [Google Scholar] [CrossRef]
  29. Johnson, J.L.; Rajagopalan, K.V.; Cohen, H.J. Molecular basis of the biological function of molybdenum. Effect of tungsten on xanthine oxidase and sulfite oxidase in the rat. J. Biol. Chem. 1974, 249, 859–866. [Google Scholar] [CrossRef]
  30. Gunnison, A.F. Sulphite toxicity: A critical review of in vitro and in vivo data. Food Cosmet. Toxicol. 1981, 19, 667–682. [Google Scholar] [CrossRef]
  31. Schwarz, G.; Belaidi, A.A. Interrelations between essential metal ions and human diseases. In Molybdenum in Human Health and Disease; Sigel, A., Sigel, H., Sigel, R., Eds.; Springer: Dordrecht, The Netherlands, 2013; Volume 13, pp. 415–450. [Google Scholar]
  32. Pennington, J.A.; Jones, J.W. Molybdenum, nickel, cobalt, vanadium, and strontium in total diets. J. Am. Diet. Assoc. 1987, 87, 1644–1650. [Google Scholar]
  33. Rose, M.; Baxter, M.; Brereton, N.; Baskaran, C. Dietary exposure to metals and other elements in the 2006 UK Total Diet Study and some trends over the last 30 years. Food Addit. Contam. 2010, 27, 1380–1404. [Google Scholar] [CrossRef] [PubMed] [Green Version]
  34. Luk, E.; Jensen, L.T.; Culotta, V.C. The many highways for intracellular trafficking of metals. J. Biol. Inorg. Chem. 2003, 8, 803–809. [Google Scholar] [CrossRef]
  35. Schwarz, G.; Mendel, R.R.; Ribbe, M.W. Molybdenum cofactors, enzymes and pathways. Nature 2009, 460, 839–847. [Google Scholar] [CrossRef] [PubMed]
  36. Marschner, P. Marschner’s Mineral Nutrition of Higher Plants, 3rd ed.; Elsevier/Academic Press: Amsterdam, The Netherlands, 2012. [Google Scholar]
  37. Vatansever, R.; Ozyigit, I.I.; Filiz, E. Essential and beneficial trace elements in plants, and their transport in roots: A review. Biotechnol. Appl. Biochem. 2017, 181, 464–482. [Google Scholar] [CrossRef]
  38. Mendel, R.R.; Schwarz, G. Molybdoenzymes and molybdenum cofactor in plants. Crit. Rev. Plant. Sci. 1999, 18, 33–69. [Google Scholar] [CrossRef]
  39. Bittner, F. Molybdenum metabolism in plants and crosstalk to iron. Front. Plant Sci. 2014, 5, 28. [Google Scholar] [CrossRef] [Green Version]
  40. Moncada, A.; Miceli, A.; Sabatino, L.; Iapichino, G.; D’Anna, F.; Vetrano, F. Effect of molybdenum enrichment on yield and quality of lettuce, escarole and curly endive grown in floating system. Agronomy 2018, 8, 171. [Google Scholar] [CrossRef] [Green Version]
  41. Sabatino, L.; D’Anna, F.; Iapichino, G.; Moncada, A.; D’Anna, E.; De Pasquale, C. Interactive effects of genotype and molybdenum supply on yield and overall fruit quality of tomato. Front. Plant Sci. 2019, 9, 1922. [Google Scholar] [CrossRef] [PubMed] [Green Version]
  42. Longbottom, M.L.; Dry, P.R.; Sedgley, M. Effects of sodiummolybdate foliar sprays on molybdenum concentration in the vegetative and reproductive structures and on yield components of Vitis vinifera cv. Merlot. J. Grape Wine Res. 2010, 16, 477–490. [Google Scholar] [CrossRef]
  43. Li, Z.; Zhao, X.; Sandhu, A.K.; Gu, L. Effects of exogenous abscisic acid on yield, antioxidant capacities, and phytochemical contents of greenhouse grown lettuces. J. Agricult. Food Chem. 2010, 58, 6503–6509. [Google Scholar] [CrossRef] [PubMed]
  44. Luz, G.L.; Medeiros, S.L.P.; Manfron, P.A.; Amaral, A.D.; Muller, L.; Torrez, M.G.; Mentges, L.A. The nitrate issue in hydroponic lettuce and the human health. Ciência Rural. 2008, 38, 2388–2394. [Google Scholar] [CrossRef] [Green Version]
  45. Romani, A.; Pinelli, P.; Galardi, C.; Sani, G.; Cimato, A.; Heimler, D. Polyphenols in greenhouse and open-air-grown lettuce. Food Chem. 2002, 79, 337–342. [Google Scholar] [CrossRef] [Green Version]
  46. Kim, M.J.; Moon, Y.; Tou, J.C.; Mou, B.; Waterland, N.L. Nutritional value, bioactive compounds and health benefits of lettuce (Lactuca sativa L.). J. Food Compos. Anal. 2016, 49, 19–34. [Google Scholar] [CrossRef]
  47. Prohens-Tomás, J.; Nuez, F. Lettuce. In Vegetables I: Asteraceae, Brassicaceae, Chenopodicaceae, and Cucurbitaceae; International Publishing: Cham, Switzerland, 2008; pp. 75–116. [Google Scholar]
  48. Tesi, R. Orticoltura Mediterranea Sostenibile; Pàtron Editore: Bologna, Italy, 2010. [Google Scholar]
  49. Meda, A.; Lamien, C.E.; Romito, M.; Millogo, J.; Nacoulma, O.G. Determination of the total phenolic, flavonoid and proline contents in Burkina Fasan honey, as well as their radical scavenging activity. Food Chem. 2005, 91, 571–577. [Google Scholar] [CrossRef]
  50. Serna, M.; Hernández, F.; Coll, F.; Coll, Y.; Amorós, A. Effects of brassinosteroid analogues on total phenols, antioxidant activity, sugars, organic acids and yield of field grown endive (Cichorium endivia L.). J. Sci. Food Agric. 2013, 93, 1765–1771. [Google Scholar] [CrossRef] [PubMed]
  51. Costache, M.A.; Campeanu, G.; Neata, G. Studies concerning the extraction of chlorophyll and total carotenoids from vegetables. Rom. Biotechnol. Lett. 2012, 17, 7702–7708. [Google Scholar]
  52. Morand, P.; Gullo, J.L. Mineralisation des tissus vegetaux en vue du dosage de P, Ca, Mg, Na, K. Ann. Agron. 1970, 21, 229–236. [Google Scholar]
  53. Fogg, D.N.; Wilkinson, A.N. The colorimetric determination of phosphorus. Analyst 1958, 83, 406–414. [Google Scholar] [CrossRef]
  54. Di Mola, I.; Ottaiano, L.; Cozzolino, E.; Senatore, M.; Giordano, M.; El-Nakhel, C.; Sacco, A.; Rouphael, Y.; Colla, G.; Mori, M. Plant-based biostimulants influence the agronomical, physiological, and qualitative responses of baby rocket leaves under diverse nitrogen conditions. Plants 2019, 8, 522. [Google Scholar] [CrossRef] [Green Version]
  55. Calvo, P.; Nelson, L.; Kloepper, J.W. Agricultural uses of plant biostimulants. Plant Soil 2014, 383, 3–41. [Google Scholar] [CrossRef] [Green Version]
  56. Biacs, P.A.; Daood, H.G.; Kadar, I. Effect of Mo, Se, Zn, and Cr treatments on the yield, element concentration, and carotenoid content of carrot. J. Agric. Food Chem. 1995, 43, 589–591. [Google Scholar] [CrossRef]
  57. Vieira, R.F.; Salgado, L.T.; Ferreira, A.C.B. Performance of common bean using seeds harvested from plants fertilized with high rates of molybdenum. J. Plant Nutr. 2005, 28, 363–377. [Google Scholar] [CrossRef]
  58. Liu, X.Q.; Lee, K.S. Effect of mixed amino acids on crop growth. In Agricultural Science; Aflakpui, G., Ed.; InTechOpen Europe Publisher: Rijeka, Croatia, 2012; pp. 119–158. [Google Scholar]
  59. Tsouvaltzis, P.; Koukounaras, A.; Siomos, S.A. Application of amino acids improves lettuce crop uniformity and inhibits nitrate accumulation induced by the supplemental inorganic nitrogen fertilization. Int. J. Agric. Biol. 2014, 16, 951–955. [Google Scholar]
  60. Zhen, Y.; Liu, S.; Liu, S. Effect of appling molybdenum fertilizer on nitrate content in lettuce and you-mai vegetable. Soil Fertil. Sci. China 2007, 1, 51–53. [Google Scholar]
  61. Cantliffe, D.J.; MacDonald, G.E.; Peck, N.H. Reduction of nitrate accumulation by molybdenum in spinach grown at low pH. Commun. Soil Sci. Plant Anal. 1974, 5, 273–282. [Google Scholar] [CrossRef]
  62. Cox, D.A. Poinsettia cultivars differ in their response to molybdenum deficiency. HortScience 1992, 27, 892–893. [Google Scholar] [CrossRef] [Green Version]
  63. Cox, D.A. Foliar-applied molybdenum for preventing or correcting molybdenum deficiency of poinsettia. Hortscience 1992, 8, 894–895. [Google Scholar] [CrossRef]
  64. Schwarz, G. Molybdenum cofactor and human disease. Curr. Opin. Chem. Biol. 2016, 179, 87. [Google Scholar] [CrossRef] [PubMed]
  65. Valenciano, J.B.; Boto, J.A.; Marcelo, V. Chickpea (Cicer arietinum L.) response to zinc, boron and molybdenum application under field conditions. N.Z.J. Crop Hortic. Sci. 2011, 39, 217–229. [Google Scholar] [CrossRef]
  66. Br Brodrick, S.J.; Giller, K.E. Genotypic difference in molybdenum accumulation affects N2-fixation in tropical Phaseolus vulgaris. J. Exp. Bot. 1991, 42, 1339–1343. [Google Scholar] [CrossRef]
  67. Caruso, G.; De Pascale, S.; Cozzolino, E.; Giordano, M.; El-Nakhel, C.; Cuciniello, A.; Cenvinzo, V.; Colla, G.; Rouphael, Y. Protein Hydrolysate or Plant Extract-based Biostimulants Enhanced Yield and Quality Performances of Greenhouse Perennial Wall Rocket Grown in Different Seasons. Plants 2019, 8, 208. [Google Scholar] [CrossRef] [Green Version]
  68. Giordano, M.; El-Nakhel, C.; Caruso, G.; Cozzolino, E.; De Pascale, S.; Kyriacou, M.C.; Rouphael, Y. Stand-Alone and Combinatorial Effects of Plant-based Biostimulants on the Production and Leaf Quality of Perennial Wall Rocket. Plants 2020, 9, 922. [Google Scholar] [CrossRef] [PubMed]
  69. Boertje, G.A. Molybdenum and lettuce. In Annual Report—Glasshouse Crops Research and Experiment Station; Glasshouse Crops Research and Experiment Station: Naaldwijk, The Netherlands, 1969. [Google Scholar]
  70. Randall, P.J. Changes in nitrate and nitrate reductase levels on restoration of molybdenum to molybdenum-deficient plants. Aust. J. Agric. Res. 1969, 20, 635–642. [Google Scholar] [CrossRef]
  71. Carillo, P.; Colla, G.; Fusco, G.M.; Dell’Aversana, E.; El-Nakhel, C.; Giordano, M.; Pannico, A.; Cozzolino, E.; Mori, M.; Reynaud, H.; et al. Morphological and Physiological Responses Induced by Protein Hydrolysate-Based Biostimulant and Nitrogen Rates in Greenhouse Spinach. Agronomy 2019, 9, 450. [Google Scholar] [CrossRef] [Green Version]
  72. Li, L.I.U.; Wei, X.I.A.O.; JI, M.L.; Chao, Y.A.N.G.; Ling, L.I.; GAO, D.S.; FU, X.L. Effects of molybdenum on nutrition, quality, and flavour compounds of strawberry (Fragaria× ananassa Duch. cv. Akihime) fruit. J. Integr. Agric. 2017, 16, 1502–1512. [Google Scholar] [CrossRef]
  73. Xi, W.; Zhang, Q.; Lu, X.; Wei, C.; Yu, S.; Zhou, Z. Improvement of flavour quality and consumer acceptance during postharvest ripening in greenhouse peaches by carbon dioxide enrichment. Food Chem. 2014, 164, 219–227. [Google Scholar] [CrossRef]
  74. Bergmann, W. Nutritional disorders of plants. In Visual and Analytical Diagnosis; Gustav Fischer Verlag: Jena, Germany, 1992. [Google Scholar]
  75. Gupta, U.C. Symptoms of molybdenum deficiency and toxicity in crops. In Molybdenum in Agriculture; U.C. Gupta Cambridge, Cambridge University Press: Cambridge, MA, USA, 1997. [Google Scholar]
  76. Di Mola, I.; Cozzolino, E.; Ottaiano, L.; Giordano, M.; Rouphael, Y.; Colla, G.; Mori, M. Effect of Vegetal- and Seaweed Extract-Based Biostimulants on Agronomical and Leaf Quality Traits of Plastic Tunnel-Grown Baby Lettuce under Four Regimes of Nitrogen Fertilization. Agronomy 2019, 9, 571. [Google Scholar] [CrossRef] [Green Version]
  77. Luziatelli, F.; Ficca, A.G.; Colla, G.; Svecova, E.; Ruzzi, M. Effects of a protein hydrolysate-based biostimulant and two micronutrient based fertilizers on plant growth and epiphytic bacterial populations of lettuce. Acta Hortic. 2016, 1148, 43–48. [Google Scholar] [CrossRef]
  78. Yu, M.; Hu, X.C.; Wang, Y.H. Effect of molybdenum on the precursors of chlorophyll biosynthesis in winter wheat cultivars under low temperature. Sci. Agric. Sin. 2006, 39, 702–708. [Google Scholar]
  79. Zhang, M.; Hu, C.; Sun, X.; Zhao, X.; Tan, Q.; Li, Y.Z.N. Molybdenum affects photosynthesis and ionic homeostasis of Chinese cabbage under salinity stress. Commun. Soil Sci. Plant Anal. 2014, 45, 2660–2672. [Google Scholar] [CrossRef]
  80. Di Mola, I.; Cozzolino, E.; Ottaiano, L.; Nocerino, S.; Rouphael, Y.; Colla, G.; El-Nakhel, C.; Mori, M. Nitrogen Use and Uptake Efficiency and Crop Performance of Baby Spinach (Spinacia oleracea L.) and Lamb’s Lettuce (Valerianella locusta L.) Grown under Variable Sub-Optimal N Regimes Combined with Plant-Based Biostimulant Application. Agronomy 2020, 10, 278. [Google Scholar] [CrossRef] [Green Version]
Figure 1. Daily minimum and maximum temperature from 3 January to 26 February at the experimental site.
Agronomy 11 01023 g001
Figure 2. Effects of PHs and Mo treatments on nitrogen concentration in ‘Canasta’ lettuce leaves grown in a protected environment. Values with different letters significantly differ at p ≤ 0.05. *, *** significant at 0.05 and 0.001, respectively.
Agronomy 11 01023 g002
Figure 3. Effects of PHs and Mo treatments on molybdenum concentration in ‘Canasta’ lettuce leaves grown in a protected environment. Values with different letters significantly differ at p ≤ 0.05. *** significant at 0.001.
Agronomy 11 01023 g003
Figure 4. Effects of PHs and Mo treatments on carotenoids (A) and total chlorophyll (B) concentration in ‘Canasta’ lettuce plants. Values with distinct letters significantly differ at p ≤ 0.05. NS, **, *** non-significant or significant at 0.005 or 0.001, respectively.
Agronomy 11 01023 g004
Figure 5. Effects of PHs and Mo treatments on nitrogen use efficiency (A), nitrogen utilization efficiency (B) and nitrogen physiological use efficiency (C) of ‘Canasta’ lettuce plants. Values with distinct letters significantly differ at p ≤ 0.05. NS, *** non-significant or significant at or 0.001, respectively.
Agronomy 11 01023 g005
Figure 6. Heat map analysis including all ‘Canasta’ lettuce plant traits in response of PHs and Mo treatments. The heat map figure was created using the https://biit.cs.ut.ee/clustvis/ (accessed on 15 January 2021) package.
Agronomy 11 01023 g006
Table 1. Effect of PHs treatment and Mo-biofortification on head fresh weight (HFW), head height (HH), stem diameter (SD), and number of leaves (NL) of ‘Canasta’ lettuce cultivated in a protected environment.
TreatmentsHFW (g)HH (cm)SD (mm)NL (no.)
Biostimulant
Non-treated500.1b23.2b27.1a26.4a
PHs630.7a26.0a26.8a26.5a
Biofortification (µmol Mo L−1)
0572.9a24.4a29.8a25.9a
0.5530.1a24.8a27.8b26.7a
3597.0a24.4a26.5c27.8a
6561.6a24.7a23.5d25.5a
Significance
PHs******NSNS
MoNSNS***NS
PHs × MoNSNSNSNS
Values in a column followed by different letters are significantly different at p ≤ 0.05. NS, *** non-significant or significant at 0.001, respectively.
Table 2. Effect of PHs treatment and Mo-biofortification on phosphorous (P), potassium (K), calcium (Ca) and magnesium (Mg) concentrations of ‘Canasta’ lettuce leaves grown in a protected environment.
TreatmentsP (mg g−1 dw)K (mg g−1 dw)Ca (mg g−1 dw)Mg (mg g−1 dw)
Biostimulant
Non-treated4.20a32.48b1.77a10.32b
PHs4.24a40.13a1.75a11.50a
Biofortification (µmol Mo L−1)
0.04.23a36.09a1.72a11.12a
0.54.25a36.10a1.78a10.75a
3.04.20a36.87a1.76a11.26a
6.04.20a36.14a1.78a10.49a
Significance
PHNS***NS***
MoNSNSNSNS
PHs × MoNSNSNSNS
Values in a column followed by different letters are significantly different at p ≤ 0.05. NS, *** non-significant or significant at 0.001, respectively.
Table 3. Effect of PHs treatment and Mo-biofortification on ascorbic acid and CIELab parameters of ‘Canasta’ lettuce grown in a protected environment.
TreatmentsAscorbic Acid (mg g−1 fw)a*b*L*
Biostimulant
Non-treated32.80b−15.67a29.80a59.76a
PHs34.97a−18.19b28.86a57.16a
Biofortification (µmol Mo L−1)
027.62d−17.18a31.18a59.31a
0.532.03c−16.84a29.79a57.83a
336.75b−16.46a29.08a58.47a
639.13a−17.29a27.34a58.22a
Significance
PHs******NSNS
Mo***NSNSNS
PHs × MoNSNSNSNS
Values within a column followed by different letters are significantly different at p ≤ 0.05. NS, *** non-significant or significant at 0.001, respectively. a*: red-green axis; b*: yellow-blue axis; L*: lightness.
Table 4. Effect of PHs treatment and Mo-biofortification on head dry matter (HDM), soluble solid content (SSC), total sugars and total phenolics of ‘Canasta’ lettuce grown in a protected environment.
TreatmentsHDM (%)SSC (Brix°)Total Sugars (% fw)Total Phenolics (µg g−1 fw)
Biostimulant × Biofortification (µmol Mo L−1)
Non-treated × 0.014.53c2.13d1.45f37.03g
Non-treated × 0.513.87d2.20d1.62e44.13f
Non-treated × 3.014.53c2.30c1.92d55.07d
Non-treated × 6.015.11b2.33c2.17c75.23b
PHs × 0.015.68a2.15d1.48f36.57g
PHs × 0.515.11b2.40b1.92d47.07e
PHs × 3.014.59c2.42b2.24b59.53c
PHs × 6.013.24e2.53a2.54a80.60a
Significance
PHsNS*********
Mo************
PHs × Mo********
Values within a column followed by different letters are significantly different at p ≤ 0.05. NS, *, *** non-significant or significant at 0.05 and 0.001, respectively.
Publisher’s Note: MDPI stays neutral with regard to jurisdictional claims in published maps and institutional affiliations.

