
Comparative Analyses Reveal Peroxidases Play Important Roles in Soybean Tolerance to Aluminum Toxicity


1
National Key Laboratory of Crop Genetics and Germplasm Enhancement, National Center for Soybean Improvement, Key Laboratory for Biology and Genetic Improvement of Soybean (General, Ministry of Agriculture), Jiangsu Collaborative Innovation Center for Modern Crop Production, Nanjing Agricultural University, Nanjing 210095, China
2
College of Food Science and Engineering, Yangzhou University, Yangzhou 225009, China
*
Author to whom correspondence should be addressed.
Agronomy 2021, 11(4), 670; https://doi.org/10.3390/agronomy11040670
Submission received: 1 March 2021
/
Revised: 25 March 2021
/
Accepted: 27 March 2021
/
Published: 1 April 2021
(This article belongs to the Special Issue Recent Progress in Molecular Investigations of Crop Plants and Crop Plant–Environment Interactions from Genetic and Genomic Perspectives: Applications and Challenges)
Abstract
:Aluminum (Al) toxicity is an important barrier to soybean (Glycine max (L.) Merr.) production in acid soils. However, little is known about the genes underlying Al tolerance in soybean. We aim to find the key candidate genes and investigate their roles in soybean tolerance to Al toxicity in this study. Comparative transcriptome analyses of the Al-tolerant (KF) and Al-sensitive (GF) soybean varieties under control and Al stress at 6, 12, and 24 h were investigated. A total of 1411 genes showed specific up-regulation in KF or more up-regulation in KF than in GF by Al stress, which were significantly enriched in the GO terms of peroxidase (POD) activity, transporter activity (including the known Al tolerance-related ABC transporter, ALMT, and MATE), and four families of transcription factors (AP2, C3H4, MYB, WRKY). The expression levels of seven POD genes were up-regulated by Al stress for at least one time point in KF. The H2O2 pretreatment significantly improved Al tolerance of KF, which is likely due to increased POD activity induced by H2O2. Our results suggest that PODs play important roles in soybean tolerance to Al toxicity. We also propose a list of candidate genes for Al tolerance in KF, which would provide valuable insights into the Al tolerance mechanisms in soybean.
1. Introduction
Soybean (Glycine max (L.) Merr.) is an important legume crop, supplying high-quality oil and protein for human food, animal feed, and industrial use [1,2]. Nevertheless, Aluminum (Al) toxicity, mainly due to the phytotoxic species of Al (Al3+) in acid soils (pH < 5.0), is becoming an important factor limiting crop production, including soybean, worldwide [3,4]. After exposure to Al, the inhibition of root growth would soon occur as the first visible symptom of Al toxicity [5]. Soluble Al3+ inhibits plant root elongation rapidly by damaging the root apices [3,6,7], which will subsequently prevent the uptake and translocation of water and nutrients from roots [8]. Al disrupts calcium homeostasis [9] and induces the production of reactive oxygen species (ROS) [10], alterations in the cytoskeleton [11,12], and the formation of callose deposition in the apoplast [13], which all contribute to the Al toxicity.
Al-induced oxidative stress has been reported as a prominent symptom of Al toxicity [14,15]. Excessive ROS can give rise to oxidative damage to lipid membranes, proteins and deoxynucleic acids, which eventually leads to injured or died cells [16,17]. Antioxidant enzymes might play important roles in plant tolerance to Al stress by scavenging ROS. A study shows peroxidase (POD) expression was markedly up-regulated under Al stress, and POD activities significantly increased under Al exposure in wheat roots [18]. It has been reported that overexpression of a tobacco (Nicotiana tabacum L.) peroxidase gene (NtPox) or an Arabidopsis (Arabidopsis thaliana) POD gene AtPrx64 in Arabidopsis enhanced Al tolerance of transgenic plants [19,20]. In addition, hydrogen peroxide (H2O2) is a key ROS that is an important signal for the activation of plant defense pathways against biotic and abiotic stresses. A previous study showed that H2O2 pretreatment increased the POD activities and total antioxidant capacity, which alleviated Al-induced oxidative stress in wheat seedlings [21].
Previous studies showed that plants have developed two main mechanisms to adapt to Al stress, including Al exclusion and internal tolerance [4,22,23,24]. Al exclusion is a well-documented and most widespread mechanism, by which Al induces the secretion of organic acid anions, such as oxalate, citrate, and/or malate from the roots to chelate Al3+ in rhizosphere [23]. The second mechanism is internal detoxification such as the transportation of Al into the vacuoles and chelation in Al-accumulating plants [6,25].
Genes controlling root organic anion efflux in response to Al have been isolated from several crop species [26,27], including genes controlling malate efflux which belong to the ALMT (aluminum-activated malate transporter) family and genes encoding citrate efflux transporter that belong to the MATE (multidrug and toxic compound extrusion) family. As the first Al tolerance gene identified in plants, TaALMT1 encodes a plasma membrane transporter, which transports malate from root cells to the rhizosphere in wheat (Triticum aestivum) [28,29,30]. Several homologs of TaALMT1 were subsequently reported and displayed similar functions in Arabidopsis [31], rape (Brassica napus) [32], rye (Secale cereale) [33,34], and soybean [35]. The SbMATE gene from sorghum (Sorghum bicolor) and the HvAACT1 gene from barley (Hordeum vulgare) are the first two reported MATE genes involved in Al3+ tolerance [36,37]. The MATE homologous genes have also been characterized in other species, such as Arabidopsis [38], maize (Zea mays) [39], rice (Oryza sativa) [40], rice bean (Vigna umbellata) [41], Eucalyptus (Eucalyptus camaldulensis) [42], wheat [43,44], cabbage (Brassica oleracea) [45], and wild soybean [46].
Intraspecific variation in Al tolerance has been observed in many crop species including soybean, which is controlled by quantitative trait loci [37,47,48,49,50,51]. Although many Al tolerance genes have been studied in plants [52], only few Al tolerance-related genes were described in soybean such as GmALMT1 [35], GmARI1 [53], and GsMATE [46]. Al-responsive genes have been identified in the Al-tolerant soybean varieties of PI416937 and Jiyu70 by transcriptome analysis [54,55]. However, a detailed comparative transcriptome analysis of soybean varieties with contrasting Al tolerance phenotypes was limited, which would be useful to identify candidate genes for Al tolerance in soybean.
In this study, the genome-wide gene expression profiling of roots from Al-tolerant (KF) and Al-sensitive (GF) soybean varieties under 0 and 25 μM AlCl3 (pH 4.3) at 6, 12, and 24 h was investigated using Affymetrix microarray, and the gene expression patterns were verified by qRT-PCR. The metabolic pathways and candidate genes that might be involved in Al tolerance were identified by comparative transcriptome analysis. Gene Ontology (GO) and transcription factor (TF) enrichment analyses were performed to identify the important genes for Al tolerance in soybean, and the GO terms of POD activity and transporter activity were found to be significantly enriched in the up-regulated Al tolerance candidate genes by AgriGO analysis. The role of POD in Al tolerance was further investigated by comparing the changes in transcript level and enzyme activity in response to Al stress in KF and GF. This research proposed a list of candidate genes and possible mechanisms for Al tolerance in the KF soybean variety, which would provide valuable insights into the mechanisms of Al tolerance in soybean.
2. Materials and Methods
2.1. Plant Material, Growth Conditions, Treatments, and Tissue Harvest
The seeds of the Al-tolerant soybean cultivar KF (Kefeng 1) and Al-sensitive cultivar GF (Guangfeng Maliaodou) used in the study were obtained from the National Center for Soybean Improvement, Nanjing, China. The seeds were surface sterilized with 1% NaClO for 1 min, washed with sterile water for 5 min, then germinated in moist sterile sand and grown under a photoperiod of 14-h/10-h (day/night) and 26/24 °C (day/night) temperature circulations for three days. Then, the 3-day-old seedlings were transferred to 0.5 mM CaCl2 (pH = 4.3) for 24 h before Al treatment. The seedlings were then exposed to 0.5 mM CaCl2 (pH = 4.3) solution containing 0 µM AlCl3 (control), or 25 µM AlCl3 (Al treatment) for 6, 12, and 24 h, respectively, as described previously [56].
For H2O2 pretreatment, the 3-day-old seedlings were transferred to 0.5 mM CaCl2 (pH = 4.3) for 24 h, then pretreated by 100 μM H2O2 for 6 h. After that, they were transferred to 0.5 mM CaCl2 (pH = 4.3) solution containing 0 µM AlCl3 (H2O2 treatment), or 25 µM AlCl3 (H2O2 + Al treatment) for 6, 12, and 24 h, respectively. The lengths of the primary roots were measured with a ruler before and after the treatment. Relative root growth (RRG) is calculated following the previous study [57]. The formula is as follows:
where RGt and RGc represent the root growth (RG) under treatment and control, respectively, while RLt and RL0 represent the root length (RL) at t h (t = 6, 12, and 24 h) and 0 h, respectively.
The root tips (0–1 cm) of six seedlings were cut and pooled together in one sample and immediately frozen in liquid nitrogen and stored at −80 °C for RNA isolation. To compare the changes in POD activity after Al stress with control, uniformly grown seedlings were carefully selected and transferred into 1/2 Hoagland nutrient solution to grow for 14 days. Then 17-day-old seedlings were exposed to 0.5 mM CaCl2 (pH = 4.3) solutions containing 0 μM (control) or 25 μM AlCl3. Root samples were then harvested at 6, 12, and 24 h and immediately frozen in liquid nitrogen and stored at −80 °C.
2.2. POD Activity Measurement
POD activity was measured by the previously published method [58]. Soluble proteins in soybean root samples were extracted by homogenizing the ground frozen root powder in 7 mL of 50 mM potassium phosphate buffer (pH 7.0) containing 1 mM EDTANa2 and 1% polyvinylpyrrolidone (PVP), with the addition of 1 mM ascorbate acid (ASA) in the reaction assay. The homogenate was centrifuged at 10,000× g for 15 min at 4 °C and the supernatant was used for the following enzyme assays. The UV/visible light spectrophotometer (Qingke 722N, Shanghai, China) was used for all spectrophotometric analyses at room temperature. POD activity was determined by measuring the increase in the oxidation of guaiacol by H2O2. The reaction was performed in a final volume of 3 mL including 50 µL of the crude protein extract, 10 mM potassium phosphate (pH 6.4), 8 mM guaiacol, and 2.75 mM H2O2. The change in absorbance (A) was recorded at 470 nm after the addition of H2O2. One unit of POD activity was defined as the change in A470 nm per min (μmol min−1 mg−1 protein). Protein concentration was determined using the Bradford assay method.
2.3. Determination of Al Concentration in Soybean Roots
Roots from over 50 seedlings were pooled and collected in one sample for Al concentration measurement. The soybean roots were washed using distilled water to remove the residual Al3+ on the surface, then dried at 85 °C for 72 h and weighed. The dried samples were digested with 5 mL nitric acid (HNO3) in a microwave digestion system (ETHOS T, Milestone, Italy) following the manufacturers’ recommendations. The Al3+ concentrations were estimated by an Inductively Coupled Plasma Optical Emission Spectrometer (ICP-OES) Optima 8000 (PerkinElmer, Shelton, CT, USA).
2.4. Hematoxylin Staining of Soybean Roots
After washing by distilled water, the roots were stained with hematoxylin solution as described previously [59]. Briefly, the root tips were stained with 0.1% hematoxylin for 10 min, washed in distilled water for 30 min (10 min × 3 times), and then photographed.
2.5. Statistical Analysis
Differences between two groups or more than two groups were analyzed by Student’s t-test or Duncan’s new multiple range test, respectively. Figures were prepared using the Origin 9.0 software.
2.6. Total RNA Isolation, Labeling, and Array Hybridization
Total RNA was isolated from root tips (1 cm) using TRIzol (Invitrogen, Carlsbad, CA, USA) according to the manufacturer’s instructions, and digested with DNase I (TAKARA, Shiga, Japan) to remove contaminated DNA. Then mRNAs were purified from the total RNA using Dynabeads Oligo (dT)25 (Life Technologies, Carlsbad, CA, USA). RNA concentration and purity were determined by NanoDrop 1000 (Thermo, Waltham, MA, USA) and verified by electrophoresis in 1% agarose gels.
The detailed procedure of microarray hybridization can be found in the Affymetrix GeneChip Expression Analysis Technical Manual. Soybean Gene 1.1 ST Array Strip detects 66,473 transcripts from Glycine max database and GenBank, and each transcript can be detected with 16–19 probe sets (25 bp per oligonucleotide). Briefly, mRNA (200 ng) was used to synthesize double-stranded cDNA using random primers. Then, in vitro transcriptional cDNA was generated using random primers dUTP and purified by the paramagnetic particle method. Subsequently, cDNA was hydrolyzed and purified into the first = stranded cDNA, and the first-stranded cDNA was fragmented and terminal labeled by biotin. Lastly, arrays were crossed by Hybridization Station 0381 (Affymetrix, Santa Clara, CA, USA), washed, stained in the Fluidics Station 0377 (Affymetrix, Santa Clara, CA, USA), and scanned by GeneChip® Scanner 3000 (Affymetrix). Microarray hybridization was conducted by the CapitalBio Corporation (http://www.capitalbio.com, accessed on 26 May 2016) according to the Affymetrix standard protocols.
2.7. Microarray Data Analysis
Scanned images were transformed to digital signal by Affymetrix® GeneChip® Command Console® Software, and the fluorescence signal intensity of each probe was recorded in CEL file format. Then CEL files were pre-processed by background subtraction, variance stabilization, and normalization with the RMA method [60]. Pairwise comparisons were performed between Al-treated sample and the corresponding control sample at each time-point for KF and GF, respectively, and differentially expressed genes were selected by fold change ≥2 (up-regulation) or ≤0.5 (down-regulation). The data for 12 microarrays are available in the National Center for Biotechnology Information (NCBI) Gene Expression Omnibus (accession number GSE116796). The annotation and functional categories for these transcripts were assigned based on Molecular Annotation System (MAS3.0) (http://bioinfo.capitalbio.com/mas3/, accessed on 6 August 2016) and Soybase (https://soybase.org/, accessed on 3 September 2016). The visualization of metabolism was displayed by MapMan v3.5.1 [61]. Heatmap with clustering analysis was constructed using MeV 4.9 software with the K-means method and Euclidean Distance [62]. Gene Ontology (GO) enrichment analysis was performed using AgriGO [63]. Fisher’s exact test (p < 0.01) and the Benjamini and Hochberg method (FDR < 0.05) were used to determine the significance of enrichment for GO terms and the transcription factor families in the list as compared with the soybean reference genome.
2.8. Quantitative Real-Time PCR (qRT-PCR)
The first-strand cDNAs were synthesized using a PrimerScript First Strand cDNA synthesis kit (TaKaRa, Shiga, Japan) following the manufacturers’ protocol, which was carried out in a total of 20 µL reaction volume including 1 μg of total RNA, 4 µL 5 × PrimeScript RT Master Mix, and RNAase-free ddH2O. Gene-specific primers (Table S1) were designed using primer premier 5.0 (Premier Biosoft International, Palo Alto, CA, USA) and synthesized by Invitrogen (Shanghai, China). The qRT-PCR was performed in a final volume of 15 µL containing 2 µL cDNA, 7.5 µL 2 × SYBR Premix Ex Taq (TaKaRa, Shiga, Japan), and 200 nM of forward and reverse primers, using a Roche 480 Realtime detection system (Roche Diagnostics, Basel, Switzerland) following the manufacturer’s instructions. The amplification program was set as follows: initial denaturation at 95 °C for 5 min; 40 cycles of denaturation at 95 °C for 10 s, annealing at 58 °C for 20 s, and extension at 72 °C for 20 s. Each experiment was performed in triplicates. The relative expression values were calculated by the 2−ΔΔCT method [64]. The housekeeping gene GmEF-1α was used as an internal control. The relative expression level of each gene in response to Al stress (25 µM AlCl3) was compared to their corresponding samples under control conditions (0 µM AlCl3) at each time point. Each data point is the average ± SD of three independent replications.
3. Results
3.1. Phenotypic Difference in Al Tolerance Between Soybean Varieties of KF and GF
The root lengths of two soybean varieties, KF and GF, were measured at 0, 6, 12, and 24 h after 0 (control) or 25 μM AlCl3 treatment, and the corresponding RRG was calculated. The RRG of both varieties decreased with the duration of Al treatment, and the reduction was more obvious in GF (Figure 1A). The RRG of KF was significantly higher than that of GF across 6, 12, and 24 h. The concentration of Al in soybean roots was detected by ICP after 6, 12, and 24 h of Al treatment. The roots of GF accumulated significantly more Al than those of KF at 6 and 24 h (Figure 1B). The results confirmed that KF is more tolerant to Al toxicity than GF, and therefore we used T (tolerant) and S (sensitive) to represent KF and GF, respectively.
3.2. Genome-Wide Gene Expression Profiles in Soybean Roots in Response to Al Stress
Overall, 65,535 out of the 66,473 transcripts in the Affymetrix Soybean Gene 1.1 ST Array were detected in this study. The dynamic changes in gene expression profiles at 6, 12, and 24 h in the roots of T and S under control and Al treatment could be observed by the heatmap with clustering analysis (Figure S1). The graph showed that 12 samples were classified into two clusters, including one cluster with six control samples and the other cluster with Al-treated samples. The transcripts were also classified into two groups, with one group showing lower expression levels in Al-treated samples than the control samples, while the other group showed the reverse pattern. The transcriptional changes of genome-wide genes between Al stress and control at 6, 12, 24 h in two soybean varieties could be visualized using MapMan software (Figures S2–S4). There were more transcriptional changes at 24 h than 6 and 12 h after Al stress. At 24 h, more down-regulated genes were noticed in S than T, especially in the metabolic pathways involved in glycolysis and tricarboxylic acid cycle (TCA) (Figure S4). In the glycolysis pathway, there were three key glycolytic enzymes, including hexokinase, phosphofructokinase, and pyruvate kinase. The genes encoding phosphofructokinase and pyruvate kinase were found more down-regulated in S than T by Al stress (Table S2). Most genes in TCA were down-regulated in S, while only few of them decreased in T (Figure S4). Several key genes in TCA such as genes encoding phosphoenolpyruvate carboxylase (PEPC), isocitrate dehydrogenase, succinate dehydrogenase, and fumarate lyase were more down-regulated in S than T (Table S2).
3.3. Identification of Al-Responsive Genes in Soybean Roots
Al-responsive genes were identified by comparing Al treatment and control at 6, 12, and 24 h in T and S, respectively (Table S3). The numbers of up- or down-regulated genes in response to Al stress increased with the duration of treatment time. At 6 h, the number of up-regulated genes by Al stress was 759 and 850 in T and S, respectively. At 12 h, the number of up-regulated genes was 1233 and 1356 in T and S, respectively. At 24 h, the number of up-regulated genes was 2240 and 2908 in T and S, respectively. The number of down-regulated genes also showed a trend of increase with the duration of Al treatment. After 6 h of treatment, the number of down-regulated genes in response to Al was 451 and 544 in T and S, respectively. After 12 h treatment, the number of down-regulated genes was 613 and 1560 in T and S, respectively. After 24 h treatment, the number of down-regulated genes was 1501 and 3725 in T and S, respectively. Much more genes were suppressed in S than T at 24 h after Al stress, and a greater number of differentially expressed genes were found in S than T across all three time points.
3.4. Identification of Candidate Genes for Soybean Tolerance to Al Stress
Many known Al tolerance genes were up- or down-regulated in response to Al stress, and their fold changes in Al-tolerant plants were more than those of Al-sensitive plants. Our results showed that 1417 probes were up-regulated by Al stress only in T but not in S, and 520 probes showed more up-regulation by Al in T than S when comparing the same time point. These 1937 (1417 + 520) probes represent 1460 genes (due to multiple probes for some genes), and 1411 of them have the correspondence in newest version of soybean reference genome (Wm82a2.v1) with gene annotations (Table S4). On the other hand, 925 probes were down-regulated only in T but not S, and 57 probes showed more down-regulation by Al in T than S when comparing the same time point. These 982 (925 + 57) probes represent 671 genes (due to multiple probes for some genes), and 633 of them have the correspondence in newest version of soybean reference genome (Wm82a2.v1) with gene annotations (Table S5). These 1411 and 633 genes that showed different response to Al stress between T and S could be the potential candidate genes for soybean tolerance to Al toxicity.
3.5. Gene Ontology (GO) Analysis of Al Tolerance Candidate Genes in Soybean
Gene Ontology (GO) classification was performed using Soybase and WEGO (Figure S5). The 1411 Al-induced genes and 633 Al-repressed genes were classified into 47 functional categories including 10 cell components, 14 molecular functions, and 23 biological processes, respectively (Figure S5A,B).
Next, we performed AgriGO functional enrichment analysis of these Al tolerance candidate genes. The GO term of peroxidase (POD) activity (GO:0004601, FDR = 7.35 × 10⁻⁹, 34 genes) in molecular function was identified as the most significantly enriched group in the Al-induced genes (Figure 2, Table S6). No GO term in molecular function was found significantly enriched among the Al-repressed genes.
There are 142 genes encoding transcription factors in the 1411 Al-induced genes (Table S7). According to the putative annotation in the Plant Transcription Factor Database 4.0 [65], these 142 transcription factors representing 20 different families, and four families (AP2, C3H4, MYB, WRKY), were significantly enriched in the 1411 Al tolerance candidate genes compared with the transcription factors in the soybean genome background (Figure S6).
3.6. Validation of Microarray Data by Real-Time Quantitative PCR
Ten genes were selected from the 1411 Al-induced genes (Table S4) to validate the expression patterns of the microarray data and the significantly enriched GO terms of peroxidase (POD) activity and transporter activity, including nine POD genes (Table S6) and one gene encoding ABC transporter. The relative expression levels (log2 fold change) of ten genes in the roots of T and S from the microarray and qRT-PCR were compared, which generally showed a similar expression pattern by the two methods (Figure S7A,B). There was a significant correlation (r = 0.86, p < 0.01) between the microarray and qRT-PCR results (Figure S7C), and the coefficient of determination (R2) is 0.74, which is comparable to the other studies where the R2 is ~0.72 [66,67].
3.7. Role of Peroxidase in Soybean Tolerance to Al Stress
Since the GO term of POD activity was identified as the most significantly enriched group in the Al-induced candidate genes for Al tolerance in soybean, we performed qRT-PCR to confirm the expression patterns of seven POD genes (randomly chosen from Table S6) in response to Al stress (Figure 3). The relative expression of these seven POD genes were up-regulated by Al stress in T and showed a significant difference in response to Al between T and S for at least one time point (Figure 3). Next, we determined the POD activity in the roots of two soybean varieties (Figure 4). The POD activity in the roots of T increased during Al treatment time, and there was a significant difference between Al and the control condition at 6 and 24 h. In the roots of S, the POD activity only showed a significant increase at 24 h after Al stress compared with the control. The POD activity in the roots of T was generally higher than that of S under Al stress (Figure 4).
Next, we investigated if H2O2 pretreatment alleviated Al toxicity in soybean (Figure 5). The results showed that H2O2 pretreatment improved Al tolerance (RRG) and reduced Al concentration in soybean primary roots of both T and S (S only showed significantly improved RRG at 6 h) compared with Al treatment alone, while H2O2 treatment (without Al) did not have significant effect on RRG or Al concentration in roots (Figure 5A,B). Moreover, hematoxylin staining of the root tips also showed that Al accumulation (reflected by a blue color) in soybean root tips was decreased by H2O2 pretreatment and was more obvious in T than S (Figure 5C). In addition, the POD activity was significantly increased by 6 h of H2O2 pretreatment in the roots of T (Figure S8). The results suggest that H2O2 pretreatment increased the POD activity in soybean roots, which might alleviate Al-induced oxidative stress, leading to improved Al tolerance (RRG) of soybean roots.
3.8. Al Tolerance Related Transporter Genes in Soybean Roots
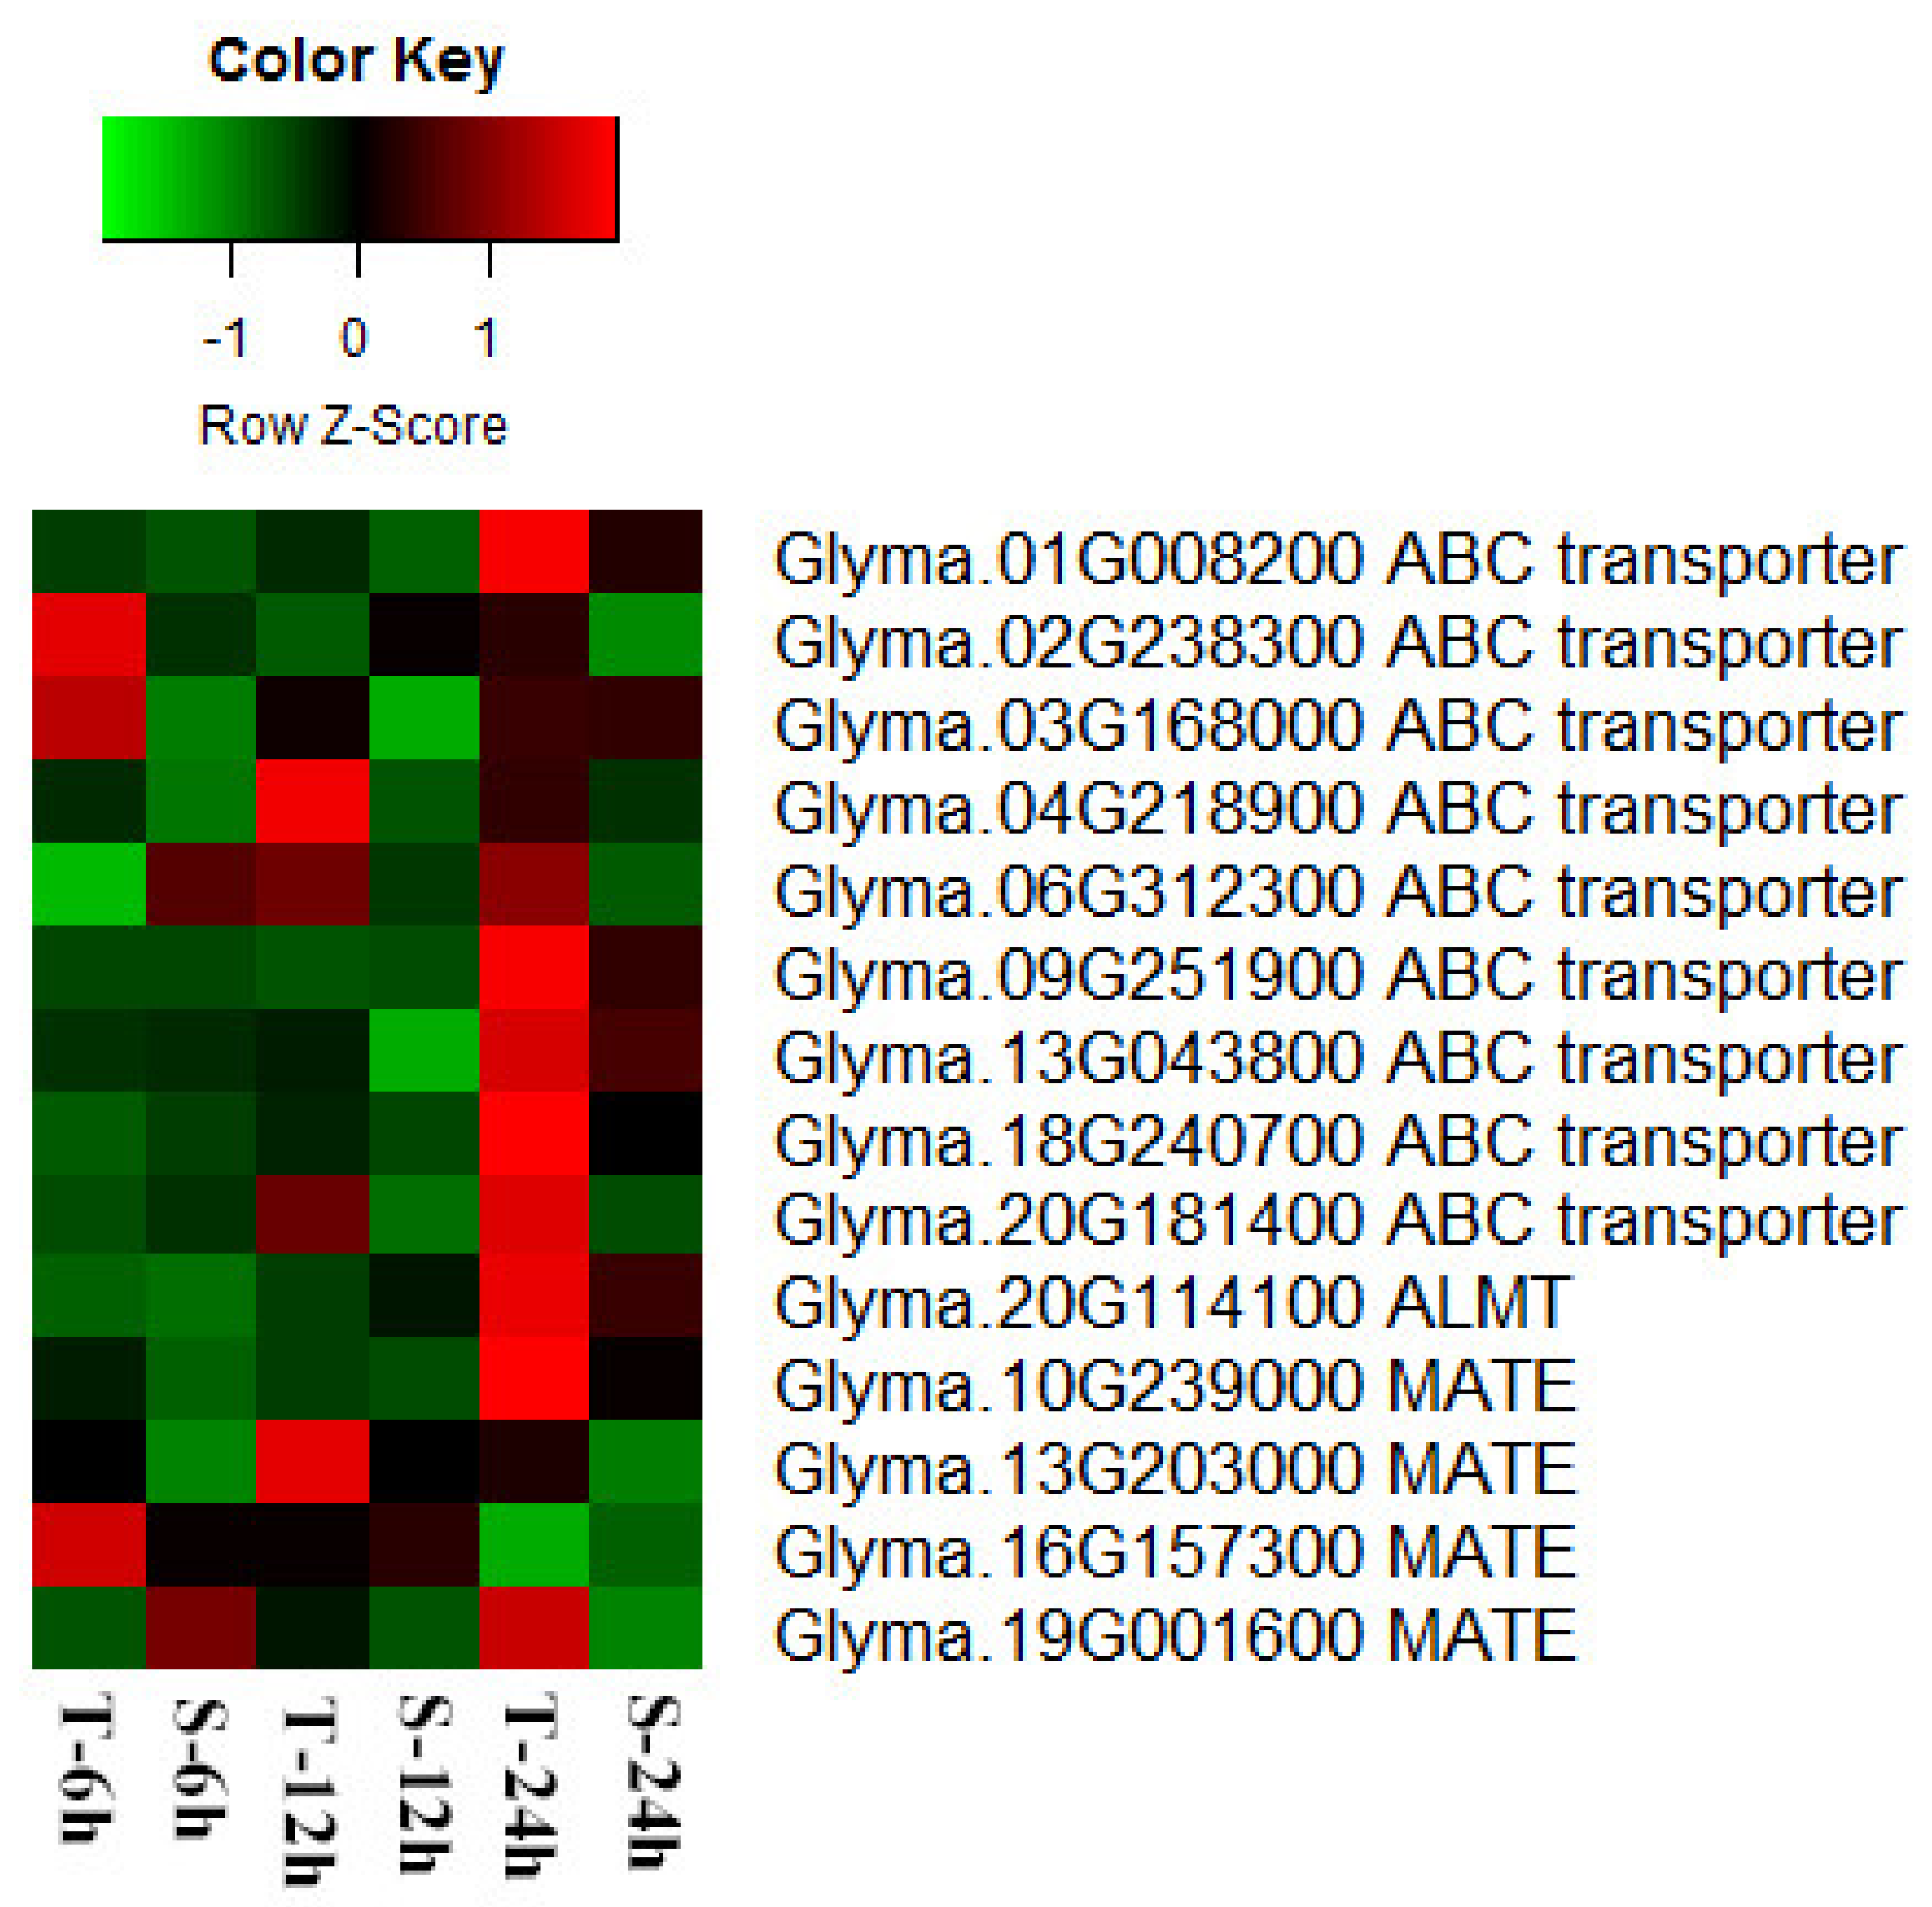
Among the 1411 Al tolerance candidate genes identified above, we found that genes with the molecular function of transporter activity (GO:0005215) were also significantly enriched (FDR = 3.09 × 10⁻³, Figure 2). Previous studies have shown that ALMT, MATE, and ABC transporters play important roles in Al resistance of many plant species. In this study, nine genes encoding ABC transporters, one ALMT gene, and four MATE genes were up-regulated by Al stress and with more fold changes in T than S for at least one time point (Figure 6). One MATE gene, Glyma.13G203000, which has been previously designated as GmMATE75 [56], was significantly up-regulated by Al stress in both T and S and with more fold changes in T than S at all three time points including at 6, 12, and 24 h (Figure 6). Therefore, GmMATE75 might play an important role in soybean tolerance to Al toxicity.
4. Discussion
Al toxicity in acid soils is one of the primary environmental challenges limiting crop productivity. To identify Al-responsive genes and characterize the molecular mechanisms underlying Al tolerance, transcriptomic analysis has been performed in Arabidopsis, buckwheat (Fagopyrum tataricum), common bean (Phaseolus vulgaris), maize, rice, and soybean response to Al [55,66,68,69,70,71]. Previous studies showed that there was intraspecific variation in Al tolerance in many crop species [37,47,50]. In this study, two soybean varieties, KF (T) and GF (S), showed a significant difference in Al tolerance. Therefore, we compared the genome-wide expression profiles of these two soybean varieties in response to Al stress to identify the candidate genes for soybean Al tolerance and investigated the roles of PODs in soybean tolerance to Al toxicity.
The genome-wide transcriptional changes of two soybean varieties, T and S, in response to Al stress were analyzed, and the metabolic pathways involved in T and S soybean response to Al stress were compared (Figure S2–S4). At 24 h, more down-regulated genes involved in glycolysis and tricarboxylic acid cycle (TCA) were found in S than in T (Figure S4). It has been suggested that the operation of TCA in response to stress, coupled with the citrate pathway that enhances Al tolerance, may lead to modified metabolic homeostasis and/or improvements in productivity and overall cellular physiology in plant response to Al [72]. In this study, genes encoding PEPC in TCA (Glyma.06g229900, Glyma.06g277500, Glyma.13g270400) were more down-regulated in S than T. Plants overexpressing PEPC showed enhanced oxalate exudation [73], while oxalate is a strong chelator of Al. Therefore, the role of PEPC in soybean tolerance to Al stress should be further investigated.
GO enrichment analysis revealed that the GO term of POD activity in the molecular function was significantly enriched in the Al-induced candidate genes for Al tolerance compared with the genome-wide genes (Figure 2). Hence, we performed qRT-PCR to determine the expression patterns of POD genes in response to Al stress. The expression levels of seven POD genes in the roots of T were up-regulated by Al and with more fold changes in T than in S for at least one time point (Figure 3). Moreover, the POD activity was also significantly increased by Al stress. These results indicate that POD is likely to play an important role in soybean tolerance to Al toxicity. A previous study has showed that Al stress induced ROS production, and higher levels of POD activity were observed in the Al-tolerant rice variety than in the Al-sensitive rice variety [74].
H2O2 is considered one of the important members of ROS that is an important signal in the activation of plant defense pathways against biotic and abiotic stresses. Previous studies found that exogenous application of H2O2 was able to improve the Al tolerance of wheat and tobacco [21,75]. This study showed that 6 h of H2O2 pretreatment decreased the Al content in soybean root tips and enhanced Al tolerance (RRG) of soybean (Figure 5). A previous study found that Al toxicity induced massive endogenous H2O2 accumulation in soybean roots [76], which might act as signals for the activation of the expression of ROS scavenging enzymes such as PODs to alleviate the oxidative damage and root inhibition caused by Al stress.
We also found that four families of transcription factors (AP2, C3H4, MYB, WRKY) were significantly enriched in the 1411 Al-induced candidate genes for Al tolerance (Figure S6). The AP2 family is well known for its important functions in plant growth and development, hormonal regulation, and environmental stress response [77,78], but the role of AP2 in Al tolerance is unknown. MYB transcription factors possess diverse functions in secondary metabolism, hormone signal transduction, and response to environmental stresses. A previous study found that the targets of Al-responsive miRNA include MYB transcription factor mRNA in wild soybean [79]. The role of MYB transcription factors in Al tolerance needs to be further investigated.
Plant WRKY transcription factors are known to be involved in biotic and abiotic stress responses. Previous studies found that WRKY are crucial regulators of defense response and disease resistance [80,81]. It has been reported that AtWRKY46 negatively regulated AtALMT1, and the wrky46 mutant increased the release of malate and decreased the accumulation of Al3+ which resulted in enhanced Al tolerance in Arabidopsis [82]. In this study, 15 WRKY genes were identified in the Al-induced candidate genes for Al tolerance, and the expression of GmWRKY70 (Glyma.13g267600) was significantly induced by Al at 6, 12, and 24 h in T, but with almost no changes in S. This pattern was different from the AtWRKY46 expression pattern in response to Al stress in Arabidopsis. Thus, GmWRKY70 might play a role in soybean tolerance to Al toxicity but differed from AtWRKY46.
In addition, transporters such as the ABC transporter, ALMT, and MATE, have been reported to play important roles in plant tolerance to Al toxicity [83]. In Arabidopsis, AtALS3 encoding an ABC transporter is required for Al tolerance [84]. OsSTAR1 and OsSTAR2 encode a nucleotide binding domain and a transmembrane domain of an ABC transporter, respectively, and are required for detoxification of Al in rice [83,85]. The ALMT and MATE genes encode membrane transporters that control malate and citrate efflux in response to Al, respectively [83]. The function of ALMT genes have been studied in Arabidopsis, barley, rape, rye, and wheat [32,34,38,86,87]. The overexpression of GmALMT1 enhanced malate secretion and Al tolerance of soybean hair roots [35]. The role of MATE genes in Al tolerance has also been reported in many crops such as rice, sorghum and wild soybean [36,37,46]. In the present study, the expression levels of nine genes encoding ABC transporters, one ALMT, and four MATE genes were induced by Al and showed more up-regulation in T than in S for at least one time point (Figure 6), indicating their potential roles in soybean tolerance to Al toxicity. One MATE gene, Glyma.13G203000 (GmMATE75), was significantly up-regulated at 6, 12, and 24 h of Al stress and showed more fold changes in T than S in the present study and also in our previous study [56]. Overexpression of GsMATE (a homolog gene of GmMATE75 from wild soybean) enhanced the Al tolerance of transgenic Arabidopsis [46]. A recent study reported that GmMATE75 is a plasma-membrane-localized citrate transporter, and its overexpression led to increased citrate efflux and less Al content in soybean hairy roots [88], suggesting GmMATE75 plays important roles in soybean tolerance to Al toxicity.
5. Conclusions
In summary, the genome-wide gene expression profiling of roots from Al-tolerant (T) and Al-sensitive (S) soybean varieties under control and Al stress at 6, 12, and 24 h was investigated, and 1411 genes showed specific up-regulation in T or more up-regulation in T than in S by Al stress, which were significantly enriched in the GO terms of POD activity, transporter activity, and four families of transcription factors (AP2, C3H4, MYB, WRKY). The POD activities in the roots of T and S increased after Al stress. The H2O2 pretreatment significantly improved Al tolerance of T, which is likely due to the increased POD activity induced by H2O2. Fourteen genes encoding transporters that were related to Al tolerance, such as the ABC transporter, ALMT, and MATE, were up-regulated by Al and with more fold changes in T than in S for at least one time point. Our results suggested that POD and transporters play important roles in soybean tolerance to Al toxicity.
Supplementary Materials
The following are available online at https://www.mdpi.com/article/10.3390/agronomy11040670/s1, Figure S1: Hierarchical cluster analysis of the genome-wide transcripts in the roots of soybean varieties T and S under control (CK) or Al stress. The hierarchical cluster analysis was performed using complete method with Euclidean distance metric by Average linkage in Cluster 3.0. The gene expression levels were transformed by log10. Figure S2: The transcriptional changes of genome-wide genes in response to Al stress at 6 h in two soybean varieties, KF (T) and GF (S), by MapMan overview of metabolism. The log2 (fold change) of genome-wide genes between Al stress and control in two soybean varieties could be visualized using the MapMan software. The metabolic pathways were shown by different shapes with a group of genes in small square boxes. The red and blue square boxes indicate the genes were up-regulated or down-regulated in response to Al, respectively. Figure S3: The transcriptional changes of genome-wide genes in response to Al stress at 12 h in two soybean varieties, KF (T) and GF (S), by MapMan overview of metabolism. The log2 (fold change) of genome-wide genes between Al stress and control in two soybean varieties could be visualized using the MapMan software. The metabolic pathways were shown by different shapes with a group of genes in small square boxes. The red and blue square boxes indicate the genes were up-regulated or down-regulated in response to Al, respectively. Figure S4: The transcriptional changes of genome-wide genes in response to Al stress at 24 h in two soybean varieties, KF (T) and GF (S), by MapMan overview of metabolism. The log2 (fold change) of genome-wide genes between Al stress and control in two soybean varieties could be visualized using the MapMan software. The metabolic pathways were shown by different shapes with a group of genes in small square boxes. The red and blue square boxes indicate the genes were up-regulated or down-regulated in response to Al, respectively. Figure S5: Gene Ontology (GO) classifications of the up- (A) or down- (B) regulated genes by Al stress in soybean. The GO functional classifications of cellular component, molecular function, and biological process are shown. Figure S6: Transcription factor family enrichment analysis of the 1411 up-regulated candidate genes for Al tolerance in soybean. The percentage of transcription factor (TF) families in the test set and all TFs in the soybean genome reference set were shown by a green bar and grey bar, respectively. * indicates significant enrichment of the TF family (p < 0.01, FDR < 0.05). Figure S7: Comparison of the results from microarray data and qRT-PCR analysis. Log2 fold change of ten genes in the roots of T after exposure to Al stress for 6, 12, and 24 h (A); log2 fold change of ten genes in the roots of S after exposure to Al stress for 6, 12, and 24 h (B); and the correlation of the log2 (fold change) obtained by microarray (x-axis) with log2 (fold change) obtained by qRT-PCR (y-axis) (C). Figure S8: The effect of H2O2 treatment on POD activity in soybean roots. POD activity in the roots from 4-d-old soybean seedlings of T and S exposed to 100 μM H2O2 treatment for 6 h and control (CK). Means and standard errors were calculated from three biological replications, 12 plants per replication. ** indicates significant difference (student’s t-test) in POD activity between CK and H2O2 treatment at a significance level of 0.01. Table S1: Primers used for quantitative RT-PCR. Table S2: Genes in glycolysis and tricarboxylic acid cycle pathways in response to Al at 24 h in the roots of KF (T) and GF (S). Table S3: Number of differently expressed genes between Al stress and control. Table S4: Differentially up-regulated genes by Al stress between Al-tolerant soybean T and Al-sensitive soybean S. Table S5: Differentially down-regulated genes by Al stress between Al-tolerant soybean T and Al-sensitive soybean S. Table S6: The 34 genes in the enriched GO term of peroxidase activity (GO:0004601). Table S7: Genes encoding transcription factors in the 1411 Al tolerance candidate genes.
Author Contributions
Conceptualization, J.L. and Y.L. (Yan Li); data curation, J.L., X.W., N.W., Y.L. (Yang Li) and T.J.; formal analysis, J.L.; funding acquisition, N.W. and Y.L. (Yan Li); investigation, J.L.; resources, J.G. and Y.L. (Yan Li); supervision, J.G. and Y.L. (Yan Li); validation, J.L.; visualization, J.L.; writing the original draft, J.L.; revising and editing, J.L. and Y.L. (Yan Li). All authors have read and agreed to the published version of the manuscript.
Funding
This work was supported by the National Natural Science Foundation of China (31371645), the Fundamental Research Funds for the Central Universities (KYT201801), the Natural Science Foundation of Jiangsu Province (BK20170713), and the Program for Changjiang Scholars and Innovative Research Team in University (IRT_17R55).
Data Availability Statement
The data presented in this study are available in the supplementary material, and the microarray data have been deposited in the National Center for Biotechnology Information (NCBI) Gene Expression Omnibus (accession number GSE116796).
Conflicts of Interest
The authors declare no conflict of interest.
Abbreviations
| ABC | ATP-Binding Cassette |
| Al | Aluminum |
| ALMT | Aluminum-activated malate transporter |
| DEG | Differently expressed gene |
| DW | Dry weight |
| FDR | False discovery rate |
| FC | Fold change |
| Fructose-6-P | Fructose-6-phosphate |
| Fructose-1,6-bis-P1 | Fructose-1,6-bisphosphatase1 |
| GO | Gene Ontology |
| H2O2 | Hydrogen peroxide |
| KEGG | Kyoto Encyclopedia of Genes and Genomes |
| MATE | Multidrug and toxin extrusion |
| OAA | Oxaloacetate |
| POD | Peroxidase |
| PEP | Phosphoenolpyruvate |
| PEPC | Phosphoenolpyruvate Carboxylase |
| ROS | Reactive oxygen species |
| RG | Root growth |
| RRG | Relative root growth |
| RNA-Seq | RNA sequencing |
| S | Sensitive |
| SA | Salicylic acid |
| SEA | Singular enrichment analysis |
| TCA | Tricarboxylic acid cycle |
| TF | Transcription factor |
| T | Tolerant |
References
- Sinclair, J.B. Compendium of Soybean Diseases; American Phytopathological Society and University of Illinois: St. Paul, MN, USA, 1982. [Google Scholar]
- Wilson, R.F. Soybean: Market driven research needs. In Genetics and Genomics of Soybean; Springer: Berlin/Heidelberg, Germany, 2008; pp. 3–15. [Google Scholar]
- Kochian, L.V.; Hoekenga, O.A.; Pineros, M.A. How do crop plants tolerate acid soils? Mechanisms of aluminum tolerance and phosphorous efficiency. Annu. Rev. Plant Biol. 2004, 55, 459–493. [Google Scholar] [CrossRef] [PubMed]
- Kochian, L.V.; Pineros, M.A.; Hoekenga, O.A. The physiology, genetics and molecular biology of plant aluminum resistance and toxicity. Plant Soil 2005, 274, 175–195. [Google Scholar] [CrossRef]
- Ryan, P.R.; Kochian, L.V. Interaction between Aluminum Toxicity and Calcium Uptake at the Root Apex in Near-Isogenic Lines of Wheat (Triticum aestivum L.) Differing in Aluminum Tolerance. Plant Physiol. 1993, 102, 975. [Google Scholar] [CrossRef]
- Ma, J.F. Syndrome of aluminum toxicity and diversity of aluminum resistance in higher plants. Int. Rev. Cytol. 2007, 264, 225–252. [Google Scholar] [PubMed]
- Poschenrieder, C.; Gunsé, B.; Corrales, I.; Barceló, J. A glance into aluminum toxicity and resistance in plants. Sci. Total Environ. 2008, 400, 356–368. [Google Scholar] [CrossRef] [PubMed]
- Rout, G.; Samantaray, S.; Das, P. Aluminium toxicity in plants: A review. Agronomie 2001, 21, 3–21. [Google Scholar] [CrossRef]
- Rengel, Z.; Zhang, W.H. Role of dynamics of intracellular calcium in aluminium-toxicity syndrome. New Phytol. 2003, 159, 295–314. [Google Scholar] [CrossRef]
- Yamamoto, Y.; Kobayashi, Y.; Devi, S.R.; Rikiishi, S.; Matsumoto, H. Aluminum toxicity is associated with mitochondrial dysfunction and the production of reactive oxygen species in plant cells. Plant Physiol. 2002, 128, 63–72. [Google Scholar] [CrossRef]
- Blancaflor, E.B.; Jones, D.L.; Gilroy, S. Alterations in the cytoskeleton accompany aluminum-induced growth inhibition and morphological changes in primary roots of maize. Plant Physiol. 1998, 118, 159–172. [Google Scholar] [CrossRef] [Green Version]
- Amenós, M.; Corrales, I.; Poschenrieder, C.; Illéš, P.; Baluška, F.; Barceló, J. Different effects of aluminum on the actin cytoskeleton and brefeldin A-sensitive vesicle recycling in root apex cells of two maize varieties differing in root elongation rate and aluminum tolerance. Plant Cell Physiol. 2009, 50, 528–540. [Google Scholar] [CrossRef] [PubMed] [Green Version]
- Schreiner, K.A.; Hoddinott, J.; Taylor, G.J. Aluminum-induced deposition of (1,3)-β-glucans (callose) in Triticum aestivum L. Plant Soil 1994, 162, 273–280. [Google Scholar] [CrossRef]
- Ezaki, B.; TsugUa, S.; Matsumoto, H. Expression of a moderately anionic peroxidase is induced by aluminum treatment in tobacco cells: Possible involvement of peroxidase isozymes in aluminum ion stress. Physiol. Plant. 1996, 96, 21–28. [Google Scholar] [CrossRef]
- Richards, K.D.; Schott, E.J.; Sharma, Y.K.; Davis, K.R.; Gardner, R.C. Aluminum induces oxidative stress genes in Arabidopsis thaliana. Plant Physiol. 1998, 116, 409–418. [Google Scholar] [CrossRef] [Green Version]
- Cakmak, I.; Horst, W.J. Effect of aluminium on lipid peroxidation, superoxide dismutase, catalase, and peroxidase activities in root tips of soybean (Glycine max). Physiol. Plant. 1991, 83, 463–468. [Google Scholar] [CrossRef]
- Simonovicova, M.; Huttova, J.; Mistrik, I.; Siroka, B.; Tamas, L. Root growth inhibition by aluminum is probably caused by cell death due to peroxidase-mediated hydrogen peroxide production. Protoplasma 2004, 224, 91–98. [Google Scholar] [CrossRef] [PubMed]
- Yang, Y.; Ma, L.; Zeng, H.; Chen, L.Y.; Zheng, Y.; Li, C.X.; Yang, Z.P.; Wu, N.; Mu, X.; Dai, C.Y.; et al. iTRAQ-based proteomics screen for potential regulators of wheat (Triticum aestivum L.) root cell wall component response to Al stress. Gene 2018, 675, 301–311. [Google Scholar] [CrossRef]
- Ezaki, B.; Gardner, R.C.; Ezaki, Y.; Matsumoto, H. Expression of aluminum-induced genes in transgenic Arabidopsis plants can ameliorate aluminum stress and/or oxidative stress. Plant Physiol. 2000, 122, 657–666. [Google Scholar] [CrossRef] [Green Version]
- Wu, Y.; Yang, Z.; How, J.; Xu, H.; Chen, L.; Li, K. Overexpression of a peroxidase gene (AtPrx64) of Arabidopsis thaliana in tobacco improves plant’s tolerance to aluminum stress. Plant Mol. Biol. 2017, 95, 157–168. [Google Scholar] [CrossRef] [PubMed]
- Xu, F.J.; Jin, C.W.; Liu, W.J.; Zhang, Y.S.; Lin, X.Y. Pretreatment with H2O2 Alleviates Aluminum-induced Oxidative Stress in Wheat Seedlings. J. Integr. Plant Biol. 2011, 53, 44–53. [Google Scholar] [CrossRef]
- Ryan, P.; Delhaize, E.; Jones, D. Function and mechanism of organic anion exudation from plant roots. Annu. Rev. Plant Biol. 2001, 52, 527–560. [Google Scholar] [CrossRef] [PubMed]
- Ma, J.F.; Ryan, P.R.; Delhaize, E. Aluminium tolerance in plants and the complexing role of organic acids. Trends Plant Sci. 2001, 6, 273–278. [Google Scholar] [CrossRef]
- Rengel, Z. Aluminium cycling in the soil-plant-animal-human continuum. Biometals 2004, 17, 669–689. [Google Scholar] [CrossRef] [PubMed]
- Vázquez, M.D.; Poschenrieder, C.; Corrales, I.; Barceló, J. Change in apoplastic aluminum during the initial growth response to aluminum by roots of a tolerant maize variety. Plant Physiol. 1999, 119, 435–444. [Google Scholar] [CrossRef] [Green Version]
- Zhou, G.; Delhaize, E.; Zhou, M.; Ryan, P.R. Biotechnological solutions for enhancing the aluminium resistance of crop plants. In Abiotic Stress in Plants—Mechanisms and Adaptations; InTech: Brisbane, Australia, 2011; pp. 119–142. [Google Scholar]
- Delhaize, E.; Ma, J.F.; Ryan, P.R. Transcriptional regulation of aluminium tolerance genes. Trends Plant Sci. 2012, 17, 341–348. [Google Scholar] [CrossRef]
- Sasaki, T.; Yamamoto, Y.; Ezaki, B.; Katsuhara, M.; Ahn, S.J.; Ryan, P.R.; Delhaize, E.; Matsumoto, H. A wheat gene encoding an aluminum-activated malate transporter. Plant J. 2004, 37, 645–653. [Google Scholar] [CrossRef]
- Pineros, M.A.; Cançado, G.M.; Kochian, L.V. Novel properties of the wheat aluminum tolerance organic acid transporter (TaALMT1) revealed by electrophysiological characterization in Xenopus oocytes: Functional and structural implications. Plant Physiol. 2008, 147, 2131–2146. [Google Scholar] [CrossRef] [PubMed] [Green Version]
- Zhang, W.-H.; Ryan, P.R.; Sasaki, T.; Yamamoto, Y.; Sullivan, W.; Tyerman, S.D. Characterization of the TaALMT1 protein as an Al3+-activated anion channel in transformed tobacco (Nicotiana tabacum L.) cells. Plant Cell Physiol. 2008, 49, 1316–1330. [Google Scholar] [CrossRef] [Green Version]
- Hoekenga, O.A.; Maron, L.G.; Pineros, M.A.; Cancado, G.M.; Shaff, J.; Kobayashi, Y.; Ryan, P.R.; Dong, B.; Delhaize, E.; Sasaki, T.; et al. AtALMT1, which encodes a malate transporter, is identified as one of several genes critical for aluminum tolerance in Arabidopsis. Proc. Natl. Acad. Sci. USA 2006, 103, 9738–9743. [Google Scholar] [CrossRef] [Green Version]
- Ligaba, A.; Katsuhara, M.; Ryan, P.R.; Shibasaka, M.; Matsumoto, H. The BnALMT1 and BnALMT2 genes from rape encode aluminum-activated malate transporters that enhance the aluminum resistance of plant cells. Plant Physiol. 2006, 142, 1294–1303. [Google Scholar] [CrossRef] [PubMed] [Green Version]
- Fontecha, G.; Silva-Navas, J.; Benito, C.; Mestres, M.; Espino, F.; Hernandez-Riquer, M.; Gallego, F. Candidate gene identification of an aluminum-activated organic acid transporter gene at the Alt4 locus for aluminum tolerance in rye (Secale cereale L.). Theor. Appl. Genet. 2007, 114, 249–260. [Google Scholar] [CrossRef] [PubMed]
- Collins, N.C.; Shirley, N.J.; Saeed, M.; Pallotta, M.; Gustafson, J.P. An ALMT1 Gene Cluster Controlling Aluminum Tolerance at the Alt4 Locus of Rye (Secale cereale L.). Genetics 2008, 179, 669–682. [Google Scholar] [CrossRef] [Green Version]
- Liang, C.; Pineros, M.A.; Tian, J.; Yao, Z.; Sun, L.; Liu, J.; Shaff, J.; Coluccio, A.; Kochian, L.V.; Liao, H. Low pH, aluminum, and phosphorus coordinately regulate malate exudation through GmALMT1 to improve soybean adaptation to acid soils. Plant Physiol. 2013, 161, 1347–1361. [Google Scholar] [CrossRef] [Green Version]
- Furukawa, J.; Yamaji, N.; Wang, H.; Mitani, N.; Murata, Y.; Sato, K.; Katsuhara, M.; Takeda, K.; Ma, J.F. An aluminum-activated citrate transporter in barley. Plant Cell Physiol. 2007, 48, 1081–1091. [Google Scholar] [CrossRef] [Green Version]
- Magalhaes, J.V.; Liu, J.; Guimaraes, C.T.; Lana, U.G.; Alves, V.M.; Wang, Y.H.; Schaffert, R.E.; Hoekenga, O.A.; Pineros, M.A.; Shaff, J.E.; et al. A gene in the multidrug and toxic compound extrusion (MATE) family confers aluminum tolerance in sorghum. Nat. Genet. 2007, 39, 1156–1161. [Google Scholar] [CrossRef] [PubMed]
- Liu, J.; Magalhaes, J.V.; Shaff, J.; Kochian, L.V. Aluminum-activated citrate and malate transporters from the MATE and ALMT families function independently to confer Arabidopsis aluminum tolerance. Plant J. 2009, 57, 389–399. [Google Scholar] [CrossRef] [PubMed] [Green Version]
- Maron, L.G.; Piñeros, M.A.; Guimarães, C.T.; Magalhaes, J.V.; Pleiman, J.K.; Mao, C.; Shaff, J.; Belicuas, S.N.; Kochian, L.V. Two functionally distinct members of the MATE (multi-drug and toxic compound extrusion) family of transporters potentially underlie two major aluminum tolerance QTLs in maize. Plant J. 2010, 61, 728–740. [Google Scholar] [CrossRef] [PubMed]
- Yokosho, K.; Yamaji, N.; Ma, J.F. An Al-inducible MATE gene is involved in external detoxification of Al in rice. Plant J. 2011, 68, 1061–1069. [Google Scholar] [CrossRef] [PubMed]
- Yang, X.Y.; Yang, J.L.; Zhou, Y.; Pineros, M.A.; Kochian, L.V.; Li, G.X.; Zheng, S.J. A de novo synthesis citrate transporter, Vigna umbellata multidrug and toxic compound extrusion, implicates in Al-activated citrate efflux in rice bean (Vigna umbellata) root apex. Plant Cell Environ. 2011, 34, 2138–2148. [Google Scholar] [CrossRef]
- Sawaki, Y.; Kihara-Doi, T.; Kobayashi, Y.; Nishikubo, N.; Kawazu, T.; Kobayashi, Y.; Koyama, H.; Sato, S. Characterization of Al-responsive citrate excretion and citrate-transporting MATEs in Eucalyptus camaldulensis. Planta 2013, 237, 979–989. [Google Scholar] [CrossRef]
- Tovkach, A.; Ryan, P.R.; Richardson, A.E.; Lewis, D.C.; Rathjen, T.M.; Ramesh, S.; Tyerman, S.D.; Delhaize, E. Transposon-mediated alteration of TaMATE1B expression in wheat confers constitutive citrate efflux from root apices. Plant Physiol. 2013, 161, 880–892. [Google Scholar] [CrossRef] [Green Version]
- Garcia-Oliveira, A.L.; Martins-Lopes, P.; Tolra, R.; Poschenrieder, C.; Tarquis, M.; Guedes-Pinto, H.; Benito, C. Molecular characterization of the citrate transporter gene TaMATE1 and expression analysis of upstream genes involved in organic acid transport under Al stress in bread wheat (Triticum aestivum). Physiol. Plant. 2014, 152, 441–452. [Google Scholar] [CrossRef]
- Wu, X.; Li, R.; Shi, J.; Wang, J.; Sun, Q.; Zhang, H.; Xing, Y.; Qi, Y.; Zhang, N.; Guo, Y.-D. Brassica oleracea MATE Encodes a Citrate Transporter and Enhances Aluminum Tolerance in Arabidopsis thaliana. Plant Cell Physiol. 2014, 55, 1426–1436. [Google Scholar] [CrossRef] [PubMed] [Green Version]
- Ma, Q.; Yi, R.; Li, L.; Liang, Z.; Zeng, T.; Zhang, Y.; Huang, H.; Zhang, X.; Yin, X.; Cai, Z.; et al. GsMATE encoding a multidrug and toxic compound extrusion transporter enhances aluminum tolerance in Arabidopsis thaliana. BMC Plant Biol. 2018, 18, 212. [Google Scholar] [CrossRef] [PubMed]
- Ma, J.F.; Nagao, S.; Sato, K.; Ito, H.; Furukawa, J.; Takeda, K. Molecular mapping of a gene responsible for Al-activated secretion of citrate in barley. J. Exp. Bot. 2004, 55, 1335–1341. [Google Scholar] [CrossRef] [PubMed] [Green Version]
- Qi, B.; Korir, P.; Zhao, T.; Yu, D.; Chen, S.; Gai, J. Mapping quantitative trait loci associated with aluminum toxin tolerance in NJRIKY recombinant inbred line population of soybean (Glycine max). J. Integr. Plant Biol. 2008, 50, 1089–1095. [Google Scholar] [CrossRef]
- Sharma, A.D.; Sharma, H.; Lightfoot, D.A. The genetic control of tolerance to aluminum toxicity in the ‘Essex’ by ‘Forrest’ recombinant inbred line population. Theor. Appl. Genet. 2011, 122, 687–694. [Google Scholar] [CrossRef]
- Famoso, A.N.; Zhao, K.; Clark, R.T.; Tung, C.-W.; Wright, M.H.; Bustamante, C.; Kochian, L.V.; McCouch, S.R. Genetic architecture of aluminum tolerance in rice (Oryza sativa) determined through genome-wide association analysis and QTL mapping. PLoS Genet. 2011, 7, e1002221. [Google Scholar] [CrossRef] [Green Version]
- Korir, P.C.; Zhang, J.; Wu, K.; Zhao, T.; Gai, J. Association mapping combined with linkage analysis for aluminum tolerance among soybean cultivars released in Yellow and Changjiang River Valleys in China. Theor. Appl. Genet. 2013, 126, 1659–1675. [Google Scholar] [CrossRef]
- Daspute, A.A.; Sadhukhan, A.; Tokizawa, M.; Kobayashi, Y.; Panda, S.K.; Koyama, H. Transcriptional Regulation of Aluminum-Tolerance Genes in Higher Plants: Clarifying the Underlying Molecular Mechanisms. Front. Plant Sci. 2017, 8, 1358. [Google Scholar] [CrossRef] [Green Version]
- Zhang, X.; Wang, N.; Chen, P.; Gao, M.; Liu, J.; Wang, Y.; Zhao, T.; Li, Y.; Gai, J. Overexpression of a Soybean Ariadne-Like Ubiquitin Ligase Gene GmARI1 Enhances Aluminum Tolerance in Arabidopsis. PLoS ONE 2014, 9, e111120. [Google Scholar] [CrossRef] [Green Version]
- Duressa, D.; Soliman, K.; Taylor, R.; Senwo, Z. Proteomic Analysis of Soybean Roots under Aluminum Stress. Int. J. Plant Genom. 2011, 2011, 282531. [Google Scholar] [CrossRef] [Green Version]
- You, J.; Zhang, H.; Liu, N.; Gao, L.; Kong, L.; Yang, Z. Transcriptomic responses to aluminum stress in soybean roots. Genome 2011, 54, 923–933. [Google Scholar] [CrossRef] [PubMed]
- Liu, J.; Li, Y.; Wang, W.; Gai, J.; Li, Y. Genome-wide analysis of MATE transporters and expression patterns of a subgroup of MATE genes in response to aluminum toxicity in soybean. BMC Genom. 2016, 17, 223. [Google Scholar] [CrossRef] [Green Version]
- Xue, Y.; Jiang, L.; Su, N.; Wang, J.K.; Deng, P.; Ma, J.F.; Zhai, H.Q.; Wan, J.M. The genetic basic and fine-mapping of a stable quantitative-trait loci for aluminium tolerance in rice. Planta 2007, 227, 255–262. [Google Scholar] [CrossRef]
- Chance, B.; Maehly, A. Assay of catalases and peroxidases. Methods Enzymol. 1955, 2, 764–775. [Google Scholar]
- Delhaize, E.; Ryan, P.R.; Hebb, D.M.; Yamamoto, Y.; Sasaki, T.; Matsumoto, H. Engineering high-level aluminum tolerance in barley with the ALMT1 gene. Proc. Natl. Acad. Sci. USA 2004, 101, 15249–15254. [Google Scholar] [CrossRef] [Green Version]
- Irizarry, R.A.; Hobbs, B.; Collin, F.; Beazer-Barclay, Y.D.; Antonellis, K.J.; Scherf, U.; Speed, T.P. Exploration, normalization, and summaries of high density oligonucleotide array probe level data. Biostatistics 2003, 4, 249–264. [Google Scholar] [CrossRef] [PubMed] [Green Version]
- Usadel, B.; Nagel, A.; Thimm, O.; Redestig, H.; Blaesing, O.E.; Palacios-Rojas, N.; Selbig, J.; Hannemann, J.; Piques, M.C.; Steinhauser, D.; et al. Extension of the visualization tool MapMan to allow statistical analysis of arrays, display of corresponding genes, and comparison with known responses. Plant Physiol. 2005, 138, 1195–1204. [Google Scholar] [CrossRef] [PubMed] [Green Version]
- Saeed, A.I.; Sharov, V.; White, J.; Li, J.; Liang, W.; Bhagabati, N.; Braisted, J.; Klapa, M.; Currier, T.; Thiagarajan, M.; et al. TM4: A free, open-source system for microarray data management and analysis. Biotechniques 2003, 34, 374–378. [Google Scholar] [CrossRef] [PubMed] [Green Version]
- Du, Z.; Zhou, X.; Ling, Y.; Zhang, Z.; Su, Z. agriGO: A GO analysis toolkit for the agricultural community. Nucleic Acids Res. 2010, 38, W64–W70. [Google Scholar] [CrossRef] [Green Version]
- Livak, K.J.; Schmittgen, T.D. Analysis of relative gene expression data using real-time quantitative PCR and the 2−ΔΔCT method. Methods 2001, 25, 402–408. [Google Scholar] [CrossRef]
- Jin, J.; Tian, F.; Yang, D.-C.; Meng, Y.-Q.; Kong, L.; Luo, J.; Gao, G. PlantTFDB 4.0: Toward a central hub for transcription factors and regulatory interactions in plants. Nucleic Acids Res. 2016, 45, D1040–D1045. [Google Scholar] [CrossRef] [Green Version]
- Maron, L.G.; Kirst, M.; Mao, C.; Milner, M.J.; Menossi, M.; Kochian, L.V. Transcriptional profiling of aluminum toxicity and tolerance responses in maize roots. New Phytol. 2008, 179, 116–128. [Google Scholar] [CrossRef] [Green Version]
- Suo, Y.; Gao, S.; Baranzoni, G.M.; Xie, Y.; Liu, Y. Comparative transcriptome RNA-Seq analysis of Listeria monocytogenes with sodium lactate adaptation. Food Control 2018, 91, 193–201. [Google Scholar] [CrossRef]
- Kumari, M.; Taylor, G.J.; Deyholos, M.K. Transcriptomic responses to aluminum stress in roots of Arabidopsis thaliana. Mol. Genet. Genom. 2008, 279, 339–357. [Google Scholar] [CrossRef]
- Eticha, D.; Zahn, M.; Bremer, M.; Yang, Z.; Rangel, A.F.; Rao, I.M.; Horst, W.J. Transcriptomic analysis reveals differential gene expression in response to aluminium in common bean (Phaseolus vulgaris) genotypes. Ann. Bot. 2010, 105, 1119–1128. [Google Scholar] [CrossRef] [PubMed] [Green Version]
- Tsutsui, T.; Yamaji, N.; Huang, C.F.; Motoyama, R.; Nagamura, Y.; Ma, J.F. Comparative genome-wide transcriptional analysis of Al-responsive genes reveals novel Al tolerance mechanisms in rice. PLoS ONE 2012, 7, e48197. [Google Scholar] [CrossRef]
- Zhu, H.; Wang, H.; Zhu, Y.; Zou, J.; Zhao, F.-J.; Huang, C.-F. Genome-wide transcriptomic and phylogenetic analyses reveal distinct aluminum-tolerance mechanisms in the aluminum-accumulating species buckwheat (Fagopyrum tataricum). BMC Plant Biol. 2015, 15, 1. [Google Scholar] [CrossRef] [Green Version]
- Nunesnesi, A.; Santos, B.D.; Inostrozablancheteau, C.; Fernie, A.R.; Araújo, W.L. The complex role of mitochondrial metabolism in plant aluminum resistance. Trends Plant Sci. 2014, 19, 399–407. [Google Scholar] [CrossRef] [PubMed]
- Begum, H.H.; Osaki, M.; Shinano, T.; Miyatake, H.; Wasaki, J.; Yamamura, T.; Watanabe, T. The Function of a Maize-Derived Phosphoenol pyruvate Carboxylase (PEPC) in Phosphorus-Deficient Transgenic Rice. Soil Sci. Plant Nutr. 2005, 51, 497–506. [Google Scholar] [CrossRef]
- Ma, B.; Gao, L.; Zhang, H.; Cui, J.; Shen, Z. Aluminum-induced oxidative stress and changes in antioxidant defenses in the roots of rice varieties differing in Al tolerance. Plant Cell Rep. 2012, 31, 687–696. [Google Scholar] [CrossRef] [PubMed]
- Devi, S.R.; Yamamoto, Y.; Matsumoto, H. An intracellular mechanism of aluminum tolerance associated with high antioxidant status in cultured tobacco cells. J. Inorg. Biochem. 2003, 97, 59–68. [Google Scholar] [CrossRef]
- Tamás, L.; Budíková, S.; Huttová, J.; Mistrík, I.; Šimonovičová, M.; Široká, B. Aluminum-induced cell death of barley-root border cells is correlated with peroxidase- and oxalate oxidase-mediated hydrogen peroxide production. Plant Cell Rep. 2005, 24, 189–194. [Google Scholar] [CrossRef]
- Gruber, V.; Blanchet, S.; Diet, A.; Zahaf, O.; Boualem, A.; Kakar, K.; Alunni, B.; Udvardi, M.; Frugier, F.; Crespi, M. Identification of transcription factors involved in root apex responses to salt stress in Medicago truncatula. Mol. Genet. Genom. 2009, 281, 55–66. [Google Scholar] [CrossRef] [Green Version]
- Lee, S.-Y.; Hwang, E.Y.; Seok, H.-Y.; Tarte, V.N.; Jeong, M.S.; Jang, S.B.; Moon, Y.-H. Arabidopsis AtERF71/HRE2 functions as transcriptional activator via cis-acting GCC box or DRE/CRT element and is involved in root development through regulation of root cell expansion. Plant Cell Rep. 2015, 34, 223–231. [Google Scholar] [CrossRef] [PubMed]
- Zeng, Q.-Y.; Yang, C.-Y.; Ma, Q.-B.; Li, X.-P.; Dong, W.-W.; Nian, H. Identification of wild soybean miRNAs and their target genes responsive to aluminum stress. BMC Plant Biol. 2012, 12, 1. [Google Scholar] [CrossRef] [Green Version]
- Li, J.; Brader, G.; Palva, E.T. The WRKY70 transcription factor: A node of convergence for jasmonate-mediated and salicylate-mediated signals in plant defense. Plant Cell 2004, 16, 319–331. [Google Scholar] [CrossRef] [PubMed] [Green Version]
- Eulgem, T.; Somssich, I.E. Networks of WRKY transcription factors in defense signaling. Curr. Opin. Plant Biol. 2007, 10, 366–371. [Google Scholar] [CrossRef] [Green Version]
- Ding, Z.J.; Yan, J.Y.; Xu, X.Y.; Li, G.X.; Zheng, S.J. WRKY46 functions as a transcriptional repressor of ALMT1, regulating aluminum-induced malate secretion in Arabidopsis. Plant J. 2013, 76, 825–835. [Google Scholar] [CrossRef]
- Kochian, L.V.; Pineros, M.A.; Liu, J.; Magalhaes, J.V. Plant adaptation to Acid soils: The molecular basis for crop aluminum resistance. Annu. Rev. Plant Biol. 2015, 66, 571–598. [Google Scholar] [CrossRef]
- Larsen, P.B.; Geisler, M.J.; Jones, C.A.; Williams, K.M.; Cancel, J.D. ALS3 encodes a phloem-localized ABC transporter-like protein that is required for aluminum tolerance in Arabidopsis. Plant J. 2005, 41, 353–363. [Google Scholar] [CrossRef] [PubMed]
- Huang, C.F.; Yamaji, N.; Mitani, N.; Yano, M.; Nagamura, Y.; Ma, J.F. A bacterial-type ABC transporter is involved in aluminum tolerance in rice. Plant Cell 2009, 21, 655–667. [Google Scholar] [CrossRef] [PubMed] [Green Version]
- Gruber, B.D.; Ryan, P.R.; Richardson, A.E.; Tyerman, S.D.; Ramesh, S.; Hebb, D.M.; Howitt, S.M.; Delhaize, E. HvALMT1 from barley is involved in the transport of organic anions. J. Exp. Bot. 2010, 61, 1455–1467. [Google Scholar] [CrossRef]
- Ryan, P.R.; Raman, H.; Gupta, S.; Sasaki, T.; Yamamoto, Y.; Delhaize, E. The multiple origins of aluminium resistance in hexaploid wheat include Aegilops tauschii and more recent cis mutations to TaALMT1. Plant J. 2010, 64, 446–455. [Google Scholar] [CrossRef]
- Zhou, Y.; Wang, Z.B.; Gong, L.; Chen, A.L.; Liu, N.; Li, S.; Sun, H.R.; Yang, Z.M.; You, J.F. Functional characterization of three MATE genes in relation to aluminum-induced citrate efflux from soybean root. Plant Soil 2019, 443, 121–138. [Google Scholar] [CrossRef]
Figure 1.
Phenotypic difference in Al tolerance between Al-tolerant (KF) (T) and Al-sensitive (GF) (S) soybean varieties. (A) Relative root growth (RRG) of T and S at 6, 12, and 24 h under Al stress (25 μM AlCl3, pH = 4.3) compared to control (0 μM AlCl3, pH = 4.3). Means and standard errors were calculated from three biological replications, with six plants per replication. (B) Al accumulation in the root tips (0–10 cm) of T and S at 6, 12, and 24 h after exposure to 25 μM AlCl3 (pH = 4.3). Means and standard errors were calculated from three biological replications, with over 50 plants per replication. DW: dry weight. * and ** indicate significant difference (student’s t-test) between T and S for each time point at levels of 0.05 and 0.01, respectively.
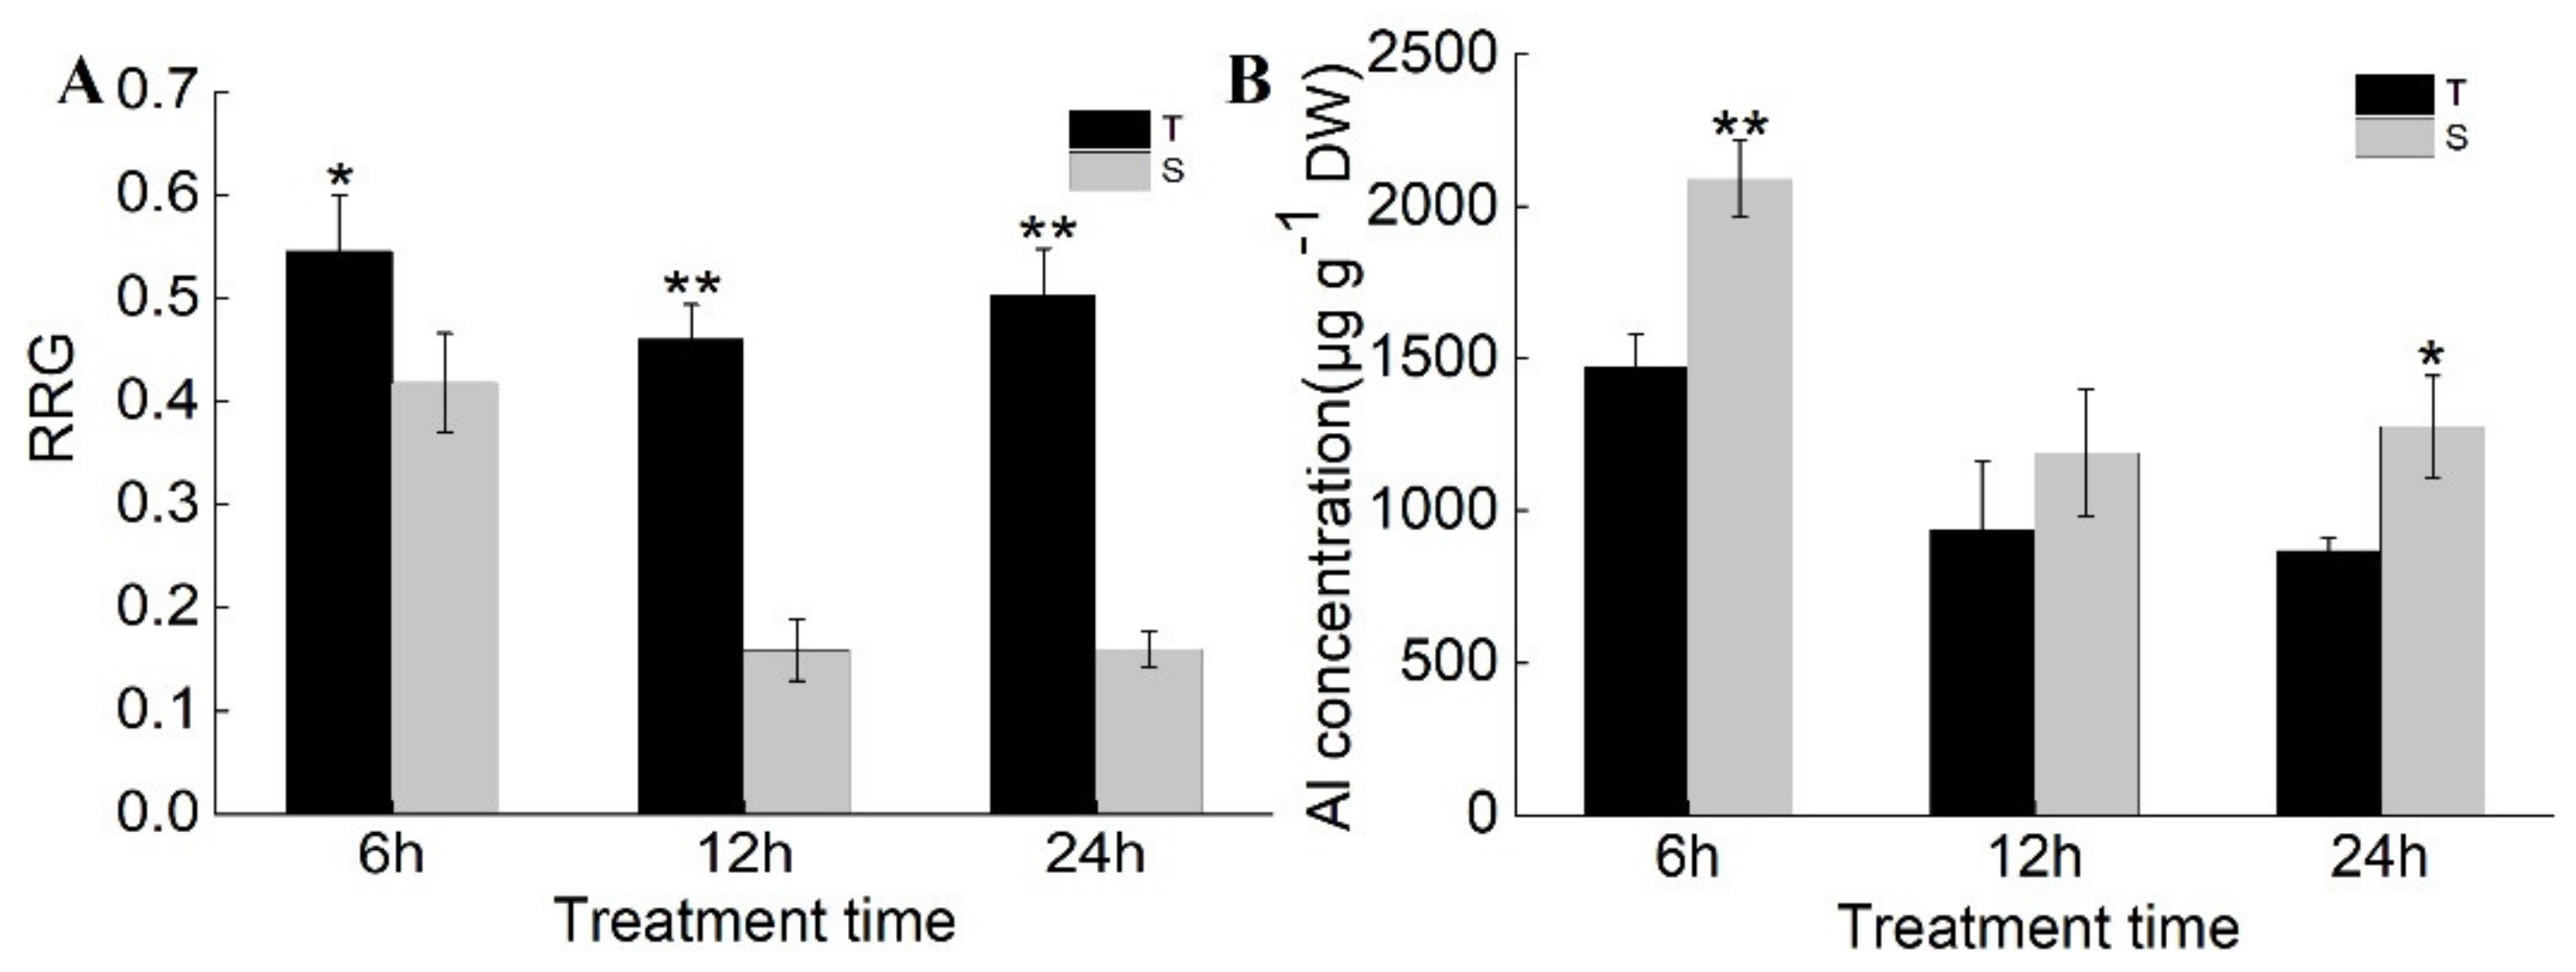
Figure 2.
Gene Ontology (GO) enrichment analysis (molecular function) of the 1411 up-regulated candidate genes for Al tolerance in soybean. The gene ratio on the x-axis represents the percentage of genes in each category. The Singular Enrichment Analysis (SEA) was performed using AgriGO. The GO terms and significance levels are displayed. Only the significant (p < 0.01, FDR < 0.05) GO terms are displayed. FDR: False discovery rate, which is shown as the logo on the right ranging from the lowest FDR (in red) to highest FDR (in blue).
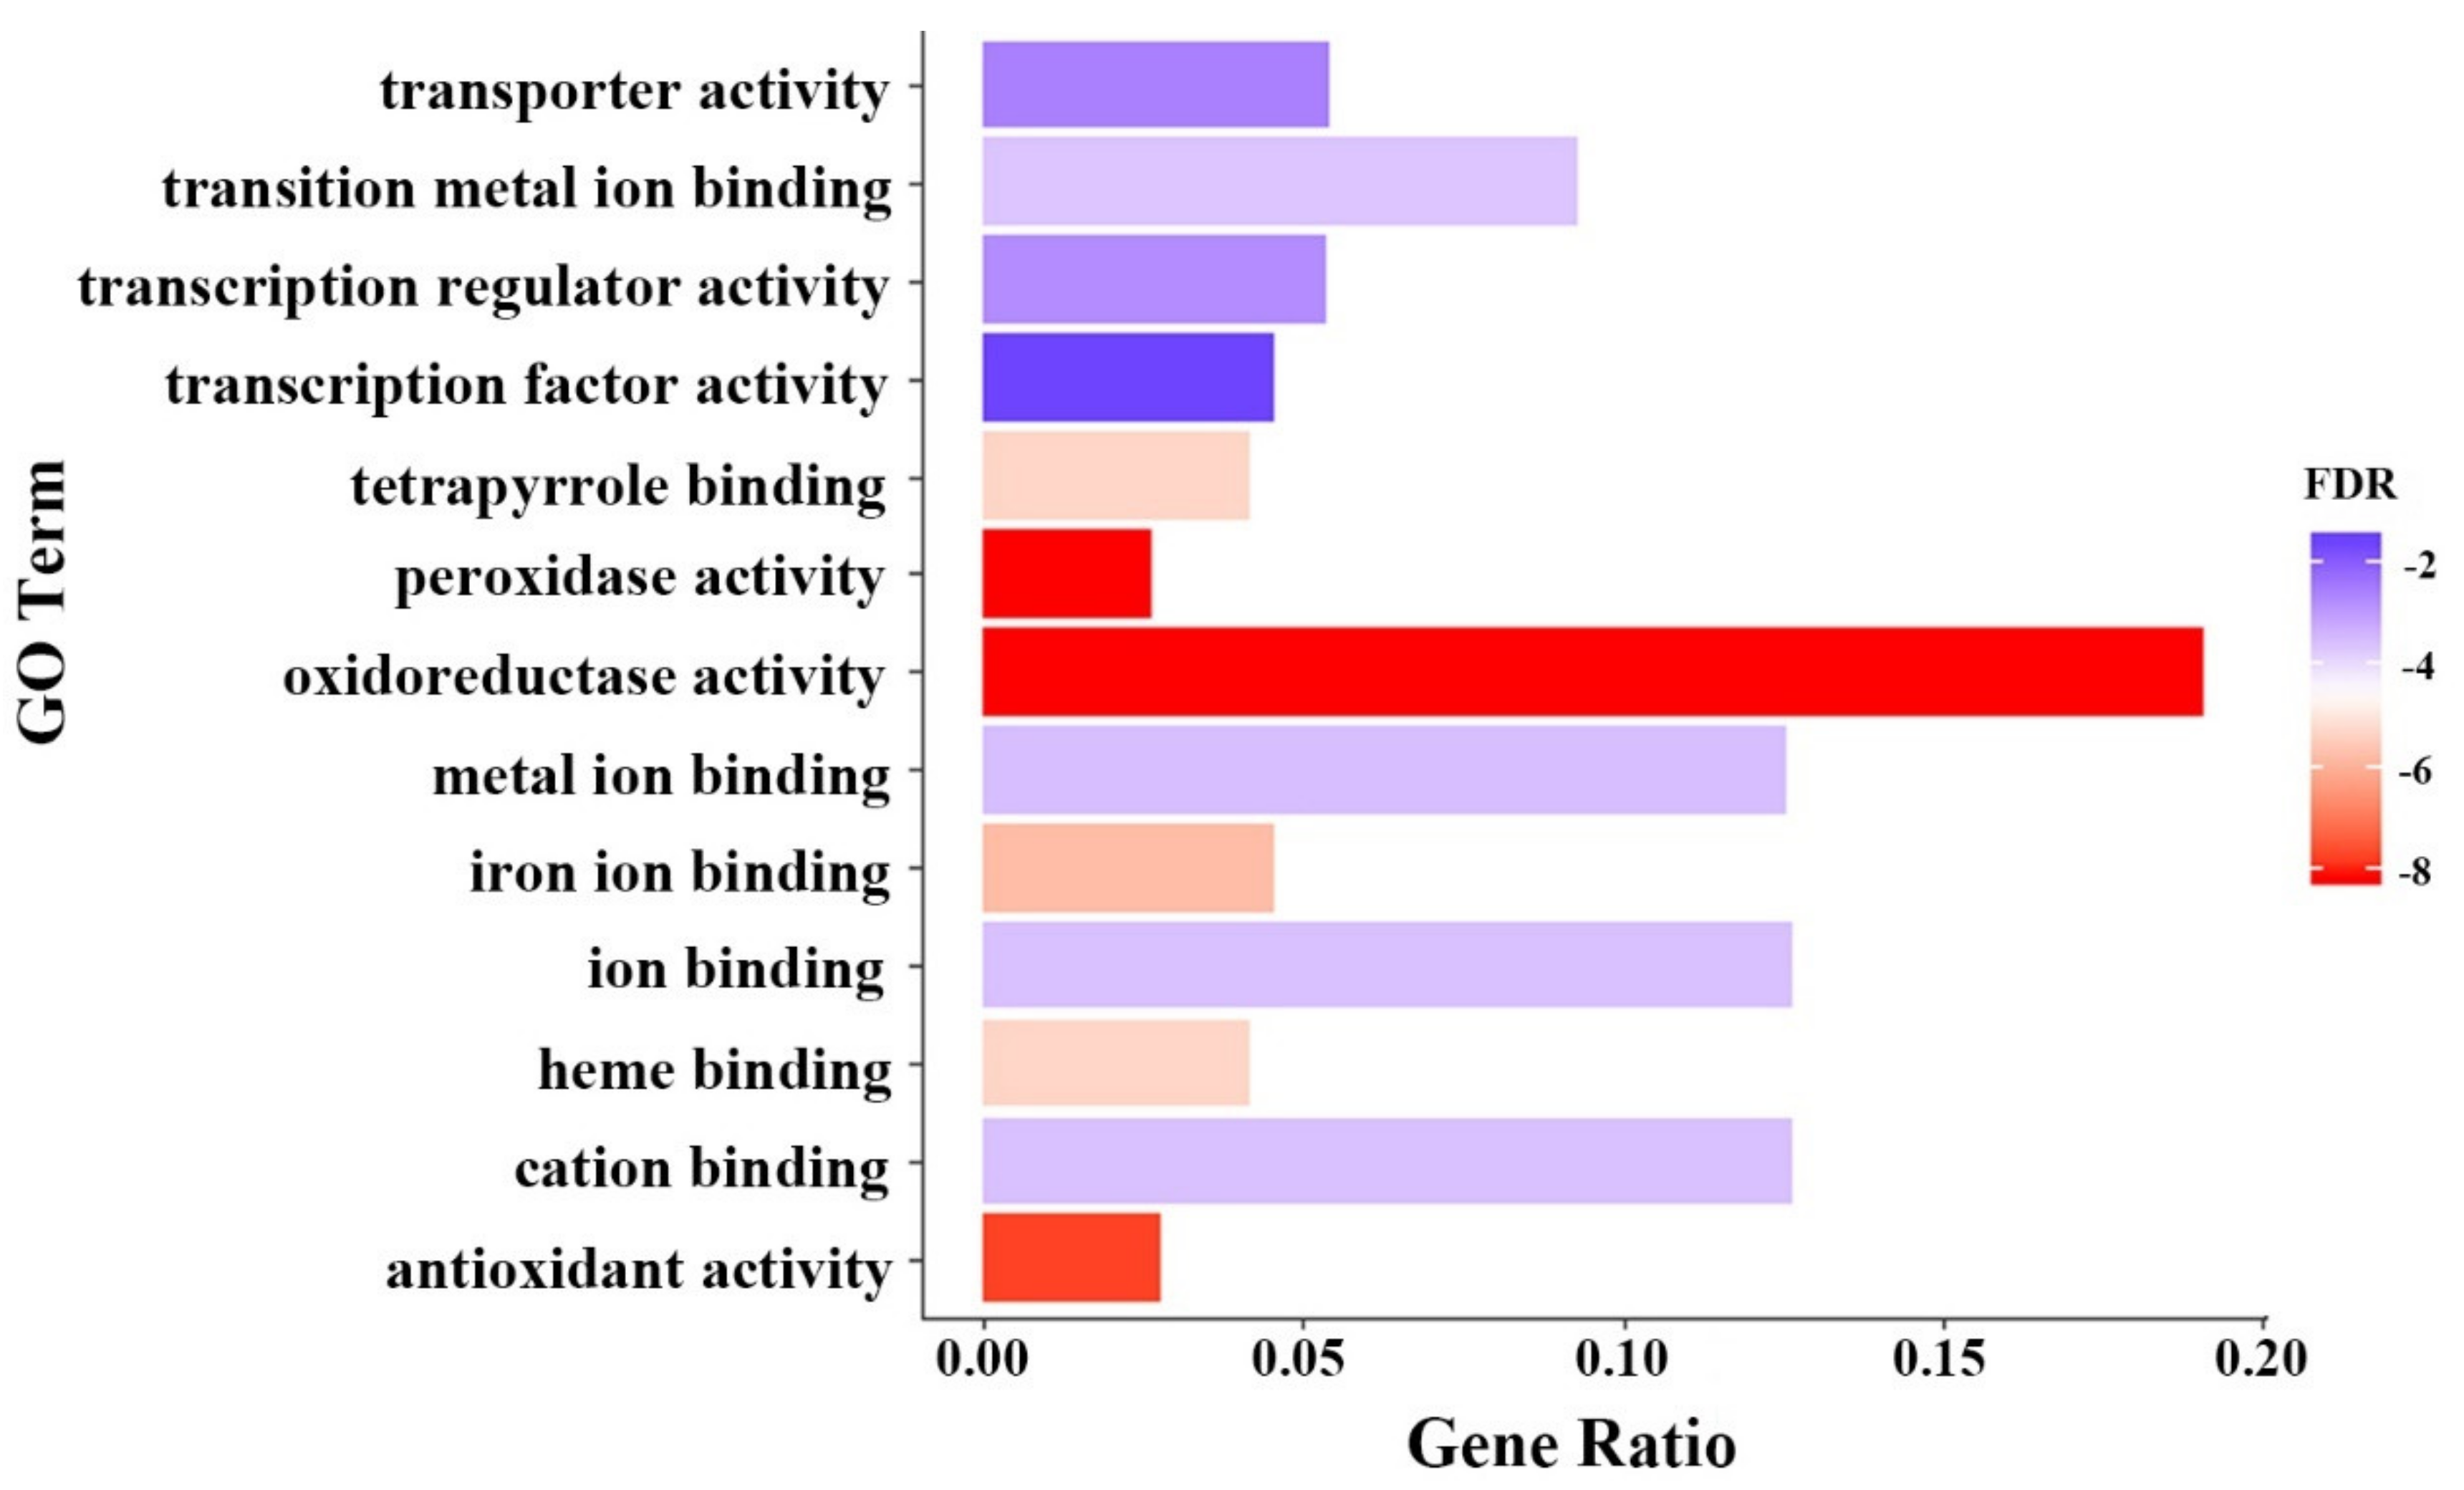
Figure 3.
Expression of seven POD genes in the roots of two soybean varieties T and S in response to Al stress. The relative expression of seven POD genes in soybean root tips (0–1 cm) in response to Al stress (25 μM AlCl3) was quantified by qRT-PCR, using the soybean GmEF-1α gene as the internal control and 0 μM AlCl3 (control) as reference. Means and standard deviations were calculated from three replicates. * and ** indicates significant difference (student’s t-test) in the relative expression level in response to Al stress between T and S for each time point at a significance level of 0.05 and 0.01, respectively.

Figure 4.
POD activity in the roots of two soybean varieties, T and S. The 17-d-old seedlings were exposed to control (CK) or Al stress (25 μM AlCl3) for 6, 12, and 24 h. Means and standard errors were calculated from three biological replications, with 12 plants per replication. * and ** indicate significant difference (student’s t-test) in POD activity between CK and Al stress for each time point at significance levels of 0.05 and 0.01, respectively.
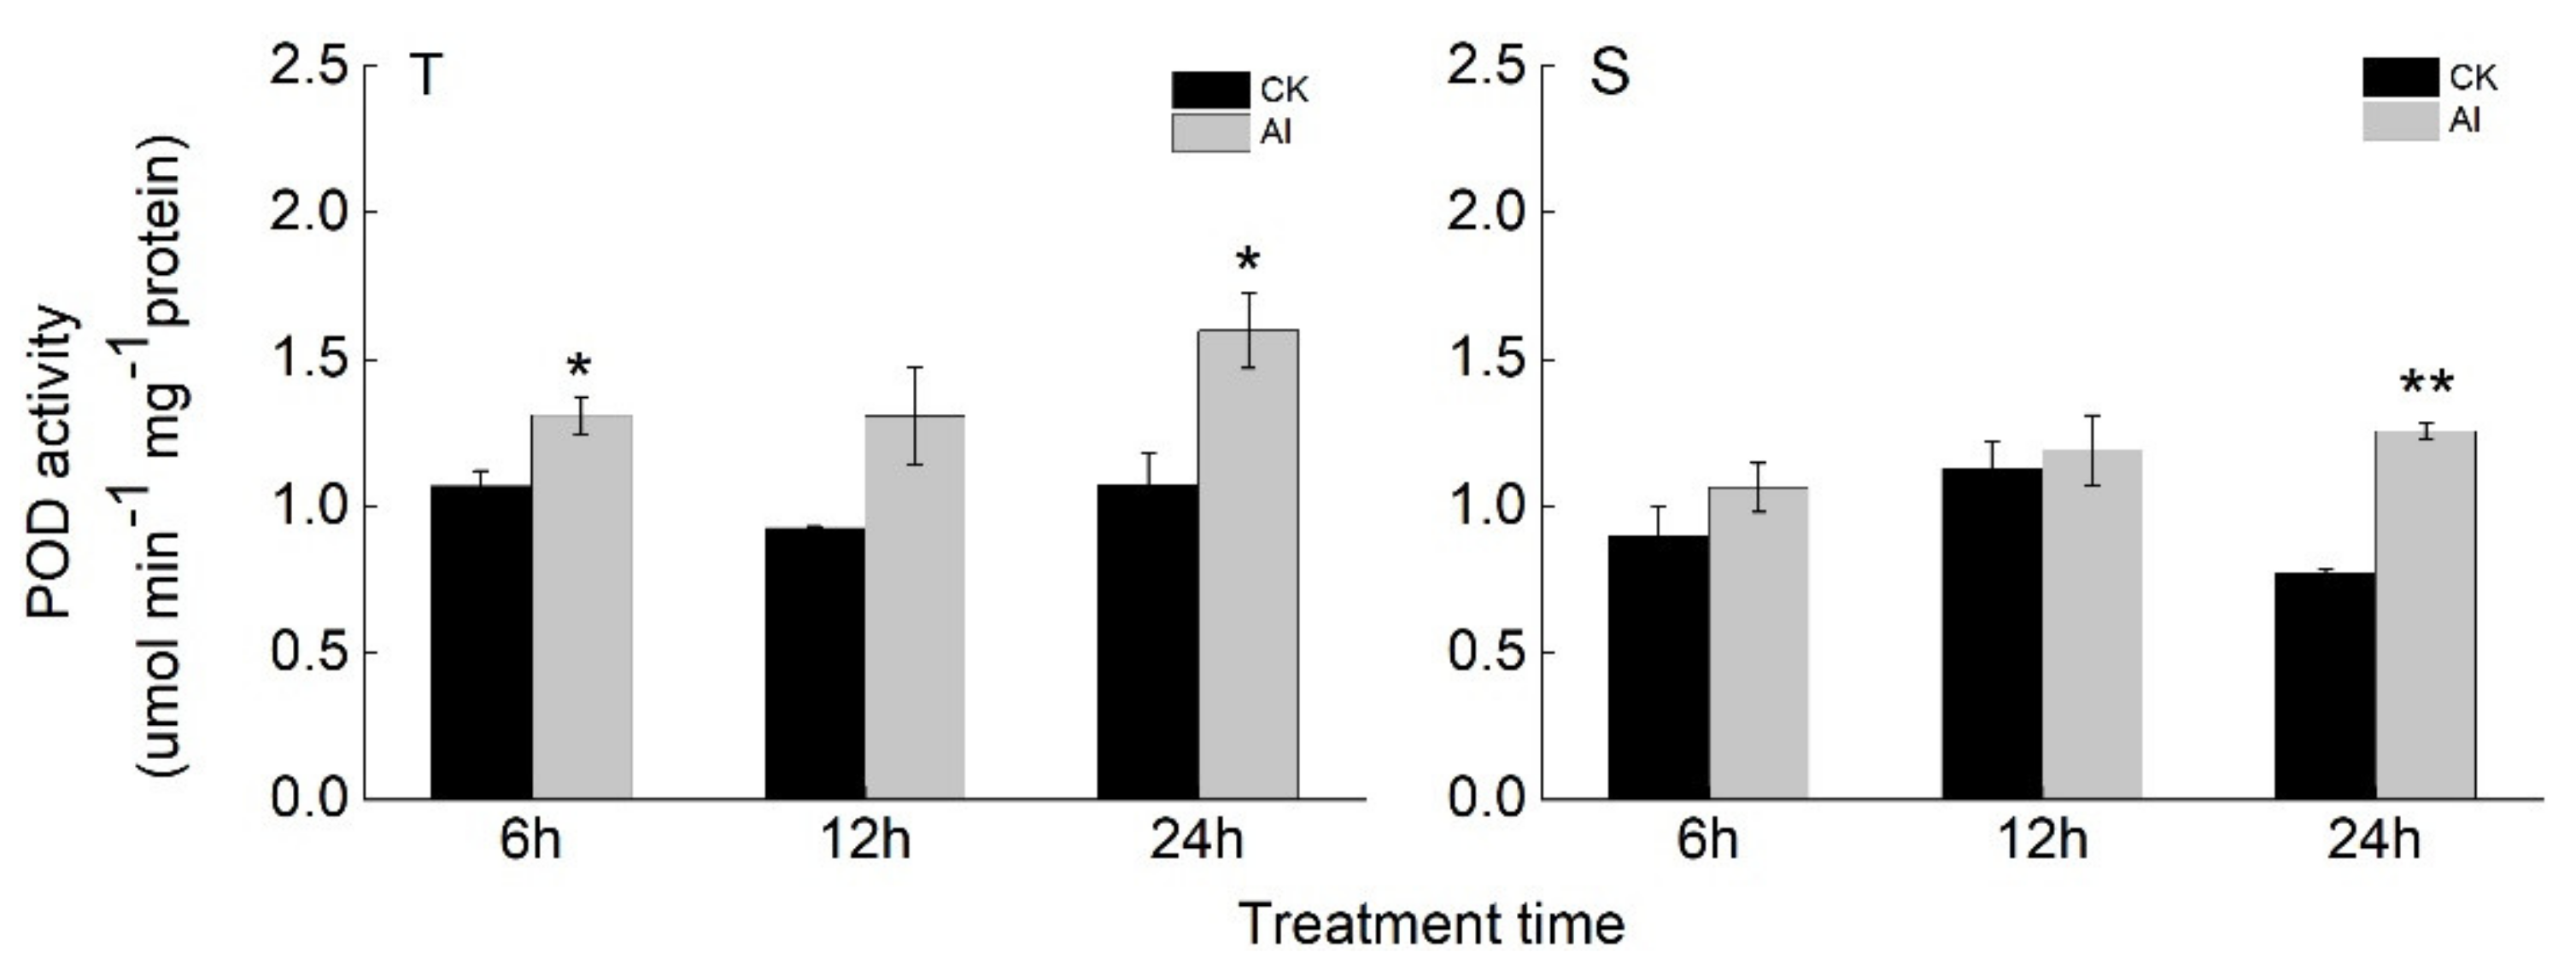
Figure 5.
Effect of H2O2 pretreatment on alleviating Al toxicity in soybean roots. (A) Relative root growth (RRG) of 4-d-old seedlings of soybean varieties T and S under control (CK) and different treatments. Means and standard errors were calculated from three biological replications, with six plants per replication. Data with the same letters above bars indicate no significant differences at a significance level of 0.05 (by Duncan’s new multiple range test) for each time point. (B) Al concentration in the roots of T and S at 6, 12, and 24 h after different treatments and CK. Means and standard errors were calculated from two biological replications, with over 50 plants per replication. DW: dry weight. Data with the same letters above bars indicate no significant differences at a significance level of 0.05 (by Duncan’s new multiple range test) for each time point. (C) The root tips of T and S under CK and different treatments for 24 h, stained by hematoxylin. The experiments were repeated three times. Scale bars = 1 mm. CK: 0 μM AlCl3, pH = 4.3. H2O2: 100 μM H2O2 + 0 μM AlCl3, pH = 4.3. Al: 25 μM AlCl3, pH = 4.3. H2O2 +Al: 100 μM H2O2 pretreatment for 6 h then subjected to Al treatment for 6, 12, and 24 h.
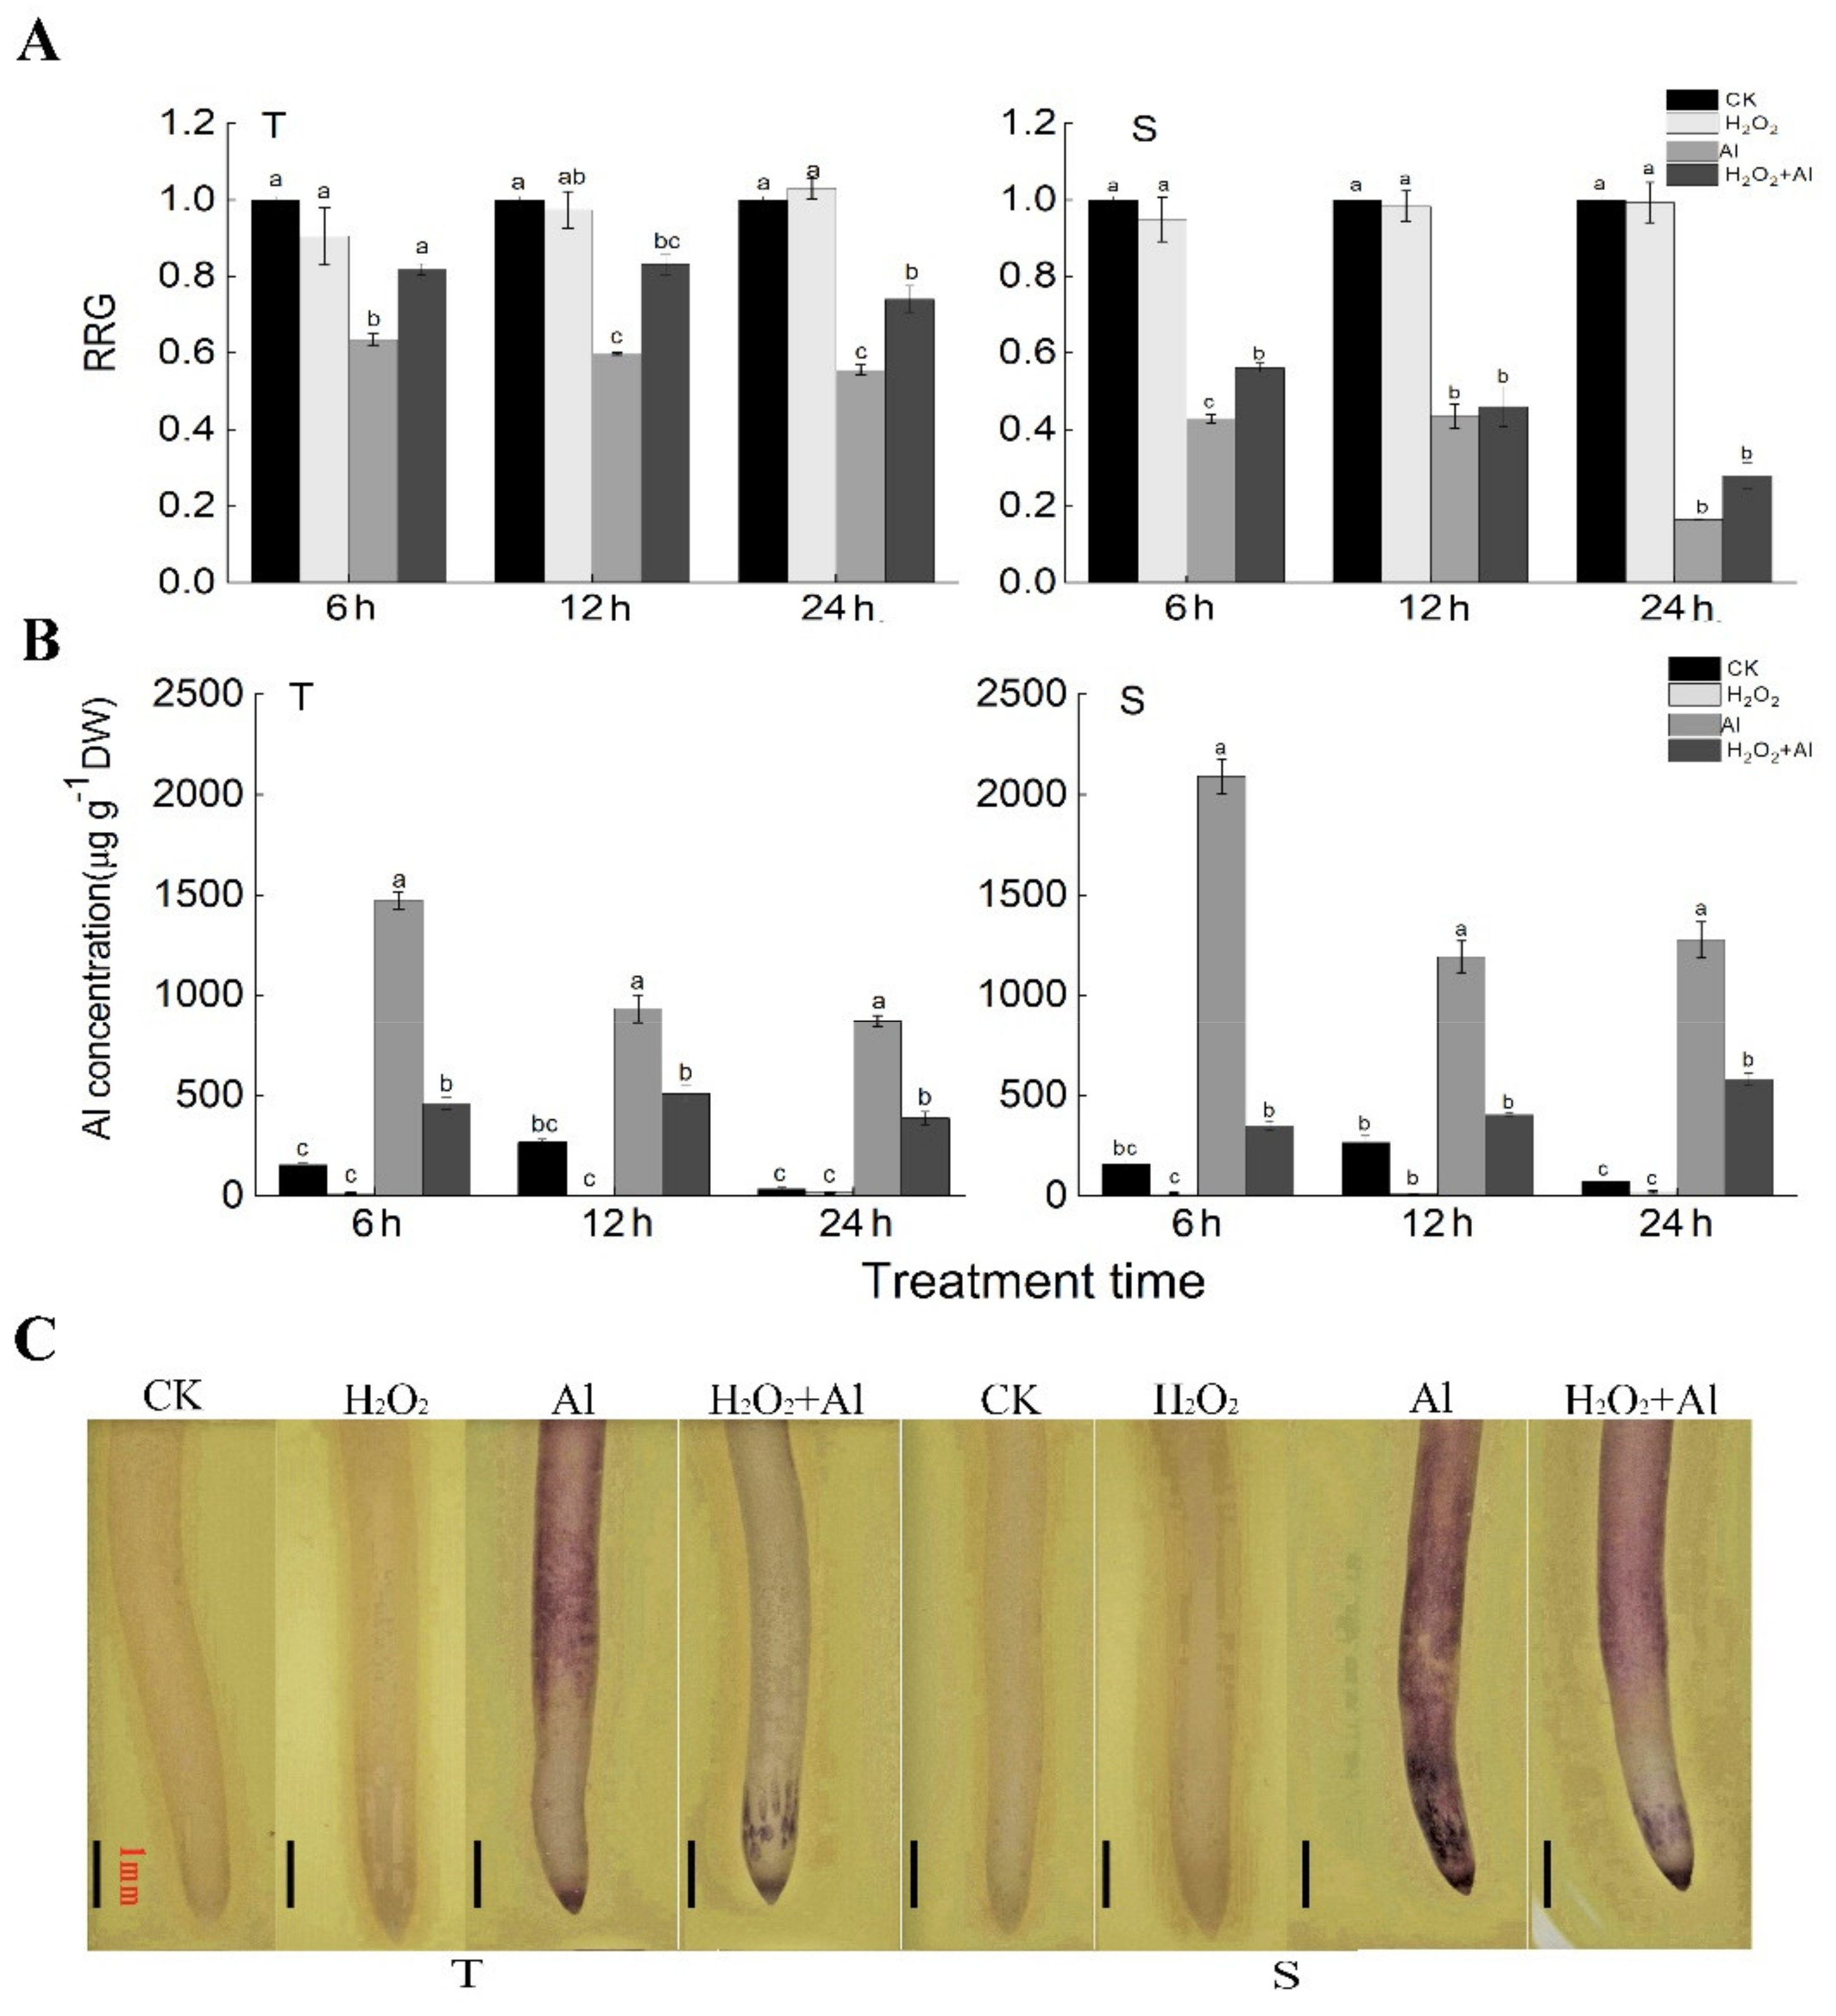
Figure 6.
Transcriptional changes of Al tolerance-related transporter genes in response to Al stress in the roots of KF (T) and GF (S) soybean varieties. The heatmap was constructed using the R package gplots. The color key represents the fold change (Al vs. control) scaled by row. ABC transporter: ATP-binding cassette transporter. ALMT: Aluminum activated malate transporter. MATE: Multidrug and toxic compound extrusion.
Publisher’s Note: MDPI stays neutral with regard to jurisdictional claims in published maps and institutional affiliations. |
© 2021 by the authors. Licensee MDPI, Basel, Switzerland. This article is an open access article distributed under the terms and conditions of the Creative Commons Attribution (CC BY) license (https://creativecommons.org/licenses/by/4.0/).
Share and Cite
MDPI and ACS Style
Liu, J.; Wang, X.; Wang, N.; Li, Y.; Jin, T.; Gai, J.; Li, Y. Comparative Analyses Reveal Peroxidases Play Important Roles in Soybean Tolerance to Aluminum Toxicity. Agronomy 2021, 11, 670. https://doi.org/10.3390/agronomy11040670
AMA Style
Liu J, Wang X, Wang N, Li Y, Jin T, Gai J, Li Y. Comparative Analyses Reveal Peroxidases Play Important Roles in Soybean Tolerance to Aluminum Toxicity. Agronomy. 2021; 11(4):670. https://doi.org/10.3390/agronomy11040670
Chicago/Turabian StyleLiu, Juge, Xiangting Wang, Ning Wang, Yang Li, Ting Jin, Junyi Gai, and Yan Li. 2021. "Comparative Analyses Reveal Peroxidases Play Important Roles in Soybean Tolerance to Aluminum Toxicity" Agronomy 11, no. 4: 670. https://doi.org/10.3390/agronomy11040670
Note that from the first issue of 2016, this journal uses article numbers instead of page numbers. See further details here.