Article

Genotypic and Phenotypic Characterization of Two Triticum aestivum L.—Dasypyrum villosum Translocations Lines in the Same Wheat Genetic Background

1
Institute of Crop Sciences, Chinese Academy of Agricultural Sciences, Beijing 100081, China
2
National Key Facility of Crop Gene Resources and Genetic Improvement, Chinese Academy of Agricultural Sciences, Beijing 100081, China
3
Institute of Plant Protection, Chinese Academy of Agricultural Sciences, Beijing 100193, China
*
Author to whom correspondence should be addressed.
Agronomy 2021, 11(2), 399; https://doi.org/10.3390/agronomy11020399
Submission received: 21 January 2021 / Revised: 15 February 2021 / Accepted: 20 February 2021 / Published: 23 February 2021
(This article belongs to the Special Issue Molecular Genetics, Genomics and Breeding of Cereal Crops)

Abstract

:
A wheat 660K chip was used to genotype two wheat-Dasypyrum villosum 6V#4S.6DL and 6V#2S.6AL translocation lines (A303 and B303) and their common wheat recurrent parent Wan7107. The results showed that these three lines have similar characteristics of base composition except for the translocation chromosomes. The alien translocation chromosomes have fewer homozygous and more heterozygous genotypes with more invalid probes. Distributions of SNPs between the translocation lines and Wan7107 were mainly dense on the regions of 6AS or 6DS as expected, but unexpectedly also on near the telomere of 2BS, and some regions of other wheat chromosomes. Meanwhile, the translocation lines A303 and B303 have 99.44% and 98.81% identical genotypes to Wan7107, respectively. Under the same genetic background, A303 and B303 showed different reactions to Blumeria graminis f. sp. tritici (Bgt) strains of powdery mildew. Both translocation lines have higher grain weight and plant height, and B303 has fewer spikelets compared to Wan7107. These results provide us a new insight into the genomic variation between the backcross generation plant and the recurrent parent, which is valuable information for understanding the relationship between wheat and the 6VS chromosome of D. villosum as well as the application potential of the alien chromosome arms.

1. Introduction

Common wheat (Triticum aestivum L., 2n = 6x = 42, AABBDD) is one of the most important food crops in the world, providing approximately 20% of the calories consumed by humans [1]. Wheat is the second largest grain crop in China. However, wheat production globally and in China is facing numerous challenges including limited arable land, growing populations, climate change [2], and biotic stress [3]. Yield is directly affected by extreme changes in wheat growing environments and natural disasters, among which drought [4], heat [5], and diseases [6] are the most significant. In order to broaden the genetic basis of wheat to meet these challenges, mining and utilizing desired genes derived from wild and related species for wheat improvement is now common. Genomes or chromosomes from related species such as Secale cereale L. [7,8,9], Dasypyrum villosum [10,11,12,13,14,15], Aegilops species [16,17,18,19], Hordeum vulgare L. [20], and Thinopyron elongatum [21], which contain a large number of wheat disease resistance genes, are tolerant to stress, have good flour-processing quality, and have been previously transferred into wheat to create amphidiploids [22,23], addition lines [20,24], substitution lines [25], or translocation lines [10,26,27,28].
Powdery mildew, caused by the biotrophic parasitic fungus Blumeria graminis f. sp. tritici (Bgt), is an important wheat disease worldwide and can cause severe yield losses ranging from 5 to 40% [29,30]. Currently, 89 wheat powdery mildew resistance genes/alleles (Pm1-Pm65) have been cataloged, which are located on nearly all wheat chromosomes [31,32]. Forty-four of these genes originated from progenitors and wild relatives of wheat, such as Pm7, Pm8, Pm17, Pm20, and Pm56 derived from S. cereale [33,34,35]; Pm21, Pm55, Pm62, and Pm67 are from D. villosum [10,36,37,38].
Pm97033 [39] and 92R178 [40] are wheat lines carrying strong powdery mildew (PM) resistance genes derived from different accessions of D. villosum. The alien chromosome arms of 6V#4S and 6V#2S were translocated to different chromosomes of wheat, replacing 6DS [41] and 6AS [42,43,44], respectively. Genes from two homologous chromosome arms of this wild species are endowed with broad-spectrum resistance to PM, making them difficult to distinguish from each other and considered to be the same for a long time, because they were in different complex backgrounds. The powdery mildew resistance gene in the 6V#2S translocation line is Pm21 [10]. However, there is a different powdery mildew resistance gene in the 6V#4S translocation line. Before that, because they were all in the 6V translocation line, they were mistaken for the same disease resistance gene. In recent years, the Pm gene on 6V#4S has been confirmed and named as PMV [45,46]. Although there are many in-depth research studies on these two translocation lines, such as the development of markers [47,48], there are still no reports on the agronomic traits and Pm-resistant spectrum of these two translocation lines. In order to compare the genetic effects of the two translocated chromosomes on the PM-resistant spectrums, and to find out if there are any agronomic traits such as plant height, spike length, spikelet number, tillering ability, grain size, etc., linked with the alien chromosome arms, the two different translocation chromosomes must be studied under a similar wheat background.
The wheat 660K SNP array is a useful genomic research tool. It has 660,000 probes that are almost evenly distributed across the genome [49]. Ninety-one percent of the probes have reliable physical positions. It can be used for high-throughput analysis with relatively low price. The probes have been widely used to screen bulked extreme phenotype DNA pools, develop Kompetitive Allele-Specific PCR (KASP) markers and simple sequence repeat (SSR) markers [50,51], and identify quantitative trait loci (QTL) [52,53,54,55,56,57], agronomic traits such as resistance to low nitrogen and genetic architecture of grain yield [58,59], and disease resistance such as wheat take-all, stripe rust [60,61,62] in common wheat. Recently, these probes have also been applied to determine the relationships of homoeologous chromosomes between wheat and its wild relatives [60,63].
In this study, two 6V#2S.6AL and 6V#4S.6DL translocation lines, A303 and B303, respectively bred using Pm97033 and 92R178 as parents backcrossed with wheat variety Wan7107, were scanned using the wheat 660k SNP chip. A total of 89,167 poly high-resolution probes were selected to analyze genomes of the three lines and the SNPs between the translocation lines and the recurrent parent Wan7107. In addition, the breakpoints of wheat chromosomes involved in translocations were determined. The distributions of SNPs on each chromosome between the translocations and Wan7107 were further investigated. Finally, under the same wheat background, the responses of two translocation lines to different strains of Bgt and their important agronomic traits such as plant height, spike length, spikelet number, tillering ability, grain size etc. were investigated and compared. The results of this study are valuable for understanding of genomic variation after continuous backcross, making effective use of the alien chromosome translocation lines, important genes, or to formulate breeding strategies.

2. Materials and Methods

2.1. Plant Materials

Wan7107 is a mutation line derived from a naturally mutated ear of Funo, an Italian wheat variety introduced into China in 1956 by the Nanyang Institute of Agricultural Sciences in Henan Province [64]. Funo was derived from the hybrid of two Italian wheat varieties Duecentodievi and Damiano and preserved at the Institute of Plant Protection, Chinese Academy of Agricultural Sciences (IPP, CAAS). The pedigree of A303 is Pm97033/Wan7107 × 3 BC2F4, in which Pm97033 is a 6V#4S.6DL translocation line, its pedigree is TH3 (an amphydiploid of T. durum and D. villosum)/Wan7107 × 4 F5 [29]. The pedigree of B303 is 92R178/Wan7107 × 9 BC8F4, bred, and preserved by professor Chen Xiao, in which 92R178 is a 6V#2S.6AL translocation line, bred by Nanjing Agricultural University and provided by Professor Chen Peidu. The relationships among Funo, Wan7107, A303, and B303 are shown in Figure 1.

2.2. Genotyping

Genomic DNA was isolated from 20 µg of leaves using a Plant Genomic DNA Kit (4992201/4992202) from Tiangen (Beijing, China) according to the manufacturer’s protocol. The DNA quality was detected using 1% Invitrogen E-Gel EX precast agarose gels (Thermo Fisher Scientific, Waltham, MA, USA). Qualified DNA samples were used for 660k SNP detection by Capitalbio Technology Corporation. Genotypic data were extracted and processed using the Axiom Analysis Suite 3.1.51. SNP with the highest typing reliability were selected, only polyhigh resolution probes (SNPs passed all thresholds) were used for analysis, and probes without corresponding physical locations were eliminated; only those with clear physical locations were retained. Finally, a total of 89,167 probes located on 21 chromosomes of three subgenomes of wheat were used to genotype the three materials.
The average probe density on each chromosome is indicated in Figure 2. Two types of poly high-resolution probes were used for SNP analysis of A303, B303, and Wan7107. The first type includes all genotypes of the recurrent parent Wan7107, with 89,167 probes (Table 1). The second type eliminates all heterozygous genotypes of Wan7107 from the first class, with a total of 87,296 probes (Table 2).

2.3. Field Experimental Design and Investigation of Agronomic Characters

A303, B303, and Wan7107 were planted at the experimental station from March to June in 2019 in ICS, CAAS, Beijing, China. Three randomized block repeats were designed. Each material was planted in three rows with 30 seeds in each row that were sown evenly, at a row spacing of 30 cm. At maturity, ten plants per material were randomly collected to investigate the plant height, ear length, ear number, number of spikelets, number of grains per ear, number of sterile spikelets, and thousand grain weight.
Three BC2F3 and BC2F4 populations derived from a cross of Pm97033/Wan7107 × 3 were planted in a greenhouse from October 2018 to February 2019, at ICS, CAAS, in Beijing to evaluate the agronomic traits. In this experiment, the PM resistance in three populations was still in segregation. Plants in each population were divided into two types: resistant and susceptible. The resistant type is considered to contain the translocation chromosomes, while the susceptible type is not. Both types of plants were derived from a backcrossing population, they have similar background except for the alien chromosome arm, so it can be compared for the agronomic traits associated with the alien chromosome arm. Each plant was investigated for plant height, ear length, ear number, number of spikelets, number of grains per ear, ear number, number of sterile spikelets, sterile floret number, and grain weight during harvest. Comparisons of agronomic characters were conducted between the resistant and the susceptible plants.

2.4. Statistical Analysis

IBM SPSS version 20.0.0 software was used to conduct t-tests. Graphs and tables were generated in R Studio (version 3.6.0, Boston, MA, USA) and Microsoft Excel (2019, Redmond, DC, USA).

2.5. Evaluation of PM Resistance of the Translocation Lines and Wheat Wan7107

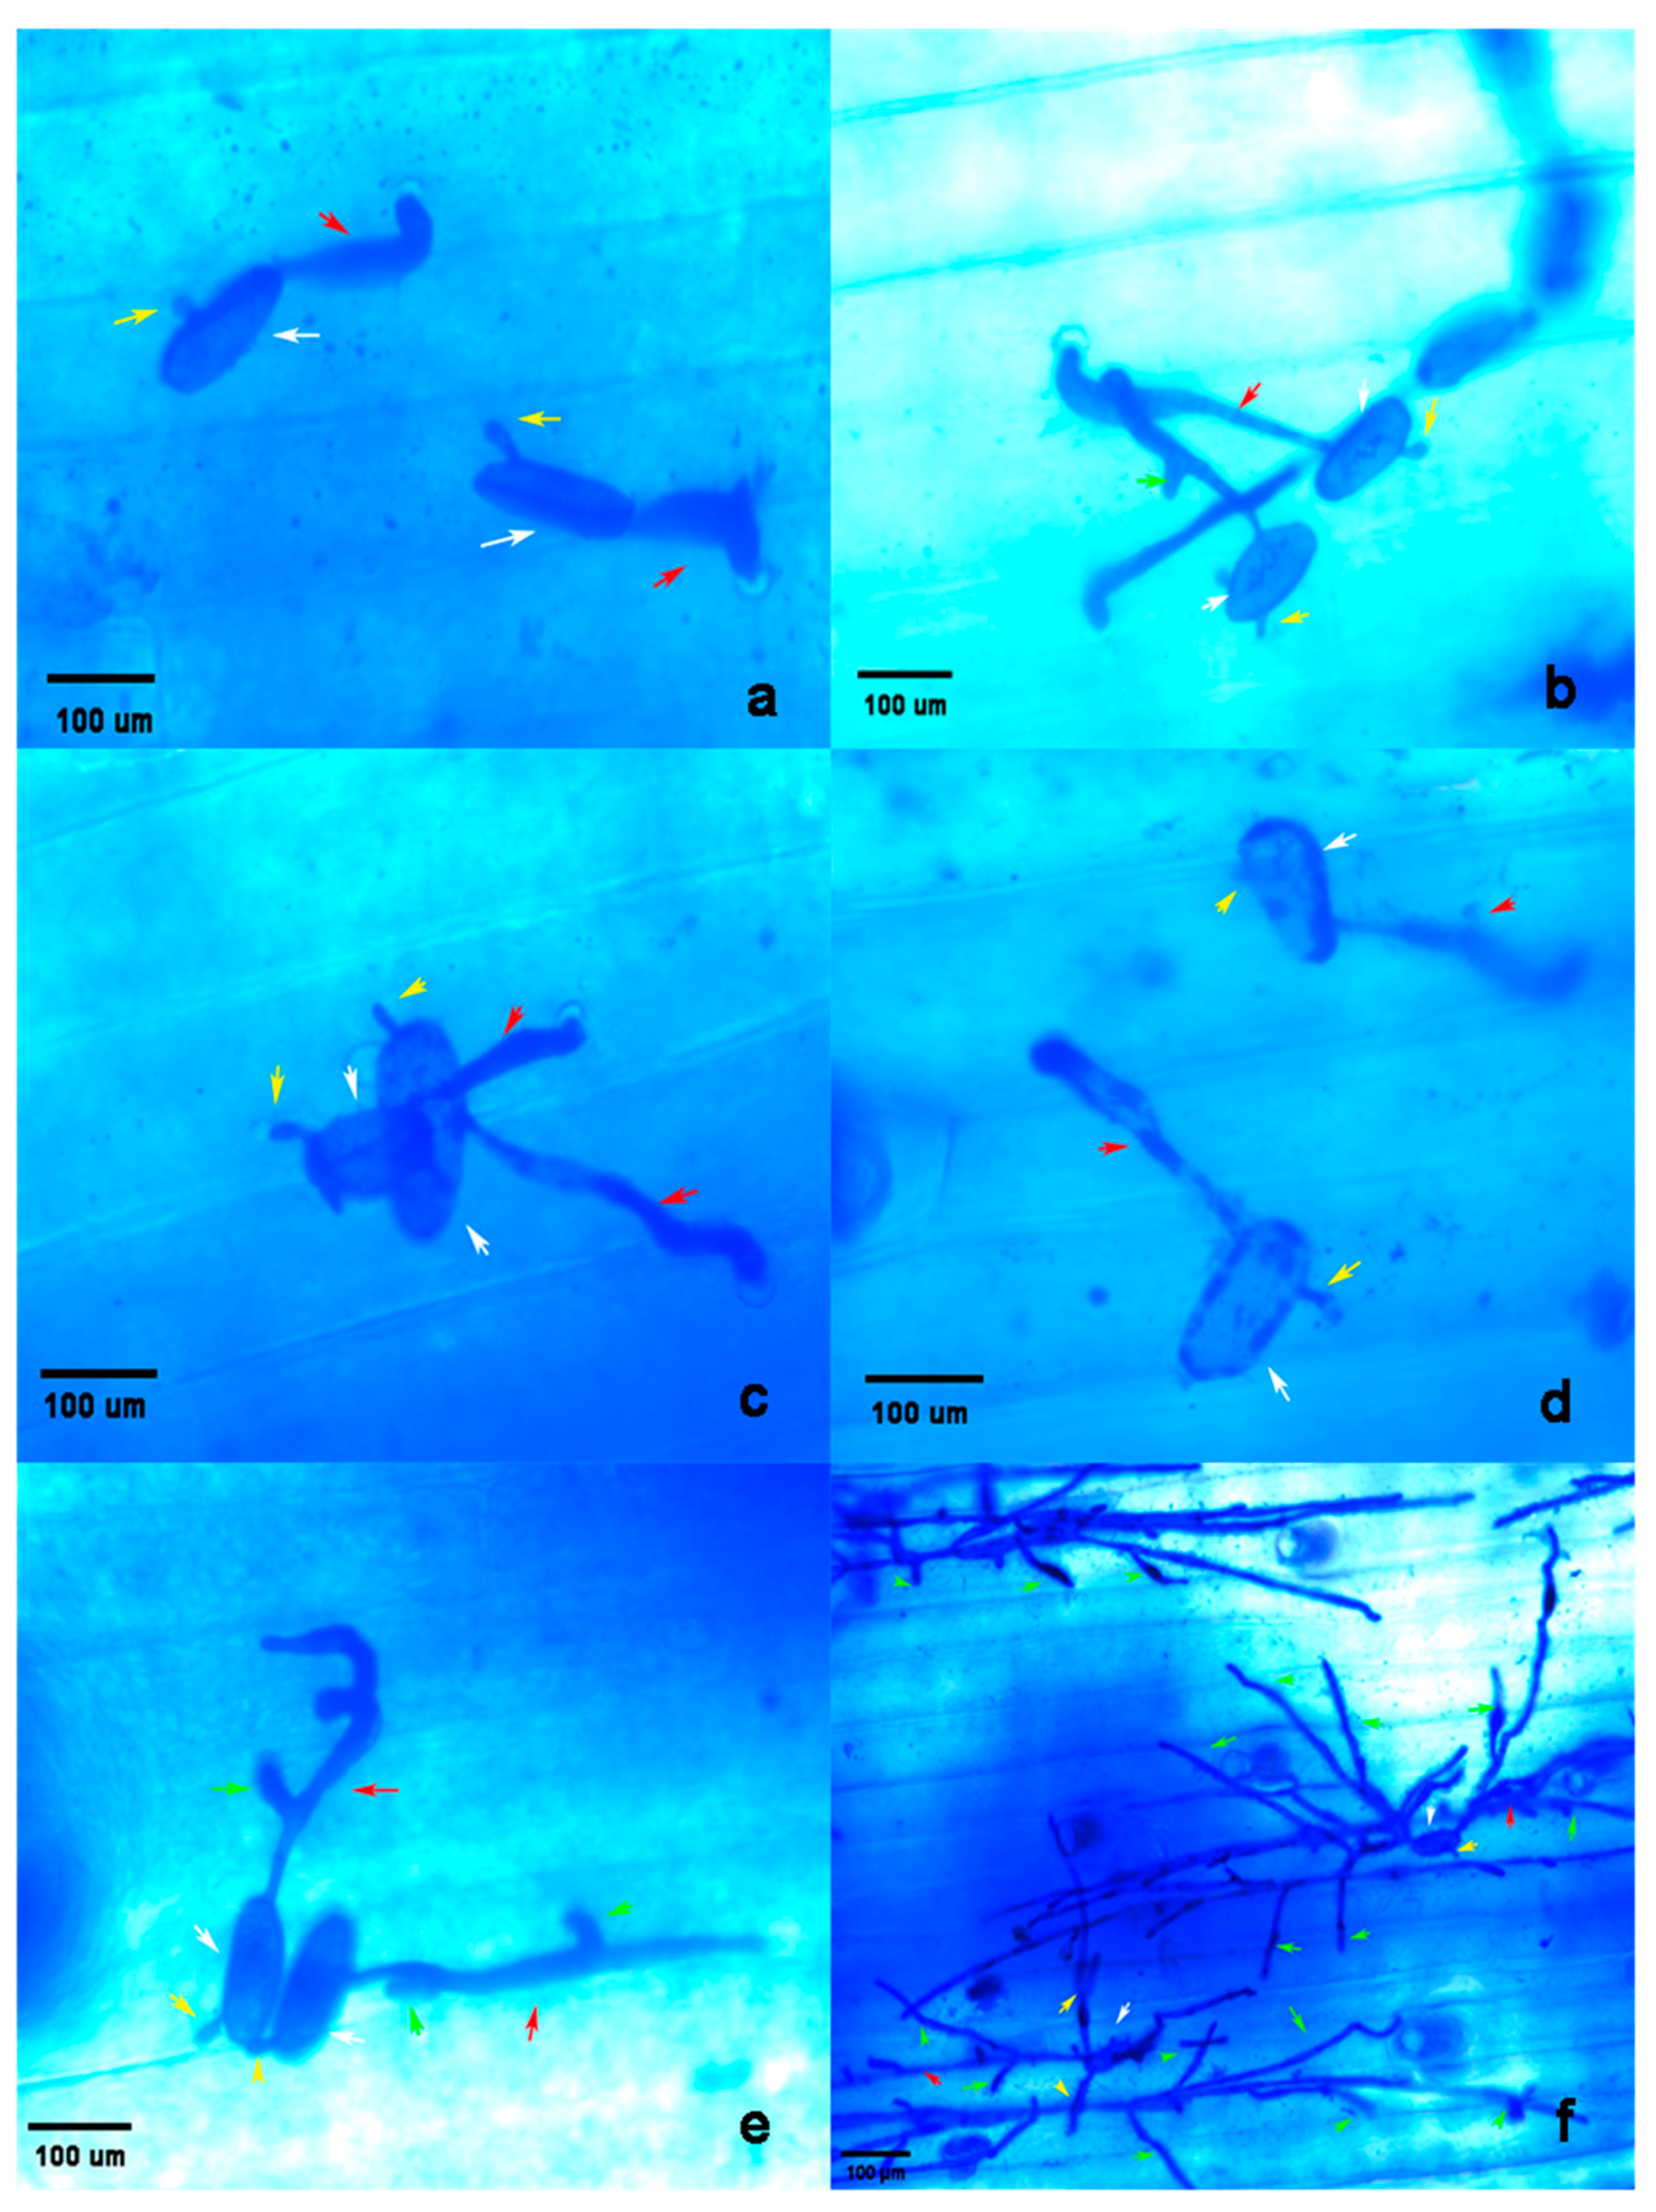
2.5.1. Development of Conidia of Bgt on Plant Leaves

To compare the PM resistance between the translocation lines and Wan7107, spores of Blumeria graminis f. sp. tritici (Bgt) were inoculated on leaves of three materials according to the method described by Li et al. [48]. The Coomassie brilliant blue staining method was used to stain the wheat leaf segments harvested at 25 h and 72 h after inoculation. First, the leaf segments were put into fixative solution (ethanol: glacial acetic acid = 1:1) for 24 h. Then, the leaves were removed, washed with tap water, and put in decolorizing solution (lactic acid: glycerin: water = 1:1:1) for 48 h. The decolorizing solution was replaced every 24 h to make the leaf segments appear transparent and ensure complete decolorization. Then, leaves were dyed with 0.6% Coomassie Brilliant Blue R250 staining solution for 5 min and then rinsed with tap water. Finally, the leaf segments were stored in a preservation solution (glacial acetic acid: glycerol: water = 1:4:15). The development of conidia on the dyed wheat leaf segments was observed under an optical microscope. The experiment was repeated three times.

2.5.2. Reaction to Different Isolates of the Pathogen

To know whether there are differences in the resistance between two translocations, the PM susceptible wheat variety “Chancellor”, which does not contain any PM resistance genes, was seeded in a 10 cm diameter flowerpot to propagate the pathogen strains. Two tested translocation lines were seeded in a plastic box of 36 cm × 25 cm × 10 cm, and about 10 seeds were sown for each line with susceptible material “Funo” and resistant material “Nannong9918” as controls; Nannong9918 is a wheat variety carrying the 6V#2S.6AL translocation chromosome. Its pedigree is Yangmai158/92R137(6V#S.6AL)//Yangmai158, bred by Nanjing Agricultural University. In order to prevent wheat seedlings from being infected with other mixed pathogen isolates, transparent plastic bags covered with an iron wire frame were used to form a closed space, and they were cultured in a greenhouse about 20 °C for 8–10 days. When the wheat grew to the one-leaf stage, fresh spores of the pathogen were inoculated evenly on the wheat seedlings using the shaking method. In total, 24 different isolates of the pathogen were used. Each isolate of Bgt was inoculated into each tested line, and plants were cultivated in a greenhouse for 10–12 days to investigate the disease symptoms.
The resistance level was graded according to Si Quanmin with “0–4” level [65]. “0” represents immune type, no disease spots seen by eyes; “0;”represents hypersensitive type, with white or yellow brown necrotic spots on the leaves, some with sparse short hyphae around the spots; Grade “1”: disease-resistant type, the hyphae on the surface of the lesion were thin with few conidia; Grade “2”: moderately resistant, with moderate hyphae and few conidia, lesions few or small, severity below 5%, and some with a chlorotic halo; Grade “3”: moderately susceptible, the hyphae on the surface of the lesion developed moderately to vigorously, with more spots and more conidia, but the lesions were not connected; Grade “4”: susceptible type, the hyphae on the surface of the disease spot were extensive, a large amount of spores was produced, and the lesions were mostly connected. Types 0–2 were non-pathogenic isolates and wheat varieties (or lines) were resistant; types 3–4 were virulent isolates, and wheat varieties (or lines) were susceptible.

3. Results

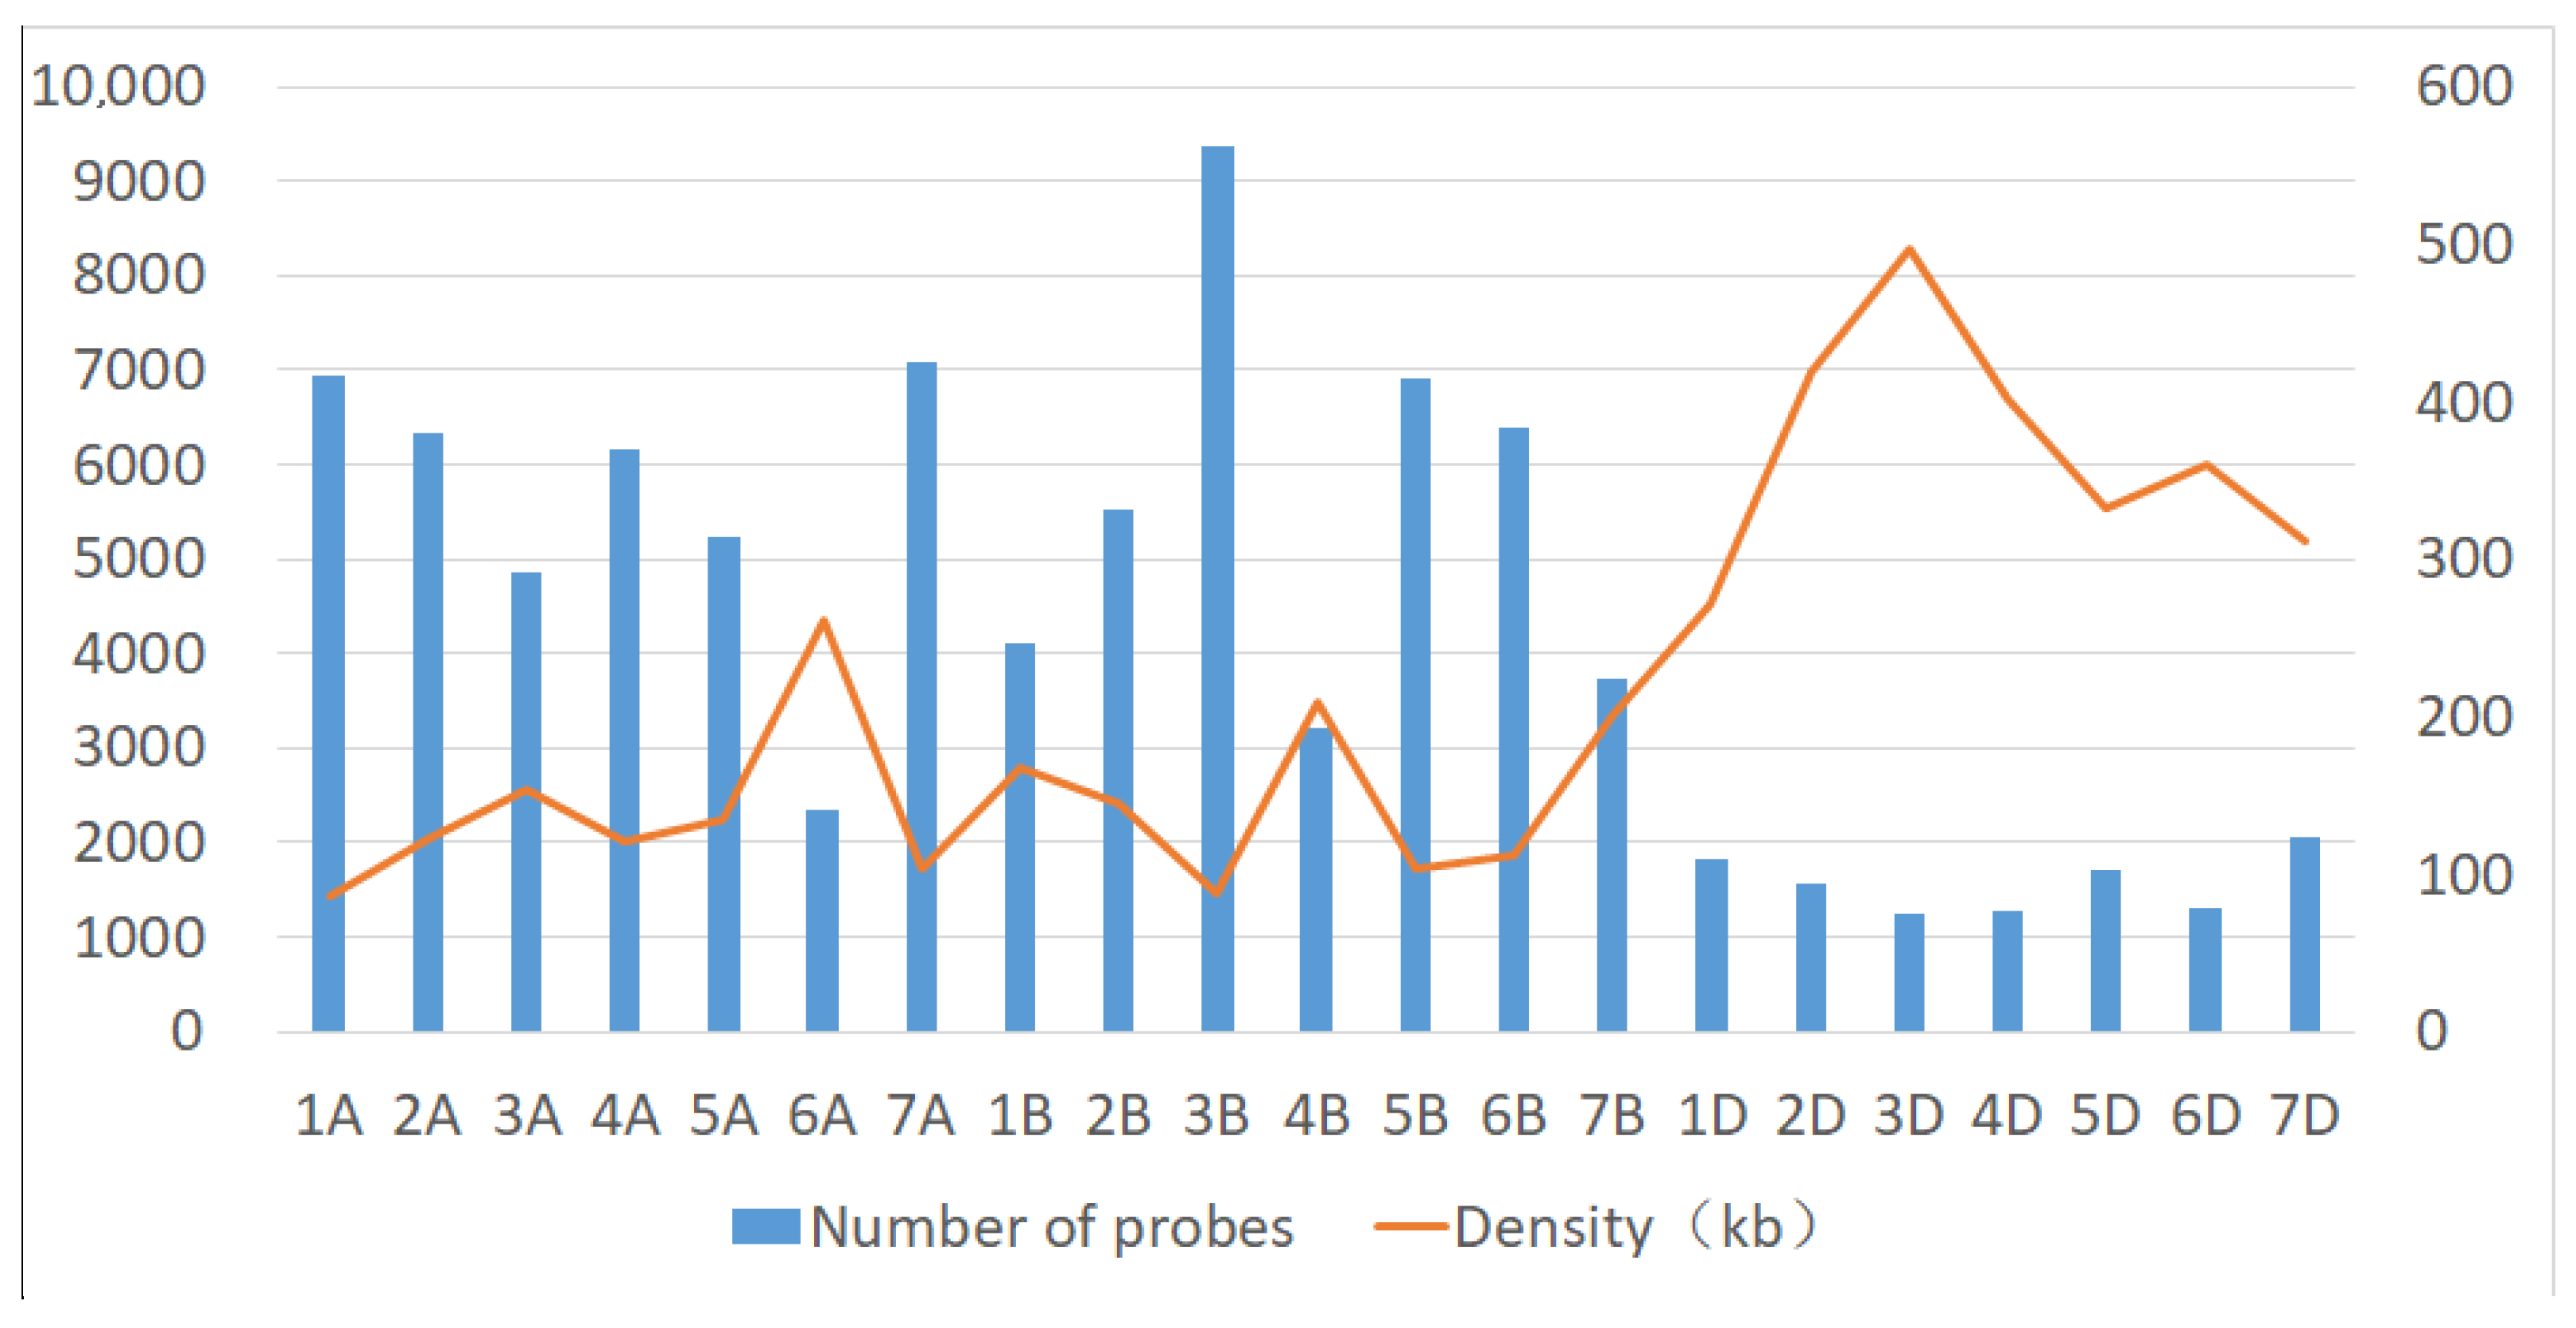
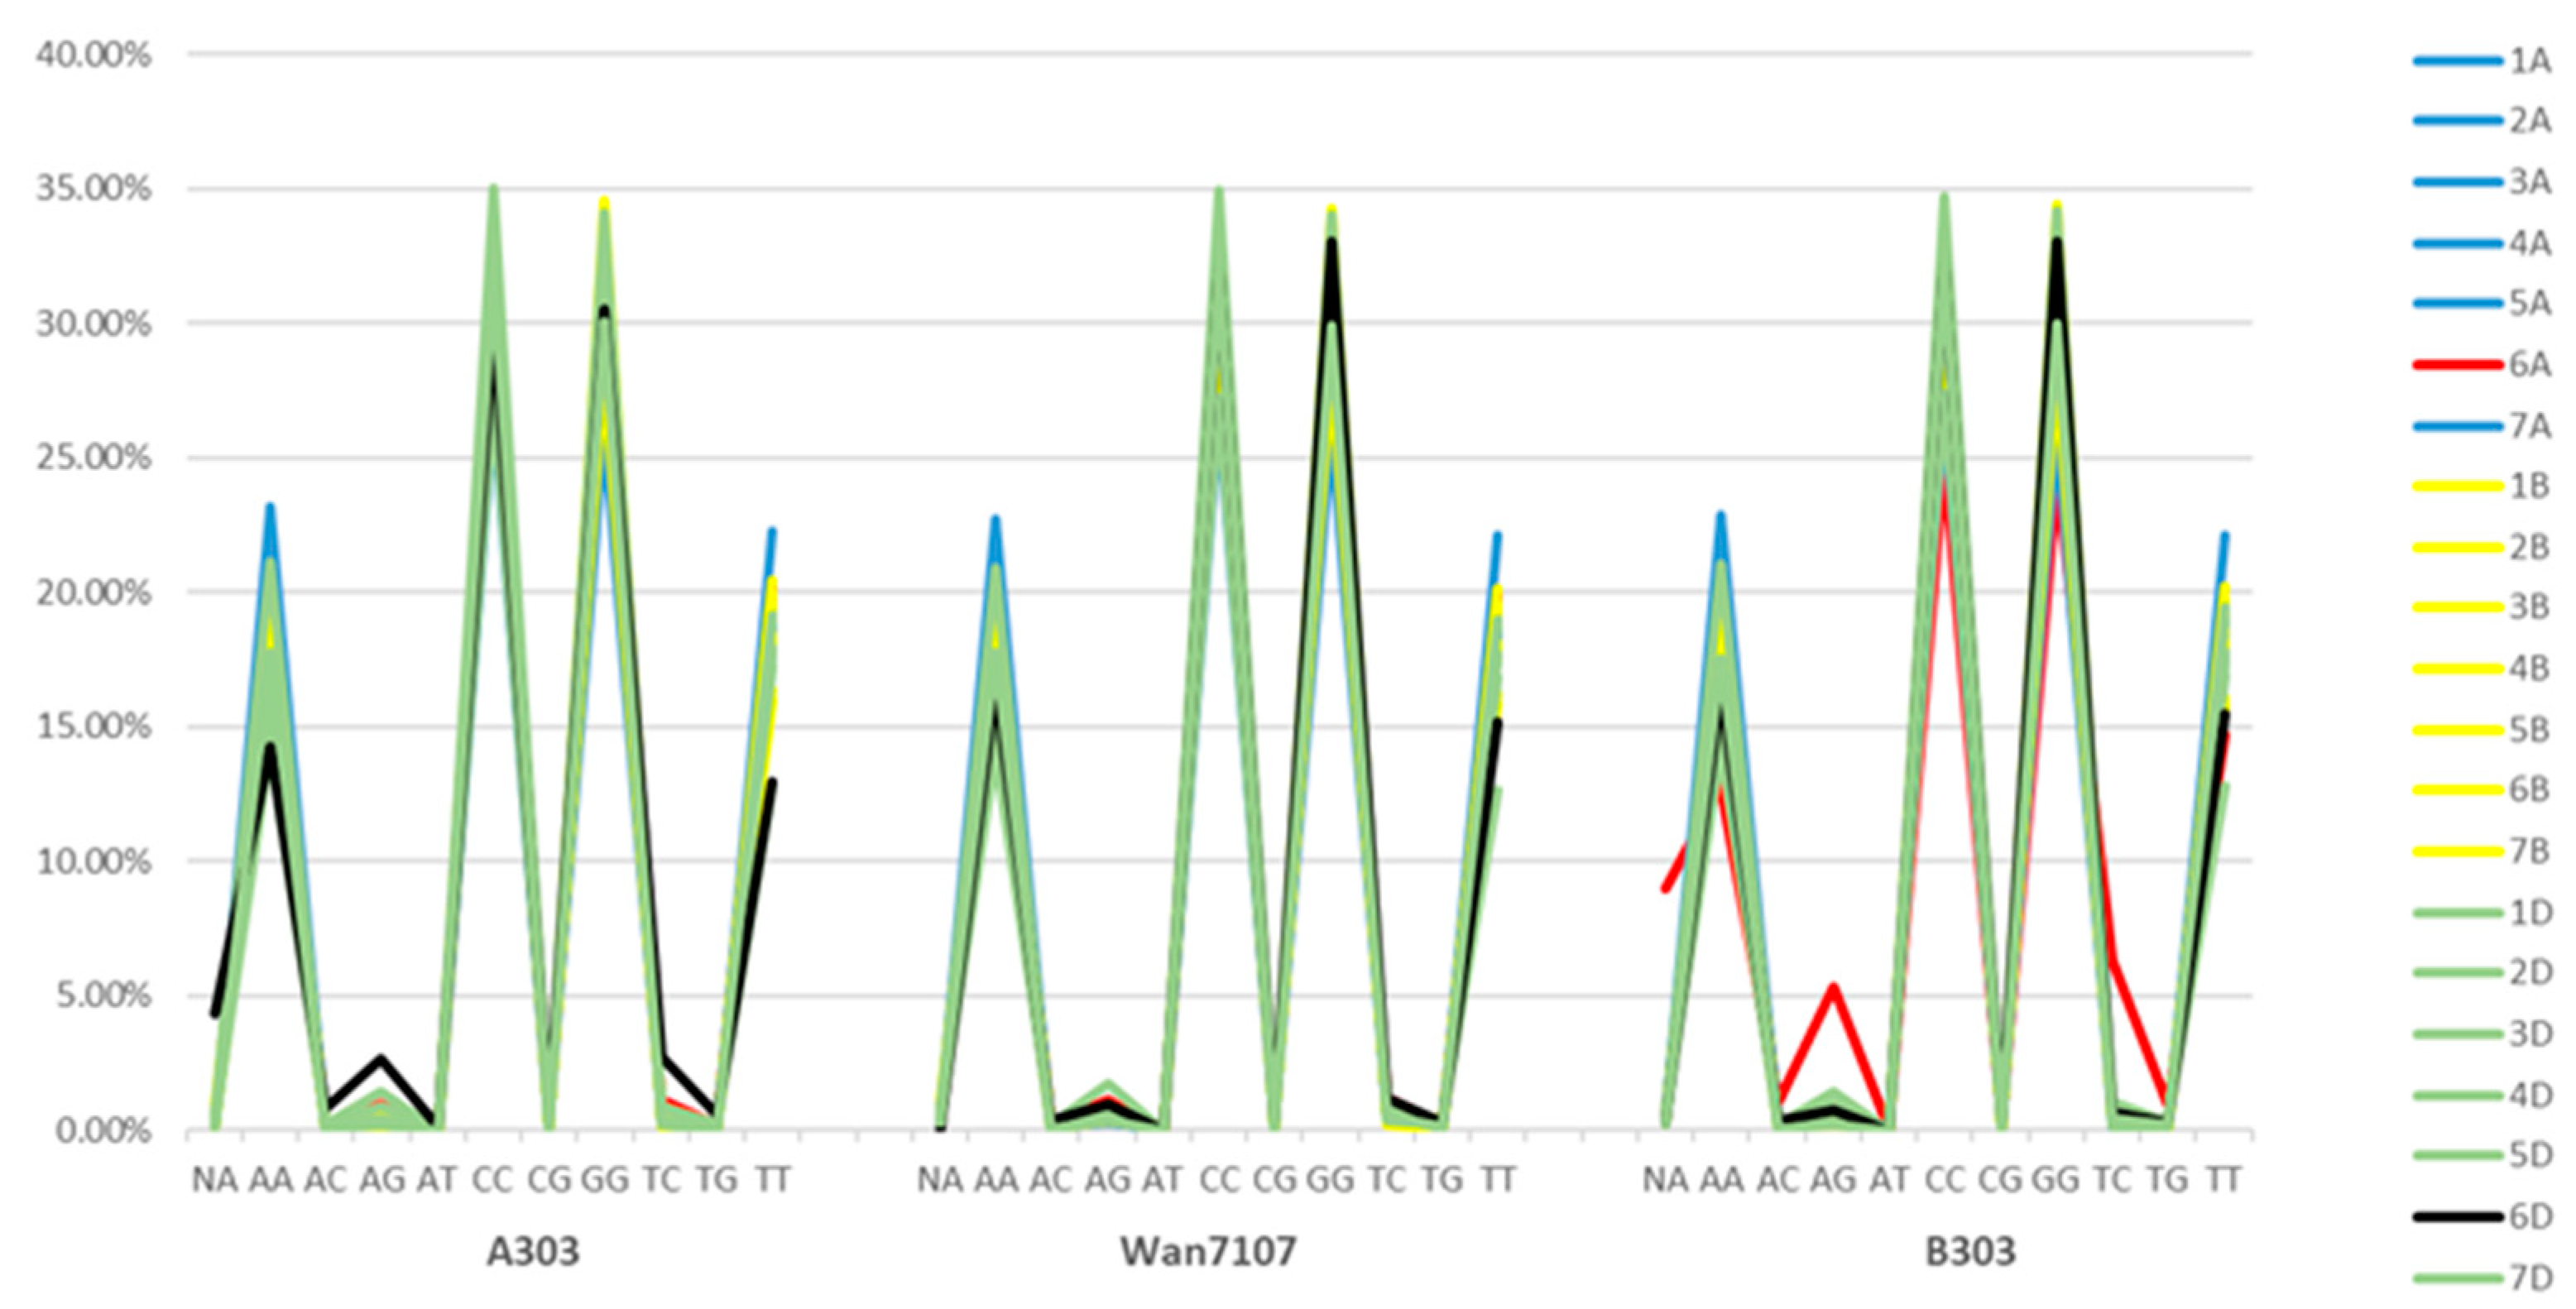
3.1. Characteristics of Base Composition in the Subgenome by Genotyping the Three Lines

The genotyping results obtained using 89,167 probes showed that the homozygous sites in the genome of Wan7107 occupied 97.69% of the total probes, among which CC, GG, AA, and TT genotypes accounted for 30.92%, 30.56%, 18.10%, and 18.11%, respectively. The number of invalid probes on chromosome 2B was the largest in the genome (Table 1).
The proportion of homozygous and heterozygous loci and their distribution in the genomes of 6V#4S.6DL translocation line A303 was very similar to that of Wan7107, with 97.89% of the homozygous loci (Table S1). However, chromosome 6D is an exception: its proportion of invalid probes was the highest of all chromosomes; homozygous genotypes decreased; the proportion of its AA genotype was the lowest, and its TT genotype was the second lowest of all chromosomes. On the contrary, the proportion of its heterozygous genotypes increased. The percentages of each of its heterozygous genotypes were all the highest among 21 chromosomes. Chromosome 2B still retained a higher proportion of invalid probes such as Wan7107.
The percentage of homozygous and heterozygous genotypes in the 6V#2S.6AL translocation line B303 and its distribution characteristics in the genome were also very similar to that of Wan7107. The average homozygous genotypes of AA, TT, CC, and GG were 17.85%, 17.92%, 30.77%, and 30.43%, respectively, and the total homozygous sites accounted for 96.97% of all genotypes. The significant difference came from chromosome 6A, and the proportion of its invalid probes was the highest of all chromosomes. The proportions of its four homozygous genotypes were the lowest of all chromosomes, while the proportion of its heterozygous genotypes had a coincident increase (Table S2). Genotypes AC, AG, TC, and TG, but not AT and CG in 6A, were the highest of all chromosomes. Figure 3 shows the genotyping proportion of the 21 chromosomes in Wan7107 and the two translocation lines by 660k chip. Although the overall base composition characteristics of the three lines are very similar, there are significant differences among the chromosomes in homologous group 6, especially with chromosomes 6D and 6A.

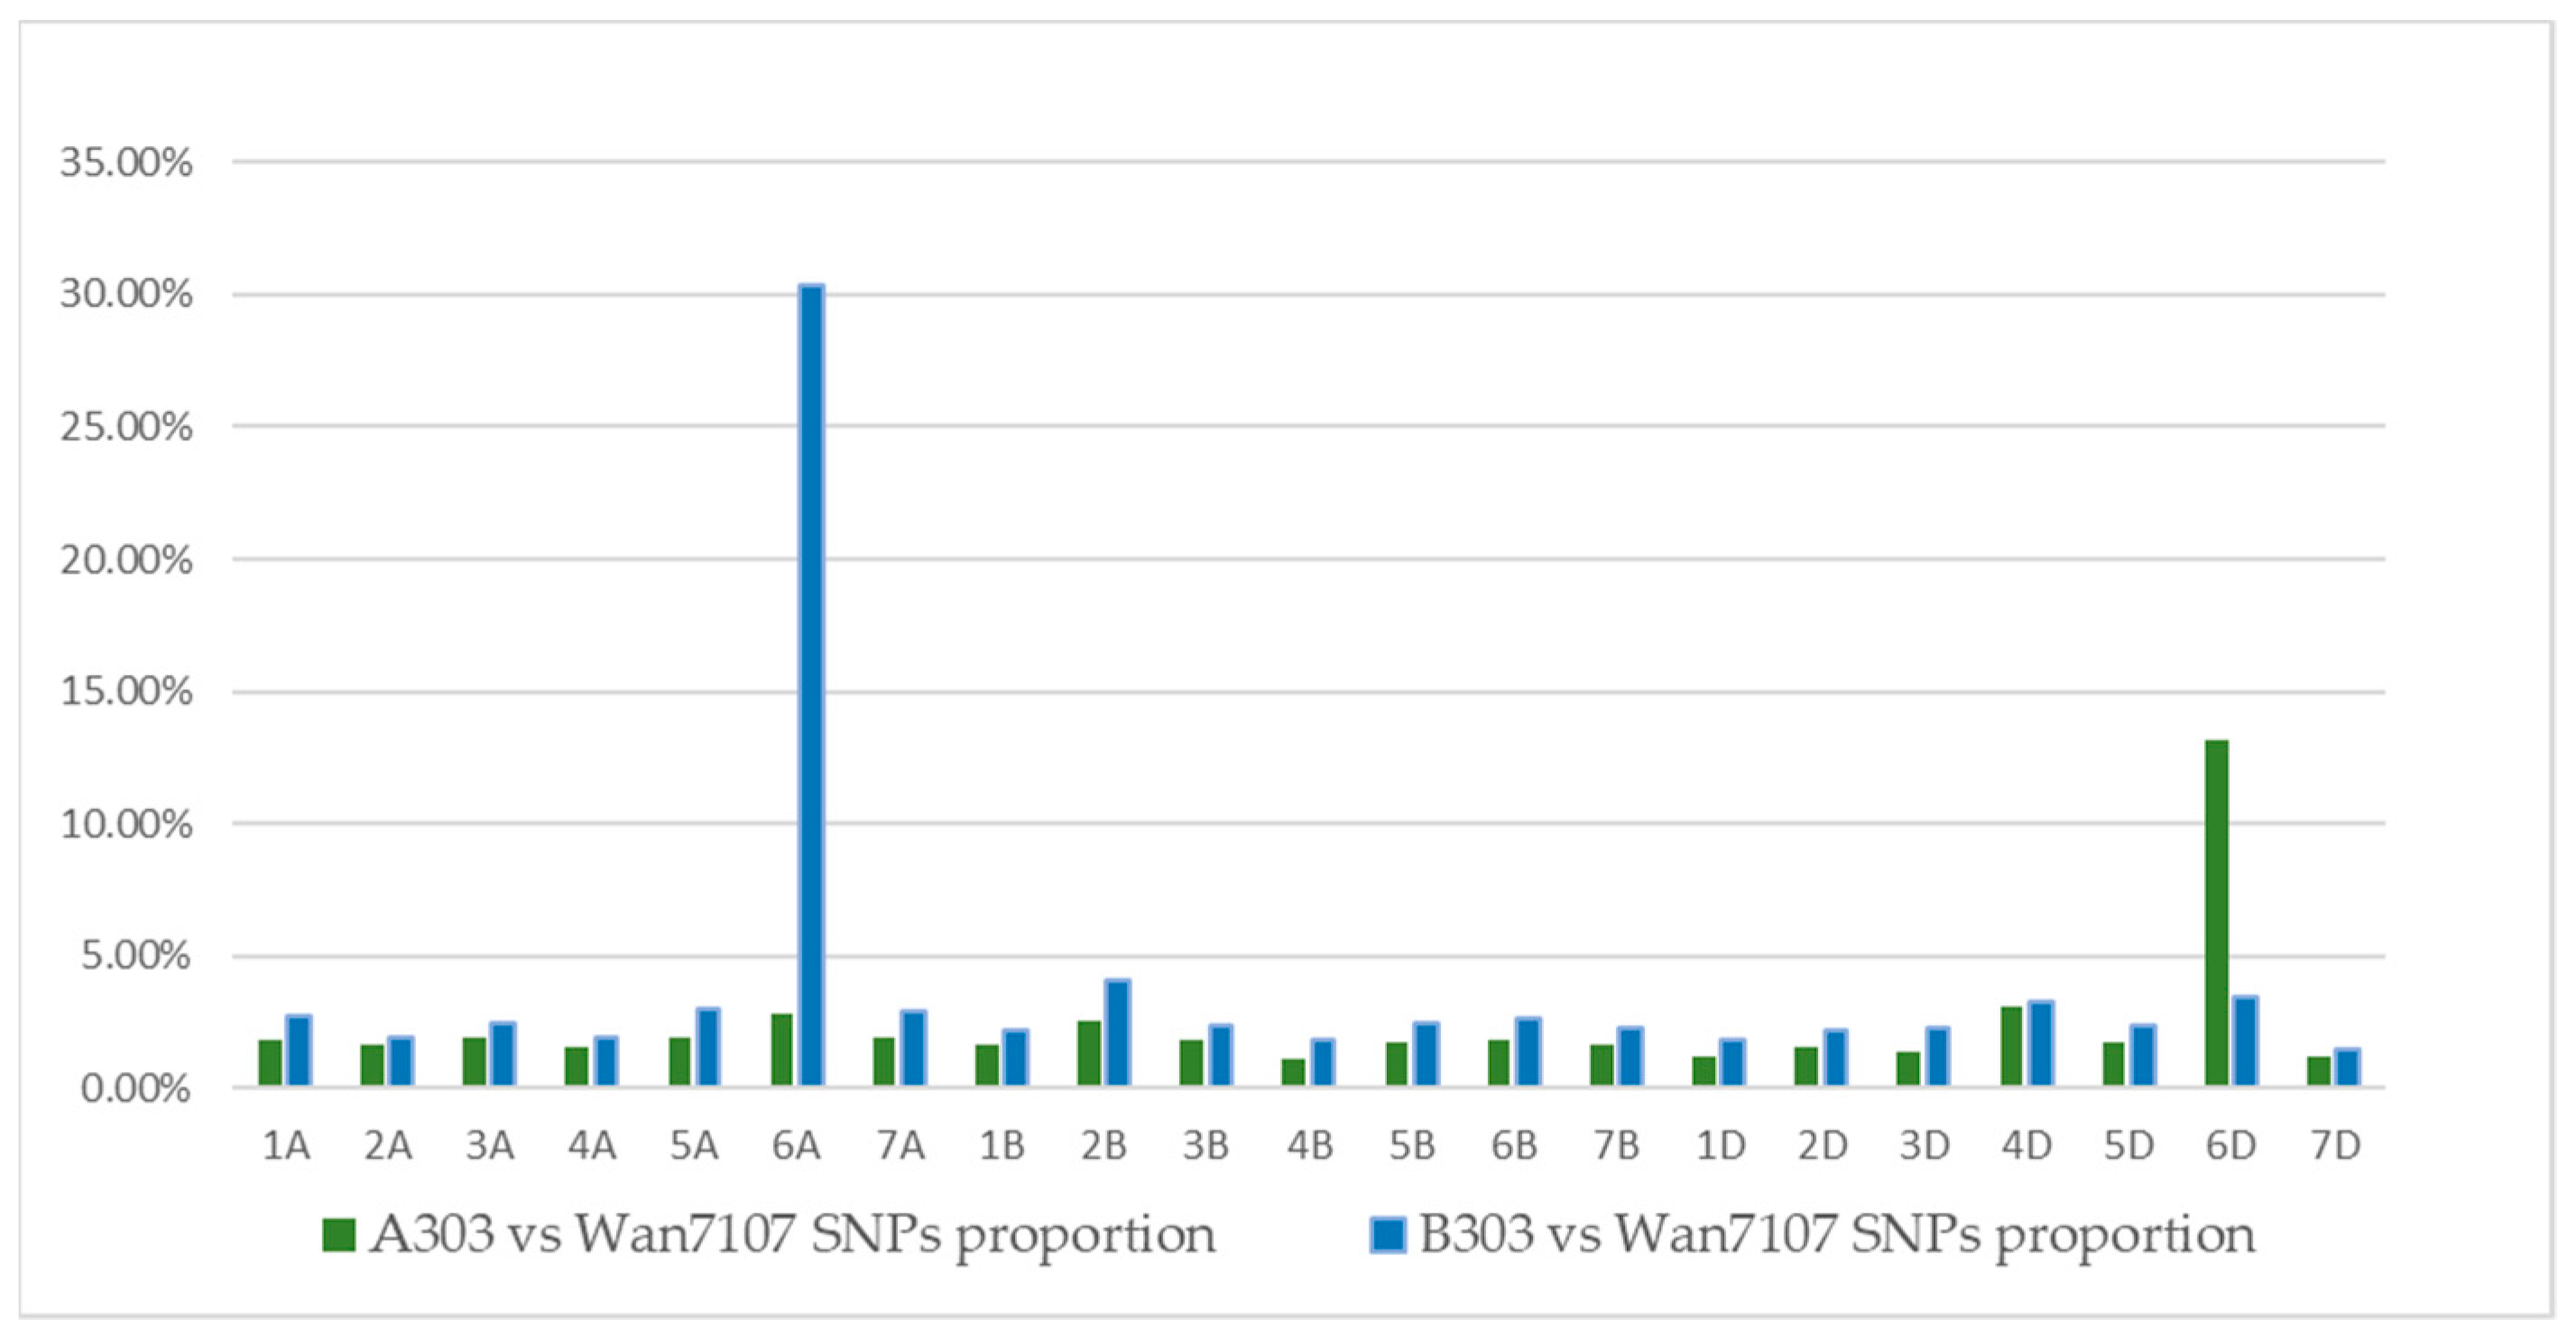
3.2. Snps between Wheat Wan7107 and Translocation Lines

To compare the differences between the two translocation lines A303 and B303 with Wan7107, an SNP analysis was carried out. The numbers, densities, and proportion of the SNP probes to the total number of the probes per chromosome are listed in Table S3. The number of the SNPs in the D genome is the lowest, and the probe density is the rarest (Figure 2). However, the total number of probes in each chromosome of the D genome is the lowest, so the proportion of SNPs in the D genome is similar to that in the A and B genomes. When comparing A303 to Wan7107, chromosome 6D is an exception because it contains many more SNPs than other chromosomes: the number of the SNP probes accounts for 13.2% of all probes on this chromosome, which is the highest of all chromosomes in the genome. In contrast, when comparing B303 to Wan7107, the SNPs of chromosome 6A made up 30.35% of the total probes, which was the highest of all chromosomes in the genome (Figure 4).

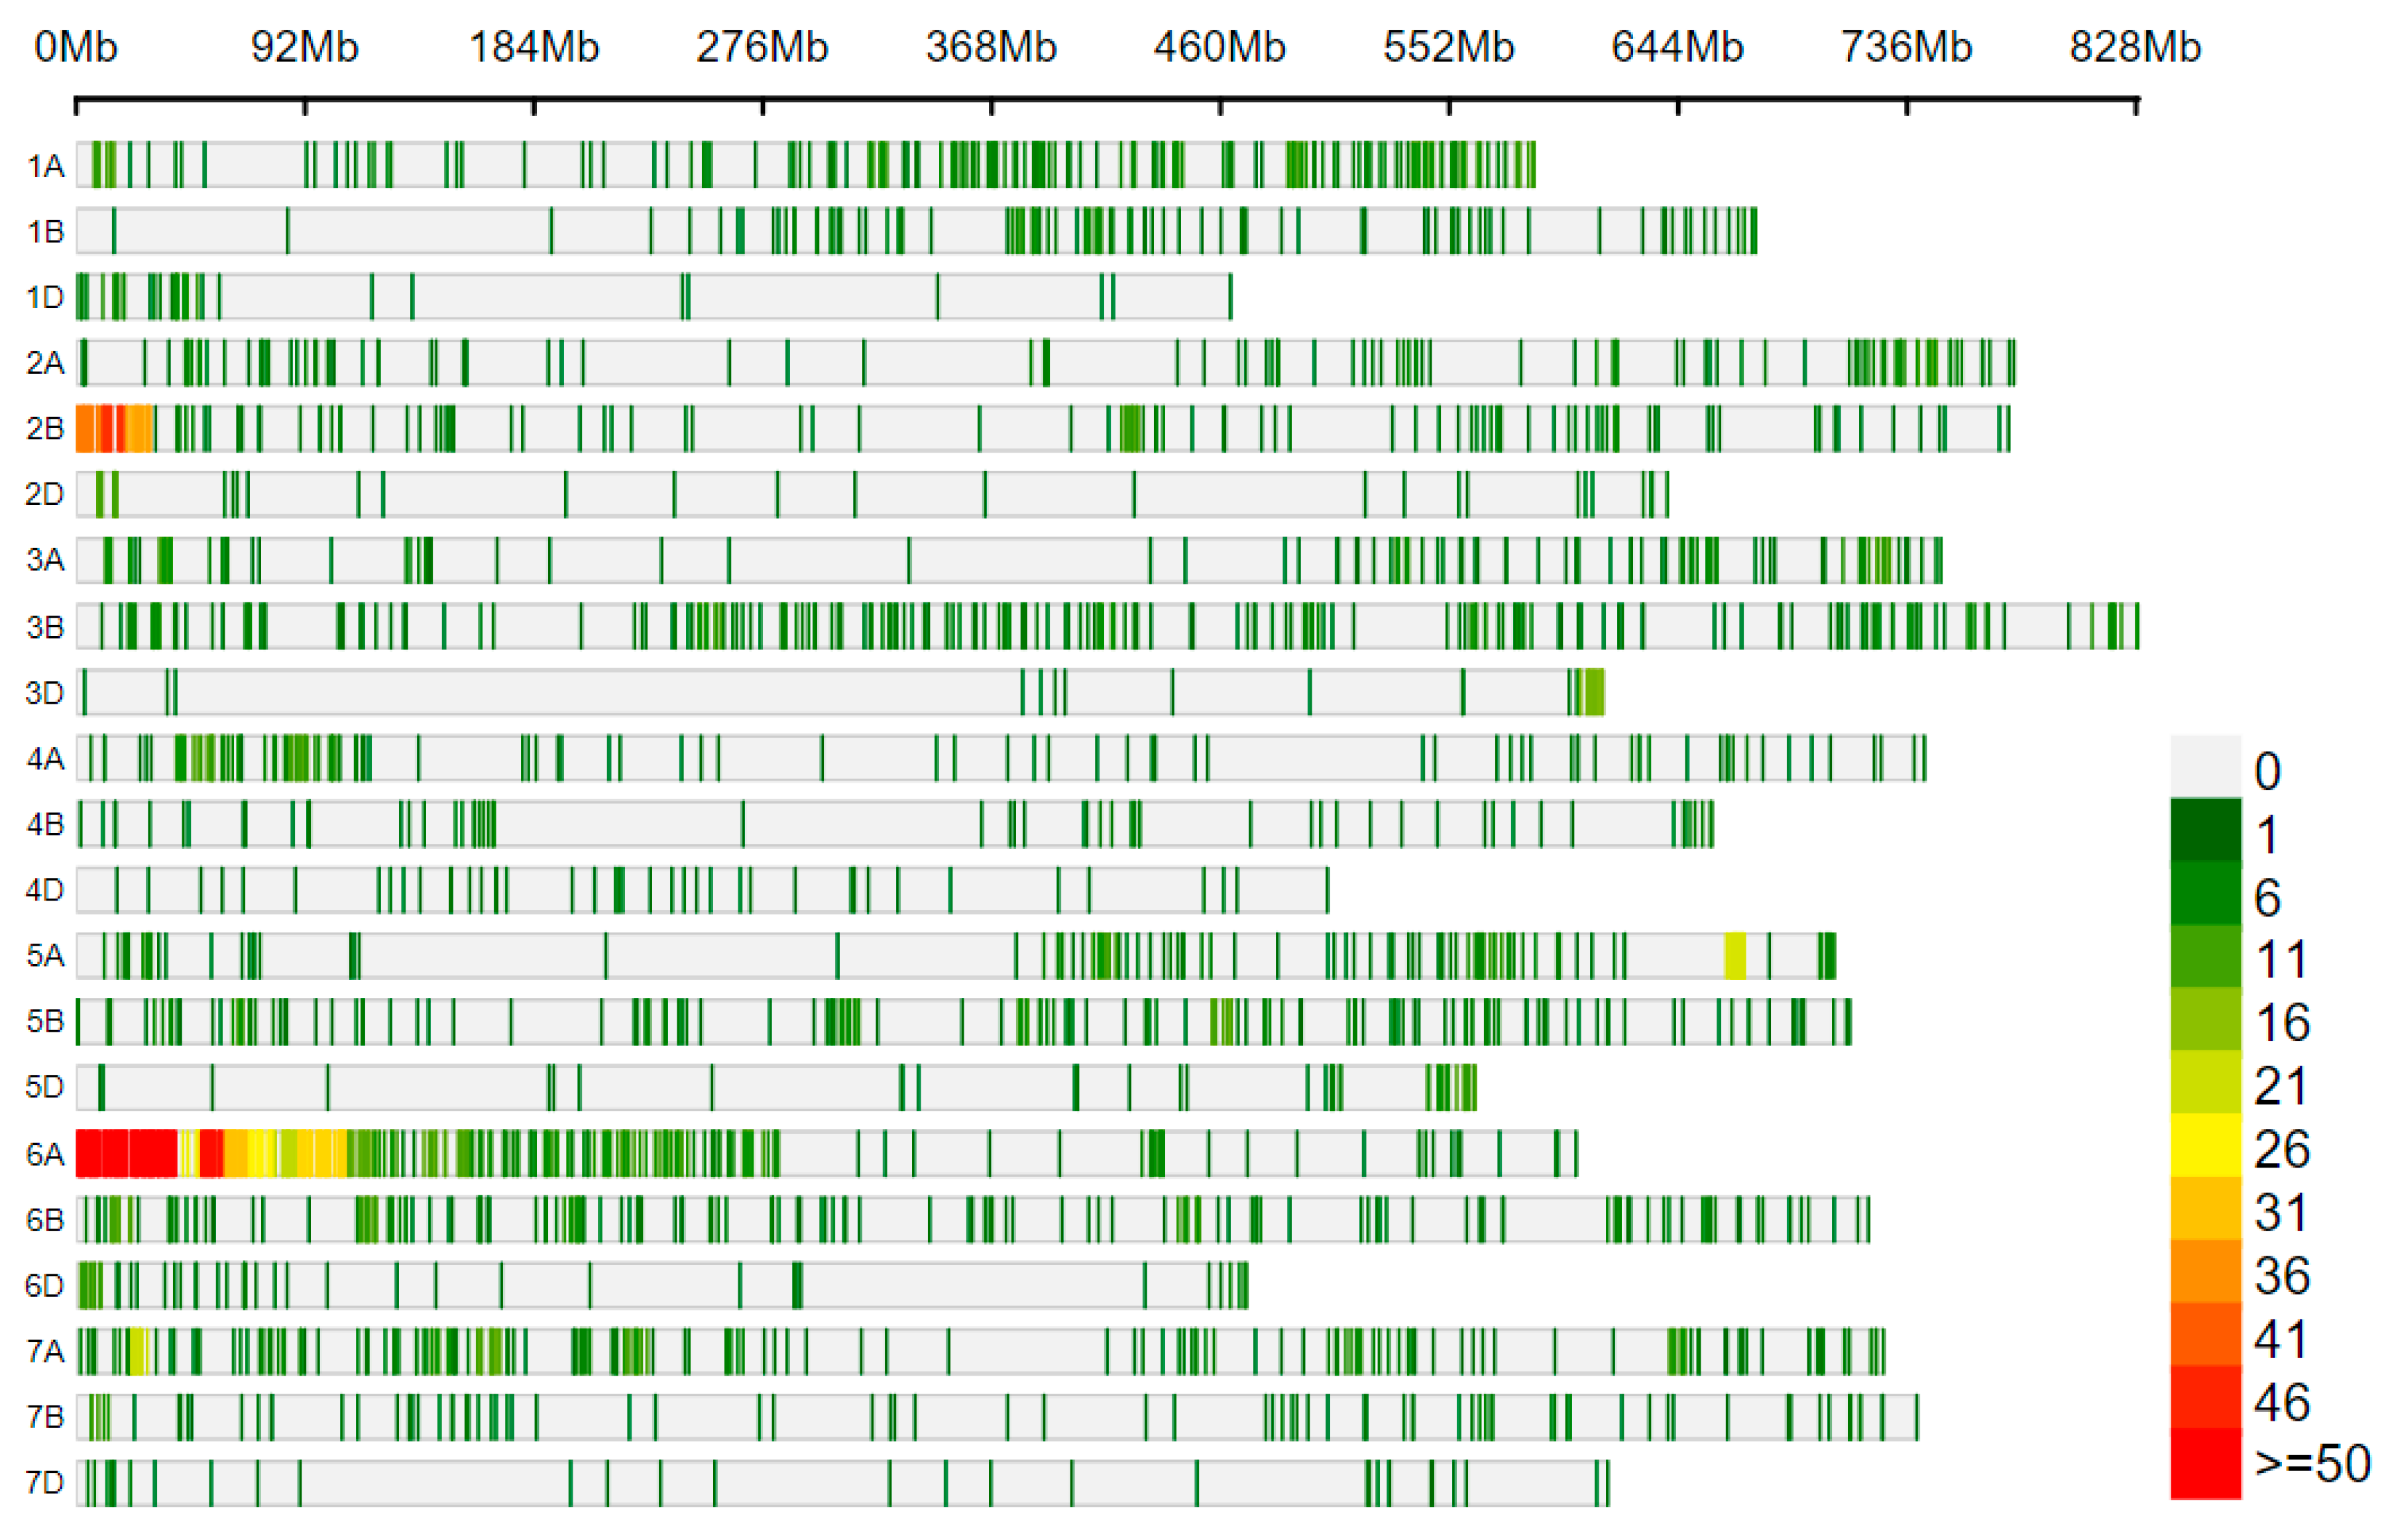
3.3. Distribution of SNPs on Chromosomes between Wan7107 and Translocation Lines

The distribution of SNPs between A303 and Wan7107 in each chromosome arm showed that the average SNP distance on chromosome 6D was about 2715.639 kb, in which 168 of 174 polymorphic probes were dense in the physical interval of 53.099 kb to 211.975 Mb, accounting for 96.55% of the total SNPs. The SNP density in this region reaches 1261.438 kb per probe (Figure 5). There are 716 SNPs between B303 and Wan7107 on chromosome 6A, with an average distance of 841.169 kb. However, 682 SNPs are dense in the physical region of 632.649 kb to 282.152 Mb, accounting for 95.25% of the total SNPs, which makes the SNP density of this interval reach 412.786 kb per probe. The remaining 34 SNPs were distributed in the long arm in the range of 286.037–617.097 Mb, among which there are 13 probes in the region of 431.834–436.981 Mb, with 12 SNPs, which increases the SNP density to 428.904 kb per probe (Figure 6).
In addition to the key chromosomes and their homologous chromosomes in group 6, a SNP dense region (371.362 kb to 26.564 Mb) was observed at the telomere region of 2BS in both translocation lines. There are 135 SNPs in this region of A303, with an average density of 183.355 kb, which is higher than the average density value of chromosome 2B (5722.712 kb). The telomere region of the 2BS chromosome of the 6V#2S.6AL translocation line B303 contained 147 SNPs, with an average density of 178.177 kb, which is much higher than the average density value of chromosome 2B (3576.695 kb). In addition, there are 14 consecutive SNPs on chromosome 2A from 600.423 to 605.534 Mb when comparing A303 to Wan7107; the average density value of SNPs in this region is 365.107 kb. In the comparison of B303 and Wan7107, there are 40 SNPs in the region of 663.328 to 669.909 Mb on chromosome 5A; the SNP density in this region is 164.631 kb. There are 23 SNPs in the region of 20.448 to 26.241 Mb on chromosome 7A; the density of this region is 251.870 kb. Overall, the SNP densities of these regions are significantly higher than the average densities of the chromosomes.
In total, there are 1775 polymorphic loci between A303 and Wan7107, which occupy 1.99% of the total 89,167 probes. There are 2902 polymorphic loci between B303 and Wan7107, which account for 3.25% of 89,167 of the total probes. All of them are higher than expected. Moreover, the SNPs between B303 and Wan7107 are higher than those between A303 and Wan7107, which is not consistent with the theoretical expectation.
Considering that anther culture was applied in the breeding process of Pm97033, this should be a key step to improve homozygosity, leading to decreased SNPs between A303 and Wan7107 compared to those between B303 and Wan7107. Therefore, it is reasonable to speculate that the higher heterozygous sites of Wan7107 itself are the main reason for the actual SNP value between the two translocation lines and Wan7107 being higher than expected. In order to confirm this speculation, we filtered out all the heterozygous genotypes of Wan7107 and used only the homozygous sites for SNP analysis. The results showed that the probes of SNP between A303 and Wan7107, and that between B303 and Wan7107 account for 1.06% and 2.44% of the total probes, respectively (Table 2). When the SNPs of chromosome 6D in A303 and chromosome 6A in B303 were excluded, the average SNP probes of other chromosomes accounted for 0.56% and 1.19% of the total probes, respectively, which is very close to the expected value. It means that A303 and Wan7107 had 99.44% identical genotypes, except for the 6D chromosome; B303 and Wan 7107 had 98.81% identical genotypes, except for the 6A chromosome.

3.4. Differences in Powdery Mildew Resistance between Two Translocation Lines

Translocation lines A303 and B303 were evaluated for reaction to PM pathogen compare to Wan7107. No secondary hyphae were observed in the primary germ tube and appressorium at 25 h after inoculation (Figure 7), which indicated that the development of conidia on leaves of the translocation lines was largely limited, and it failed to infection in the translocation lines. However, it developed very fast and produced secondary hyphae at 25 h and many conidiophores at 72 h in the check line Wan7107 (Figure 7).
To compare differences in disease resistance between the translocation lines, 24 strains of the pathogen were separately inoculated on seedlings of the translocation lines. The results (Table 3) showed that both translocation lines were immune (Grade “0”) or hypersensitive (Grade “0;”) to most of the strains except E15 and E20, to which both translocation lines showed different grades of resistance, i.e., A303 reaction to E15 was “0;“and B303 was “2 + 0;”, the reaction of A303 to E20 was grade “1“ and B303 was grade”0;”. At the same time, the susceptible control variety “Funo” showed severe disease symptoms (Grade “3” or Grade “4”), while resistance control variety “Nannong9918” with the Pm21 resistance gene under a different background showed immunity or hypersensitivity to all strains (Table 3).

3.5. Effects of Different Chromosome Translocations on Agronomic Traits

In order to understand the effects of different exogenous chromosome arm translocations on agronomic traits under the same background, the main agronomic traits of A303, B303, and Wan7107 were investigated and compared. As shown in Table 4, when 6AS or 6DS were substituted by the alien chromosome arm, it resulted in significantly increased plant height and grain weight in both translocation lines. Compared with Wan7107, the thousand-grain weights of the two lines of B303 were 5.29 and 6.78 higher, accounting for 15.66% and 20.07%, respectively (Figure 8), while A303 increased by 17.44%. Plant height also increased significantly, and the two lines of B303 increased by 5.47% and 4.93%, while A303 had an increase of 9.71%. The ear length in A303 increased but the spikelet number and grain number per spike did not change, and its number of ears decreased slightly. Compared with the control, the number of spikelets in B303 was significantly lower, suggesting that 6V#2S replacement of 6AS might have a negative effect on spikelet number.
To evaluate the effects of the translocations on agronomic traits under PM, the main agronomic traits of three BC2F3 and BC2F4 populations derived from a cross of Pm97033/Wan7107 × 3 planted in a greenhouse were investigated. Plant height, spike length, grain number per spike, floret number, and thousand grain weight of resistant plants were higher than those of susceptible plants, while the numbers of spikelets and sterile floret number in the resistant plants were reduced. However, some traits such as plant height and spike length in two lines of BC2F4 did not show significant differences between the resistant (R) and susceptible (S) plants. Increased sterile floret number in the disease-susceptible plants indicated that the seed setting rate was largely affected by the disease (Table 5). This result is basically consistent with those of the field investigation.

4. Discussion

4.1. Differences in SNP Values between Translocation Lines and Recurrent Parent

In this study, the 6VS chromosome in each translocation line cannot easily pair and exchange with homeologous chromosomes of wheat under the normal wheat background, so the whole alien chromosome arm is maintained as a genetic unit and could be transferred intact to the offspring based on the phenotypic selection of the PM resistance during the backcross, while other wheat chromosomes would be replaced by homologous chromosomes of the recurrent parent generation by generation. Therefore, the 6D probe in A303 and the 6A probe in B303 had more SNPs, mostly reflecting the difference between 6V#4S and 6DS or 6V#2S and 6AS. In some cases, the exogenous chromosome could not be genotyped while the wheat homeologous chromosome could be, invalidating many probes on the translocation chromosomes, indicating high sequence differences between alien chromosomes and wheat homeologous chromosomes.

4.2. SNP Distribution between Translocation Lines and Recurrent Parent

In the comparison of translocation lines and the recurrent parent, the dense regions of SNPs on key chromosomes were interrupted at the physical sites of about 211.975 Mb in 6D and 282.153 Mb in 6A, indicating that the breakpoints of chromosomes 6D and 6A were located at these locations. According to the report by Su et al. [66], the physical positions of the centromeres of 6A and 6D were at 283.3–288.7 Mb and 211.9–217.5 Mb, respectively. The breakpoint of 6DS in A303 is closely connected with the centromere, and that of 6AS in B303 is nearly 1.1 Mb from the centromere.
Based on the results of the chip genotyping, the proportion of invalid probes on chromosome 2B was the highest in the genome of Wan7107. Although the SNPs on chromosome 2B accounted for a small proportion of the total number of probes (Table 1), it is surprising that the SNPs between the translocation and near the distal part of 2BS were denser (Figure 5 and Figure 6). The terminal region is a place where chromosome exchange occurs frequently, and after 7–9 generations of continuous backcrossing, there was still a high number of SNPs at the end of the chromosome, which indicates that in the natural population of Wan7107, the 2B chromosome maintains high heterozygosity. Therefore, despite multiple backcross generations, the high SNP number is still maintained, which is more prominent in the comparison between B303 and Wan7107 (Figure 6). In the A303 translocation line, an anther culture was carried out during the breeding process, and the homozygosity of genotypes was greatly improved. In comparing A303 and Wan7107, the number of SNPs at the end of 2BS is slightly lower (Figure 5). Another hypothesis is that 2BS has a large chromosome structure variation, or it has some homology with the 6VS chromosome, which needs further research.
At the same time, we noticed that the existence of the alien in addition to the increased SNPs in the translocated chromosome itself also increased the SNPs in some other chromosomes. For example, the proportion of SNPs on 6D chromosome of A303 was as high as 11.15%, and the SNPs on 6A also increased to 1.06%. In addition to the expected SNP proportion of 6A chromosome increasing to 27.47%, the SNP proportions of 6D and 5A were significantly higher than those of other chromosomes, which were 2.12% and 1.78%, respectively (Table 2). This may be due to the homologous regions of foreign chromosomes on homoeologous or other wheat chromosomes. Although most of the gene sequences showed collinearity among species, some original homologous genes or sequences in different species might be located on non-homologous chromosomes [48].

4.3. 6VS Association with PM Resistance

For a long time, PM resistance gene(s) on 6VS (including 6V#2S and 6V#4S) were considered the same due to the limitations of molecular markers. In fact, the genes derived from the homologous chromosome arms of the wild species confer broad-spectrum resistance to PM, making them difficult to distinguish from each other by the disease resistance phenotype, because they were in different complex backgrounds. Cao et al. cloned Stpk-V on chromosome 6V#2S and inferred it to be a key member at the Pm21 locus [67]. However, its homologous gene in 6V#4S had different sequences in the promoter region and intron [68]. He et al. [29] and Xing et al. [69] map-based cloned Pm21 from 6V#2S. Bie and He et al. [45] and Li et al. [70] identified PmV from 6V#4S and confirmed that this gene encodes a typical coiled-coil/nucleotide-binding site/leucine-rich repeat (CC-NBS-LRR) protein such as Pm21. In the present study, we found that their reactions to some of the stains of PM pathogen were also different. Here, “Nannong9918” is used as a PM resistance wheat control material. Similar to B303, it carries the pm21 resistance gene, but the resistance phenotypes are different from B303 due to their different genetic backgrounds. As far as we know, this is the first time to prove that the resistance of two 6VS to powdery mildew can be distinguished by race identification.

4.4. 6VS Association with Agronomic Characters

In this study, we found that both translocation lines with the same wheat background not only had excellent PM resistance but also showed some desirable agronomic traits, such as increased grain weight. However, the plant height increased significantly, which is not conducive to lodging resistance. These results were consistent with the findings by Zhao et al. [45], who employed a recombinant inbred line (RIL) population constructed from the cross between T6V#2S·6AL translocation line ‘Yangmai18′ and T6V#4S·6DL translocation line ‘Yangmai22′ to evaluate the effects of the translocation chromosome on main agronomic traits. A303 and B303 also showed differences in some of these traits. For example, the ear length in A303 was significantly increased, but there was no large variation in B303; B303 had fewer spikelets than the control, while A303 did not have a significant change in number of spikelets. Under greenhouse conditions, PM disease occurrence was high when control measures were not taken. The plants with PM resistance genes had high seed setting rate and grain weight while susceptible plants were significantly affected by the disease. Many studies have shown that genes such as TaGW2-6A are related to grain development in 6AS [71,72,73]. The effect of replacing 6AS with 6VS seems to be beneficial to some yield traits but disadvantageous to others, so it needs to be further evaluated in terms of yield.

5. Conclusions

Genotyping analysis of 660k SNP chip revealed that genotype characteristics of the two translocation lines of A303 and B303, and their background wheat parent Wan7107 were similar throughout the genomes except for the translocation chromosomes in A303 and B303. The translocation of 6V#4S and 6V#2S not only increased the proportion of invalid probes and heterozygous sites but also decreased the proportion of homozygous sites in the translocation chromosomes. The SNPs between the translocation lines and Wan7107 were significantly increased and densely distributed in 6DS or 6AS and unexpectedly on the near telomere regions of 2BS. Moreover, A303 and Wan 7107 had 99.43% identical genotypes; B303 and Wan7107 had 98.78% identical genotypes. 6V#4S and 6V#2S have different reactions to some of the strains of Bgt. In addition, some important agronomic traits related to yield were affected by the alien chromosome arms.

Supplementary Materials

The following are available online at https://www.mdpi.com/2073-4395/11/2/399/s1, Table S1: The proportion of homozygous and heterozygous loci and their distribution in the genomes of 6V#4S.6DL translocation line A303, Table S2: The percentage of homozygous and heterozygous genotypes in the 6V#2S.6AL translocation line B303, Table S3: Number and density of SNP probes and their proportion in the total probes on each chromosome.

Author Contributions

Conceptualization, Z.L. and B.W.; formal analysis, B.W. and Z.L.; investigation, X.M. and Y.Z.; writing—original draft, B.W. and Z.L.; writing—review and editing, B.W., Z.L., and X.Y.; funding acquisition, Z.L., X.Y. and Y.M. All authors have read and agreed to the published version of the manuscript.

Funding

This research was financially supported by the National Key Research and Development Program of China (2016YFD0102001 and 2016YFD0102002), and the Agricultural Science and Technology Innovation Program (ASTIP) of Chinese Academy of Agricultural Sciences (2060302-2-20).

Acknowledgments

We would like to express our deep respects to Chen Xiao, and our present research is based on the materials she developed. We are grateful to Yiping Yan at ICS-CAAS for managing wheat plants and assisting with sampling. We also thank Chunkun Fan at Institute of Agriculture, Tibet Academy of Agricultural and Animal Husbandry Sciences, China, for helping to collect wheat samples post PM infection during his master’s degree at ICS-CAAS. And we want thank Huihui Li at ICS-CAAS for the advice of correlation analysis.

Conflicts of Interest

The authors declare no conflict of interest.

Abbreviations

SNPSingle Nucleotide Polymorphism
QTLquantitative trait loci
ENear number
RILrecombinant inbred line
SFNsterile floret number
TGWthousand grain weight
ELear length
SNPSspikelet number per spike
SNspike number
FNfloret number
PHplant height
GNPSgrain number per spike
KASPKompetitive allele-specific PCR
BgtB. graminis f. sp. tritici
PMpowdery mildew
SSRsimple sequence repeat

References

  1. Brenchley, R.; Spannagl, M.; Pfeifer, M.; Barker, G.L.A.; D′Amore, R.; Allen, A.M.; McKenzie, N.; Kramer, M.; Kerhornou, A.; Bolser, D.; et al. Analysis of the bread wheat genome using whole-genome shotgun sequencing. Nature 2012, 491, 705–710. [Google Scholar] [CrossRef] [PubMed] [Green Version]
  2. Godfray, H.C.J.; Beddington, J.R.; Crute, I.R.; Haddad, L.; Lawrence, D.; Muir, J.F.; Pretty, J.; Robinson, S.; Thomas, S.M.; Toulmin, C. Food security: The challenge of feeding 9 billion people. Science 2010, 327, 812–818. [Google Scholar] [CrossRef] [PubMed] [Green Version]
  3. Atkinson, N.J.; Urwin, P.E. The interaction of plant biotic and abiotic stresses: From genes to the field. J. Exp. Bot. 2012, 63, 3523–3543. [Google Scholar] [CrossRef] [PubMed] [Green Version]
  4. Shinozaki, K.; Yamaguchi-Shinozaki, K. Gene networks involved in drought stress response and tolerance. J. Exp. Bot. 2006, 58, 221–227. [Google Scholar] [CrossRef] [PubMed] [Green Version]
  5. Pinto, R.S.; Reynolds, M.P.; Mathews, K.L.; McIntyre, C.L.; Olivares-Villegas, J.-J.; Chapman, S.C. Heat and drought adaptive QTL in a wheat population designed to minimize confounding agronomic effects. Theor. Appl. Genet. 2010, 121, 1001–1021. [Google Scholar] [CrossRef] [PubMed] [Green Version]
  6. Ollier, M.; Talle, V.; Brisset, A.-L.; Le Bihan, Z.; Duerr, S.; Lemmens, M.; Goudemand, E.; Robert, O.; Hilbert, J.-L.; Buerstmayr, H. QTL mapping and successful introgression of the spring wheat-derived QTL Fhb1 for Fusarium head blight resistance in three European triticale populations. Theor. Appl. Genet. 2020, 133, 457–477. [Google Scholar] [CrossRef] [PubMed] [Green Version]
  7. Graybosch, R.A. Mini Review: Uneasy unions: Quality effects of rye chromatin transfers to wheat. J. Cereal Sci. 2001, 33, 3–16. [Google Scholar] [CrossRef]
  8. Devos, K.M.; Atkinson, M.D.; Chinoy, C.N.; Francis, H.A.; Harcourt, R.L.; Koebner, R.M.; Liu, C.J.; Masojć, P.; Xie, D.X.; Gale, M.D. Chromosomal rearrangements in the rye genome relative to that of wheat. Theor. Appl. Genet. 1993, 85, 673–680. [Google Scholar] [CrossRef] [PubMed]
  9. Ren, T.; Li, Z.; Yan, B.; Tan, F.; Tang, Z.; Fu, S.; Yang, M.; Ren, Z. Targeted segment transfer from rye chromosome 2R to wheat chromosomes 2A, 2B, and 7B. Cytogenet. Genome Res. 2017, 151, 50–59. [Google Scholar] [CrossRef] [PubMed]
  10. Chen, P.D.; Qi, L.L.; Zhou, B.; Zhang, S.Z.; Liu, D.J. Development and molecular cytogenetic analysis of wheat-Haynaldia villosa 6VS/6AL translocation lines specifying resistance to powdery mildew. Theor. Appl. Genet. 1995, 91, 1125–1128. [Google Scholar] [CrossRef]
  11. Chhuneja, P.; Kaur, S.; Goel, R.K.; Aghaee-Sarbarzeh, M.; Prashar, M.; Dhaliwal, H.S. Transfer of leaf rust and stripe rust resistance from Aegilops umbellulata Zhuk. to bread wheat (Triticum aestivum L.). Genet. Resour. Crop Evol. 2008, 55, 849–859. [Google Scholar] [CrossRef]
  12. Qi, L.L.; Pumphrey, M.O.; Friebe, B.; Zhang, P.; Qian, C.; Bowden, R.L.; Rouse, M.N.; Jin, Y.; Gill, B.S. A novel Robertsonian translocation event leads to transfer of a stem rust resistance gene (Sr52) effective against race Ug99 from Dasypyrum villosum into bread wheat. Theor. Appl. Genet. 2011, 123, 159–167. [Google Scholar] [CrossRef] [PubMed]
  13. Qi, L.; Cao, M.; Chen, P.; Li, W.; Liu, D. Identification, mapping, and application of polymorphic DNA associated with resistance gene Pm21 of wheat. Genome 1996, 39, 191–197. [Google Scholar] [CrossRef]
  14. Ma, J.; Zhou, R.; Dong, Y.; Wang, L.; Wang, X.; Jia, J. Molecular mapping and detection of the yellow rust resistance gene Yr26 in wheat transferred from Triticum turgidum L. using microsatellite markers. Euphytica 2001, 120, 219–226. [Google Scholar] [CrossRef]
  15. Wang, R.; Wu, J.; Deng, X.; Liu, D.; Yan, Y. Drought-responsive protein identification in developing grains of a wheat–Haynaldia villosa 6VS/6AL translocation line. Crop Pasture Sci. 2019, 69, 1182–1196. [Google Scholar] [CrossRef]
  16. Rani, K.; Raghu, B.R.; Jha, S.K.; Agarwal, P.; Mallick, N.; Niranjana, M.; Sharma, J.B.; Singh, A.K.; Sharma, N.K.; Rajkumar, S.; et al. A novel leaf rust resistance gene introgressed from Aegilops markgrafii maps on chromosome arm 2AS of wheat. Theor. Appl. Genet. 2020, 133, 2685–2694. [Google Scholar] [CrossRef] [PubMed]
  17. Riley, R.; Chapman, V.; Johnson, R.O.Y. Introduction of yellow rust resistance of aegilops comosa into wheat by genetically induced homoeologous recombination. Nature 1968, 217, 383–384. [Google Scholar] [CrossRef]
  18. Schneider, A.; Molnár, I.; Molnár-Láng, M. Utilisation of Aegilops (goatgrass) species to widen the genetic diversity of cultivated wheat. Euphytica 2008, 163, 1–19. [Google Scholar] [CrossRef]
  19. Adonina, I.G.; Salina, E.A.; Pestsova, E.G.; Röder, M.S. Transferability of wheat microsatellites to diploid Aegilops species and determination of chromosomal localizations of microsatellites in the S genome. Genome 2005, 48, 959–970. [Google Scholar] [CrossRef] [PubMed]
  20. Islam, A.K.M.R.; Shepherd, K.W.; Sparrow, D.H.B. Isolation and characterization of euplasmic wheat-barley chromosome addition lines. Heredity 1981, 46, 161–174. [Google Scholar] [CrossRef] [Green Version]
  21. Wang, H.; Sun, S.; Ge, W.; Zhao, L.; Kong, L. Horizontal gene transfer of Fhb7 from fungus underlies Fusarium head blight resistance in wheat. Science 2020, 368, eaba5435. [Google Scholar] [CrossRef]
  22. Riley, R.; Chapman, V. The comparison of wheat-rye and wheat- Aegilops amphidiploids. J. Agric. Sci. 1957, 49, 246–250. [Google Scholar] [CrossRef]
  23. Nemeth, C.; Yang, C.-Y.; Kasprzak, P.; Hubbart, S.; Scholefield, D.; Mehra, S.; Skipper, E.; King, I.; King, J.; Jenkins, G. Generation of amphidiploids from hybrids of wheat and related species from the genera Aegilops, Secale, Thinopyrum, and Triticum as a source of genetic variation for wheat improvement. Genome 2015, 58, 71–79. [Google Scholar] [CrossRef] [PubMed]
  24. Kawahara, T.; Taketa, S.; Murai, K. Differential effects of cultivated and wild barley 5H chromosomes on heading characters in wheat-barley chromosome addition lines. Hereditas 2002, 136, 195–200. [Google Scholar] [CrossRef] [PubMed] [Green Version]
  25. Rawat, N.; Tiwari, V.K.; Neelam, K.; Randhawa, G.S.; Chhuneja, P.; Singh, K.; Dhaliwal, H.S. Development and characterization of Triticum aestivum–Aegilops kotschyi amphiploids with high grain iron and zinc contents. Plant Genet. Resour. 2009, 7, 271–280. [Google Scholar] [CrossRef]
  26. Jiang, J.; Friebe, B.; Gill, B.S. Recent advances in alien gene transfer in wheat. Euphytica 1993, 73, 199–212. [Google Scholar] [CrossRef]
  27. Djanaguiraman, M.; Prasad, P.V.V.; Kumari, J.; Sehgal, S.K.; Friebe, B.; Djalovic, I.; Chen, Y.; Siddique, K.H.M.; Gill, B.S. Alien chromosome segment from Aegilops speltoides and Dasypyrum villosum increases drought tolerance in wheat via profuse and deep root system. BMC Plant Biol. 2019, 19, 242. [Google Scholar] [CrossRef] [Green Version]
  28. Liu, H.; Tang, H.; Ding, P.; Mu, Y.; Habib, A.; Liu, Y.; Jiang, Q.; Chen, G.; Kang, H.; Wei, Y.; et al. Effects of the 1BL/1RS translocation on 24 traits in a recombinant inbred line population. Cereal Res. Commun. 2020, 48, 225–232. [Google Scholar] [CrossRef]
  29. He, H.; Zhu, S.; Zhao, R.; Jiang, Z.; Ji, Y.; Ji, J.; Qiu, D.; Li, H.; Bie, T. Pm21, encoding a typical CC-NBS-LRR protein, confers broad-spectrum resistance to wheat powdery mildew disease. Mol. Plant 2018, 11, 879–882. [Google Scholar] [CrossRef] [Green Version]
  30. He, H.; Du, H.; Liu, R.; Liu, T.; Yang, L.; Gong, S.; Tang, Z.; Du, H.; Liu, C.; Han, R.; et al. Characterization of a new gene for resistance to wheat powdery mildew on chromosome 1RL of wild rye Secale sylvestre. Theor. Appl. Genet. 2021, 1–7. [Google Scholar] [CrossRef]
  31. McIntosh RA, D.J.; Rogers, W.J.; Morris, C.; Xia, X.C. Catalogue of Gene Symbols for Wheat: 2017 Supplement (KOMUGI Wheat Genetic Resource Database). 2017. Available online: https://shigen.nig.ac.jp/wheat/komugi/genes/symbolClassList.jsp (accessed on 1 November 2020).
  32. Li, Y.; Shi, X.; Hu, J.; Wu, P.; Li, H. Identification of a Recessive Gene PmQ Conferring Resistance to Powdery Mildew in Wheat Landrace Qingxinmai Using BSR-Seq Analysis. Plant Dis. 2019, 104, 743–751. [Google Scholar] [CrossRef]
  33. Friebe, B.; Heun, M.; Tuleen, N.; Zeller, F.J.; Gill, B.S. Cytogenetically Monitored Transfer of Powdery Mildew Resistance from Rye into Wheat. Crop Sci. 1994, 34, 621–625. [Google Scholar] [CrossRef]
  34. Singh, S.P.; Hurni, S.; Ruinelli, M.; Brunner, S.; Sanchez-Martin, J.; Krukowski, P.; Peditto, D.; Buchmann, G.; Zbinden, H.; Keller, B. Evolutionary divergence of the rye Pm17 and Pm8 resistance genes reveals ancient diversity. Plant Mol. Biol. 2018, 98, 249–260. [Google Scholar] [CrossRef] [PubMed]
  35. Hao, M.; Liu, M.; Luo, J.; Fan, C.; Yi, Y.; Zhang, L.; Yuan, Z.; Ning, S.; Zheng, Y.; Liu, D. Introgression of Powdery Mildew Resistance Gene Pm56 on Rye Chromosome Arm 6RS Into Wheat. Front. Plant Sci. 2018, 9, 1040. [Google Scholar] [CrossRef]
  36. Zhang, R.; Sun, B.; Chen, J.; Cao, A.; Xing, L.; Feng, Y.; Lan, C.; Chen, P. Pm55, a developmental-stage and tissue-specific powdery mildew resistance gene introgressed from Dasypyrum villosum into common wheat. Theor. Appl. Genet. 2016, 129, 1975–1984. [Google Scholar] [CrossRef] [PubMed]
  37. Zhang, R.; Fan, Y.; Kong, L.; Wang, Z.; Wu, J. Pm62, an adult-plant powdery mildew resistance gene introgressed from Dasypyrum villosum chromosome arm 2VL into wheat. Theor. Appl. Genet. 2018, 131, 2613–2620. [Google Scholar] [CrossRef] [PubMed]
  38. Zhang, R.; Xiong, C.; Mu, H.; Yao, R.; Cao, A. Pm67, a new powdery mildew resistance gene transferred from Dasypyrum villosum chromosome 1V to common wheat (Triticum aestivum L.). Crop J. 2020. [Google Scholar] [CrossRef]
  39. Li, H.; Xin, Z.Y.; Ma, Y.Z.; Xu, H.J.; Jia, X. Development and identification of wheat–Haynaldia villosa T6DL.6VS chromosome translocation lines conferring resistance to powdery mildew. Plant Breed. 2005, 124, 203–205. [Google Scholar] [CrossRef]
  40. Gao, S.G. Identification and analysis of resistance of NAU 92R wheat lines. Acta Agron. Sin. 1999, 25, 389–391. (In Chinese) [Google Scholar]
  41. Liu, C.; Wang, K.; Wang, M.J.; Li, S.J.; Lin, Z.S. Genetic behavior of Triticum aestivum–Dasypyrum villosum translocation chromosomes T6V#4S·6DL and T6V#2S·6AL carrying powdery mildew resistance. J. Integr. Agric. 2017, 16, 2136–2144. [Google Scholar] [CrossRef] [Green Version]
  42. Zhang, Y.L.; Wang, M.J.; Zhang, Y.; Chu, C.P.; Zhang, X.S. Development and application of functional markers specific to powdery mildew resistance on chromosome arm 6VS from different origins of Haynaldia villosa. Acta Agron. Sin. 2013, 38, 1827–1832. (In Chinese) [Google Scholar] [CrossRef]
  43. Liu, C.; Qi, L.; Liu, W.; Zhao, W.; Wilson, J.; Friebe, B.; Gill, B.S. Development of a set of compensating Triticum aestivum—Dasypyrum villosum Robertsonian translocation lines. Genome 2011, 54, 836–844. [Google Scholar] [CrossRef] [PubMed]
  44. Qi, L.L.; Wang, S.L.; Chen, P.D.; Liu, D.J.; Gill, B.S. Identification and physical mapping of three Haynaldia villosa chromosome-6V deletion lines. Theor. Appl. Genet. 1998, 97, 1042–1046. [Google Scholar] [CrossRef]
  45. Zhao, R.; Liu, B.; Jiang, Z.; Chen, T.; Wang, L.; Ji, Y.; Hu, Z.; He, H.; Bie, T. Comparative analysis of genetic effects of wheat-Dasypyrum villosum translocations T6V#2S·6AL and T6V#4S·6DL. Plant Breed. 2019, 138, 503–512. [Google Scholar] [CrossRef]
  46. Li, S.; Jia, Z.; Wang, K.; Du, L.; Li, H.; Lin, Z.; Ye, X. Screening and functional characterization of candidate resistance genes to powdery mildew from Dasypyrum villosum#4 in a wheat line Pm97033. Theor. Appl. Genet. 2020, 133, 3067–3083. [Google Scholar] [CrossRef]
  47. Bie, T.; Zhao, R.; Zhu, S.; Chen, S.; Cen, B.; Zhang, B.; Gao, D.; Jiang, Z.; Chen, T.; Wang, L.; et al. Development and characterization of marker MBH1 simultaneously tagging genes Pm21 and PmV conferring resistance to powdery mildew in wheat. Mol. Breed. 2015, 35, 189. [Google Scholar] [CrossRef]
  48. Li, S.; Wang, J.; Wang, K.; Chen, J.; Wang, K.; Du, L.; Ni, Z.; Lin, Z.; Ye, X. Development of PCR markers specific to Dasypyrum villosum genome based on transcriptome data and their application in breeding Triticum aestivum-D. villosum#4 alien chromosome lines. BMC Genom. 2019, 20, 289. [Google Scholar] [CrossRef] [Green Version]
  49. Sun, C.; Dong, Z.; Zhao, L.; Ren, Y.; Zhang, N.; Chen, F. The wheat 660K SNP array demonstrates great potential for marker-assisted selection in polyploid wheat. Plant Biotechnol. J. 2020, 18, 1354–1360. [Google Scholar] [CrossRef] [PubMed]
  50. Wang, N.; Xie, Y.; Li, Y.; Wu, S.; Wang, C. High-resolution mapping of the novel early leaf senescence gene Els2 in common wheat. Plants 2020, 9, 698. [Google Scholar] [CrossRef] [PubMed]
  51. Wu, J.; Wang, Q.; Liu, S.; Huang, S.; Mu, J.; Zeng, Q.; Huang, L.; Han, D.; Kang, Z. Saturation mapping of a major effect QTL for stripe rust resistance on wheat chromosome 2B in cultivar Napo 63 wsing SNP genotyping arrays. Front. Plant Sci. 2017, 8, 653. [Google Scholar] [CrossRef] [Green Version]
  52. Xin, F.; Zhu, T.; Wei, S.; Han, Y.; Zhao, Y.; Zhang, D.; Ma, L.; Ding, Q. QTL mapping of kernel traits and validation of a major QTL for kernel length-width ratio using SNP and bulked segregant analysis in wheat. Sci Rep. UK 2020, 10, 25. [Google Scholar] [CrossRef] [PubMed] [Green Version]
  53. Xu, D.; Wen, W.; Fu, L.; Li, F.; Li, J.; Xie, L.; Xia, X.; Ni, Z.; He, Z.; Cao, S. Genetic dissection of a major QTL for kernel weight spanning the Rht-B1 locus in bread wheat. Theor. Appl. Genet. 2019, 132, 3191–3200. [Google Scholar] [CrossRef] [PubMed]
  54. Yan, L.; Liang, F.; Xu, H.; Zhang, X.; Zhai, H.; Sun, Q.; Ni, Z. Identification of QTL for grain size and shape on the D genome of natural and synthetic allohexaploid wheats with near-identical AABB genomes. Front. Plant Sci. 2017, 8, 1705. [Google Scholar] [CrossRef] [PubMed] [Green Version]
  55. Cao, P.; Liang, X.; Zhao, H.; Feng, B.; Xu, E.; Wang, L.; Hu, Y. Identification of the quantitative trait loci controlling spike-related traits in hexaploid wheat (Triticum aestivum L.). Planta 2019, 250, 1967–1981. [Google Scholar] [CrossRef] [PubMed]
  56. Guan, P.; Di, N.; Mu, Q.; Shen, X.; Wang, Y.; Wang, X.; Yu, K.; Song, W.; Chen, Y.; Xin, M.; et al. Use of near-isogenic lines to precisely map and validate a major QTL for grain weight on chromosome 4AL in bread wheat (Triticum aestivum L.). Theor. Appl. Genet. 2019, 132, 2367–2379. [Google Scholar] [CrossRef] [PubMed]
  57. Guan, P.; Shen, X.; Mu, Q.; Wang, Y.; Wang, X.; Chen, Y.; Zhao, Y.; Chen, X.; Zhao, A.; Mao, W.; et al. Dissection and validation of a QTL cluster linked to Rht-B1 locus controlling grain weight in common wheat (Triticum aestivum L.) using near-isogenic lines. Theor. Appl. Genet. 2020, 133, 2639–2653. [Google Scholar] [CrossRef] [PubMed]
  58. Xiong, H.; Guo, H.; Zhou, C.; Guo, X.; Xie, Y.; Zhao, L.; Gu, J.; Zhao, S.; Ding, Y.; Liu, L. A combined association mapping and t-test analysis of SNP loci and candidate genes involving in resistance to low nitrogen traits by a wheat mutant population. PLoS ONE 2019, 14, e0211492. [Google Scholar] [CrossRef] [PubMed]
  59. Li, F.; Wen, W.; Liu, J.; Zhang, Y.; Cao, S.; He, Z.; Rasheed, A.; Jin, H.; Zhang, C.; Yan, J.; et al. Genetic architecture of grain yield in bread wheat based on genome-wide association studies. BMC Plant Biol. 2019, 19, 168. [Google Scholar] [CrossRef] [PubMed]
  60. Bai, S.; Yuan, F.; Zhang, H.; Zhang, Z.; Zhao, J.; Yang, Q.; Wu, J.; Chen, X. Characterization of the wheat-Psathyrostachys huashania Keng 2Ns/2D substitution line H139: A novel germplasm with enhanced resistance to wheat take-all. Front. Plant Sci. 2020, 11, 233. [Google Scholar] [CrossRef] [PubMed]
  61. Li, H.; Wang, Q.; Xu, L.; Mu, J.; Wu, J.; Zeng, Q.; Yu, S.; Huang, L.; Han, D.; Kang, Z. Rapid identification of a major effect QTL conferring adult plant resistance to stripe rust in wheat cultivar Yaco“S”. Euphytica 2017, 213, 124. [Google Scholar] [CrossRef]
  62. Wu, J.; Wang, X.; Chen, N.; Yu, R.; Yu, S.; Wang, Q.; Huang, S.; Wang, H.; Singh, R.P.; Bhavani, S.; et al. Association analysis identifies new loci for resistance to chinese Yr26-virulent races of the stripe rust pathogen in a diverse panel of wheat germplasm. Plant Dis. 2020, 104, 1751–1762. [Google Scholar] [CrossRef] [PubMed]
  63. Zhou, S.; Zhang, J.; Che, Y.; Liu, W.; Lu, Y.; Yang, X.; Li, X.; Jia, J.; Liu, X.; Li, L. Construction of Agropyron Gaertn. genetic linkage maps using a wheat 660K SNP array reveals a homoeologous relationship with the wheat genome. Plant Biotechnol. J. 2018, 16, 818–827. [Google Scholar] [CrossRef] [Green Version]
  64. Zhuang, Q.S. Chinese Wheat Improvement and Pedigree Analysis; China Agriculture Press: Beijing, China, 2003. (In Chinese) [Google Scholar]
  65. Si Quanmin, Z.X.; Sheng, B.Q.; Duan, X.Y. Identification of physiologic race of Erysiphe graminis f. sp. Tritici. Sci. Agric. Sin. 1987, 20, 64–70. (In Chinese) [Google Scholar]
  66. Su, H.; Liu, Y.; Liu, C.; Shi, Q.; Huang, Y.; Han, F. Centromere satellite repeats have undergone rapid changes in polyploid wheat subgenomes. Plant Cell 2019, 31, 2035–2051. [Google Scholar] [CrossRef] [PubMed] [Green Version]
  67. Cao, A.; Xing, L.; Wang, X.; Yang, X.; Wang, W.; Sun, Y.; Qian, C.; Ni, J.; Chen, Y.; Liu, D. Serine/threonine kinase gene Stpk-V, a key member of powdery mildew resistance gene Pm21, confers powdery mildew resistance in wheat. Proc. Natl. Acad. Sci. USA 2011, 108, 7727–7732. [Google Scholar] [CrossRef] [Green Version]
  68. Lin, Z.S.; Zhang, Y.L.; Wang, M.J.; Li, J.R.; Wang, K.; Chen, X.; Xu, Q.F.; Zhang, X.S.; Ye, X.G. Isolation and molecular analysis of genes Stpk-V2 and Stpk-V3 homologous to powdery mildew resistance gene Stpk-V in a Dasypyrum villosum accession and its derivatives. J. Appl. Genet. 2013, 54, 417–426. [Google Scholar] [CrossRef] [PubMed]
  69. Xing, L.; Hu, P.; Liu, J.; Witek, K.; Zhou, S.; Xu, J.; Zhou, W.; Gao, L.; Huang, Z.; Zhang, R.; et al. Pm21 from Haynaldia villosa encodes a CC-NBS-LRR protein conferring powdery mildew resistance in wheat. Mol. Plant 2018, 11, 874–878. [Google Scholar] [CrossRef] [PubMed] [Green Version]
  70. He, H.; Ji, J.; Li, H.; Tong, J.; Feng, Y.; Wang, X.; Han, R.; Bie, T.; Liu, C.; Zhu, S. Genetic diversity and evolutionary analyses reveal the powdery mildew resistance gene Pm21 undergoing diversifying selection. Front. Genet. 2020, 11, 489. [Google Scholar] [CrossRef] [PubMed]
  71. Jaiswal, V.; Gahlaut, V.; Mathur, S.; Agarwal, P.; Khandelwal, M.; Khurana, P.; Tyagi, A.; Balyan, H.; Gupta, P. Identification of novel SNP in promoter sequence of TaGW2-6A associated with grain weight and other agronomic traits in wheat (Triticum aestivum L.). PLoS ONE 2015, 10, e0129400. [Google Scholar] [CrossRef] [PubMed] [Green Version]
  72. Su, Z.; Hao, C.; Wang, L.; Dong, Y.; Zhang, X. Identification and development of a functional marker of TaGW2 associated with grain weight in bread wheat (Triticum aestivum L.). Theor. Appl. Genet. 2011, 122, 211–223. [Google Scholar] [CrossRef] [PubMed]
  73. Yang, Z.; Bai, Z.; Li, X.; Wang, P.; Wu, Q.; Yang, L.; Li, L.; Li, X. SNP identification and allelic-specific PCR markers development for TaGW2, a gene linked to wheat kernel weight. Theor. Appl. Genet. 2012, 125, 1057–1068. [Google Scholar] [CrossRef] [PubMed]
Figure 1. Genealogical diagram of the materials in this study.
Agronomy 11 00399 g001
Figure 2. Distribution of 89,167 probes used for the genotyping. The abscissa shows the chromosome, the left ordinate shows the number of probes on each chromosome, and the right ordinate shows the density of the number of probes on each chromosome. The orange bars represent the number of probes, and the gray polyline shows the trend of density on each chromosome.
Agronomy 11 00399 g002
Figure 3. Percentages of genotypes on the 21 chromosomes in A303, Wan7107, and B303. Chromosome 6A is shown in red and chromosome 6D is shown in black.
Agronomy 11 00399 g003
Figure 4. Schematic diagram of the percentage of SNPs between two translocation lines and Wan7107 on each chromosome.
Agronomy 11 00399 g004
Figure 5. Distribution of SNPs on each chromosome between A303 and Wan7107.
Agronomy 11 00399 g005
Figure 6. Distribution of SNPs on each chromosome between B303 and Wan7107.
Agronomy 11 00399 g006
Figure 7. Developmental states of the conidiospores 25 h and 72 h after inoculation on leaves of the translocation lines. (a) Spores 25 h after inoculation on leaves of the translocation lines A303. (b) Spores 72 h after inoculation on leaves of the translocation lines A303. (c) Spores 25 h after inoculation on leaves of the translocation lines B303. (d) Spores 72 h after inoculation on leaves of the translocation lines B303. (e) Spores 25 h after inoculation on leaves of Wan7107. (f) Spores 72 h after inoculation on leaves of Wan7107. White arrows point to spores, yellow arrows point to primary germinal tubes, red arrows point to appressorium, and green arrows point to secondary hyphae.
Agronomy 11 00399 g007
Figure 8. Comparison of grain shape between two translocation lines and Wan7107.
Agronomy 11 00399 g008
Table 1. Genotyping ratio on each chromosome in Wan7107.
Wan7107NA
(%)
AA
(%)
AC
(%)
AG
(%)
AT
(%)
CC
(%)
CG
(%)
GG
(%)
TC
(%)
TG
(%)
TT
(%)
1A0.66 19.21 0.14 0.39 0.04 30.44 0.06 29.33 0.53 0.07 19.13
2A0.46 17.99 0.09 0.41 0.00 32.08 0.00 30.61 0.41 0.03 17.91
3A0.57 18.78 0.16 0.55 0.02 30.38 0.08 30.12 0.35 0.12 18.85
4A0.44 19.35 0.07 0.39 0.00 29.87 0.13 30.71 0.33 0.05 18.68
5A0.53 18.07 0.11 0.32 0.04 31.73 0.11 30.11 0.46 0.15 18.34
6A0.59 18.74 0.30 1.14 0.00 29.67 0.34 27.89 1.19 0.25 19.88
7A0.59 22.78 0.10 0.64 0.04 26.81 0.13 26.16 0.51 0.08 22.16
1B0.39 19.23 0.12 0.73 0.05 29.76 0.02 29.59 0.71 0.05 19.35
2B1.11 18.55 0.24 1.02 0.02 30.18 0.16 29.37 0.87 0.34 18.15
3B0.68 19.49 0.12 0.51 0.02 29.91 0.17 28.39 0.50 0.07 20.12
4B0.43 15.74 0.09 0.37 0.03 32.37 0.09 34.30 0.22 0.09 16.26
5B0.49 19.43 0.10 0.49 0.00 29.75 0.04 29.45 0.48 0.16 19.61
6B0.49 15.98 0.19 0.50 0.02 33.42 0.06 32.87 0.44 0.13 15.90
7B0.48 17.97 0.13 0.67 0.08 31.36 0.19 30.42 0.56 0.13 18.00
1D0.50 17.06 0.17 0.99 0.06 32.36 0.28 30.49 0.88 0.33 16.90
2D0.39 14.11 0.26 1.74 0.00 34.99 0.58 34.02 0.97 0.32 12.63
3D0.81 16.48 0.16 0.57 0.00 31.66 0.32 31.18 0.89 0.32 17.61
4D0.71 20.93 0.00 0.63 0.08 27.25 0.16 30.41 0.71 0.08 19.04
5D0.41 15.85 0.06 0.53 0.06 31.47 0.00 33.29 0.41 0.23 17.67
6D0.00 16.69 0.38 0.99 0.00 31.87 0.30 33.08 1.21 0.30 15.17
7D0.29 17.76 0.10 0.34 0.00 31.95 0.00 29.95 0.54 0.15 18.93
Average0.53 18.10 0.15 0.66 0.03 30.92 0.15 30.56 0.63 0.17 18.11
Table 2. Number, density, and proportion of SNP probes on each chromosome in homozygous Wan7107.
ChromosomePhysical Range (Mb)Number of ProbesDensity
(kb)
A303 vs. Wan7107(SNP)B303 vs. Wan7107(SNP)
NumberDensity
(kb)
Proportion
(%)
NumberDensity
(kb)
Proportion
(%)
1A593.07694985.353417,443.240.49916517.251.31
2A780.266327123.324915,923.670.777210,836.941.14
3A750.554871154.093025,018.330.625912,721.191.21
4A743.866151120.933123,995.480.55014,877.200.81
5A709.425234135.543619,706.110.69937628.171.78
6A616.462359261.322524,658.401.06648951.3327.47
7A736.447072104.134018,411.000.571076882.621.51
1B688.584113167.422428,690.830.584614,969.131.12
2B801.185516145.254318,632.090.787710,404.941.4
3B830.14938288.484020,753.500.43929023.260.98
4B673.243222208.956112,206.670.193022,441.330.93
5B712.966911103.163321,604.850.48818801.981.17
6B720.396382112.883520,582.570.55818893.701.27
7B750.5437342011262,545.000.323521,444.000.94
1D495.151817272.51682,525.000.331729,126.470.94
2D651.431552419.74793,061.430.451543,428.670.97
3D614.951238496.732307,475.000.161347,303.851.05
4D508.641266401.771436,331.431.111533,909.331.18
5D565.471703332.041151,406.360.652126,927.141.23
6D473.511318359.261473221.1611.152816,911.072.12
7D638.312050311.37970,923.330.441542,554.000.73
Table 3. Reactions of translocation lines to 24 different individual Bgt strains.
Isolate of BgtFunoA303B303Nannong9918
E0140;0;0;
E0540;00;
E0640;00;
E0740;00
E09400;0;
E1140;0;0;
E13400;0;
E1530;2+0;0;
E164000;
E1740;00;
E1840;0;0
E20410;0;
E21400;0;
E23-(1)400;0;
E23-(2)400;0;
E2630;0;0
E30-(1)4000
E30-(2)40;0;0;
E3140;00;
E3240;0;0;
E4940;0;0
E503000;
E604000;
E6940;00;
Table 4. Comparison of main agronomic traits between translocation lines and their recurrent parent Wan7107.
MaterialsIndividualsPH(cm)EL(cm)SNGNPSENSFNTGW(g)
A3033078.55 ± 3.527.75 ± 0.9619.63 ± 1.0354.87 ± 6.614.33 ± 1.580.17 ± 0.3839.67 ± 1.07
p value ****nsnsnsns**
B303-13075.52 ± 3.867.45 ± 0.8619.20 ± 1.6350.67 ± 7.094.63 ± 1.430.63 ± 0.7639.07 ± 0.40
p value **ns**ns***
B303-23075.13 ± 4.677.11 ± 0.9118.67 ± 1.4452.90 ± 7.544.80 ± 1.390.43 ±0.6240.56 ± 0.16
p value **ns**nsnsns**
Wan71073071.60 ± 2.857.15 ± 0.6620.10 ± 1.5255.67 ± 6.484.63 ± 1.490.23 ± 0.4333.78 ± 0.83
Asterisks indicate significance determined by t-test for each population * p < 0.05, ** p < 0.01. ns: no significant difference. Abbreviations: PH: plant height; EL: ear length; SN: spikelet number; GNPS: grain number per spike; EN: ear number; SFN: sterile floret number; TGW: thousand grain weight.
Table 5. Comparison of main agronomic traits between resistant and susceptible plants of three BC2F3 and BC2F4 populations derived from a cross of Pm97033/Wan7107 × 3 planted in a greenhouse.
Pm97033/
Wan7107
IndividualsPHELSNGNPSFNENSFNTGWPM Reaction
BC2F35682.98 ± 6.256.08 ± 0.5121.19 ± 1.5733.32 ± 8.2243.30 ± 5.791.96 ± 0.873.91 ± 1.5244.82 ± 0.18R
3478.41 ± 6.155.75 ± 0.6422.00 ± 1.4126.82 ± 7.2540.47 ± 6.452.26 ± 0.866.12 ± 1.7140.48 ± 0.16S
p value ********ns****
BC2F4-12282.50 ± 5.346.41 ± 0.5221.05 ± 1.1334.9 ± 5.8447.41 ± 6.582.23 ± 1.153.5 ± 1.3344.03 ± 0.03R
2381.83 ± 3.026.22 ± 0.4421.95 ± 1.1129.71 ± 6.0843.52 ± 5.522.48 ± 0.734.86 ± 1.2840.16 ± 0.20S
p value nsns***ns****
BC2F4-22281.35 ± 6.206.49 ± 0.6120.23 ± 1.3434.86 ± 9.9345.27 ± 6.361.90 ± 1.153.77 ± 1.8743.27 ± 0.73R
2578.64 ± 5.906.26 ± 0.4722.40 ± 1.0031.62 ± 6.1046.20 ± 3.912.00 ± 0.644.80 ± 1.5236.66 ± 0.16S
p value nsns**nsnsns***
Asterisks indicate significance determined by t-test for each population, * p < 0.05, ** p < 0.01. ns: no significant difference. R: resistant; S: susceptible.Abbreviations: PH: plant height; EL: ear length; SN: spikelet number; GNPS: grain number per spike; FN: floret number; EN: ear number; SFN: sterile floret number; TGW: thousand grain weight.
Publisher’s Note: MDPI stays neutral with regard to jurisdictional claims in published maps and institutional affiliations.

