Article

Effects of Nitrogen Rates on the Productivity and Nutritive Value of Forage Grass Grown under Extreme Climatic Conditions

by
Aušra Marcinkevičienė
1,*,
Rimantas Velička
1,
Robertas Kosteckas
2,
Aušra Rudinskienė
1,
Inga Adamonytė
3 and
Zita Kriaučiūnienė
1
1
Department of Agroecosystems and Soil Sciences, Agriculture Academy, Vytautas Magnus University, K. Donelaičio Str. 58, LT-44248 Kaunas, Lithuania
2
Department of Plant Biology and Food Sciences, Agriculture Academy, Vytautas Magnus University, K. Donelaičio Str. 58, LT-44248 Kaunas, Lithuania
3
Department of Water Engineering, Agriculture Academy, Vytautas Magnus University, K. Donelaičio Str. 58, LT-44248 Kaunas, Lithuania
*
Author to whom correspondence should be addressed.
Agronomy 2021, 11(12), 2572; https://doi.org/10.3390/agronomy11122572
Submission received: 18 November 2021 / Revised: 10 December 2021 / Accepted: 16 December 2021 / Published: 17 December 2021

Abstract

:
This vegetative experiment was carried out at the greenhouse of Vytautas Magnus University Agriculture Academy Open Access Joint Research Centre of Agriculture and Forestry (Lithuania) in 2020–2021. The aim of these studies was to determine the effect of different nitrogen rates on the productivity and nutritional quality of forage grasses (a mixture of red clover and timothy) under the most common extremes of climate change, i.e., soil moisture deficiency and surplus. Under drought and waterlogging stresses, fertilization of the red clover and timothy mixture with high N rates was ineffective. The clover and timothy mixture recovery after drought took 21 days. The aboveground dry biomass of the clover and timothy mixture grown under drought conditions was significantly lower by 36.3 to 47.2% compared to that formed under optimum soil moisture and waterlogging conditions. The root biomass of forage grass mixtures was lowest under drought conditions when fertilized at the highest N rate (N25+120). The aboveground biomass of clover grown under different soil moisture conditions depended on the number of plants (r2 = 0.78, p < 0.01) and assimilating leaf area (r2 = 0.83, p < 0.01), and that of timothy on the number of vegetative tillers (r2 = 0.46, p < 0.05). Under drought simulation conditions, increasing the N rate increased the crude protein and crude fibre contents in the aboveground biomass of the clover and timothy mixture, while the crude ash content decreased.

1. Introduction

The climate in Lithuania is suitable for the production of forage grasses. The country has more than 1 million ha of grassland. Most of this area is cultivated meadows and pastures. With a long growing season, they make good use of solar energy and, when properly fertilized, produce high yields of 10–12 t ha−1 of dry matter or 120 GJ ha−1 of metabolizable energy. Forage quality is also a very important parameter. Properly prepared forage contains 110–115 g of digestible protein per feed unit [1].
An analysis of droughts over the last few decades shows that droughts in Lithuania are becoming more frequent and longer than in the late 19th and early 20th centuries. Forecast data suggest that seasonal rainfall may decrease significantly in the near future. Moreover, the likelihood of droughts in Lithuania will continue to increase as temperatures rise [2]. The report of the Intergovernmental Panel on Climate Change (IPCC) predicts that global annual average air temperatures may increase from 1.5 to 6.0 °C by 2100 [3]. In Lithuania, the increase in average annual temperature has been very significant over the last 30 years. Stonevičius et al. [2] suggest that from 2001 to 2090, average soil moisture in each of the 30-year periods will decrease. Declining soil moisture reserves, thinner and often erratic snow cover, and increased weather extremes may limit the growth of agricultural production. This will have the greatest impact on the plant production sector. Efficient drainage and irrigation systems are needed to mitigate the negative effects of severe droughts; controlled drainage allows drainage to operate at different intensities. In case of excess moisture, the drainage system operates in normal mode, while when the minimum drainage rate is reached, runoff is prevented, and moisture is retained in the soil. This reduces plant stress due to lack of moisture during dry growing seasons [4].
Soil moisture is one of the most important physical parameters in agriculture and has a decisive influence on the yield and quality of forage and other crops [5]. Heat and drought are the two most important stressors having major impacts on crop growth and productivity [6,7]. An uneven distribution of rainfall during the growing season and droughts reduces forage grass productivity and cover, with changes in plant species composition, gas and nutrient cycling [8]. The chemical composition and morphology of forage plants determines their palatability, digestibility, and nutritional value for livestock. As the climate changes, the nutritional value and digestibility of forage plants are reduced due to changes in their physiology and morphology, helping to avoid water deficit and heat stress [9]. Staniak and Kocon [10] point out the need to select forage grass species and varieties that are more drought-tolerant and have a higher adaptive capacity and tolerance to soil water deficit.
Climate change has increased the incidence of soil waterlogging [11]. Waterlogging is one of the abiotic stressors, which affect crop growth and productivity [12]. Soil waterlogging reduces gas exchange between the soil and the atmosphere, leading to oxygen deprivation in the rhizosphere [13]. Tong et al. [11] state that plants respond to waterlogging stress by adventitious root growth, aerenchyma formation, energy metabolism, and phytohormone signalling.
Studies have shown that fertilized perennial grasses are more resilient to various stressors caused by climate change [14,15]. Creating appropriate mixtures of forage grasses would not only help to achieve stable yields despite the stresses caused by climate change, but also contribute to environmental sustainability [16]. According to Helgadόttir et al. [17], grass-legume mixtures were more productive than monocultures. Elsalahy et al. [18] point out that the greater the plant diversity, the more drought tolerant the crop becomes.
Climate change and its impacts are an important area of research for developing mitigation and adaptation strategies. There is a lack of research about the impact of climate extremes on the productivity of grass mixtures under Lithuanian climate conditions.
The aim of the studies was to determine the effect of different nitrogen rates on the productivity and the nutritive value of forage grasses (a mixture of red clover and timothy) under the most frequent extremes of climate change, i.e., soil moisture deficiency and soil moisture surplus.

2. Materials and Methods

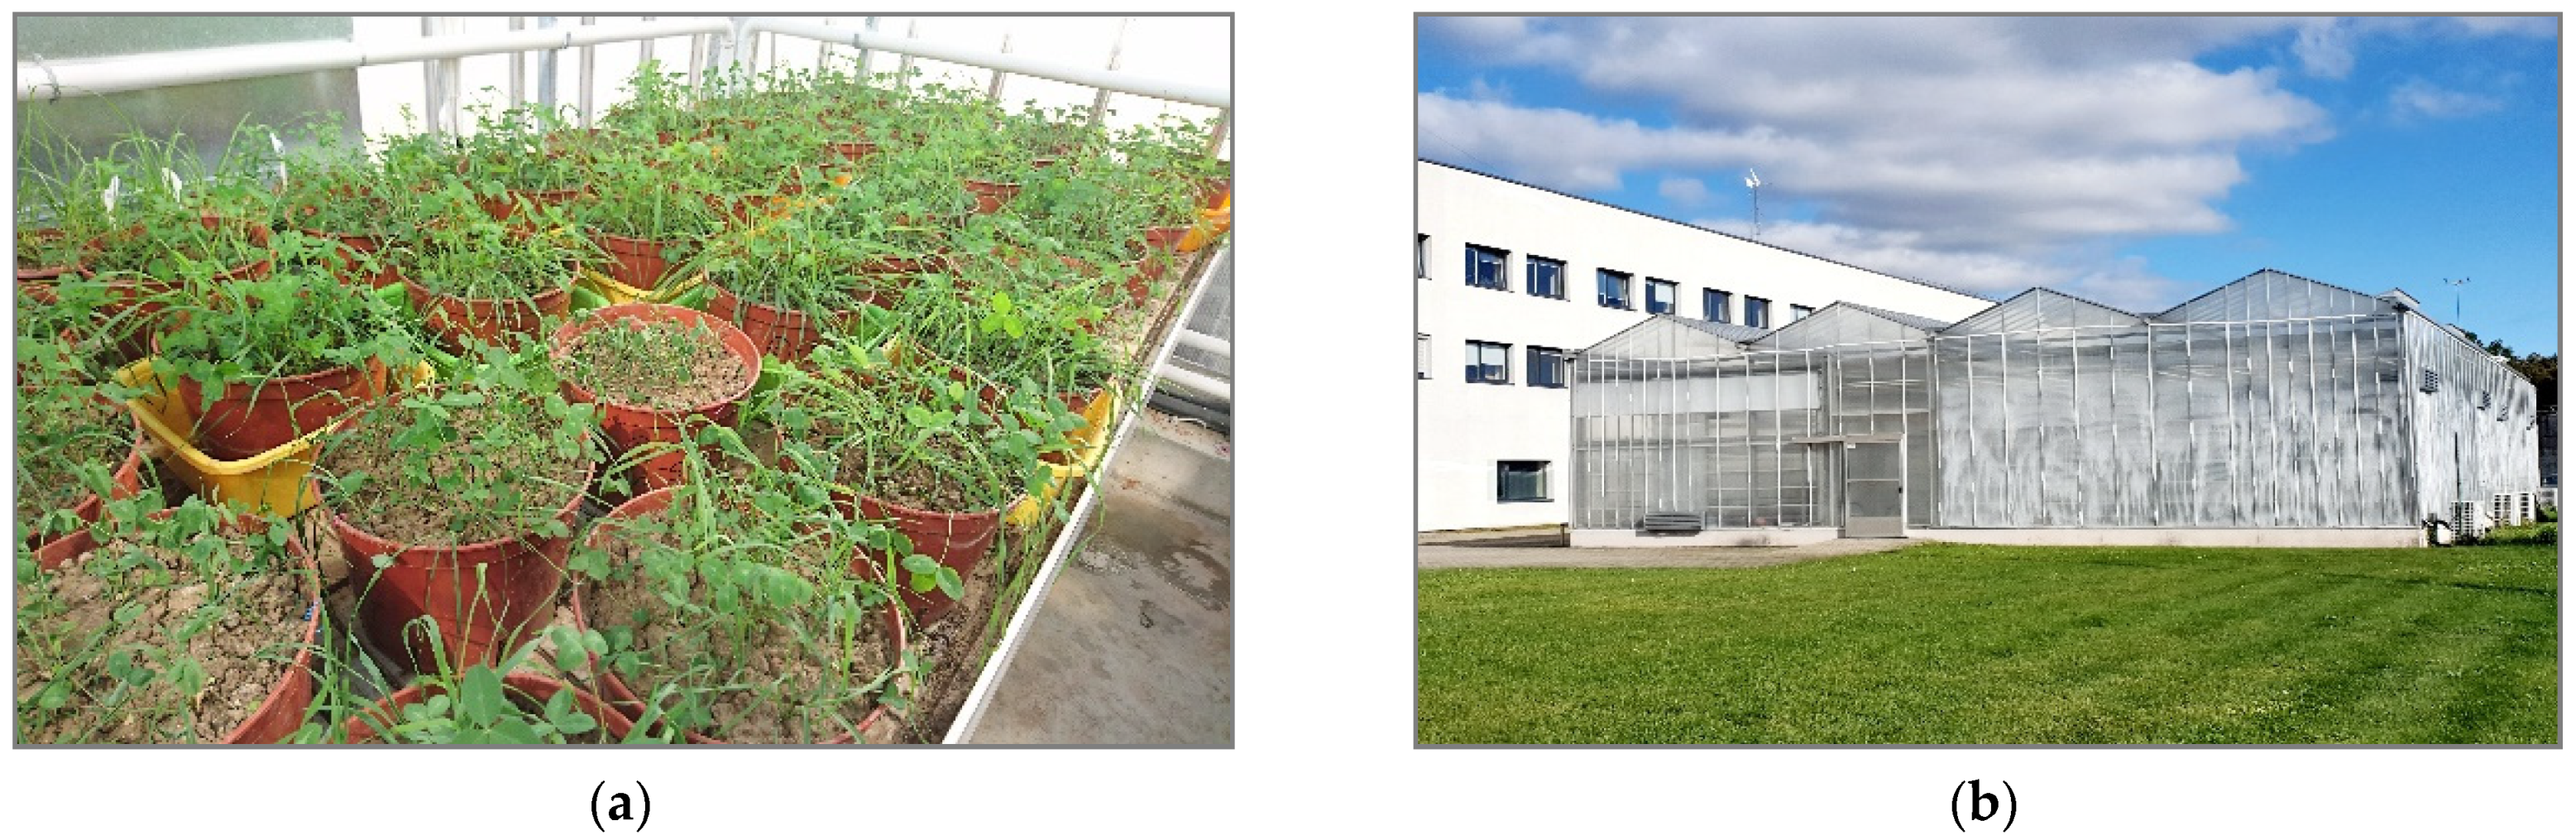
2.1. Experimental Site

The vegetative experiment was carried out at the greenhouse of Vytautas Magnus University Agriculture Academy (VMU AA) Open Access Joint Research Centre of Agriculture and Forestry (Lithuania) in 2020–2021 (Figure 1).

2.2. The Experimental Design

A two-factor vegetative experiment was carried out. Experimental treatments were: Factor A: Soil moisture regime conditions: 1. Moisture deficit conditions (drought simulation); 2. Optimum moisture regime conditions; 3. Excess moisture conditions (waterlogging simulation). Factor B: Nitrogen rates: 1. N25P60P90 (background fertilization); 2. N25P60P90+N60; 3. N25P60P90+N120. The experiments were carried out in 4 replicates. The treatments were arranged in a randomized complete block design. A mixture of red clover (Trifolium pratense L.) ‘Vyčiai’ and timothy (Phleum pratense L.) ‘Gintaras II’ was grown in 36 vegetation pots in the greenhouse from February to June. The average air temperature in the greenhouse was 25 °C and the humidity was 75–70%. Lighting was provided by 6 lamps of 400 W each for 14 h.

2.3. The Agrotechnologies of the Experiment

The soil for the experiment was taken at a 0–20 cm depth layer from the field of the VMU AA Experimental Station. The soil was a light loam, pH 7.44, total nitrogen 0.125%, organic carbon 1.00%, and mobile nutrients: P2O5 259 mg kg−1 and K2O 114 mg kg−1. Before starting the experiment, the soil was dried in an oven at 105 °C. A sample of 7.5 kg of soil was weighed and moistened to 20% per each vegetation pot (7.5 litres). The perennial grass mixture was 40% legumes and 60% grasses. The seed rate chosen for the mixture was 18 kg ha−1: 12.9 kg ha−1 clover and 5.10 kg ha−1 timothy. The seed rate was 0.061 g clover and 0.024 g timothy per vegetation pot (0.047 m2). The grass seeds were planted at a 1 cm depth in the soil. One month after perennial grass germination, the number of plants in each vegetation pot was equalised: 12 clover and 18 timothy (30 plants in total). At the time of sowing, a complex fertilizer NPK 8-19-29 was applied. The fertilizer rate was 310 kg ha−1 (N25P60K90), 1.46 g per vegetation pot. The fertilizer was applied at the sowing depth of perennial grasses. Under optimum and maximum nitrogen fertilization conditions, ammonium nitrate (34.4% N) was applied one month after germination at 0.82 and 1.64 g per vegetation pot respectively. The fertilizer was spread on the surface of the vegetation pots.

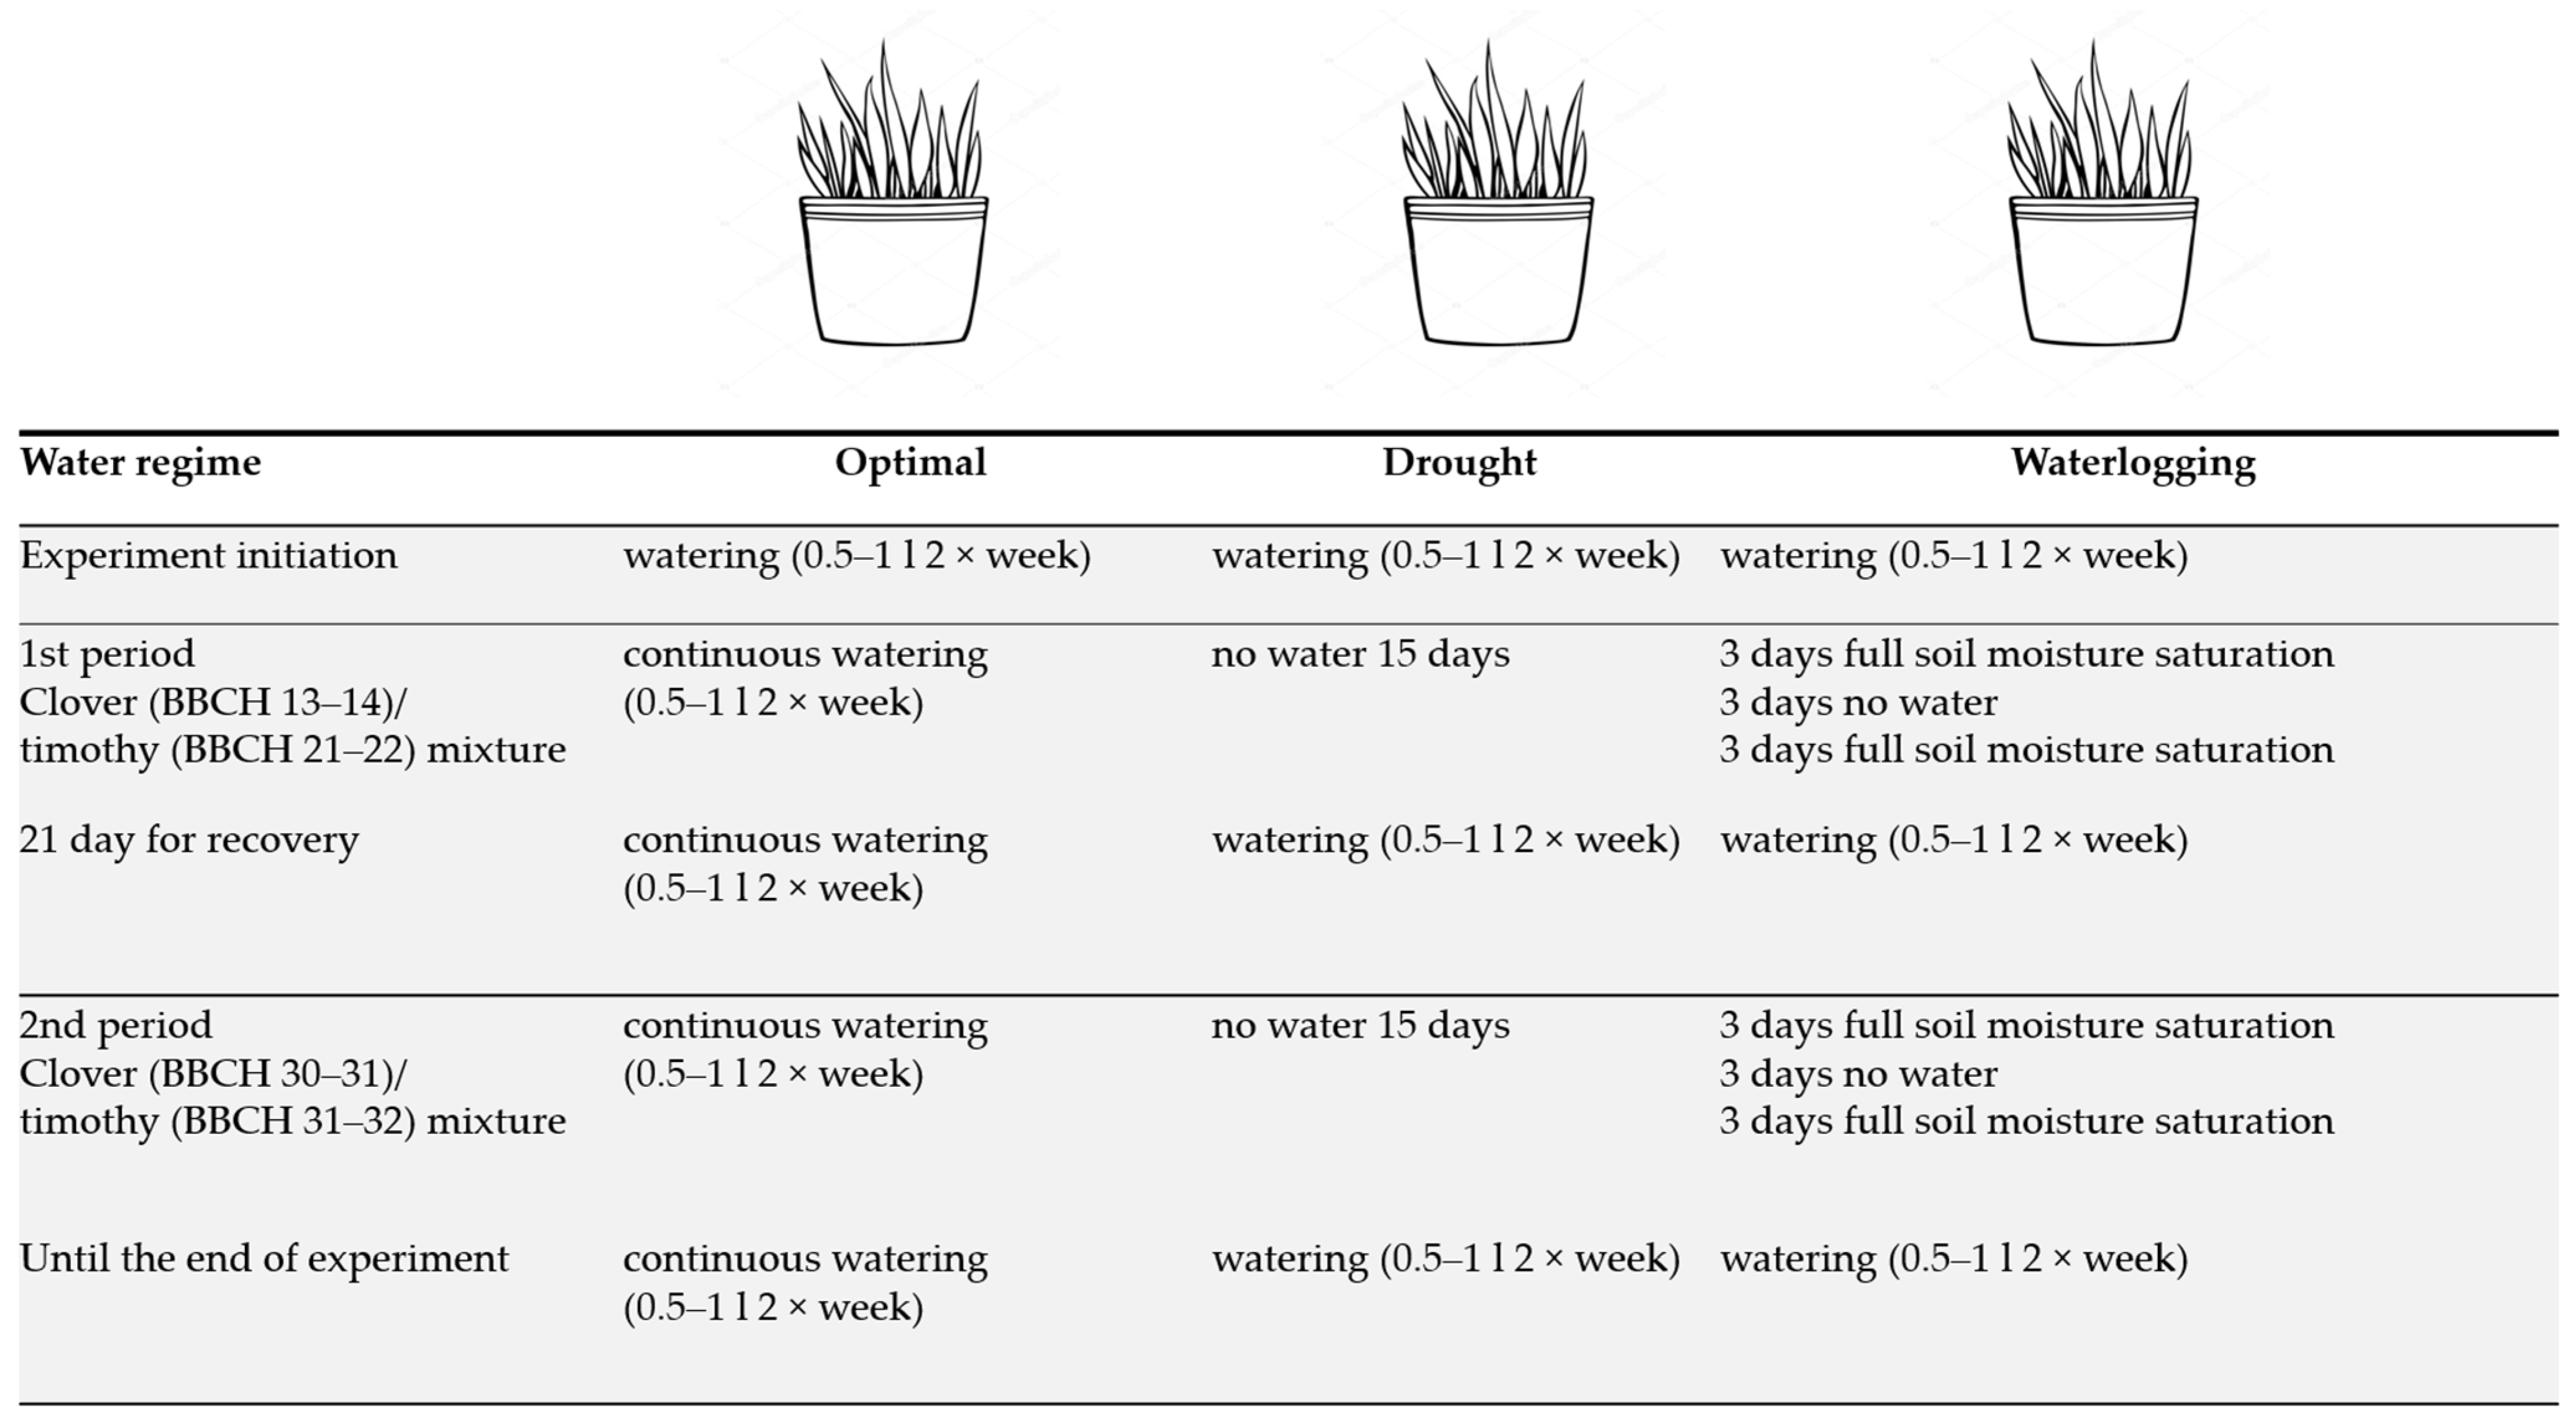
2.4. The Water Regime during Experiment

The plants were watered twice a week (except during periods of drought and waterlogging) (Figure 2). The water application rate was 0.5–1.0 L per vegetation pot. The perennial grass mixture was subjected to moisture deficiency (drought imitation) and moisture excess (waterlogging imitation) conditions twice during its growth period: firstly, at the beginning of the leaf development stage of clover (BBCH 13–14) and tillering stage of timothy (BBCH 21–22), and secondly, at the beginning of clover stalk elongation (BBCH 30–31) and at the booting stage of timothy (BBCH 31–32). Twenty-one days were allowed between periods for plant recovery. During the drought simulation periods (21 March to 4 April and 25 April to 9 May), the plants were not watered for 15 days.
During the waterlogging simulation periods (21–29 March and 25 April to 3 May), the vegetation pots were placed in containers with 3 L of water and kept for three days. After three days, the remaining water was discarded. After a three-day pause the same process was then repeated. The productivity of the perennial grass mixture was assessed on 18 June.

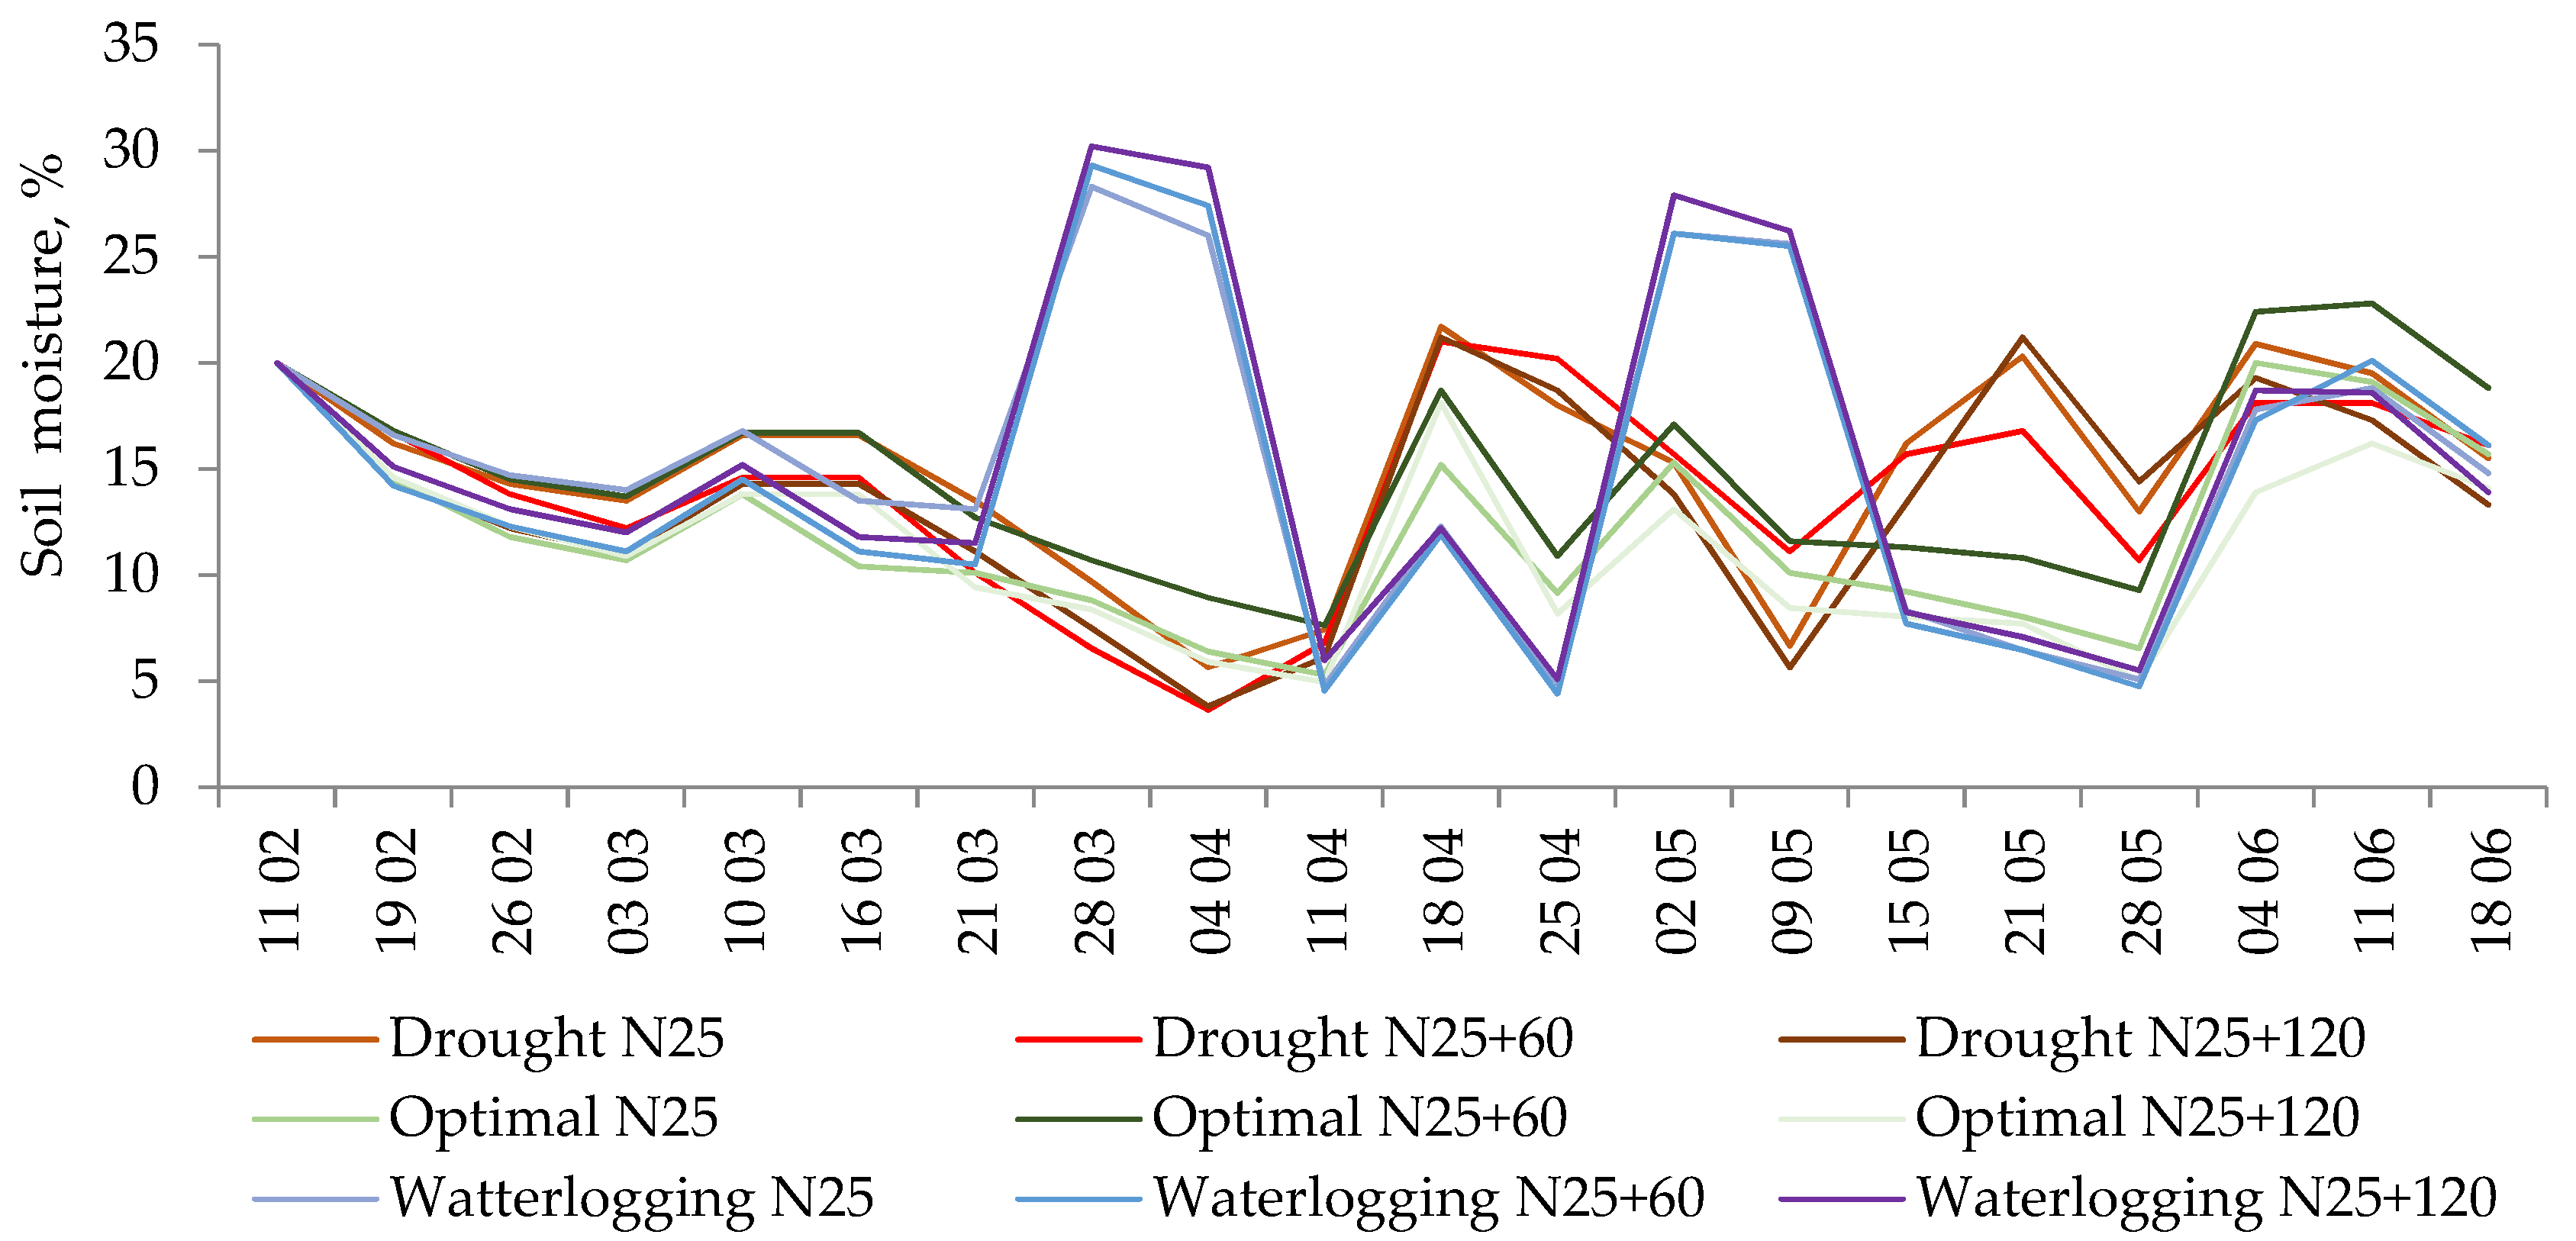
2.5. Soil Moisture Dynamic

The highest soil moisture content in the early growth and development stages of red clover and timothy during drought simulation was maintained at the lowest nitrogen rate (N25), and at N25+60 in the later stages (Figure 3).
Under optimum soil moisture conditions, the maximum soil moisture content was maintained at the average nitrogen rate (N25+60), while under the conditions of simulated waterlogging and after its cessation, it was maintained at the maximum nitrogen rate (N25+120).

2.6. Methods

The height of perennial grasses was measured from the onset of drought and waterlogging conditions until the productivity assessment. Plant height was measured with a ruler from the substrate surface to the highest point of the plants.
Estimation of aboveground biomass of perennial grass mixtures: The aboveground biomass of clover and timothy was cut separately from each vegetation pot and dried at 105 °C in a drying oven. The aboveground biomass of each plant species and mixture was converted to absolute dry matter (DM) in g per vegetation pot.
Estimation of root biomass of perennial grass mixtures: Roots of perennial grasses were washed out of each vegetation pot using sieves [19]. The roots were dried at 105 °C in the drying oven. The total root biomass was calculated in absolute dry matter (DM) in g per vegetation pot.
Determination of assimilating leaf area of perennial grasses: Leaves of each plant species were measured separately using the WinDias 3 Leaf Image Analysis System (Delta-T Devices Ltd., Cambridge, UK). The leaf area of the plants was converted to m2 per vegetation pot.
Assessing chemical composition of perennial grasses: The biomass of the aboveground part of perennial grasses was dried in the drying oven at 45 °C and ground. The following were determined in the aboveground biomass of the plants: crude protein content (%), using the Kjeldahl method (LST1523:1998); crude fibre content (%), using the Henneberg-Stohmann method and crude ash content (%) by incineration of dried samples (LST1539:1998) [20]. The analyses were carried out in four replicates at the Laboratory of Agronomic and Zootechnical Research of Food Raw Materials, VMU AA.
Soil agrochemical properties were determined before the experiment began. Soil pH was obtained potentiometrically in 1 n KCl extract. Mobile phosphorus P2O5 and mobile potassium K2O (mg kg−1 soil) were estimated using the Egner-Rim-Domingo (A–L) method and organic carbon (%) by incineration of samples at 900 °C using a Heraeus incinerator. The analyses were performed at the Agrochemical Research Laboratory of the Lithuanian Research Centre for Agriculture and Forestry.
Determining dynamics of soil water content: To determine the dynamics of soil water content, the vegetation pots were weighed twice a week (from 11 February to 18 June). Soil water content (SWC) was calculated according to the following formula [21]:
SWC (%) = ((mp − ms) × ms−1) × 100
where; mp = initial weight of vegetation pot, kg; ms = weight of vegetation pot during weighing, kg.

2.7. Statistical Analysis

The research data were statistically analysed by two-way analysis of variance. The statistical analysis of the experimental data was performed using the software ANOVA and Multiple Regression from the statistical analysis package STATISTICA version 10. The Fisher’s criterion and LSD test were used to assess the significance of the differences [22]. The differences between means of treatments, marked by different letters, are significant at 95% probability level (p < 0.05). Correlation and regression between studied parameters evaluated at 95 and 99% probability level (p < 0.05; p < 0.01). Standard errors of the means are indicated by whiskers.

3. Results

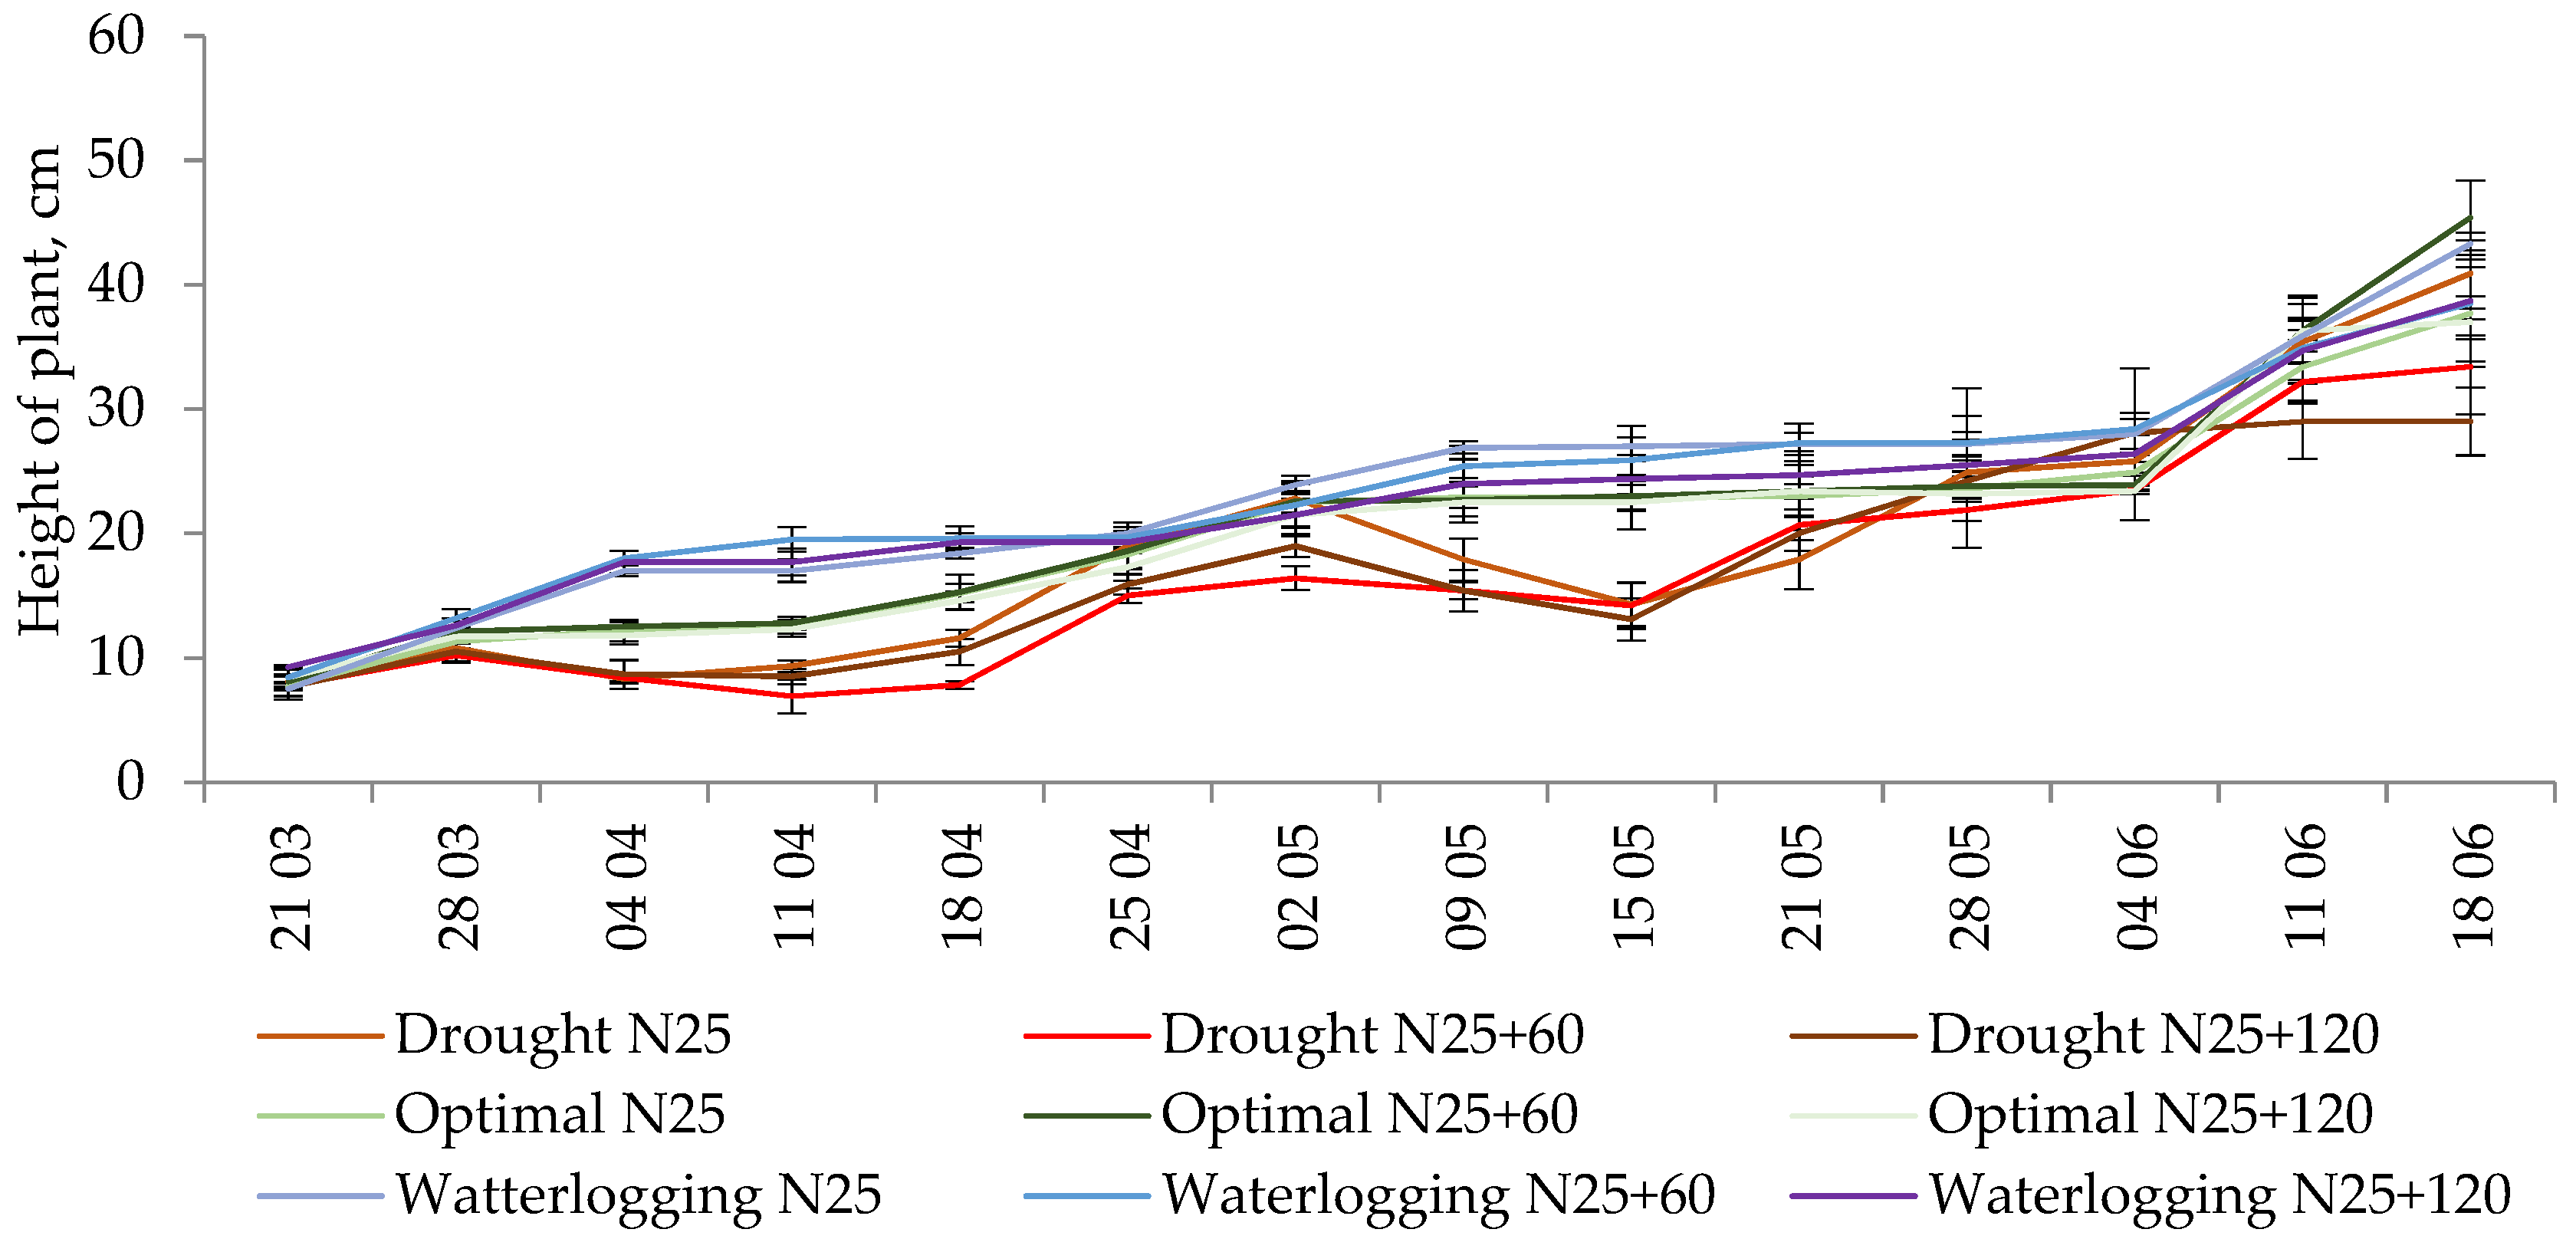
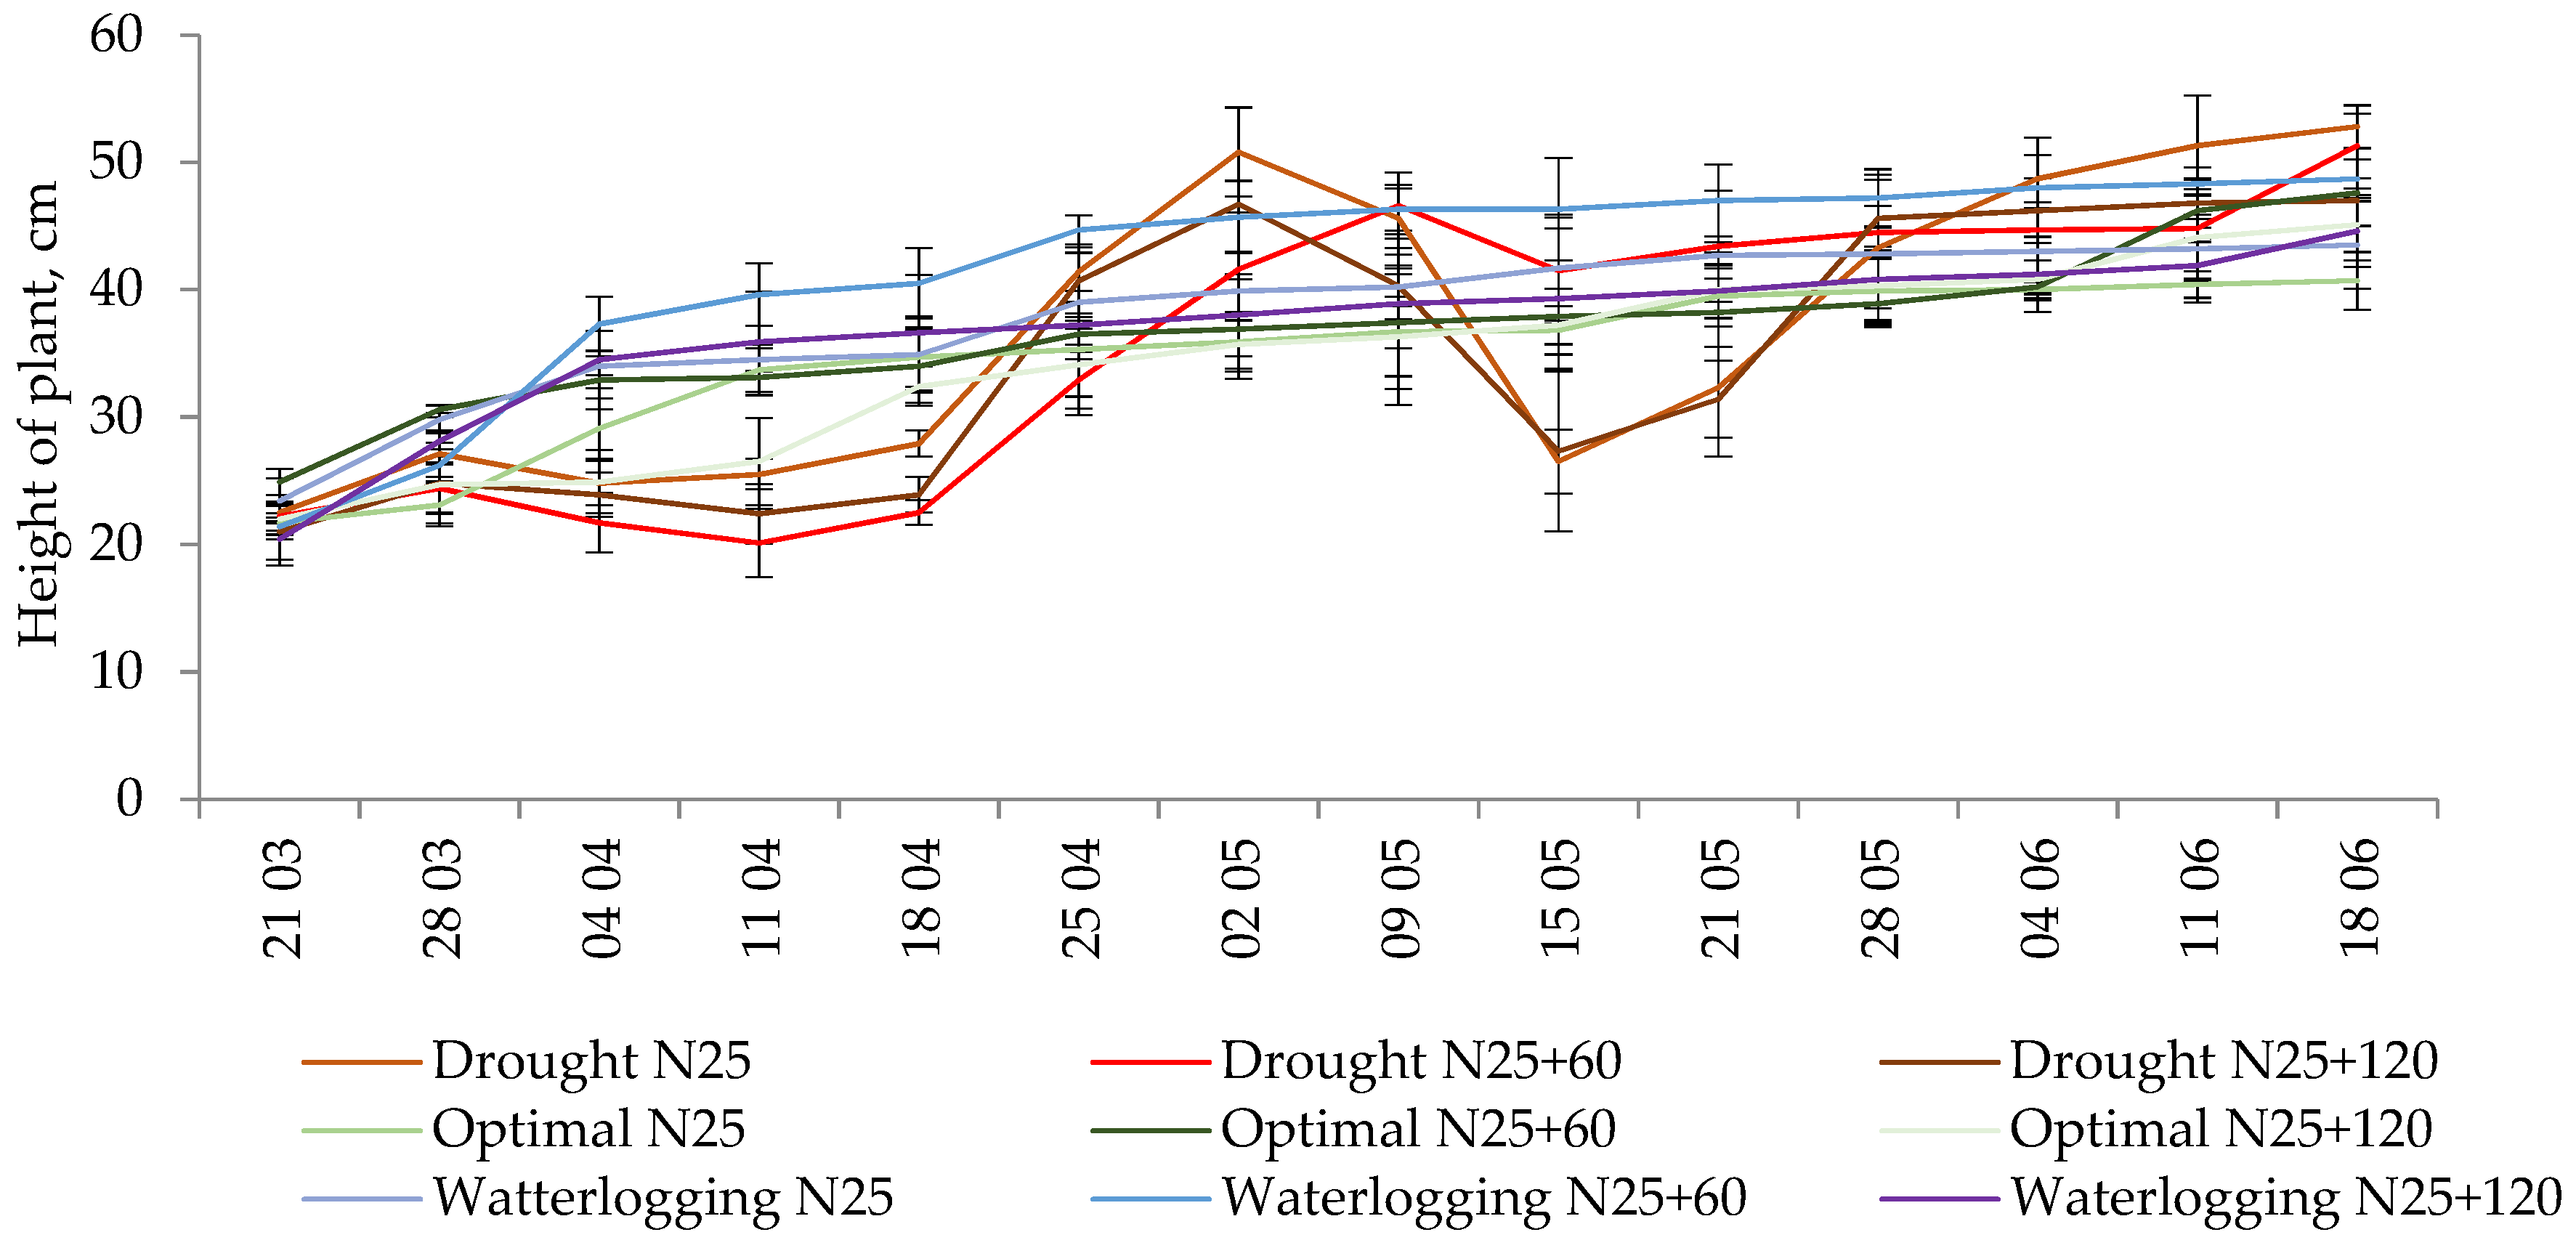
3.1. Growing Dynamics

Both in the early and the later growth stages of clover and timothy under drought simulation conditions, plant height was found to be significantly lower than under optimum soil moisture conditions (Figure 4 and Figure 5). Plant recovery from drought took three weeks (21 days).
Under the simulated waterlogging conditions, clover and timothy growth was initially stimulated; however, after waterlogging cessation, when the soil moisture content was reduced, the plant height was not significantly different from the plant heights under the optimum soil moisture conditions, especially under more intensive application of N. Under drought and waterlogging stresses, clover and timothy heights were lower at the higher fertilization rates during both stages of perennial grass growth. Clover was more sensitive to drought stress compared to timothy.

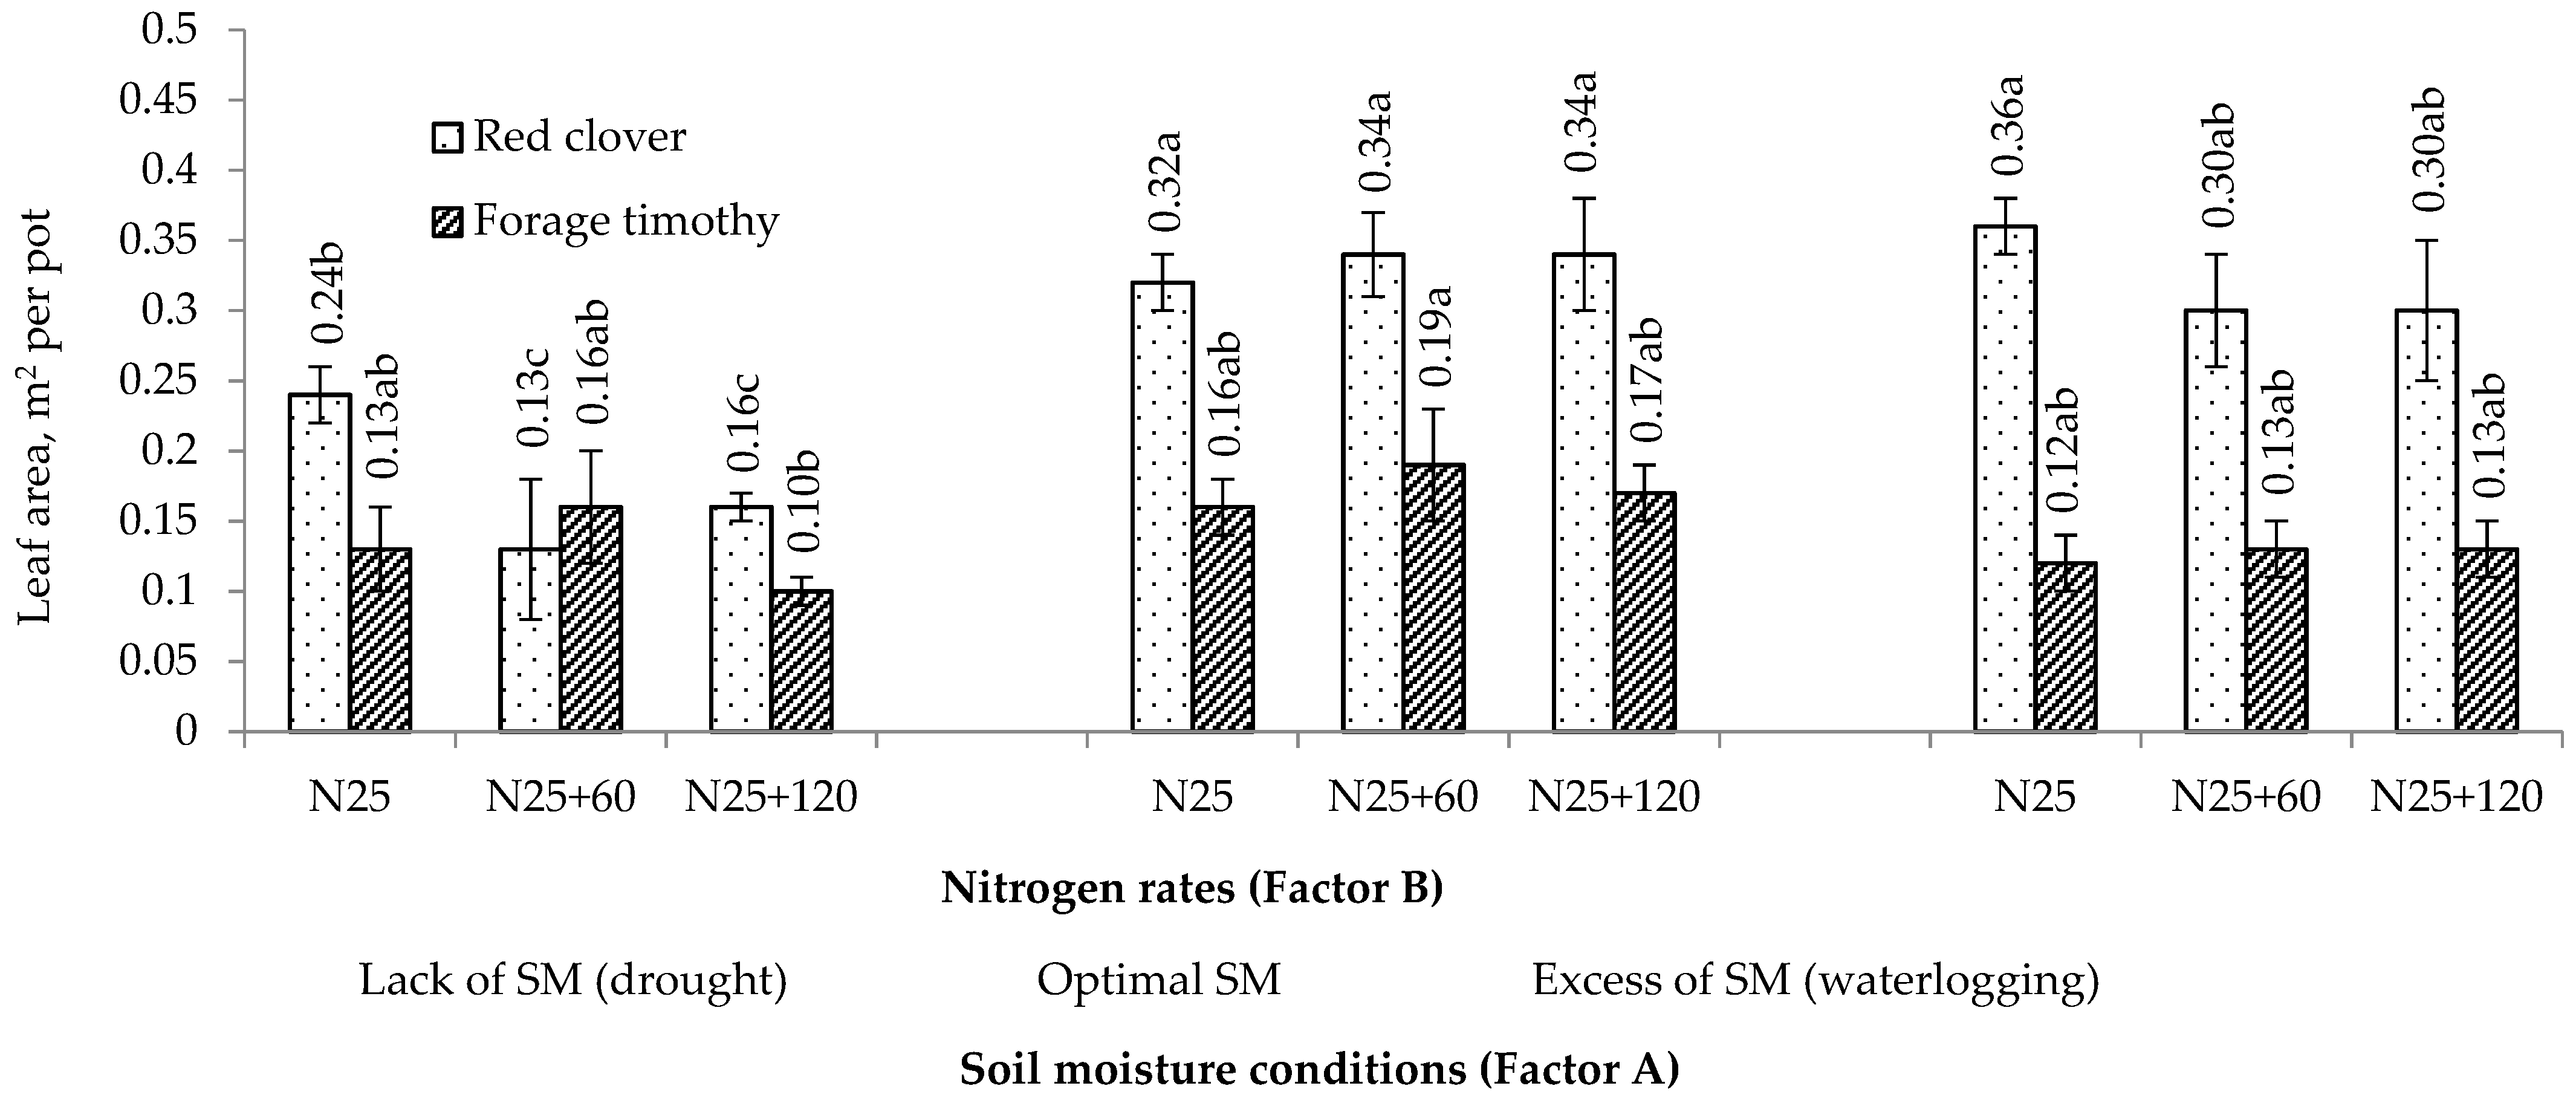
3.2. Assimilating Leaf Area

Under drought simulation conditions, the assimilating leaf area of clover was significantly lower than under optimum soil moisture and waterlogging simulation conditions, ranging from 25.0 to 61.8 and from 33.3 to 56.7%, respectively (Figure 6). Under drought simulation conditions, the assimilating leaf area of clover decreased significantly by 45.8 and 33.3% as the N rate increased, compared to the minimum N rate.
Different soil moisture conditions and N rates did not have any significant effect on the assimilating leaf area of timothy. Positive and statistically significant correlations were found between the assimilating leaf area of clover and number of plants (r2 = 0.88, p < 0.01), and between the assimilating leaf area of timothy and number of vegetative tillers (r2 = 0.72, p < 0.01).

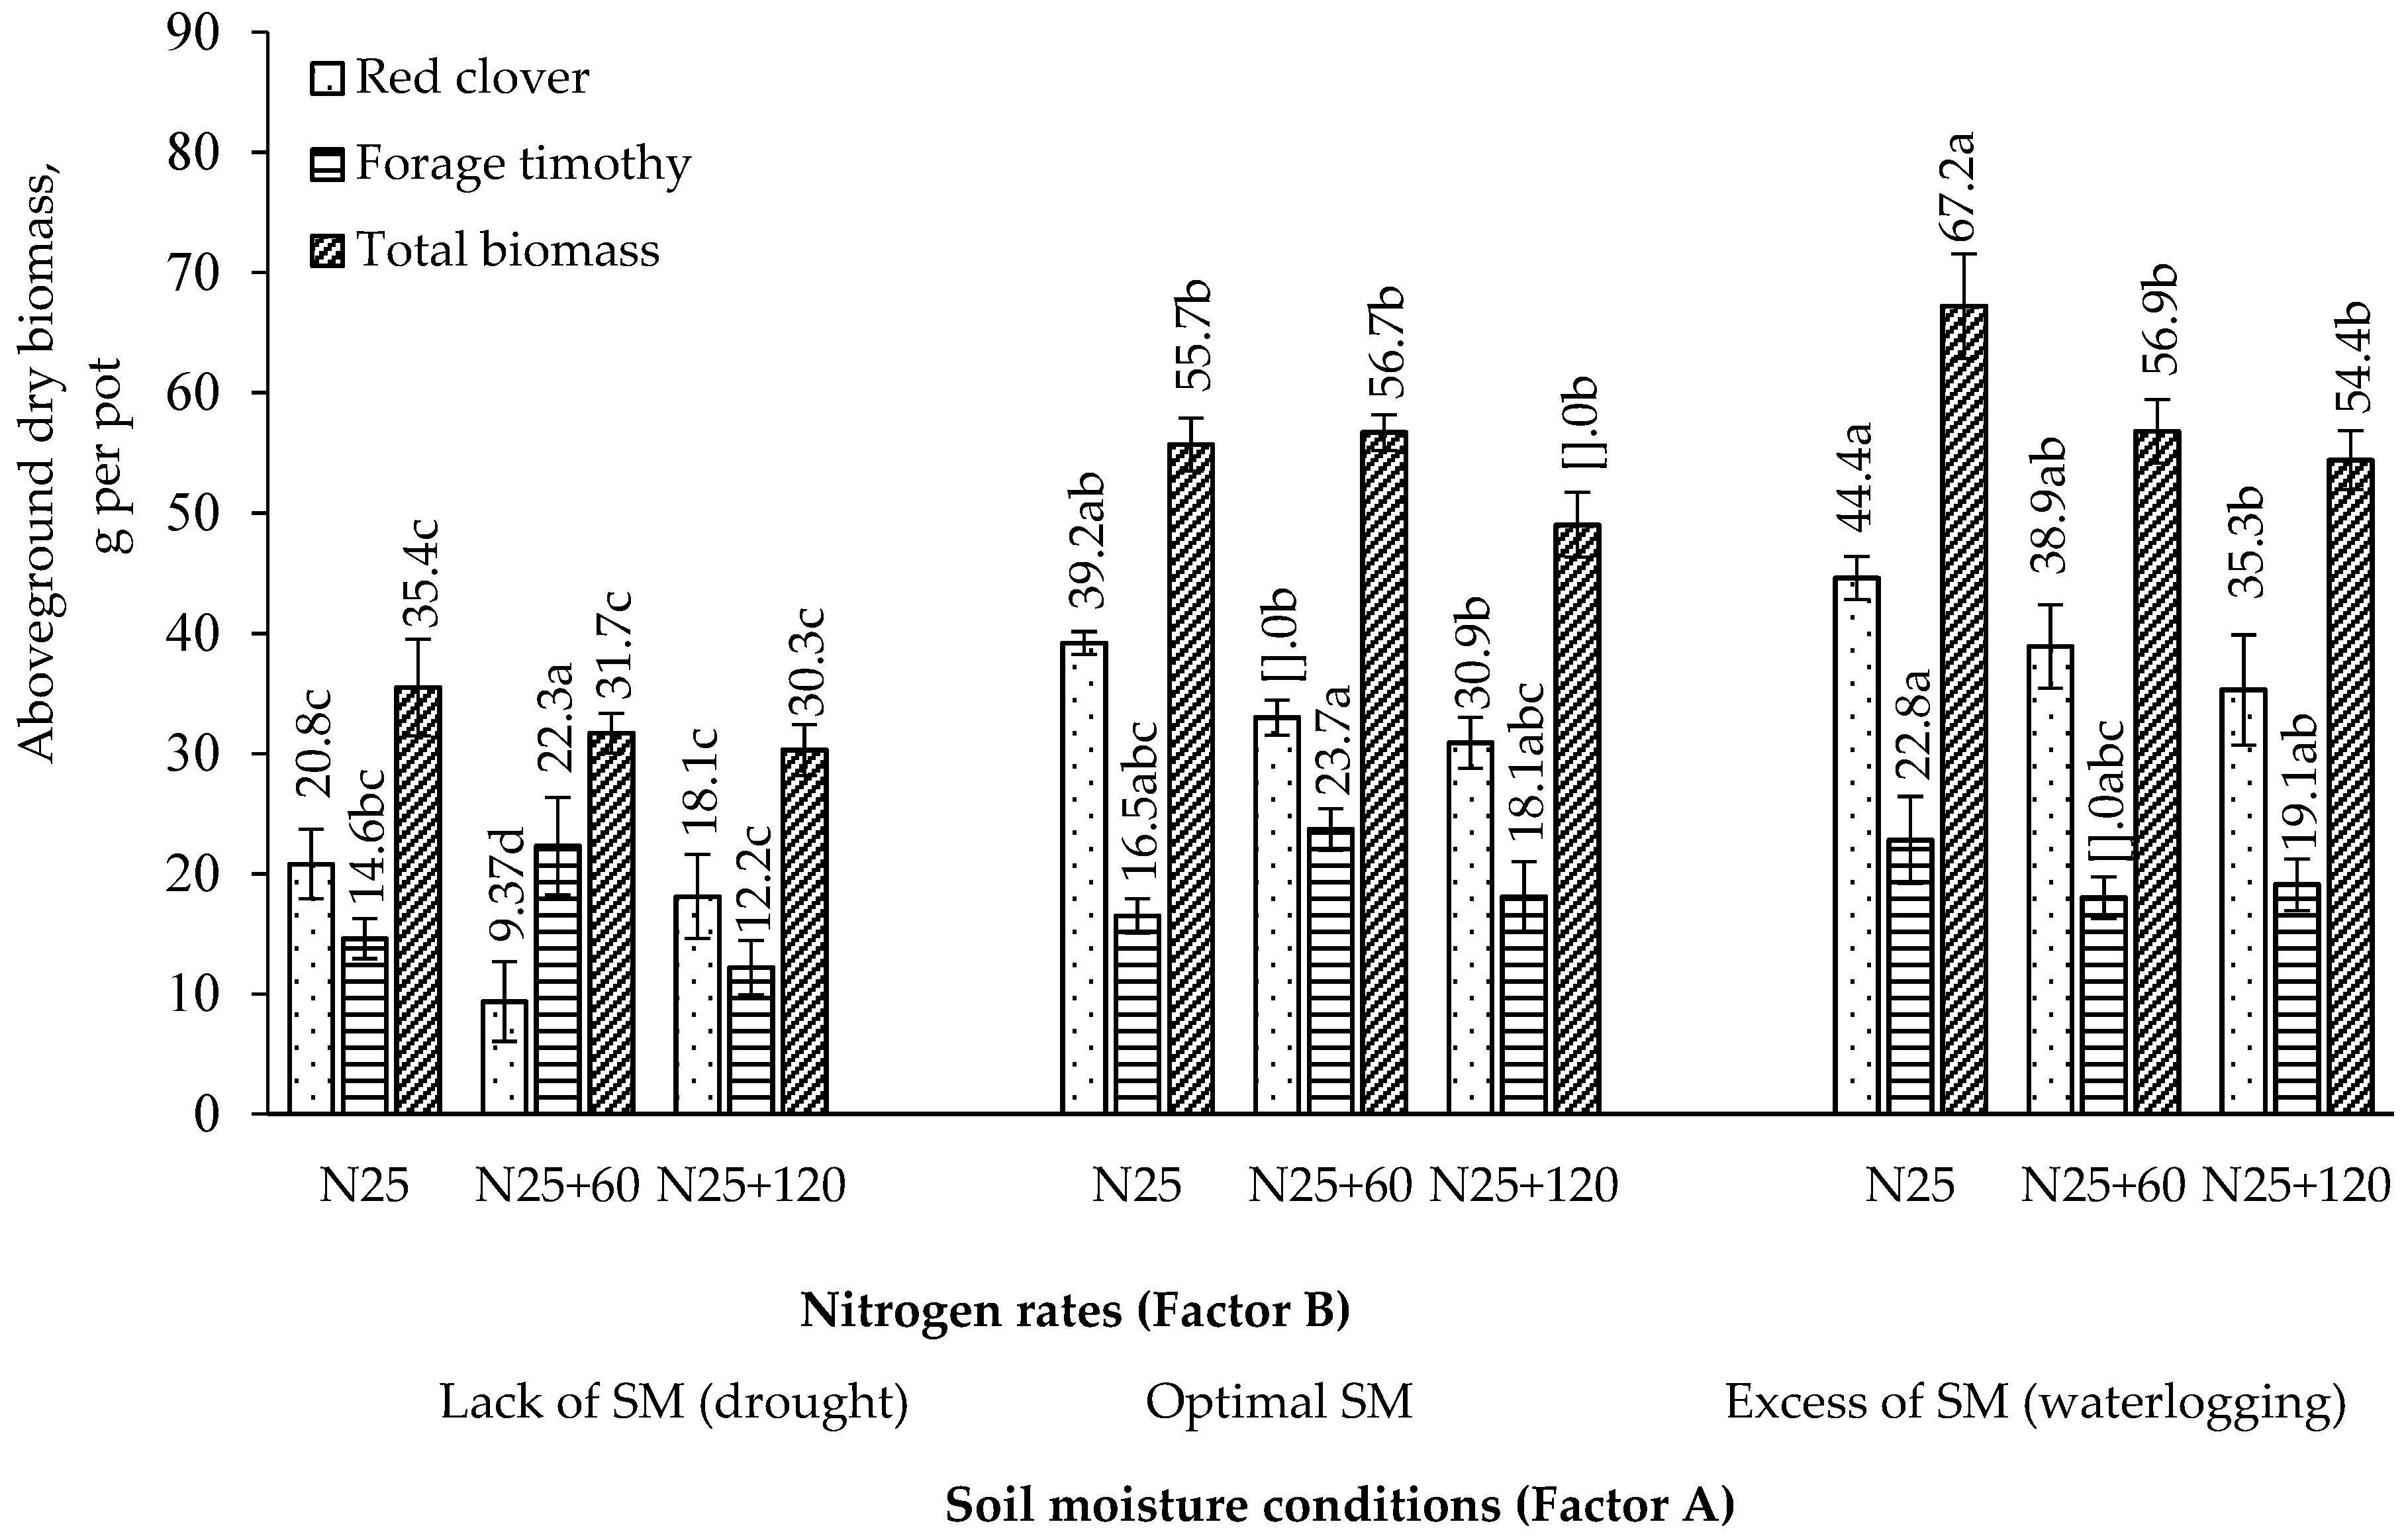
3.3. Aboveground Dry Biomass

Under drought simulation conditions, the aboveground dry biomass of the clover/timothy mixture was significantly lower compared to that under optimum soil moisture and waterlogging simulation conditions, ranging from 36.3 to 44.1 and from 44.2 to 47.2%, respectively (Figure 7). This was related to the fact that under drought simulation conditions, the aboveground dry biomass of clover was significantly lower by 46.9 to 71.6 and 51.5 to 75.9% compared to that under the optimum soil moisture and waterlogging simulation conditions. Under drought simulation conditions, the aboveground dry biomass of clover was found to be significantly lower by 55.0 and 48.2%, and that of timothy significantly higher by 22.6 and 35.4%, when fertilized at the N25+60 rate, compared to the minimum and maximum N rates. Under simulated waterlogging conditions, increasing the N rate resulted in a significant decrease of 15.5 and 19.0% in the aboveground dry biomass of the clover and timothy mixture compared to the lowest N rate. Under simulated waterlogging conditions, when fertilized at the highest N rate, the aboveground dry biomass of clover was found to be significantly lower by 20.9% compared to the lowest fertilization rate.
The aboveground dry biomass of clover was dependent on the number of plants (r2 = 0.78, p < 0.01) and the assimilating leaf area (r2 = 0.83, p < 0.01), while that of timothy was dependent on the number of vegetative tillers (r2 = 0.46, p < 0.05).

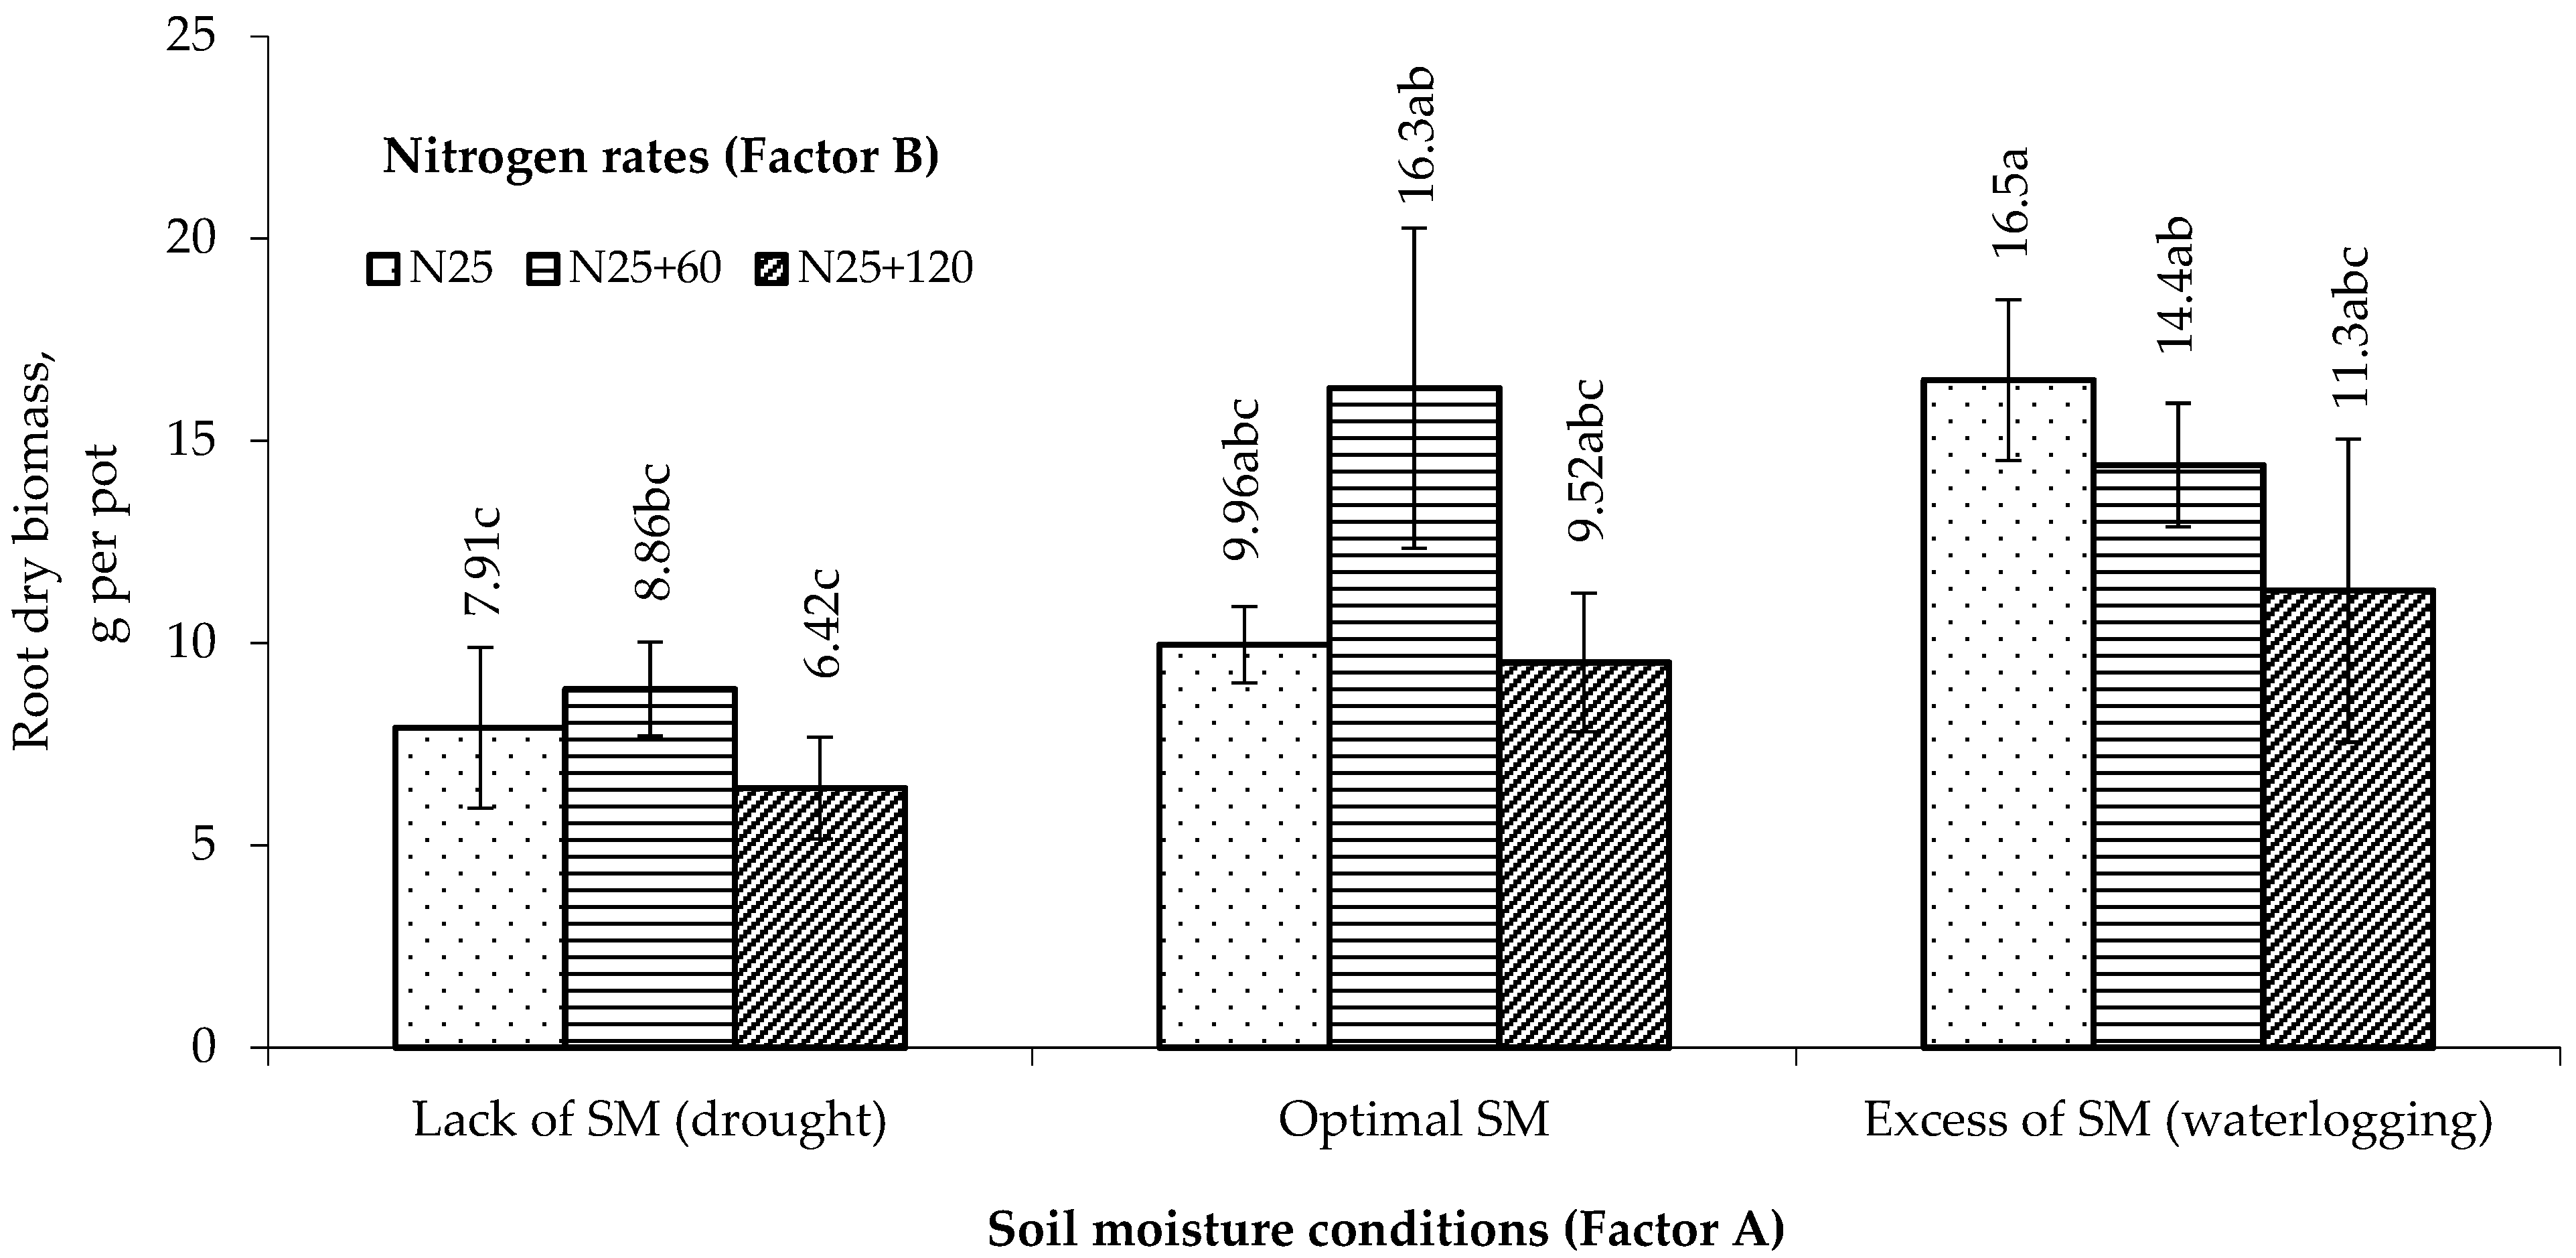
3.4. Root Dry Biomass

Under drought simulation conditions, the root dry biomass of the clover and timothy mixture was found to be less than that under both optimum soil moisture and waterlogging conditions (Figure 8). Under drought and waterlogging simulation conditions, increasing the N rate up to N145 showed a decreasing trend in root biomass, compared to the minimum rate. A positive, strong and statistically significant correlation was found between the root dry biomass of the clover and timothy mixture, and the aboveground dry biomass (r2 = 0.74, p < 0.01).

3.5. Nutritive Value

Under drought simulation conditions, the crude protein content of the aboveground biomass of the clover and timothy mixture was found to be significantly higher at the highest N fertilization rate compared to the optimal soil moisture and waterlogging simulation conditions at the same fertilization rate, 13.4 and 12.5%, respectively (Table 1). Under optimum soil moisture conditions, the crude protein content of the aboveground biomass of the clover and timothy mixture was found to be significantly lower by 9.9% at the highest rate of N compared to the lowest rate.
Under drought simulation conditions, the crude protein content of the aboveground biomass of the clover and timothy mixture was found to be significantly lower by 5.8%, and the crude fibre content significantly higher by 14.8%, when fertilized at an N25+60 rate compared to the lowest N rate. Under waterlogging conditions, the crude ash content of the aboveground biomass of the clover and timothy mixture was significantly higher when fertilized at the N25+60 rate than under optimal soil moisture and drought simulation conditions at the same N rate, 21.0 and 21.8% respectively. Under drought simulation conditions, the crude ash content of the aboveground biomass of the clover and timothy mixture was found to be significantly lower by 16.9% and 22.7% when the N rate was higher compared to the minimum rate.

4. Discussion

4.1. Productivity of Forage Grasses

The results of this study showed that red clover and timothy were more susceptible to drought and excess moisture stress when heavily fertilized with N. Bahrani et al. [23] and Wang et al. [24] have indicated that drought treatments cause a reduction in plant height. According to Chai et al. [25] post-drought recovery of perennial grasses depended on the recovery of existing leaf tissue and the regeneration of new tissue from crowns, stolons and roots. The results of our study showed that under drought simulation conditions, there was a significant decrease in and total aboveground biomass of the mixture of red clover and timothy, compared to the conditions of simulation of optimum soil moisture and waterlogging. Marshall et al. [26] showed that severe drought significantly reduced the growth rate of clover stolons and leaf development compared to heavily watered plants. Wang et al. [24] reported that with increasing intensity and duration of drought stress, plant aboveground biomass decreased while root biomass increased. Hajibabaee et al. [27] and Fariaszewska et al. [28] found that morphological and physiological parameters, as well as the productivity of forage plants, decreased under drought stress. Drought-induced reductions in forage grass productivity depend on species [29] and genotype [30]. According to the latter author, drought stress significantly reduced the dry matter yield of red clover, especially when grown in a mixture with festulolium (Festulolium braunii) [31]. Kizekova et al. [32] and Tucak et al. [33] found high sensitivity of red clover to drought stress. According to Kørup et al. [34], drought caused a decrease in dry matter yield for all species and cultivars of perennial grasses during the drought period. In our study, timothy produced higher average aboveground mass under moisture excess conditions compared to drought conditions. According to Mäkinen et al. [35], timothy had a low capacity to adapt to climatic extremes, especially in the early growth stages. Eneji et al. [36] reported that timothy was sensitive to water stress and only produced the highest yields under optimal irrigation conditions. According to Ploschuk et al. [37], waterlogging conditions only slightly inhibited shoot and root growth of perennial forage grasses. Malik et al. [38] reported that waterlogging did not have any significant effect on aboveground and root dry mass of forage legumes. Authors investigated mostly sole crops, and, in our experiment, timothy was grown in mixture with clover therefore it was less sensitive to waterlogging.
Under drought and waterlogging stresses, increasing the N rate resulted in a significant decrease in clover aboveground biomass compared to the minimum rate, as well as the total aboveground biomass of the mixture decreased under waterlogging stress. Under drought stress conditions, the highest aboveground dry biomass of timothy was found when fertilized at the N25+60 rate. Basal and Szabó [39] indicated that high N rate enhanced most traits of forage crops under drought stress conditions. Abraha et al. [40] reported that higher irrigation combined with high N application significantly improved the dry matter yields of forage grasses. According to Jiménez et al. [41], high nutrient availability did not always intensify the growth of forage grasses under waterlogging conditions.
The results showed that increasing the N rate showed a downward trend in plant root biomass under waterlogging conditions. Wasaya et al. [42] argued that roots were the main organs that responded to changes in soil moisture, and adapted and maintained plant productivity under drought conditions. Drought affected most root properties and reduced root biomass [23,43]. Drought stress reduced shoot weight of forage crops, but had no effect on root weight, also resulting in a greater root/shoot ratio [44].

4.2. Nutritive Value of Forage Grasses

Under drought simulation conditions, increasing the N rate increased the crude protein and crude fibre contents in the aboveground biomass of the clover and timothy mixture, while the crude ash content decreased. Rostamza et al. [5] reported that under soil moisture deficit conditions, the crude protein and crude ash contents in the aboveground biomass of plants decreased and the fibre content increased compared to optimum conditions. Küchenmeister et al. [45] determined, that the effect of drought on nutritive values was considerably less pronounced than that on the yield. N fertilisation increased the crude protein content in the aboveground biomass of forage grasses, while it decreased the crude fibre content [46,47].

5. Conclusions

Under drought and waterlogging stresses, fertilization of a red clover and timothy mixture with high nitrogen rates is ineffective. The recovery of the clover and timothy mixture after drought takes 21 days. The aboveground dry biomass of the clover and timothy mixture grown under drought conditions was significantly lower by 36.3 to 47.2% than under optimum soil moisture and waterlogging conditions. The root biomass of forage grass mixtures was lowest under drought conditions when fertilized at the highest N rate (N25+120). The aboveground biomass of clover grown under different soil moisture conditions depended on the number of plants (r2 = 0.78, p < 0.01) and the assimilating leaf area (r2 = 0.83, p < 0.01), and that of timothy on the number of vegetative tillers (r2 = 0.46, p < 0.05).
Under drought simulation conditions, increasing the N rate increases the crude protein and crude fibre contents in the aboveground biomass of the clover and timothy mixture, while the crude ash content decreases.

Author Contributions

Conceptualization, A.M., I.A. and Z.K.; Data curation, R.K., A.R. and I.A.; Formal analysis, A.M., A.R., I.A. and Z.K.; Funding acquisition, R.V.; Investigation, A.M., R.K., A.R., I.A. and Z.K.; Methodology, A.M., R.V. and I.A.; Project administration, R.V.; Resources, R.V. and R.K.; Supervision, A.M.; Validation, A.M.; Visualization, A.R.; Writing—original draft, A.M.; Writing—review & editing, R.V., R K., A.R., I.A. and Z.K. All authors have read and agreed to the published version of the manuscript.

Funding

This project has received funding from the Research Council of Lithuania (LMT), agreement No. S-SIT-20-4.

Institutional Review Board Statement

Not applicable.

Informed Consent Statement

Not applicable.

Data Availability Statement

Not applicable.

Acknowledgments

We are grateful for the English language revision by David Richard Arney.

Conflicts of Interest

The authors declare no conflict of interest.

References

  1. Jeroch, H.; Pilipavičius, V.; Mikulionienė, S.; Steinhöfel, O.; Matusevičius, P. Feed—Conventional and Ecological; Vitae Litera: Kaunas, Lithuania, 2015; p. 292. [Google Scholar]
  2. Stonevičius, E.; Štaras, A.; Valiuškevičius, G. Forecast of soil water regime changes in Lithuania under different climate change scenarios. Geography 2008, 44, 17–25. [Google Scholar]
  3. IPCC Publishes Full Report Climate Change 2013. The Physical Science Basis. Available online: https://www.ipcc.ch/2013/01/30/ipcc-publishes-full-report-climate-change-2013-the-physical-science-basis/ (accessed on 15 October 2021).
  4. Gasiūnas, V.; Misevičienė, S.; Bastienė, N.; Adamonytė, I.; Aleknevičienė, V.; Magyla, R. General Recommendations for the Implementation of Regulated Drainage Innovation; Vytautas Magnus University Publishing Center: Kaunas, Lithuania, 2019; p. 47. [Google Scholar]
  5. Rostamza, M.; Chaichi, M.R.; Jahansouz, M.R.; Alimadadi, A. forage quality, water use and nitrogen utilization efficiencies of pearl millet (Pennisetum americanum L.) grown under different soil moisture and nitrogen levels. Agric. Water Manag. 2011, 98, 1607–1614. [Google Scholar] [CrossRef]
  6. Fahad, S.; Bajwa, A.A.; Nazir, U.; Anjum, S.A.; Farooq, A.; Zohaib, A.; Sadia, S.; Nasim, W.; Adkins, S.; Saud, S.; et al. Crop production under drought and heat stress: Plant responses and management options. Front. Plant Sci. 2017, 8, 1–16. [Google Scholar] [CrossRef] [PubMed] [Green Version]
  7. Perera, R.S.; Cullen, B.R.; Eckard, R.J. Growth and physiological responses of temperate pasture species to consecutive heat and drought stresses. Plants 2019, 8, 227. [Google Scholar] [CrossRef] [PubMed] [Green Version]
  8. Bodner, S.B.; Robles, M.D. Enduring a decade of drought. Patterns and drivers of vegetation change in a semi-arid grassland. J. Arid Environ. 2017, 136, 1–14. [Google Scholar] [CrossRef] [Green Version]
  9. Grant, K. Sensitivity of Mesic Temperate Grassland to Increased Climate Variability—Biomass Production, Forage Quality and Plant-Plant Interactions. Doctoral Dissertation, University of Bayreuth, Bayreuth, Germany, 2015; p. 245. [Google Scholar]
  10. Staniak, M.; Kocon´, A. Forage grasses under drought stress in conditions of Poland. Acta Physiol. Plant 2015, 37, 1–10. [Google Scholar] [CrossRef] [Green Version]
  11. Tong, C.; Hill, C.B.; Zhou, G.; Zhang, X.Q.; Jia, Y.; Li, C. Opportunities for improving waterlogging tolerance in cereal crops—physiological traits and genetic mechanisms. Plants 2021, 10, 1560. [Google Scholar] [CrossRef]
  12. Manik, S.M.N.; Pengilley, G.; Dean, G.; Field, B.; Shabala, S.; Zhou, M. Soil and crop management practices to minimize the impact of waterlogging on crop productivity. Front. Plant Sci. 2019, 10, 1–23. [Google Scholar] [CrossRef] [Green Version]
  13. Cardoso, J.A.; Rincón, J.; Jiménez, J.C.; Noguera, D.; Rao, I.M. Morpho-anatomical adaptations to waterlogging by germplasm accessions in a tropical forage grass. AoB Plants 2013, 5, 1–14. [Google Scholar] [CrossRef] [Green Version]
  14. Hussein, M.M.; Alva, A.K. Growth, yield and water use efficiency of forage sorghum as efficiency of forage sorghum as affected by NPK fertilizer and deficit irrigation. Am. J. Plant Sci. 2014, 5, 2134–2140. [Google Scholar] [CrossRef] [Green Version]
  15. Saud, S.; Fahad, S.; Yajun, C.; Ihsan, M.Z.; Hammad, H.M.; Nasim, W.; Amanullah, Jr.; Arif, M.; Alharby, H. Effects of nitrogen supply on water stress and recovery mechanisms in Kentucky bluegrass plants. Front. Plant Sci. 2017, 8, 1–18. [Google Scholar] [CrossRef] [PubMed] [Green Version]
  16. Capstaff, N.M.; Miller, A.J. Improving the yield and nutritional quality of forage crops. Front. Plant Sci. 2018, 9, 1–18. [Google Scholar] [CrossRef] [PubMed] [Green Version]
  17. Helgadόttir, Á.; Suter, M.; Gylfadόttir, T.Ó.; Kristjánsdottir, T.A.; Lüscher, A. Grass-legume mixtures sustain strong yield advantage over monocultures under cool maritime growing conditions over a period of 5 years. Ann. Bot. 2018, 122, 337–348. [Google Scholar] [CrossRef] [PubMed] [Green Version]
  18. Elsalahy, H.H.; Bellingrath-Kimura, S.D.; Roß, C.L.; Kautz, T.; Döring, T.F. Crop resilience to drought with and without response diversity. Front. Plant Sci. 2020, 11, 1–16. [Google Scholar] [CrossRef] [PubMed]
  19. Benjamin, J.G.; Nielsen, D.S. A method to separate plant roots from soil and analyze root surface area. Plant Soil 2004, 267, 225–234. [Google Scholar] [CrossRef]
  20. Januškevičius, A.; Mikulionienė, S. Feed Research Methods and Feed Nutrition; Aleksandras Stulginskis University Publishing Center: Kaunas, Lithuania, 2004; pp. 26–46. [Google Scholar]
  21. Fenta, B.A.; Driscoll, S.P.; Kunert, K.J.; Foyer, C.H. Characterization of drought tolerance traits in nodulated soya beans: The importance of maintaining photosynthesis and shoot biomass under drought-induced limitations on nitrogen metabolism. J. Agron. Crop Sci. 2012, 198, 92–103. [Google Scholar] [CrossRef] [Green Version]
  22. Raudonius, S. Application of statistics in plant and crop research: Important issues. Zemdirb. Agric. 2017, 104, 377–382. [Google Scholar] [CrossRef] [Green Version]
  23. Bahrani, M.J.; Bahrami, H.; Haghighi, A.A.K. Effect of water stress on ten forage grasses native or introduced to Iran. Grassl. Sci. 2010, 56, 1–5. [Google Scholar] [CrossRef]
  24. Wang, X.; Zhao, L.; Yan, B.; Shi, L.; Liu, G.; He, Y. Morphological and physiological responses of Heteropogon contortus to drought stress in a dry-hot valley. Bot. Stud. 2016, 57, 1–12. [Google Scholar] [CrossRef] [PubMed] [Green Version]
  25. Chai, Q.; Jin, F.; Merewitz, E.; Huang, B. Growth and physiological traits associated with drought survival and post-drought recovery in perennial turfgrass species. J. Amer. Soc. Hort. Sci. 2010, 135, 125–133. [Google Scholar] [CrossRef] [Green Version]
  26. Marshall, A.H.; Lowe, M.; Collins, R.P. Variation in response to moisture stress of young plants of interspecific hybrids between white clover (T. repens L.) and caucasian clover (T. ambiguum M. Bieb). Agriculture 2015, 5, 353–366. [Google Scholar] [CrossRef] [Green Version]
  27. Hajibabaee, M.; Azizi, F.; Zargari, K. Effect of drought stress on some morphological, physiological and agronomic traits in various foliage corn hybrids. Am.-Eurasian J. Agric. Environ. Sci. 2012, 12, 890–896. [Google Scholar]
  28. Fariaszewska, A.; Aper, J.; Van Huylenbroeck, J.; De Swaef, T.; Baert, J.; Pecio, Ł. Physiological and biochemical responses of forage grass varieties to mild drought stress under field conditions. Int. J. Plant Prod. 2020, 14, 335–353. [Google Scholar] [CrossRef] [Green Version]
  29. Staniak, M. The impact of drought stress on the yield and food value of selected forage grasses. Acta Agrobot. 2016, 69, 1–12. [Google Scholar] [CrossRef] [Green Version]
  30. Pornaro, C.; Serena, M.; Macolino, S.; Leinauer, B. Drought stress response of turf-type perennial ryegrass genotypes in a Mediterranean environment. Agronomy 2020, 10, 1810. [Google Scholar] [CrossRef]
  31. Staniak, M. Changes in yield and nutritive value of red clover (Trifolium pratense L.) and Festulolium (Festulolium braunii (K. Richt) A. Camus) under drought stress. Agric. Food Sci. 2019, 28, 27–34. [Google Scholar] [CrossRef]
  32. Kizekova, M.; Tomaškin, J.; Čunderlik, J.; Jančova, L.; Martincova, J. The yield stability and quality of legumes during two consecutive, extremely dry years. Poľnohospodárstvo/Agriculture 2013, 59, 167–177. [Google Scholar] [CrossRef] [Green Version]
  33. Tucak, M.; Popović, S.; Čupić, T.; Krizmanić, G.; Španić, V.; Meglič, V.; Radović, J. Assessment of red clover (Trifolium pratense L.) productivity in environmental stress. Poljoprivreda/Agriculture 2016, 2, 3–9. [Google Scholar] [CrossRef]
  34. Kørup, K.; Lærke, P.E.; Baadsgaard, H.; Andersen, M.N.; Kristensen, K.; Münnich, C.; Didion, T.; Jensen, E.S.; Mårtensson, L.M.; Jørgensen, U. Biomass production and water use efficiency in perennial grasses during and after drought stress. GCB Bioenergy 2018, 10, 12–27. [Google Scholar] [CrossRef] [Green Version]
  35. Mäkinen, H.; Kaseva, J.; Virkajärvi, P.; Kahiluoto, H. Gaps in the capacity of modern forage crops to adapt to the changing climate in northern Europe. Mitig. Adapt. Strateg. Glob. Chang. 2018, 23, 81–100. [Google Scholar]
  36. Eneji, A.E.; Inanaga, S.; Muranaka, S.; Li, J.; Hattori, T.; An, P.; Tsuji, W. Growth and nutrient use in four grasses under drought stress as mediated by silicon fertilizers. J. Plant Nutr. 2008, 31, 355–365. [Google Scholar] [CrossRef]
  37. PLoSchuk, R.A.; Grimoldi, A.A.; PLoSchuk, E.L.; Striker, G.G. Growth during recovery evidences the waterlogging tolerance of forage grasses. Crop Pasture Sci. 2017, 68, 574–582. [Google Scholar] [CrossRef]
  38. Malik, A.I.; Ailewe, T.I.; Erskine, W. Tolerance of three grain legume species to transient waterlogging. AoB Plants 2015, 7, 1–11. [Google Scholar] [CrossRef] [Green Version]
  39. Basal, O.; Szabó, A. The combined effect of drought stress and nitrogen fertilization on soybean. Agronomy 2020, 10, 384. [Google Scholar] [CrossRef] [Green Version]
  40. Abraha, A.B.; Truter, W.F.; Annandale, J.G.; Fessehazion, M.K. Forage yield and quality response of annual ryegrass (Lolium multiflorum) to different water and nitrogen levels. Afr. J. Range Forage Sci. 2015, 32, 125–131. [Google Scholar] [CrossRef] [Green Version]
  41. Jiménez, J.C.; Cardoso1, J.A.; Arango-Londoño, D.; Fischer, G.; Rao, I. Influence of soil fertility on waterlogging tolerance of two Brachiaria grasses. Agron. Colomb. 2015, 33, 20–28. [Google Scholar] [CrossRef]
  42. Wasay, A.; Zhang, X.; Fang, Q.; Yan, Z. Root phenotyping for drought tolerance. A review. Agronomy 2018, 8, 241. [Google Scholar] [CrossRef] [Green Version]
  43. De Vries, F.T.; Brown, C.; Stevens, C.J. Grassland species root response to drought: Consequences for soil carbon and nitrogen availability. Plant Soil 2016, 409, 297–312. [Google Scholar] [CrossRef]
  44. Skinner, R.H.; Comas, L.H. Root Distribution of Temperate Forage Species Subjected to Water and Nitrogen Stress. Crop Sci. 2010, 50, 2178–2185. [Google Scholar] [CrossRef]
  45. Küchenmeister, K.; Küchenmeister, F.; Kayser, M.; Wrage-Mönnig, N.; Isselstein, J. Influence of drought stress on nutritive value of perennial forage legumes. Int. J. Plant Prod. 2013, 7, 693–710. [Google Scholar]
  46. Kering, M.K.; Guretzky, J.; Funderburg, E.; Mosali, J. Effect of nitrogen fertilizer rate and harvest season on forage yield, quality, and macronutrient concentrations in Midland Bermuda grass. Soil Sci. Plant Anal. 2011, 42, 1958–1971. [Google Scholar] [CrossRef]
  47. Delevatti, L.M.; Cardoso, A.S.; Barbero, R.P.; Leite, R.G.; Romanzini, E.P.; Ruggieri, A.C.; Reis, R.A. Effect of nitrogen application rate on yield, forage quality, and animal performance in a tropical pasture. Sci. Rep. 2019, 9, 1–9. [Google Scholar] [CrossRef] [PubMed]
Figure 1. Experimental site: (a) General view of greenhouse vegetative experiment of mixtures of red clover and timothy; (b) Greenhouse of Vytautas Magnus University Agriculture Academy, Lithuania. Coordinates: 54° 53′ 31.65″ N, 23° 50′ 15.76″ E longitude.
Agronomy 11 02572 g001
Figure 2. Experiment design of water regime.
Agronomy 11 02572 g002
Figure 3. Soil moisture dynamic during vegetative experiment.
Agronomy 11 02572 g003
Figure 4. Growing dynamics of red clover. Note, whiskers indicate standard errors of the means.
Agronomy 11 02572 g004
Figure 5. Growing dynamics of forage timothy. Note, whiskers indicate standard errors of the means.
Agronomy 11 02572 g005
Figure 6. Assimilating leaf area of red clover and forage timothy. Note, differences between the means of treatments for separate plant species, marked by different letters (a, b, c), are significant (p < 0.05). Whiskers indicate standard errors of the means. SM—soil moisture.
Agronomy 11 02572 g006
Figure 7. Aboveground dry biomass of red clover and forage timothy mixture. Note, differences between the means of treatments for separate plant species and total biomass, marked by different letters (a, b, c), are significant (p < 0.05). Whiskers indicate standard errors of the means. SM—soil moisture.
Agronomy 11 02572 g007
Figure 8. Root dry biomass of red clover and forage timothy mixture. Note. SM—soil moisture. The differences between the means of treatments, marked by different letters (a, b, c), are significant (p < 0.05). Whiskers indicate standard errors of the means.
Agronomy 11 02572 g008
Table 1. Nutritive Value of red clover and forage timothy mixture.
Soil Moisture Conditions
(Factor A)
Nitrogen Rates
(Factor B)
Crude Protein, %Crude Fibre, %Crude Ash, %
Lack of SM (drought)N2513.7 ± 0.10 abc28.4 ± 1.94 b17.2 ± 0.97 a
N25+6012.9 ± 0.26 cd32.6 ± 2.27 a14.3 ± 0.57 bc
N25+12014.4 ± 0.20 a29.4 ± 1.75 ab13.3 ± 0.32 c
Optimal SMN2514.1 ± 0.27 ab26.9 ± 0.90 b16.1 ± 1.14 ab
N25+6013.4 ± 0.20 abc29.7 ± 1.20 ab14.2 ± 0.62 bc
N25+12012.7 ± 0.43 cd28.7 ± 0.88 ab13.9 ± 0.56 bc
Excess of SM (waterlogging)N2513.2 ± 0.73 bcd28.4 ± 0.26 b15.6 ± 0.93 abc
N25+6012.2 ± 0.32 d27.3 ± 1.41 b17.3 ± 1.00 a
N25+12012.8 ± 0.56 cd29.7 ± 0.15 ab15.1 ± 1.61 abc
Note. Differences between the means of treatments in columns, marked by different letters (a, b, c, d), are significant (p < 0.05). Mean ± standard error. SM—soil moisture.
Publisher’s Note: MDPI stays neutral with regard to jurisdictional claims in published maps and institutional affiliations.

