Article

Chemical and Microbial Characterization of Washed Rice Water Waste to Assess Its Potential as Plant Fertilizer and for Increasing Soil Health

by
Abba Nabayi
1,2,
Christopher Teh Boon Sung
1,*,
Ali Tan Kee Zuan
1,
Tan Ngai Paing
1 and
Nurul Izzati Mat Akhir
1
1
Department of Land Management, Faculty of Agriculture, Universiti Putra Malaysia, UPM, Serdang 43400, Selangor, Malaysia
2
Department of Soil Science, Faculty of Agriculture, Federal University Dutse, PMB 7156, Dutse 720101, Jigawa State, Nigeria
*
Author to whom correspondence should be addressed.
Agronomy 2021, 11(12), 2391; https://doi.org/10.3390/agronomy11122391
Submission received: 19 October 2021 / Revised: 19 November 2021 / Accepted: 22 November 2021 / Published: 24 November 2021
(This article belongs to the Special Issue Bioprocessing of Organic Wastes for Potential Use in Agriculture)

Abstract

:
The wastewater from washed rice water (WRW) is often recommended as a source of plant nutrients in most Asian countries, even though most current research on WRW lack scientific rigor, particularly on the effects of rice washing intensity, volumetric water-to-rice ratio (W:R), and condition of the WRW before plant application. This research was thus carried out: (1) to determine how various rice washing intensities, fermentation periods (FP), and W:R would affect the nutrient content in WRW, and (2) to isolate, identify, and characterize the bacterial community from fermented WRW. The WRW was prepared at several rice washing intensities (50, 80, and 100 rpm), FP (0, 3, 6, and 9 days), and W:R (1:1, 3:1, and 6:1). The concentrations of all elements (except P, Mg, and Zn) and available N forms increased with increasing FP and W:R. Beneficial N-fixing and P- and K-solubilizing bacteria were additionally detected in WRW, which helped to increase the concentrations of these elements. Monovalent nutrients NH 4 + -N, NO 3 - N , and K are soluble in water. Thus, they were easily leached out of the rice grains and why their concentrations increased with W:R. The bacteria population in WRW increased until 3 days of fermentation, then declined, possibly because there was an insufficient C content in WRW to be a source of energy for bacteria to support their prolonged growth. While C levels in WRW declined over time, total N levels increased then decreased after 3 days, where the latter was most possibly due to the denitrification and ammonification process, which had led to the increase in NH 4 + -N and NO 3 - N . The optimum FP and W:R for high nutrient concentrations and bacterial population were found to be 3 to 9 days and 3:1 to 6:1, respectively. WRW contained nutrients and beneficial bacterial species to support plant growth.

1. Introduction

It is often claimed, but without strong scientific evidence, that washed rice water waste is a beneficial plant fertilizer and soil amendment. Milled rice is very often washed prior to cooking to remove the bran, dust, and dirt [1]. However, rice washing can also remove a significant amount of water-soluble nutrients from the rice grains, and the water after rice washing is often simply discarded into the environment. This discarded wastewater is called washed rice water (WRW), and this wastewater has been found to contain several essential plant nutrients, such as (in mg L−1) 40 to 150 of N, 4.19 to 10.14 NO 3 - N , 2.57 to 39.72 NH 4 + -N, 43 to 1630 P, 51 to 200 K, 8 to 2944 Ca, 36 to 1425 Mg, and 27 to 212 S [1,2,3,4,5,6].
In addition, several studies have shown that plant watering with WRW had increased the height, stem diameter, and yield of tomato, water spinach, eggplants, pak choy, lettuce, mushroom, adenium, chilli, and mustard green plants [7,8,9,10,11,12,13,14]. Furthermore, WRW was found to contain plant growth-promoting bacteria (PGPB), such as Bacillus and Lactobacillus spp. [11]. Their presence in WRW is particularly noteworthy because these bacteria can inhibit plant pathogens, produce phytohormones and siderophores, solubilize potassium and phosphate, and fix nitrogen [15,16].
Unfortunately, nearly all WRW studies come from gray literature. Most of these WRW studies either lacked scientific rigor or lacked essential information or additional measurements needed to explain their experimental observations. There is also a dearth of WRW studies. Nabayi et al. [5] found only 41 papers on the reuse of WRW specifically for agriculture, and of this total, only 10% of them were published in indexed journals, and the rest, either in non-indexed journals (61%) or undergraduate research reports (29%).
Consequently, the benefits of WRW remain inconclusive. Nevertheless, the advocacy for its reuse for irrigation and liquid plant fertilizer remains popular, particularly in Asia. In Indonesia, for instance, the village of Polo Geulis in Central Bogor practices a centralized water-saving system where WRW is collected from the village citizens, after which the water is used to irrigate and fertilize their neighborhood crops of herbs and vegetables [17]. A similar WRW-reuse communal program is also implemented, as part of the local government program, in the village of Lambangkuning, Indonesia [18].
WRW is wastewater, and like any other wastewater, it ought to be reused as part of water governance. Large amounts of WRW are produced, as rice, the second most widely grown cereal in the world is eaten by nearly half of the world’s population [19]. Between 2020 and 2021, about 504 million tons of rice were consumed worldwide [20], and the figure is expected to increase with population growth. Even with a conservative estimate of using only 1 L of water to wash every 1 kg of rice grains, this would work out to at least 504 billion L of WRW being produced within this period. Furthermore, global freshwater demand is expected to increase by 55% by 2050 [21]. This increase is mainly due to detrimental climate change and increasing world population, driving WWAP [22] to advocate more effective water governance so that wastewater, rather than just being discarded into the environment, is instead reused, treated, or recycled. The AQUASTAT database of the Food and Agriculture Organization of the United Nations (FAO) additionally estimated that more than half of the global freshwater withdrawals are simply discarded as wastewater into the environment [22]. Municipal water demand, in particular, corresponds to 11% of the global freshwater withdrawal, but out of this, only 3% is consumed, with the remaining 8% simply discarded, unused, as wastewater.
But if WRW is to be advocated for reuse for agriculture, its benefits must be shown in at least two stages: first, that the liquid WRW itself has the properties and nutrient levels that are beneficial to plant growth, and second, that the application of WRW will increase the crop growth and yield in both the short- and long-term, as well as improve the biological and physicochemical soil properties [5].
This paper addressed the first stage; that is, to characterize the chemical and biological properties of the liquid WRW to assess its use as plant fertilizer and for promoting soil health. First, this study measured both the macro and micronutrients in WRW, as well as the plant-available N forms of NH 4 + -N and NO 3 - N (typically, only the macronutrients are analyzed by other studies). Second, this paper determined how washing rice with several volumes of water and washing intensities would affect the chemical properties and nutrient content in WRW. Third, WRW will ferment over time, so this study additionally determined whether fermentation would lead to higher nutrient content and higher microbial count in WRW, as well as encourage the presence of beneficial bacteria, particularly the N-fixing and P- and K-solubilizing bacteria. That WRW could promote beneficial soil bacteria would increase WRW’s worth as a natural fertilizer and soil amendment. The knowledge obtained from this study will provide basic information on the potential use of WRW in agriculture, and perhaps lead to follow-up studies that will rigorously evaluate the benefits of plant watering with WRW on crop growth and yield.

2. Materials and Methods

2.1. Chemicals and Media

All the chemicals and microbiological media utilized in the experiment were of analytical grade. Nutrient agar and nutrient broth were purchased from Merck (Darmstadt, Germany) and supplied via Sigma-Aldrich (Selangor, Malaysia).

2.2. Sample Preparation

The rice brand used was ‘Rambutan’ (Padiberas Nasional Berhad, Malaysia), which is a commercially available medium-grained rice in Malaysia. The WRW was prepared in a volumetric water-to-rice (W:R) ratio of 1:1, 3:1, and 6:1. The mixture was obtained using a stand mixer (Bossman Kaden matte BK-100S, Tokyo, Japan) and at three (3) different washing intensity of 50 (0.139 g Force), 80 (0.357 g Force), and 100 (0.559 g Force) rpm at a constant time of 90 s. The mixture (rice grains and water) was then separated using sieves (500-micron sizes). For the fermented batches, the same water was kept at room temperature in a container for periods of either 3, 6, or 9 days for fermentation before use. After every selected fermentation cycle, the fermented water was subjected to chemical analyses.

2.3. Chemical Analyses

The total C, N, and S content of the rice samples were determined using CNS analyzer (LECO Corp., St. Joseph, MI, USA); and P, K, Ca, Mg, Cu, Zn, and B were analyzed using graphite furnace atomization atomic absorption spectrophotometer (AAS) (Perkin Elmer, PinAAcle, 900T, Waltham, MI, USA) after dry ashing the rice samples following Nelson and Sommers [23], where 1 g of the oven-dried (at 105 °C) ground rice grains were used. The samples were put into a muffle furnace and subjected to a series of temperatures from 200 °C, to 550 °C, for 6 hrs where complete ash was obtained for further assays. Samples from the WRW at different speeds, fermentation periods, and W:R ratios were filtered through a Whatman 1 filter paper (11 µm size) and analyzed for pH, EC, total N, nitrate, ammonia, C, S, P, K, Ca, Mg, Cu, Zn, and B. Total N, C, and S were analyzed using a CNS analyzer (LECO Corp., St. Joseph, MI, USA); and P, K, Ca, Mg, Cu, Zn, and B were analyzed using atomic absorption spectrophotometer (AAS) (Perkin Elmer, PinAAcle, 900T, Waltham, MI, USA). The detection and quantification limits of the AAS were 0.01–1 ng mL−1 and 4 nM, respectively. Ammonium and nitrate were determined by the Kjeldahl procedure [23]. pH and EC were measured using the 827 pH and EC lab meter (Metrohm AG, Zurich, Switzerland) [24]. The different batches of the WRW were also subjected to bacterial population, isolation, and characterization.

2.4. Culture Media and Bacterial Growth

Tryptic soy agar (TSA) was used for the bacterial population growth of the various fermented washed rice water following Tan et al. [25]. The bacterial growth was counted from each fermented WRW type (in triplicates) to determine the bacterial population. Each plate with a range of 30 to 300 colonies was selected and counted as colony-forming units (CFU) per mL of the sample [26].

2.5. Bacterial Isolations

Different bacteria were isolated from different samples (of different fermentation periods) based on shape, color, and sizes following the bacterial growth and population count. The isolates were sub-cultured several times to obtain the pure colony, which was subsequently subjected to a series of tests. The isolated bacteria were grouped based on fermentation period irrespective of the W:R ratio and washing intensity used.

2.6. N2 Fixation, Phosphate Solubilization, and Potassium Solubilization

The qualitative N2 fixation ability was ascertained by growing the isolates on Nfb medium (N-free solid malate medium) following [27]. While phosphate and potassium solubilizing ability of the isolated microbes were determined using Pikovskaya [28] and Aleksandrov agar media [29], respectively.

2.7. Bacterial Identification Using 16S rRNA Gene Sequence

The selected isolates were identified by partial sequencing of the 16S rRNA gene. Genomic DNA was isolated from the (WRW) bacterial culture by using the Genomic DNA Mini Kit (Favorgen) (Pingtung Agricultural Biotechnology Park, Pingtung, Taiwan). 16S rRNA gene was amplified using universal forward 27F (5′-AGAGTTTGATCMTGGCTCAG-3′) and reverse 1492R (5′-GGTTACCTTGTTACGACTT-3′) primers (Apical Science Sdn. Bhd. Selangor, Malaysia). 30 μL reaction mixture was prepared, each containing 2 μL of DNA template, 15 μL of Master mix (containing 10× PCR Reaction Buffer, dNTPs mix, Taq polymerase, MgCl2 and ultra-pure water), 10 μL of Nuclease free water, 1.5 μL each of forward and reverse primers. PCR reactions were carried out using a thermal cycler (MJ Mini Personal Thermal Cycler, Bio-Rad) with cycles as follows: denaturation for 4 min at 95 °C, 45 s at 95 °C, 45 s at 58 °C for annealing, 1 min at 72 °C for initial extension and final extension for 10 min at 72 °C. The amplified 16S rRNA gene was purified with a Gel/PCR DNA Fragments Extraction Kit (Favorgen) (Pingtung Agricultural Biotechnology Park, Pingtung, Taiwan) and outsourced for sequencing (Apical Scientific Sdn. Bhd., Selangor, Malaysia). The sequenced data were aligned and analyzed to identify the bacterium and its closest neighbors using BLAST (NCBI, Maryland, WA, USA).
The partial 16S rRNA gene sequences of the identified strains in this study were deposited in GenBank database (http://www.ncbi.nlm.nih.gov/GenBank/index.html, accessed on 10 November 2021) on 15 December, 2020 under accession numbers; MW365555.1 (Enterobacter ludwigii), MW365556.1 (Enterobacter sp.), MW365557.1 (Enterobacter sp.), MW365558.1 (Enterobacter mori), MW365561.1 (Enterobacter sp.), MW365562.1 (Enterobacter mori), MW365564.1 (Pantoea agglomerans), MW365565.1 (Stenotrophomonas maltophilia), MW365560.1 (Stenotrophomonas maltophilia), MW365563.1 (Klebsiella pneumoniae), MW365554.1 (Bacillus velezensis), MW365559.1 (Bacillus velezensis).

2.8. Phylogenetic Analysis

All the 16S rRNA gene sequences were aligned using ClustalW2 with the most closely related bacteria sequences obtained from the NCBI database using the MEGA software version 7. The similarities between the nucleotide sequences were computed using Hasegawa–Kishino–Yano model [30]. All positions containing gaps and missing data were eliminated from the dataset. The reference sequences were downloaded in FASTA format from the NCBI database, and a phylogenetic tree was constructed by the Maximum Likelihood method using MEGA7 software [31]. Tree topologies were evaluated by performing bootstrap analyzes using 1000 replications.

2.9. Data Analysis

Completely Randomized Design (CRD) in a factorial arrangement was used in the analysis of the WRW nutrient content study. A two-factor analysis between rice washing speed and W:R ratio was carried out to assess their effect on 0-day WRW (unfermented WRW). To include the effect of the fermentation period (3, 6, and 9 days), three-factor analysis was carried out with speed and W:R ratio factorially. All data were analyzed by analysis of variance (ANOVA) using R software package (version 4.1.1). Means were separated by the Tukey HSD test procedure at a threshold significance level of 5%. A uniform manifold approximation and projection (UMAP) analysis and interaction trends were further carried out on the measured chemical variables using the R-studio interface (version 1.4.1717) using the ‘uwot’ package (version 0.1.10) to provide additional meaningful information to the mean separation test [32].

3. Results

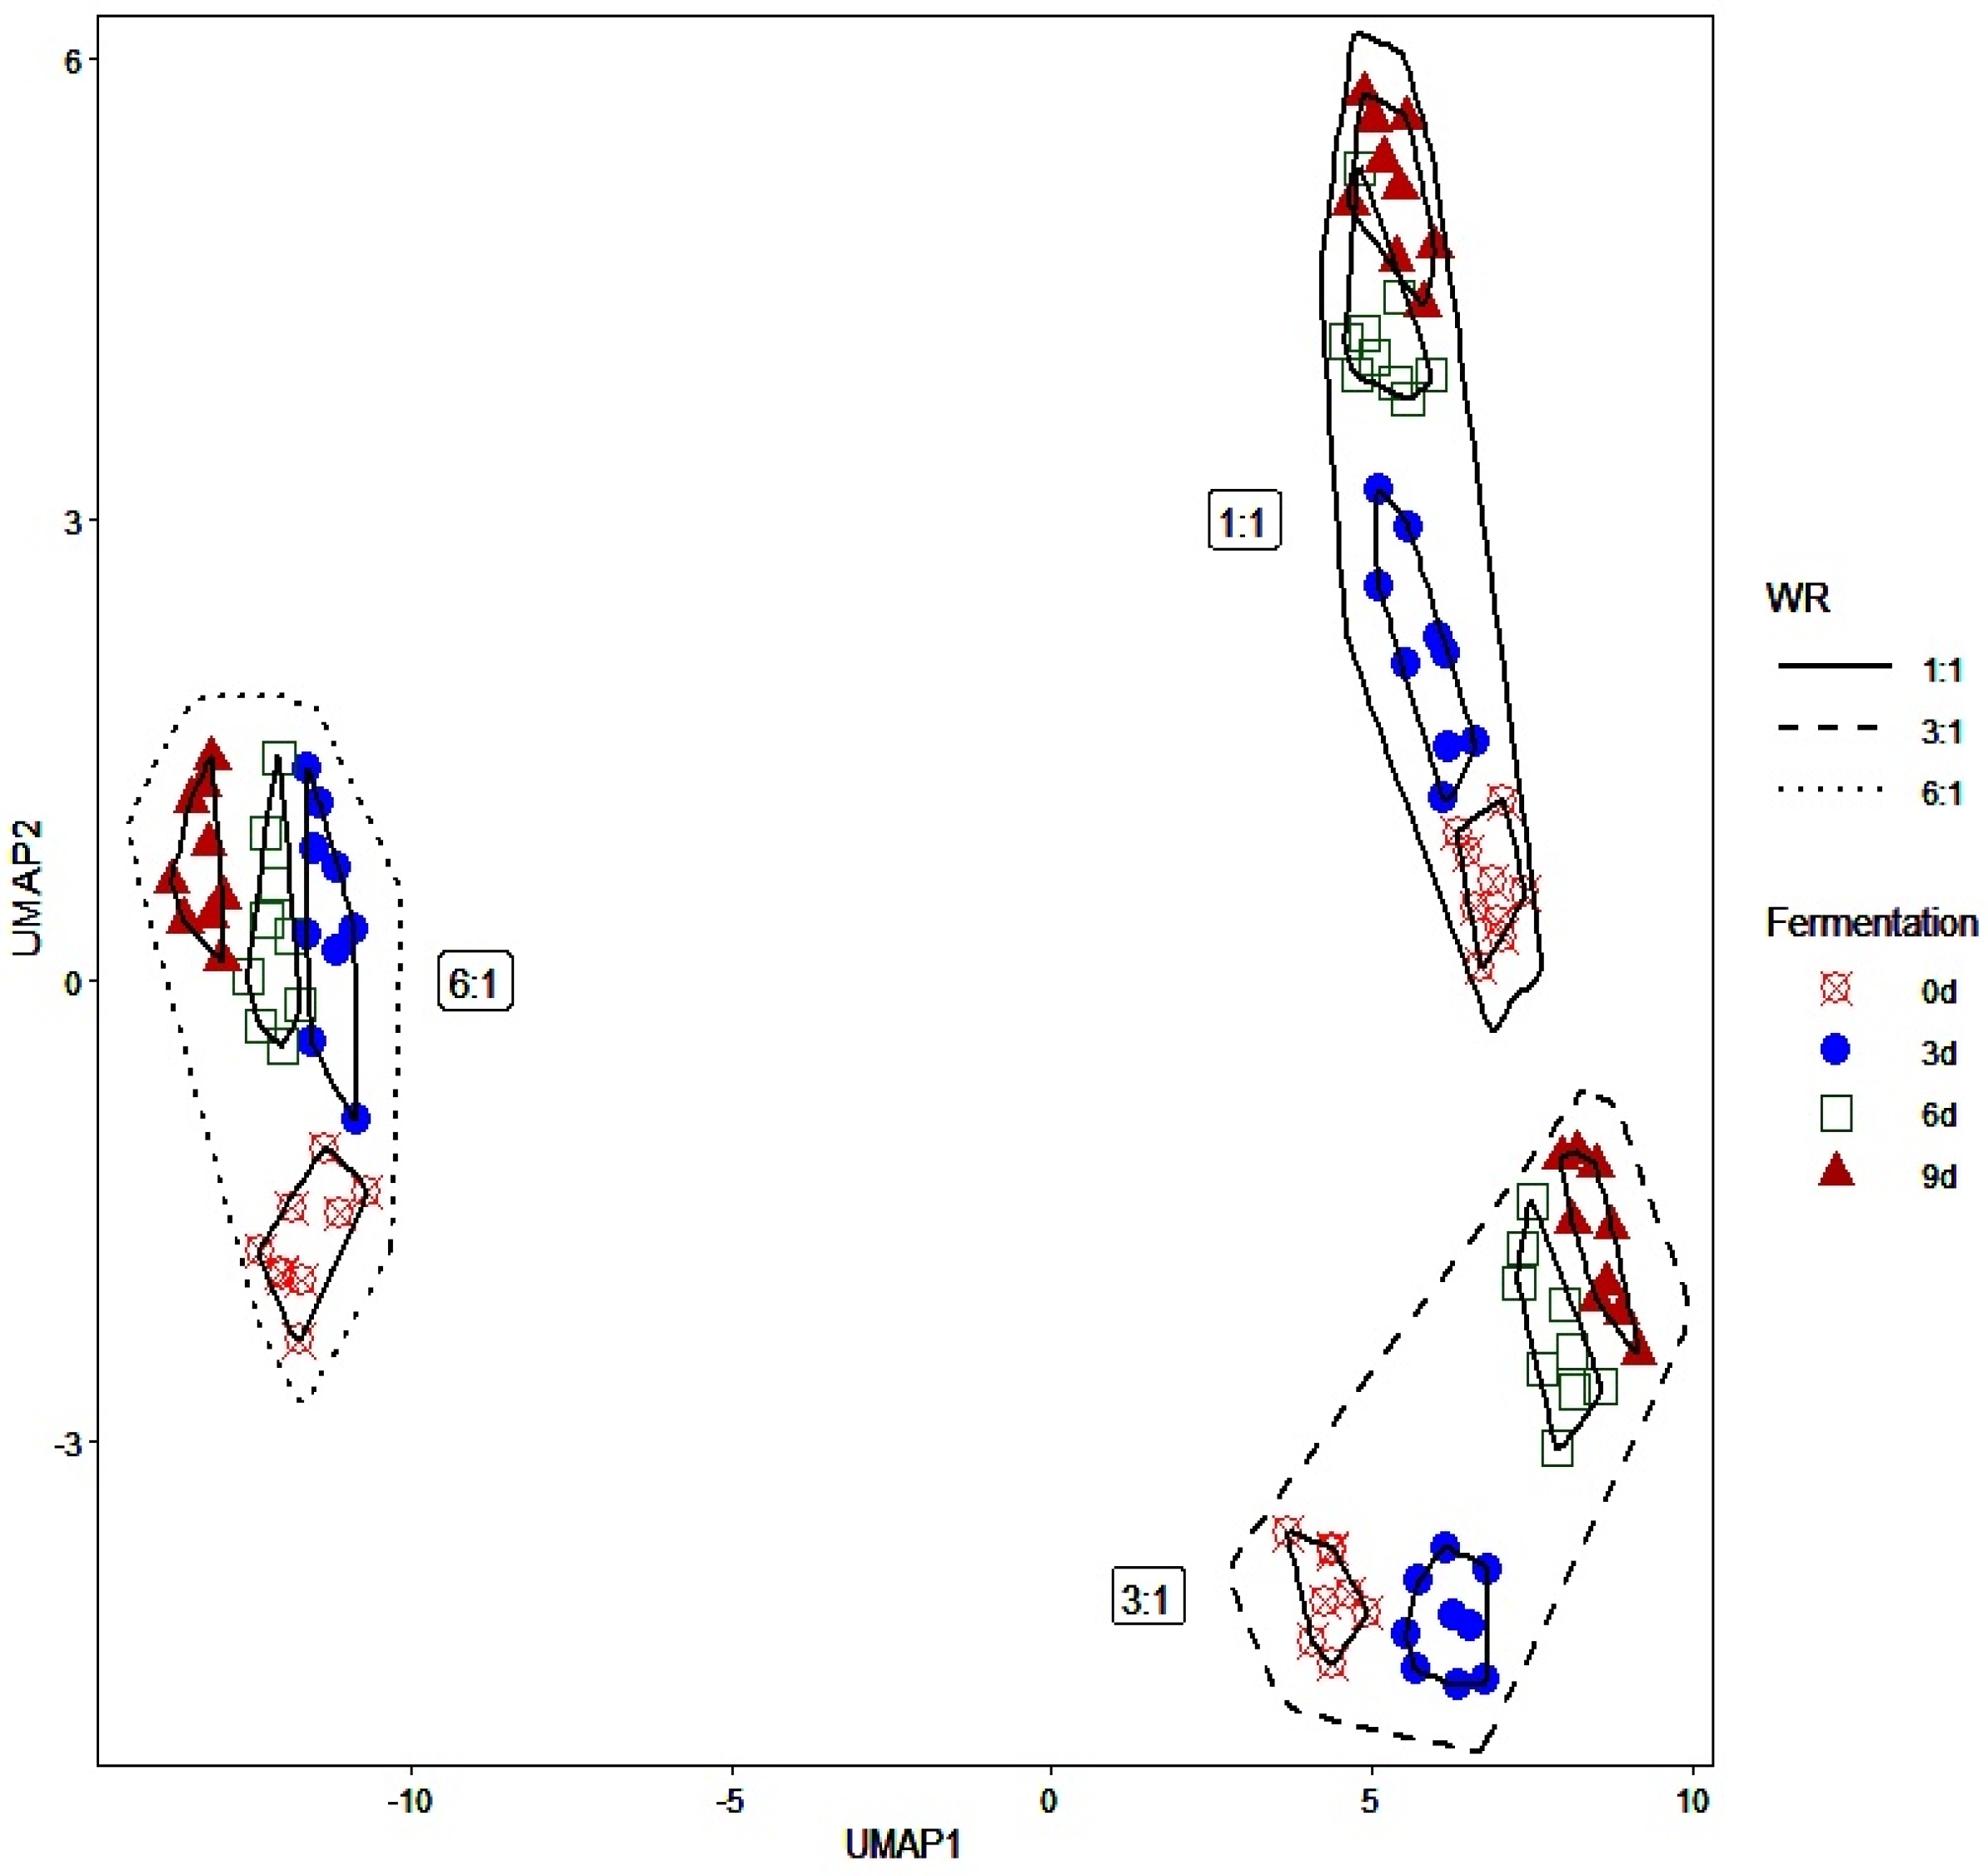
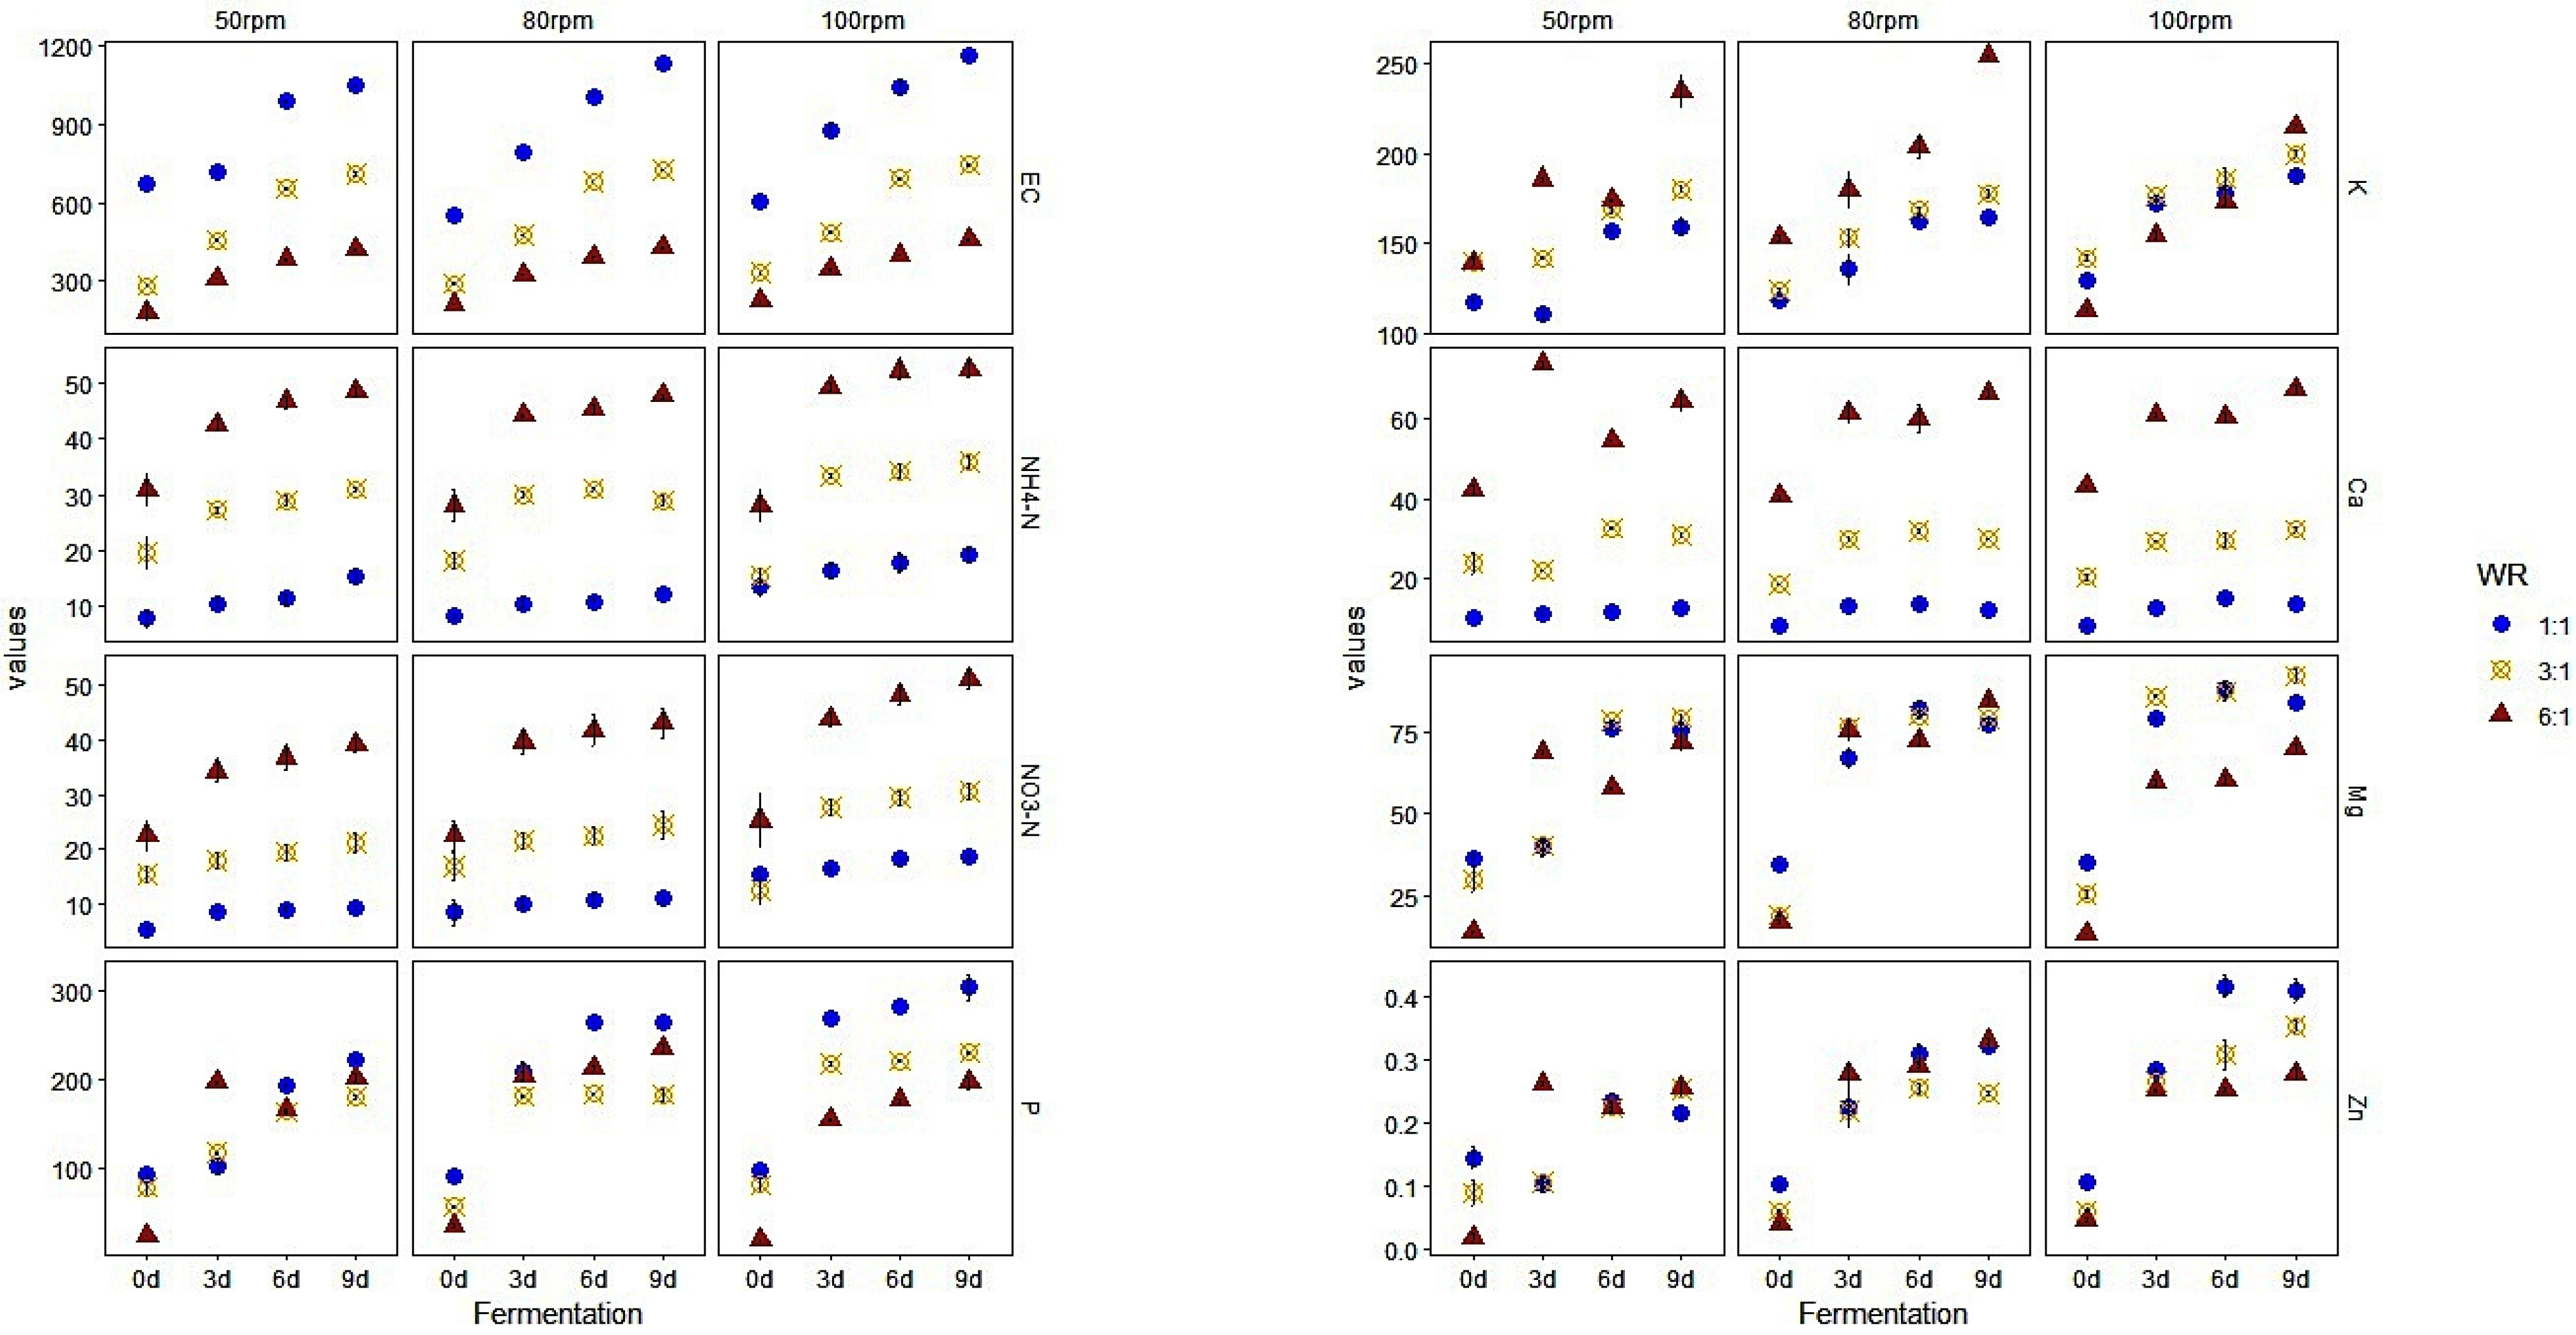
3.1. Chemical Properties and Elemental Concentrations in WRW

Washing rice at different speeds and various water:rice volumetric ratios (W:R) had leached out between 1.4 to 35.2% of all nutrients, with most of these losses from S (35.2%), NO 3 - N (14.5%), and K (11.1%), while the least element leached was Zn with 1.4% (Table 1). Specifically, washing rice lost nutrients by the following percentages: 35.2 S, 14.5 NO 3 - N , 11.1 K, 10.0 Mg, 9.7 C, 8.6 B, 8.1 NH 4 + -N, 4.9 P, 3.6 Cu, 3.3 Ca, 2.4 total N, and 1.4 Zn.
The unfermented WRW contained plant-available N forms, NH 4 + -N and NO 3 - N , at 24.1 and 19.9%, respectively, of its total N. As expected, tap water contained very little nutrients, as this was the municipal tap water that had been treated for safe human drinking and use, according to the National Water Standards [33].
Only the main effect of W:R was significant (p < 0.01) on the pH, C, C:N, NH 4 + -N, NO 3 - N , Ca, and S (Table 2a). Washing rice with the highest water volume (6:1) leached out the most C, available N ( NH 4 + -N and NO 3 - N ), Ca, and S, as well as producing the least change in pH. This was generally followed by W:R of 3:1. Interaction between washing intensity and W:R was significant on EC and the concentrations of total N, P, K, Mg, Cu, and Zn (Table 2b). Averaging across all washing intensities revealed that increasing W:R from 1:1 to 6:1 resulted in lower EC from 72 to 57.5% and lower concentrations in P, Mg, and Zn from 80 to 41, 62.8 to 46.9, and 87.5 to 58.3%, respectively. However, for K and Cu, their concentrations increased from 7.2 to 14.2% and 44 to 53%, respectively.
Note that Table 2 is only for unfermented WRW. Our full data set involved three W:R levels (1:1, 3:1, and 6:1), three washing intensities (50, 80, and 100 rpm), and four fermentation periods (0-day, 3-day, 6-day, and 9-day, with 0-day as the unfermented WRW). These many levels of factors and their various combinations had resulted in very intricate and unclear trends (3-way ANOVA results not shown). Consequently, a data visualization technique known as Uniform Manifold Approximation and Projection (UMAP) [34] was used to determine the influence of W:R, washing intensity, and fermentation on the chemical properties of WRW (Figure 1). This technique was much more effective in revealing trends. UMAP works similarly to Principle Component Analysis (PCA) in reducing large datasets by representing the data with fewer components or factors. Unlike PCA, however, UMAP does not assume data linearity.
UMAP shows that W:R and fermentation largely explained the data variance, with washing intensity having little or no impact on explaining the data variance (Figure 1). The UMAP revealed there were three main clusters, distinguished by the three W:R of 1:1 (solid line), 3:1 (long dashed line), and 6:1 (dotted line). Additionally, within each of these clusters, there were further four subclusters that were distinguished by the four fermentation groups: 0d (⊗ marker), 3d (⬤), 6d (□), and 9d (▲), where 0d, 3d, 6d and 9d denote fermentation at 0 (unfermented), 3, 6, and 9 days, respectively.
Longer WRW fermentation led to higher levels of NH 4 + -N, NO 3 - N , P, K, Ca, Mg, and Zn in the WRW (Figure 2). Longer WRW fermentation also increased EC (Figure 2) but decreased pH (Figure 3). Unlike other nutrients, longer WRW fermentation lowered Cu levels (Figure 3). C levels also generally declined with increased fermentation. How W:R affected the nutrient levels depending on the nutrient type. Generally, higher W:R ratios led to higher levels in WRW for NH 4 + -N, NO 3 - N , K, Ca, C, Cu, and S but lower levels for P, Mg, Zn, and EC.
Figure 2 and Figure 3 reveal that washing intensity had little to no effect on the nutrient levels, agreeing with the earlier UMAP analysis (Figure 1) and that data variance was mostly explained only by W:R and fermentation factors. One exception was total N (Figure 3). Total N levels peaked at 3d of fermentation, then declined thereafter, and total N level was the highest for 3:1 W:R. This was exceptional because the levels of other nutrients either increased or decreased with increasing W:R or fermentation period.

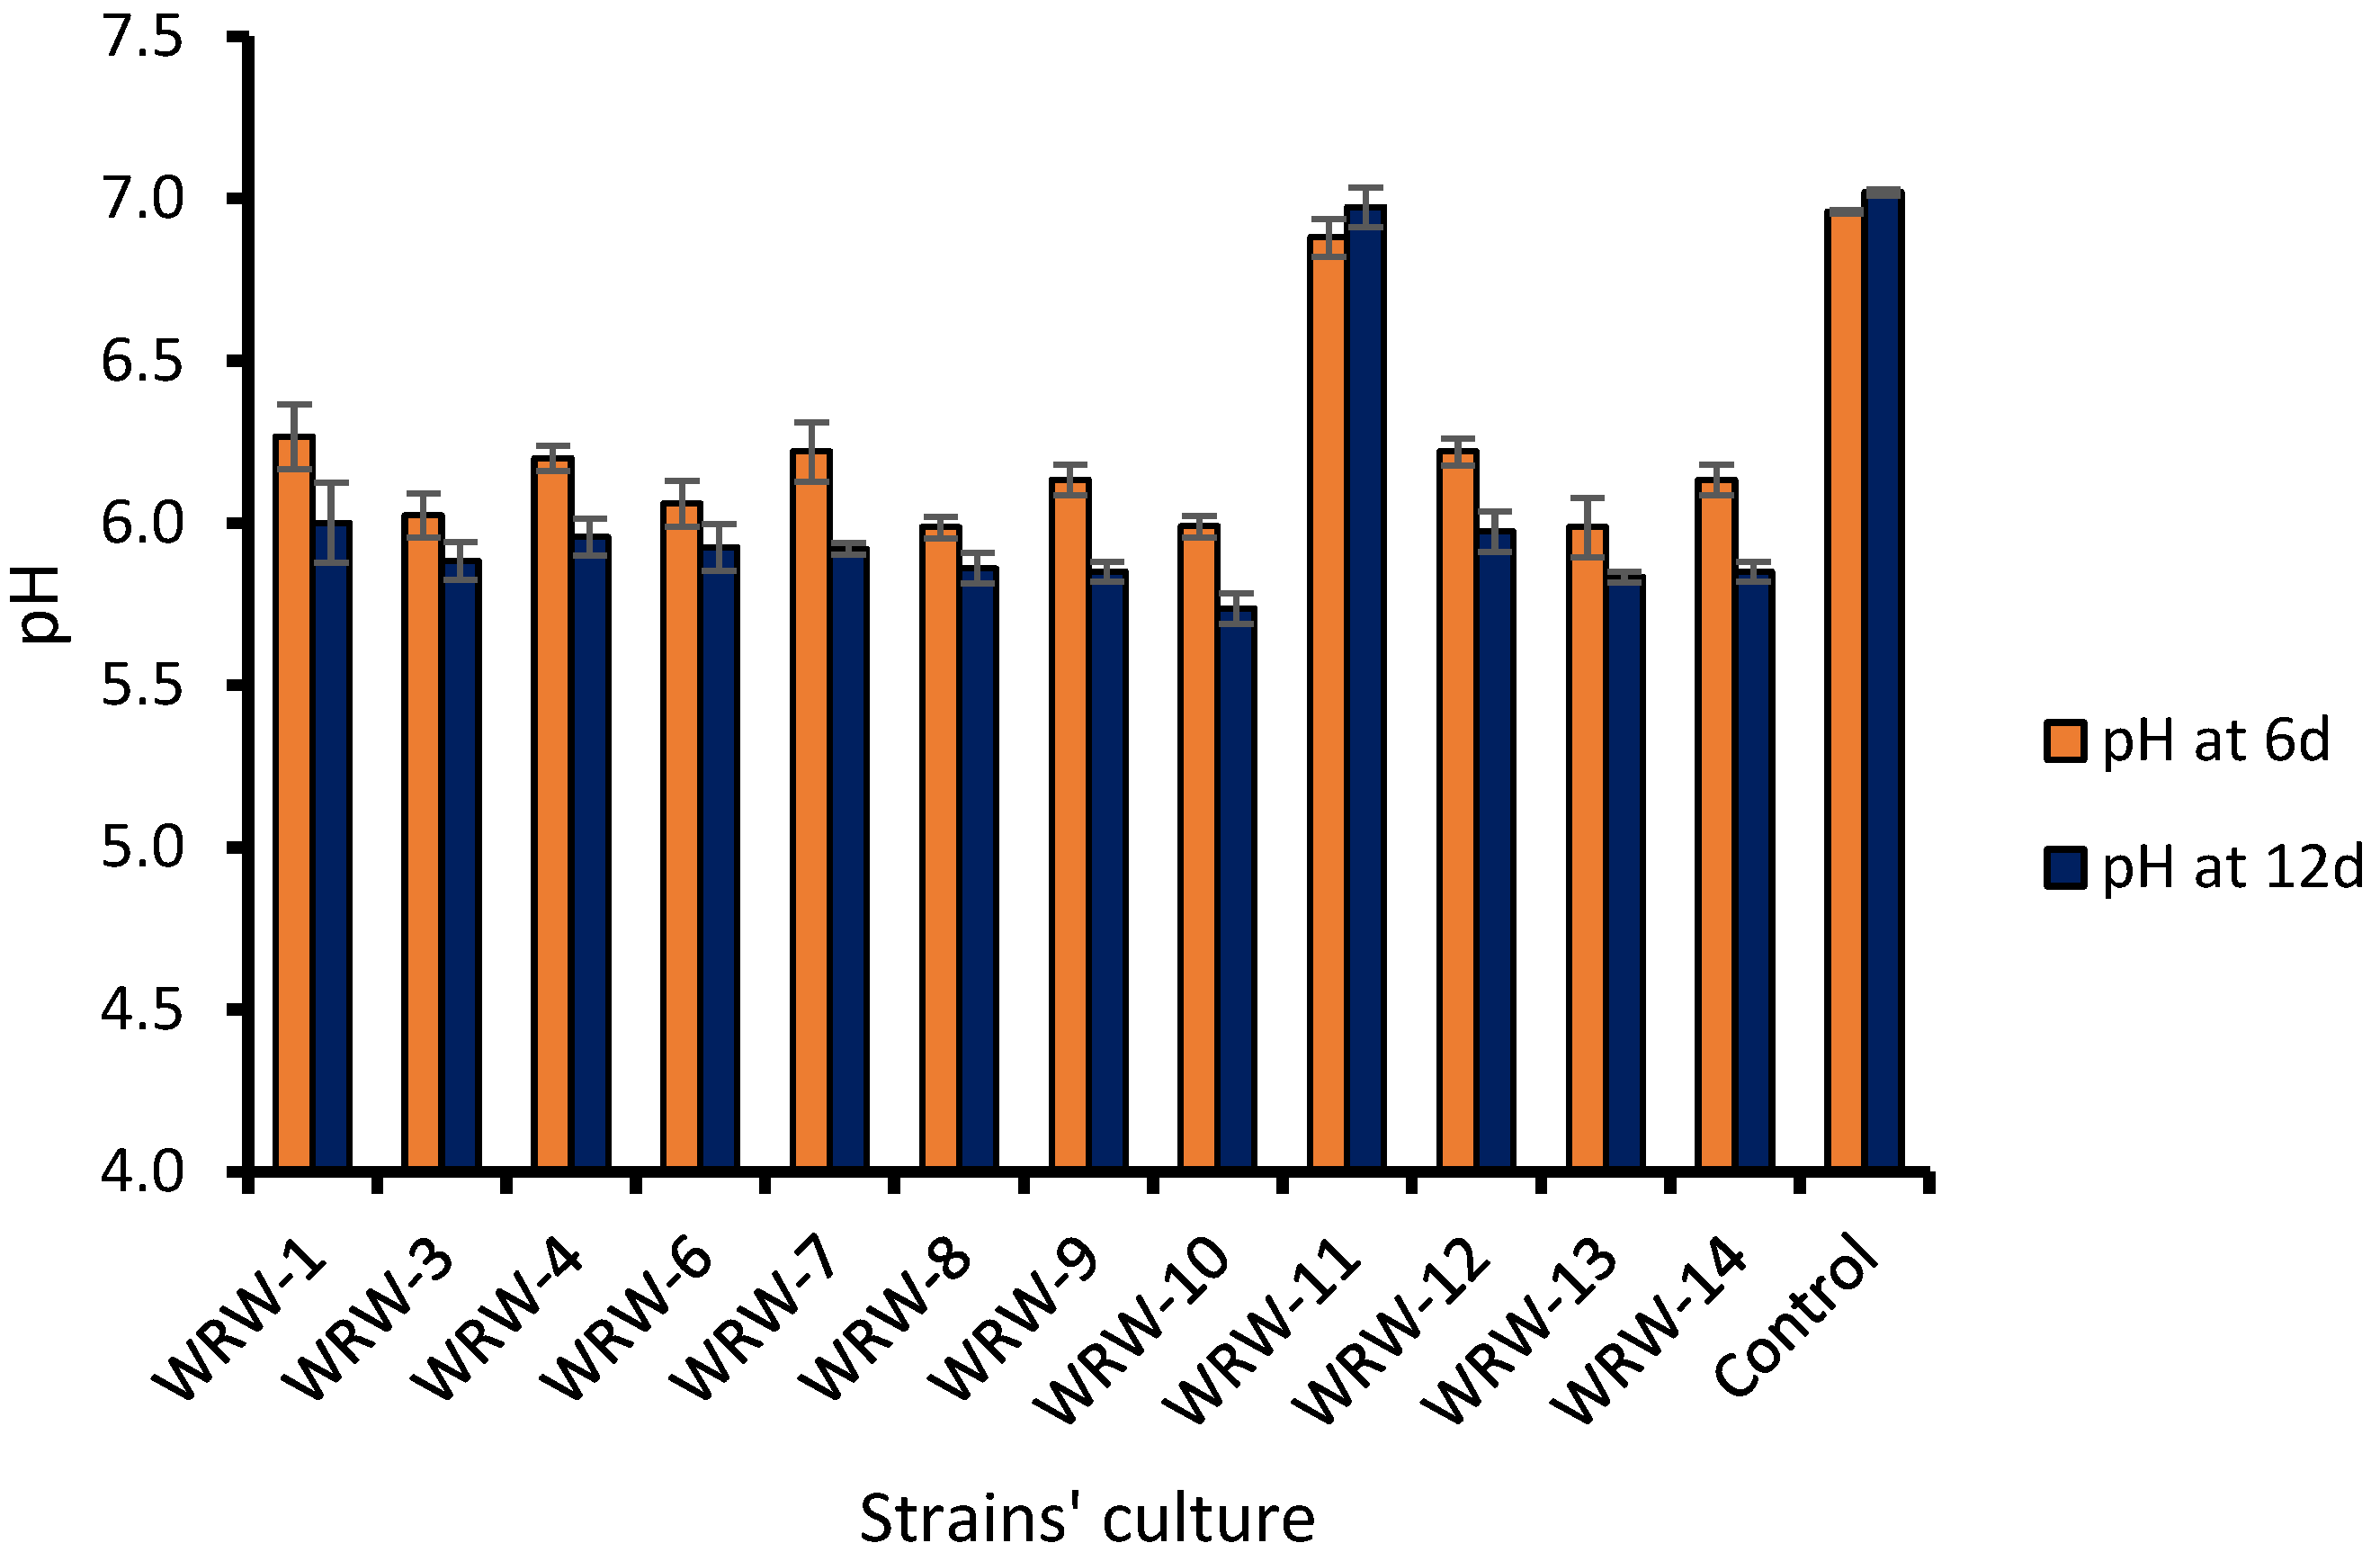
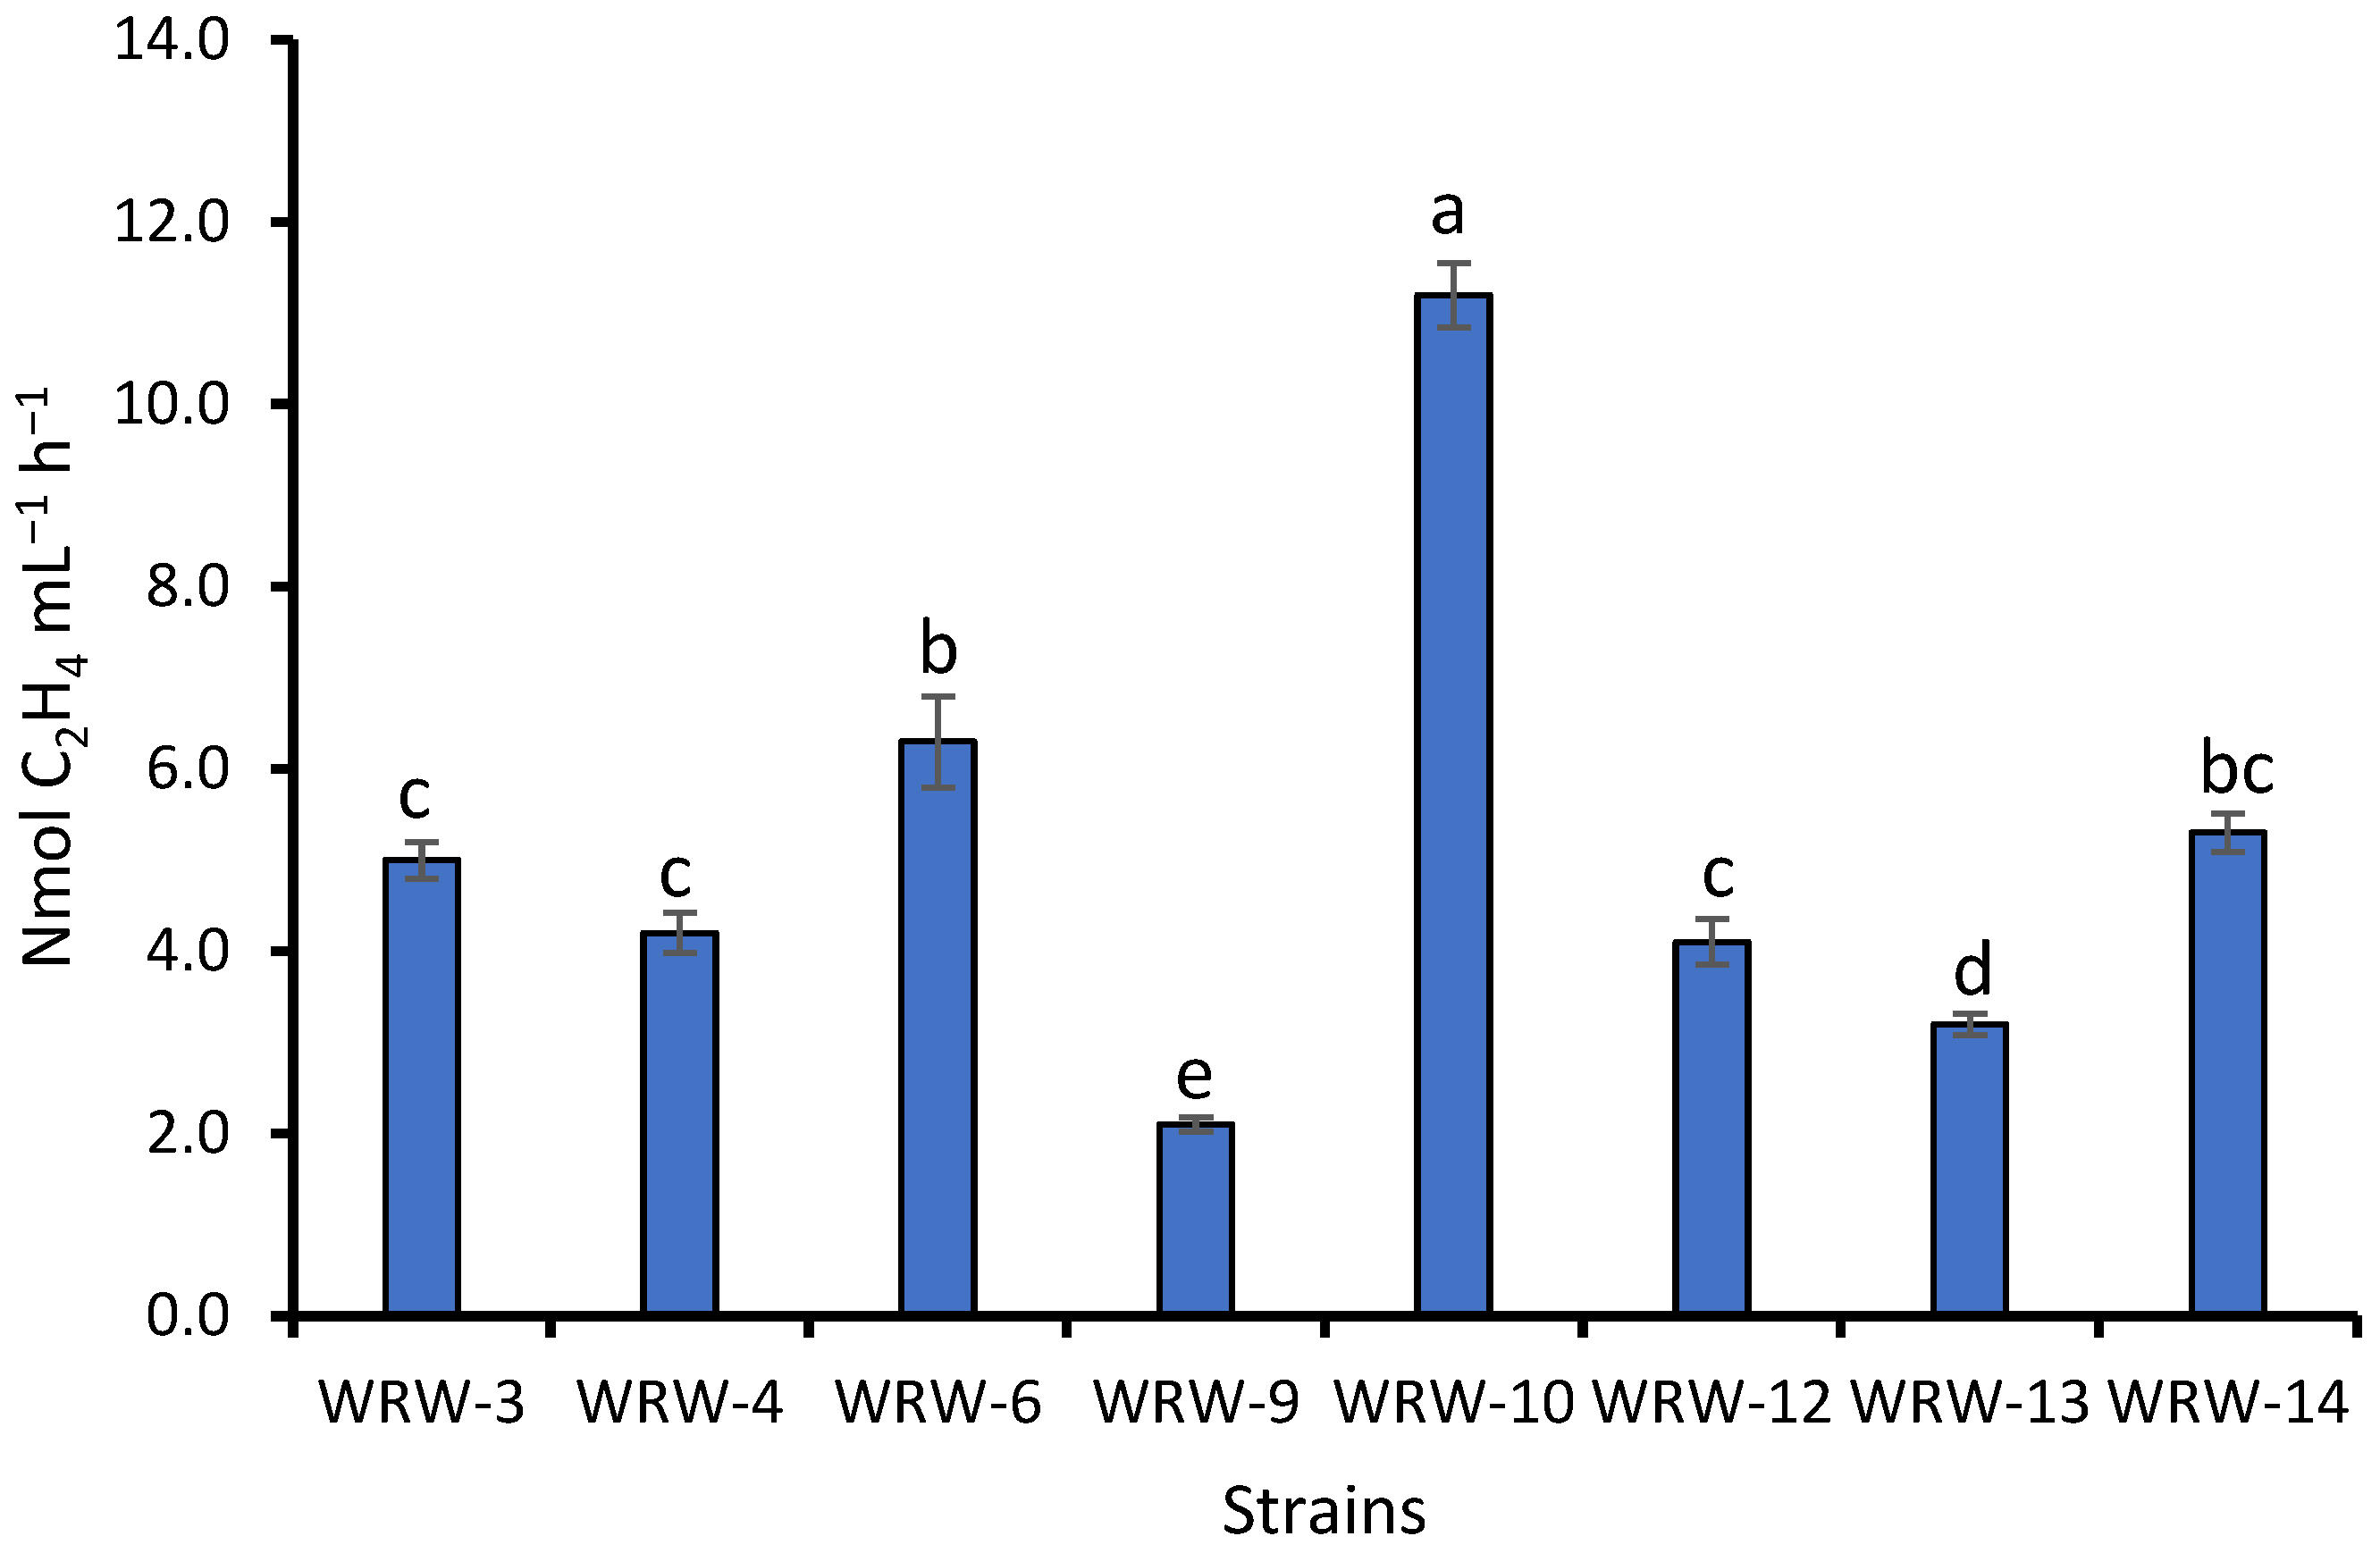
3.2. Bacterial Population and Identification of the WRW

The bacterial population declined with increasing W:R (Figure 4). The bacterial population also peaked at 3 days of fermentation, then declined thereafter. Washing rice at either 80 or 100 rpm had a similar effect on the bacterial population (Figure 4a,b), but both of them produced a higher bacteria population than at the 50 rpm (Figure 4c).
Based on 16S rRNA gene sequencing (Table 3), the 12 total strains found were identified under several genera of Bacillus, Enterobacter, Pantoea, Klebsiella and Stenotrophomonas. The phylogenetic tree of the identified microbes was clustered into clades to their respective genus and species, as shown in Figure 5. It is worth noting that at 0-day fermentation, only Enterobacter sp. strain was found in the WRW. However, after further fermentation, in the 3-day fermentation, five different strains were found: Bacillus velezensis, Enterobacter ludwigii, Enterobacter sp., Klebsiella pneumoniae and Pantoea agglomerans. Similarly, Enterobacter mori, Bacillus velezensis and Stenotrophomonas maltophilia were isolated from a 6-day fermentation, while Enterobacter sp., Enterobacter mori and Stenotrophomonas maltophilia were isolated from the 9-day fermentation. Interestingly, Enterobacter spp. was the common strain found irrespective of the fermentation period (Table 3). However, Pantoea agglomerans and Klebsiella pneumoniae were unique to only 3-day fermentation, similar to the presence of only Stenotrophomonas maltophilia in 6-day and 9-day fermentation. In addition, the presence of Bacillus velezensis was only found in the 3-day and 6-day fermentation.
All the broth containing isolates showed a decrease in pH upon bacterial inoculation from 6 to 12 days of incubation (Figure 6). Generally, however, there was a slight (but non-significant) decrease in the culture pH with an increase in the incubation days. To assess whether the 12 strains in the WRW fermented at different period possessed N2 fixation and nutrient solubilizing potential, these strains were screened for N2 fixation and P and K solubilization activities using the appropriate media (as mentioned in the methodology). The results of the strains’ capability as N2 fixation and P and K solubilizers are shown in Table 4. Only 8 out of the total 12 showed were positive to N2 fixation based on the N-free solid malate medium (Nfb medium) after 5 days incubation period. Four strains from 3-day showed N2 fixation ability, followed by 9-day with two strains, whereas, for 0-day and 6-day fermentation had one strain each. The amount of ethylene produced by the WRW strains ranged from 2.1–11.2 nmol C2H4 mL−1 h−1 (Figure 7). The significantly higher ethylene was produced by Enterobacter sp. Strain WRW-10 with 11.2 nmol C2H4 mL−1 h−1, which differ significantly (p < 0.01) from other strains, while the least was produced by Stenotrophomonas maltophilia strain WRW-9 (2.1 nmol C2H4 mL−1 h−1).
However, based on the agar test, all the 12 strains in the WRW, irrespective of the fermentation periods, showed signs of P solubilization. Similarly, the phosphorus solubilization index (PSI) increased gradually with an increase in incubation days. Overall, at the 6 days of the incubation, higher PSI was observed in Stenotrophomonas maltophilia strain WRW-9, Enterobacter sp. strain WRW-10, Klebsiella pneumoniae strain WRW-12, and Pantoea agglomerans strain WRW-13 with 1.50, 1.6, 1.50, and 1.53, respectively. The quantitative P solubilization increased with time irrespective of the strains (Figure 8A). The Enterobacter mori strain WRW-7 had higher P solubilization of 38 mg L−1, with 37.1–91.0% increased than other strains, while the least was recorded in Stenotrophomonas maltophilia strain WRW-14 with 3.57 mg L−1. In terms of potassium solubilization index (KSI) only six strains were positive based on the agar test (Table 4) with 3-day, 6-day and 9-day fermentation periods having three, two and one positive microorganisms, respectively. Klebsiella pneumoniae strain WRW-12 produced the highest KSI of 2.3, while the least was recorded in Stenotrophomonas maltophilia strain WRW-14 with 1.1. The amount of K solubilized (quantitatively) by the bacterial strains ranged between 1.65 mg L−1 and 11.16 mg L−1, from 5 to 15 days of incubation (Figure 8B). However, across the same strain, a significant difference (p < 0.05) between the incubation days (15d, 10d, 5d) was observed. However, the highest K solubilization was produced by Pantoea agglomerans strain WRW-13 with a range of percent increased between 10.1 and 71.9% than other strains (Figure 8B).

4. Discussion

4.1. Chemical Characteristics of WRW

The nutrient levels in WRW (Table 1) were near or within the range obtained by other studies [1,2,3,4,6]. The elements NH 4 + -N, NO 3 - N ,   P, K, Ca, Mg, Zn, and EC increased (except Cu) with longer fermentation due to the activity of the microorganisms in the WRW. However, B was not significantly affected by either fermentation or W:R, possibly because rice is low in B (Table 1). Atique-ur-Rehman et al. [35] reported that rice is deficient in B due to their cultivation in either highly acidic or alkaline soils which are classified as B deficient soils. NH 4 + −N, NO 3 - N , K, and C increased with higher W:R, which could be due to their high solubility in water. Monovalent elements or ions, such as NH 4 + -N, NO 3 - - N , and K have a higher solubility in water due to their weaker bonds than divalent cations [36], and therefore, easier to be leached out.
The increase in P and K with the increase in fermentation was because of the presence of P and K solubilizing bacteria (Figure 8). Bacillus and Enterobacter species are PGPB that could solubilize P and K [16,25,37]. Furthermore, the increase in P and K with fermentation also agrees with the total bacterial population (Figure 4) which shows an increasing trend with the increase in fermentation periods until 3 days, then decline thereafter. The results agree with several studies of cereals fermentation that reported an increase in P, Ca, Mg, Zn with an increase in fermentation period mainly due to the loss of dry matter as microbes mineralized the carbohydrate and protein contents of the cereals, leading to the availability of these elements [38,39,40].
Higher P, Mg, and Zn concentrations at lower W:R were mainly due to their low solubility in water [36]. Similarly, the decrease in P, Mg and Zn at higher W:R could also be attributed to their precipitations by Ca. Diaz [41] reported that Ca affected the availability of P by precipitation. Significant correlations between Mg and water-extractable P obtained by Kleinman et al. [42] supported our observations on the possible association of Mg and P in WRW. In this study, we also found a significant (p < 0.01) positive correlation between the P and Mg (r = 0.93), P and Zn (0.95), and Mg and Zn (0.93), and this indicates that the availability of one element could lead to the availability of the other. For instance, Mg and Zn content in laundry wastewater in the study by Tan [43] were found to decrease with higher water volume. Phytate is the main form of organic P in grains (including rice) and the phytate form of P is not soluble [44]. Phytate binds strongly to many elements during fermentation, and phytates are non-soluble in water [38,45,46].
The decrease in C content with an increase in fermentation periods was due to the bacterial activity in the WRW. Bacteria use C as an energy source [47], which leads to a reduction in C as fermentation progressed. Similarly, the decrease in C and total bacterial population (Figure 4) led to the increase in NH 4 + -N, NO 3 - N , P, K, Mg and Cu indicated the utilization of the C content by the microbes for the mineralization process, as reported by Pranoto et al. [38].
The higher N at 3-day was because of the presence of N-fixing bacteria (Bacillus and Enterobacter spp.) when the bacterial population was high (Figure 4 and Table 3). The decrease in N with longer fermentation (3 to 9-day) could partly be attributed to the lower initial N content of the rice. Osman [46] and Pranoto et al. [38] reported a decrease in the protein content of cereals with fermentation due to the lower initial protein content of cereals. The decrease in N as fermentation progressed was most possibly because of the denitrification and ammonification process which had led to an increase in NH 4 + -N and NO 3 - N (Figure 2). In addition, however, the decrease in the N corresponded to the increase in the NH 4 + -N and NO 3 - N content (Figure 3), which agrees with Neina [48] who reported that N can be converted to NH 4 + and NO 3 during mineralization. A concurrent decrease in WRW pH with an increase in NH 4 + -N and NO 3 - N observed in this study agrees with Musa et al. [49], where they reported a negative relationship between nitrate production and the pH of the soil. In this study, the higher the W:R ratio, the greater the pH, and the longer the fermentation, the lower the pH. The decrease in pH was because of organic acids formation, such as bicarbonate acids [44,49,50]. The decrease in pH with a longer fermentation period corresponded to the decrease in the bacterial population (Figure 4). Rousk et al. [51] likewise reported a decrease in bacterial growth with pH reduction.
EC increased with fermentation because the concentrations of nearly all elements increased (only Cu declined). The formation of organic acids through the decomposition of organic substances increases EC [52]. The EC, however, decreased with higher W:R because of greater dilution. Volatilization of ammonia and precipitation of mineral salts would lead to lower EC values [53]. EC indicates plant-available nutrients [54,55], which in this study showed that increasing the water proportion in the water and rice mixture had led to the dilution of the nutrient concentrations in WRW.

4.2. Identification and Characterization of the Bacterial Strains

In this study, 12 different PGP strains (Bacillus velezensis WRW-1, Enterobacter ludwigii WRW-3, Enterobacter sp. WRW-4, Enterobacter sp. WRW-6, Enterobacter mori WRW-7, Bacillus velezensis WRW-8, Stenotrophomonas maltophilia WRW-9, Enterobacter sp. WRW-10, Enterobacter mori WRW-11, Klebsiella pneumoniae WRW-12, Pantoea agglomerans WRW-13 and Stenotrophomonas maltophilia WRW-14) were isolated from fermented WRW (0-, 3-, 6-, and 9-day). The phylogenetic tree clearly showed there are two main clusters with Bacillus velezensis and Stenotrophomonas maltophilia as one cluster, and the second cluster composed of genus of Enterobacter, Pantoea and Klebsiella. The lower fermentation period (3-day) had higher bacterial diversity which decreased as the fermentation progressed. The presence of the unique bacteria at 3-day (Pantoea agglomerans and Klebsiella pneumoniae) agrees with Figure 4 which shows a higher bacterial population at the same fermentation period. The decrease in C content with progression of fermentation could be the reason for the absence of Pantoea agglomerans and Klebsiella pneumoniae at the higher fermentation period (6- and 9-day) which might be attributed to their inability to resist competition as compared to Bacillus velezensis, Enterobacter spp. and Stenotrophomonas maltophilia. Adugna [56] reported that the effectiveness and availability of microbes depend on a supply of available carbon. The identified Bacillus velezensis have higher similarities (99%) with Bacillus spp. of siamensis and subtilis which agrees with Dunlap [57] who reported Bacillus velezensis to synonymized with Bacillus subtilis and Bacillus siamensis due to their texa’s high phenotypic and genotypic coherence. The Enterobacter spp. [58], Bacillus velezensis [59], Klebsiella pneumoniae [60], Pantoea agglomerans [61], and Stenotrophomonas maltophilia [62] strains have been identified as PGP microorganisms employed in the cultivation of a variety of crops.
Therefore, the utilization of microbes as components of biofertilizers is considered an alternative to chemical fertilizers to improve soil health and crop productivity [63]. Park and DuPonte [64] opined that PGP microorganisms have considerable biopotentials and are a new means for providing substantial benefits to agriculture because the organisms can colonize roots and rhizospheres to stimulate the growth and development of plants. Similarly, Yadav et al. [65] reported that PGP microorganisms possess tremendous characteristics that are directly related to plant growth via the production of plant growth hormones and N2 fixation and the solubilization of P, K, and Zn or indirectly by the production of ammonia, 1-aminocyclopropane-1-carboxylate (ACC) deaminase, antibiotics, siderophores, hydrocyanic acid, and lytic enzymes.
Enterobacter sp. strain WRW-10 had a range of percent increase in ethylene production of 43.7 to 81.2% than other strains, which shows a greater nitrogenase activity as compared to the other strains. The ability to fix N2 is a vital criterion for characterization because it is crucial to the plants as a potential alternative to applying chemical N fertilizer. Only eight of the 12 bacterial strains (66%) are able to perform biological N2 fixation (Table 4). PGP and rhizobia play more important roles, particularly in providing plants with nutrients in less fertilized soils [25]. Bacillus sp. was reported to have provided 67% of the nitrogen to a young oil palm via biological N2 fixation [66]. The ethylene produced by these bacterial strains were within those reported by Tan et al. [25], ranging from 2.1 to 11.2 nmol C2H4 mL−1 h−1 but much higher than those reported by Katupitiya et al. [67] and Naher et al. [68] with 2.3 nmol C2H4 plant−1 h−1, and 6.1 × 10⁻⁸ to 1.2 × 10⁻³ nmol C2H4 cfu−1 h−1 from Azosprillum inoculation and a diazotroph isolates from rice, respectively.
Studies have shown that certain bacteria function as PGP through soil nutrient solubilizing ability [69,70]. Bacteria that can solubilize nutrients, such as P and K are vital because they can convert insoluble P and K in soils into soluble P and K. The increase in the P and K release is associated with the production of acids, alkalis, or chelates by the bacterial strains [25]. Talaat et al. [71] and Yadav et al. [65] reported that soluble P and K, which are converted by beneficial microorganisms, can be easily taken up by plants for growth and development. The decrease in culture pH is directly proportional to the inorganic phosphate solubilization [72] which is attributed to the organic acids and acid phosphatases production by the microbes [73,74]. Meanwhile, the gradual increase in phosphate solubilization index value for invariably all the strains (excepts Klebsiella pneumoniae strain WRW-12 and Stenotrophomonas maltophilia strain WRW-13) showed that more insoluble phosphate could still be solubilized beyond 6 days incubation time. Therefore, these isolates could benefit the plants more considering the longer period the insoluble phosphate takes (relatively immobile) before been solubilized. Potassium solubilization rates for these bacterial strains were all lower than the strains used by Tan et al. [25], which solubilized a range of 10.7 to 14.15 mg L−1 after 5 days of incubation. Conversely, the solubilized K in this study was higher than 4.29 mg L−1 solubilized by Bacillus mucilaginous MCRCp1 reported by Sugumaran and Janarthanum [75] after 4 days of incubation. The use of fermented WRW could reduce the need for inorganic fertilizer as the WRW contained beneficial microorganisms that can solubilize the insoluble P and K into the available form. The differences in the availability and activity of the microorganisms indicate that there is a higher probability that the same raw materials and techniques used to produce the WRW may not produce common species as the ones isolated in this study.

4.3. Potential Use of WRW for Agriculture

Domestic and municipal wastewaters have been used for plant fertilization, and they are reported to have element concentrations in the ranges of (in mg L−1): 39.3–53 TN, 3.7–25 TP, 2.84–12.0 PO 4 2 - , 0.51–41.0 K, 10–44 NH 4 + -N, 0.3–18.05 NO 3 - N , 45–130 Ca, and 18–39 Mg [76,77,78,79,80,81,82,83,84]. The fermented WRW nutrient concentrations are generally within the range of the reported values obtained in the domestic and municipal wastewater and palm oil mill effluent (POME). WRW has lower N and K by 43.9 and 45.2%, respectively than that in POME. However, WRW has a higher P (64.64 mg L−1) than POME by 82% [85]. Interestingly, WRW has a higher C than in POME and domestic wastewaters by between 67.9 to 89.1%.
C is a source of energy for microorganisms [47,86], and this study showed that the nutrient contents of WRW increased (except C) with fermentation (Figure 2 and Figure 3). This shows that WRW has the potential to be used as a source of plant nutrients similar to municipal and domestic wastewater, POME, and other wastewaters.
Over 95% of WRW composition is water. Therefore, for WRW reuse, the wastewater must be applied in small doses but applied frequently to minimize leaching losses and to gradually build up soil health. Our study showed that, if applied correctly, the benefits of WRW can be consequential over the long term, where WRW has the potential to gradually build up both the soil nutrient concentrations and beneficial soil biota. Nevertheless, it is important to note here that the reuse of WRW is not to replace or even substitute other amendments.

5. Conclusions

WRW contained essential nutrients to support plant growth and development. Fermentation and W:R were the two most important factors in determining the WRW nutrient contents. The concentrations of C, K, Ca, S, NH 4 + -N, and NO 3 - N increased while P, Mg, and Zn decreased with higher W:R, indicating elements with higher solubility in water would increase in higher W:R. However, with a higher fermentation period, all the measured elements (except C) increased, indicating the mineralization of WRW. Fermented WRW (as compared with unfermented WRW) had higher elemental concentrations, particularly, N, P, and K with 59.7, 60.2, and 25.0%, respectively, due to the presence of beneficial microorganisms, such as Bacillus velezensis, Klebsiella pneumoniae, and the variety of Enterobacter spp. which are N fixing, and P- and K-solubilizing bacteria. However, to validate the potential of WRW as an organic amendment, field trials involving various crops and soils are required to evaluate the effects of WRW, particularly against conventional mineral fertilizers, on improving soil health and increasing crop growth and yield in both the short and long term (such as over several planting cycles).

Author Contributions

Conceptualization, A.N. and C.T.B.S.; methodology, A.N., C.T.B.S. and A.T.K.Z.; software, A.N. and C.T.B.S.; validation, A.N., T.N.P. and C.T.B.S.; formal analysis, A.N. and C.T.B.S.; investigation, A.N. and C.T.B.S.; resources, C.T.B.S. and T.N.P.; data curation, C.T.B.S.; writing—original draft preparation, A.N. and N.I.M.A.; writing—review and editing, A.N., C.T.B.S. and N.I.M.A.; visualization, A.N., C.T.B.S. and N.I.M.A.; supervision, C.T.B.S., A.T.K.Z. and T.N.P.; All authors have read and agreed to the published version of the manuscript.

Funding

This research received no external funding.

Institutional Review Board Statement

Not applicable.

Informed Consent Statement

Not applicable.

Data Availability Statement

Not applicable.

Acknowledgments

The authors would like to acknowledge TETFund Nigeria for providing a PhD scholarship to the first author. The authors also acknowledge colleagues and staff at Universiti Putra Malaysia Selangor Campus, for their support and cooperation.

Conflicts of Interest

The authors declare no conflict of interest.

References

  1. Juliano, B.O. Rice in Human Nutrition; FAO Food and Nutrition Series (26); FAO: Rome, Italy, 1993. [Google Scholar]
  2. Dini, I.R.; Salbiah, D. Growth and pepper yields (Capsicum annuum L.) by giving a formulation of biological fertilizer of cellulolytic bacteria based on organic liquid waste. J. Phys. Conf.Ser. 2019, 1351, 12097. [Google Scholar]
  3. He, Q.; Feng, C.; Peng, T.; Chen, N.; Hu, Q.; Hao, C. Denitrification of synthetic nitrate-contaminated groundwater combined with rice washing drainage treatment. Ecol. Eng. 2016, 95, 152–159. [Google Scholar] [CrossRef]
  4. Malakar, M.C.; Banerjee, S.N. Effect of cooking rice with different volumes of water on the loss of nutrients and on digestibility of rice in vitro. Food Res. 1959, 24, 751–756. [Google Scholar] [CrossRef]
  5. Nabayi, A.; The, C.B.S.; Ngai, T.P.; Tan, A.K.Z. Wastewater from washed rice water as plant nutrient source: Current understanding and knowledge gaps. Pertanika J. Sci. Technol. 2021, 29, 1347–1369. [Google Scholar] [CrossRef]
  6. Wulandari, C.G.M.; Muhartini, S.; Trisnowati, S. Pengaruh air cucian beras merah dan beras putih terhadap pertumbuhan dan hasil selada (Lactuca sativa L.). Vegetalika 2012, 1, 24–35. [Google Scholar]
  7. Ariwibowo, F. Utilization of Chicken Eggshells and Rice Washed Water on the Growth of Tomato Plants (Solonum lycopercium, L.) with Hydroponic Growing Media. Undergraduate Thesis, Universitas Muhammadiah Surakarta, Jakarta, Indonesia, 2012. Unpublished. [Google Scholar]
  8. Bahar, A. Pengaruh pemberian limbah air cucian beras terhadap pertumbuhan tanaman kangkung darat (Ipomoea reptans Poir). J. Ilm. Mhs. Fak. Pertan. 2016, 3, 1–9. [Google Scholar]
  9. Handiyanto, S.; Hastuti, U.S.; Prabaningtyas, S. The effect of rice water washing medium on the speed of mycelium growth of white oyster mushrooms (Pleurotus ostreatus var. Florida). Semin. Nas. X Pendidik. Biol. FKIP UN. 2013, 10, 1–6. [Google Scholar]
  10. Hariyadi, S.P. The Effect of watering on rice washing water, MSG water, and AC (Air Conditioner) wastewater on yields components and tomato yields (Lycopersicon esculentum L.) In the Deep Peatland. Univers. J. 2020, 7, 1–12. [Google Scholar]
  11. Sairi, F.; Ismail, N.; Ibrahim, N. The effect of FRAW towards the growth of chilli seedlings and its associated microorganisms. Malays. J. Microbiol. 2018, 14, 606–610. [Google Scholar]
  12. Siagian, A.S. Response of Organic Fertilizer to Liquid water Wash on Growth and Production of Lettuce (Lactuca sativa L.). Undergraduate Thesis, University of Medan Area Faculty of Agricultural Studies Program of Agrotechnology, Medan, Indonesia, 2018. Unpublished. Available online: http://repository.uma.ac.id/handle/123456789/10578 (accessed on 26 May 2021).
  13. Wardiah, L.; Hafnati, L.R. Potensi limbah air cucian beras sebagai pupuk rganic cair pada pertumbuhan pakchoy (Brassica rapa L.). J. Biol. Edukasi 2014, 6, 34–38. [Google Scholar]
  14. Yulianingsih, R. Pengaruh air cucian beras terhadap pertumbuhan dan hasil terung ungu (Solanum melongena L.). Publ. Inf. Pertan. 2017, 13, 61–68. [Google Scholar] [CrossRef]
  15. Beneduzi, A.; Ambrosini, A.; Passaglia, L.M.P. Plant growth-promoting rhizobacteria (PGPR): Their potential as antagonists and biocontrol agents. Genetics Molecular Biol. 2012, 4, 1044–1051. [Google Scholar] [CrossRef] [Green Version]
  16. Bhattacharyya, P.N.; Jha, D.K. Plant growth-promoting rhizobacteria (PGPR): Emergence in agriculture. World J. Microbiol. Biotechnol. 2012, 28, 1327–1350. [Google Scholar] [CrossRef]
  17. The Jakarta Post. Village in Bogor uses leftover rice water to grow plants. The Jakarta Post News Desk. 2017. Available online: https://www.thejakartapost.com/news/2017/10/07/village-in-bogor-uses-leftover-rice-water-to-grow-plants.html (accessed on 26 May 2021).
  18. Supraptiningsih, L.K.; Nuriyanti, R. Processing household waste (washed rice water) into liquid organic fertilizer in Probolinggo Regency Empowering. J. Pengabdi. Masy. Fak. Psikol. 2019, 3, 12–20. [Google Scholar]
  19. GriSP. Global Rice Science Partnership Rice Almanac, 4th ed.; International Rice Research Institute: Los Baños, Philippines, 2013. [Google Scholar]
  20. Shahbandeh, M. Total Global Rice Consumption 2008–2021. STATISTA. 2021. Available online: https://www.statista.com/statistics/255977/total-global-rice-consumption (accessed on 5 October 2021).
  21. OECD. Environmental Outlook to 2050: The Consequences of Iinaction; OECD: Paris, France, 2012. [Google Scholar]
  22. WWAP. The United Nations World Water Development Report UNESCO; WWAP: Paris, France, 2017. [Google Scholar]
  23. Nelson, D.W.; Sommers, L. Total carbon, organic carbon, and organic matter. Methods Soil Anal. Part 2 Chem. Microbiol. Prop. 1983, 9, 539–579. [Google Scholar]
  24. McLean, E.O. Soil pH and lime requirement. Methods Soil Anal. Part 2 Chem. Microbiol. Prop. 1983, 9, 199–224. [Google Scholar]
  25. Tan, K.Z.; Radziah, O.; Halimi, M.S.; Khairuddin, A.R.; Habib, S.H.; Shamsuddin, Z.H. Isolation and characterization of rhizobia and plant growth-promoting rhizobacteria and their effects on growth of rice seedlings. Am. J. Agric. Biol. Sci. 2014, 9, 342–360. [Google Scholar] [CrossRef] [Green Version]
  26. Thomas, P.; Sekhar, A.C.; Upreti, R.; Mujawar, M.M.; Pasha, S.S. Optimization of single plate-serial dilution spotting (SP-SDS) with sample anchoring as an assured method for bacterial and yeast cfu enumeration and single colony isolation from diverse samples. Biotechnol. Rep. 2015, 8, 45–55. [Google Scholar] [CrossRef] [Green Version]
  27. Döbereiner, J.; Day, J.M. Associative symbioses in tropical grasses: Characterization of microorganisms and dinitrogen-fixing sites. In Proceedings of the 1st International Symposium on Nitrogen Fixation; Washington State University Press: Pullman, WD, USA, 1976; Volume 2, pp. 518–538. [Google Scholar]
  28. Pikovskaya, R.I. Mobilization of phosphorus in soil in connection with vital activity of some microbial species. Mikrobiologiya 1948, 17, 362–370. [Google Scholar]
  29. Hu, X.; Chen, J.; Guo, J. Two phosphate-and potassium-solubilizing bacteria isolated from Tianmu Mountain, Zhejiang, China. World J. Microbiol. Biotechnol. 2006, 22, 983–990. [Google Scholar] [CrossRef]
  30. Hasegawa, M.; Kishino, H.; Yano, T.A. Dating of the human-ape splitting by a molecular clock of mitochondrial DNA. J. Mol. Evol. 1985, 22, 160–174. [Google Scholar] [CrossRef] [PubMed]
  31. Kumar, S.; Stecher, G.; Tamura, K. Molecular evolutionary genetics analysis Version 7.0 for Bigger Datasets. Mol. Biol. Evol. 2016, 33, 1870–1874. [Google Scholar] [CrossRef] [Green Version]
  32. RStudio. Rstudio Team Rstudio: Integrated Development Environment for R 2021. 2021. Available online: https://www.rstudio.com/products/rstudio/ (accessed on 9 May 2021).
  33. DOE. National Water Quality Standards for Malaysia; Department of Environment: Putrajaya, Malaysia, 2017.
  34. McInnes, L.; Healy, J.; Saul, N.; Großberger, L. UMAP: Uniform manifold approximation and projection. J. Open Source Softw. 2018, 3, 861. [Google Scholar] [CrossRef]
  35. Atique-ur, R.; Farooq, M.; Rashid, A.; Nadeem, F.; Stuerz, S.; Asch, F.; Bell, R.W.; Siddique, K.H.M. Boron nutrition of rice in different production systems. A review. Agron. Sustain. Dev. 2018, 38, 1–25. [Google Scholar] [CrossRef] [Green Version]
  36. Petrucci; Ralph, H.; Geoffrey, H.F.; Jeffrey, D.M.; Bissonnette, C. General Chemistry: Principles and Modern Applications, 10th ed.; Pearson Education: Upper Saddle River, NJ, USA, 2011. [Google Scholar]
  37. Deepa, C.K.; Dastager, S.G.; Pandey, A. Isolation and characterization of plant growth promoting bacteria from non-rhizospheric soil and their effect on cowpea (Vigna unguiculata (L.) Walp.) seedling growth. World J. Microbiol. Biotechnol. 2010, 26, 1233–1240. [Google Scholar] [CrossRef]
  38. Pranoto, Y.; Anggrahini, S.; Efendi, Z. Effect of natural and Lactobacillus plantarum fermentation on in-vitro protein and starch digestibilities of sorghum flour. Food Biosci. 2013, 2, 46–52. [Google Scholar] [CrossRef]
  39. Sripriya, G.; Antony, U.; Chandra, T.S. Changes in carbohydrate, free amino acids, organic acids, phytate and HCl extractability of minerals during germination and fermentation of finger millet (Eleusine coracana). Food Chem. 1997, 58, 345–350. [Google Scholar] [CrossRef]
  40. Blandino, A.; Al-Aseeri, M.E.; Pandiella, S.S.; Cantero, D.; Webb, C. Cereal-based fermented foods and beverages. Food Res. Int. 2003, 36, 527–543. [Google Scholar] [CrossRef]
  41. Diaz, O.A.; Reddy, K.R.; Moore, P.A. Solubility of inorganic phosphorus in stream water as influenced by pH and calcium concentration. Water Res. 1994, 28, 1755–1763. [Google Scholar] [CrossRef]
  42. Kleinman, P.J.A.; Wolf, A.M.; Sharpley, A.N.; Beegle, D.B.; Saporito, L.S. Survey of water-extractable phosphorus in livestock manures. Soil Sci. Soc. Am. J. 2005, 69, 701–708. [Google Scholar] [CrossRef] [Green Version]
  43. Tan, S.L. Utilization of Graywater in Formulating Liquid Organo-Mineral Fertilizer and Effects on Growth and Yield Performance of Chili (Capsicum Annuum, L.). Master’s Thesis, Universiti Putra Malaysia, Selangor, Malaysia, 2021. Unpublished. [Google Scholar]
  44. Nkhata, S.G.; Ayua, E.; Kamau, E.H.; Shingiro, J.B. Fermentation and germination improve nutritional value of cereals and legumes through activation of endogenous enzymes. Food Sci. Nutr. 2018, 6, 2446–2458. [Google Scholar] [CrossRef] [PubMed] [Green Version]
  45. Bohn, L.; Meyer, A.S.; Rasmussen, S.K. Phytate: Impact on environment and human nutrition. A challenge for molecular breeding. J. Zhejiang Univ. Sci. B 2008, 9, 165–191. [Google Scholar] [CrossRef] [PubMed] [Green Version]
  46. Osman, M.A. Effect of traditional fermentation process on the nutrient and antinutrient contents of pearl millet during preparation of Lohoh. J. Saudi Soc. Agric. Sci. 2011, 10, 1–6. [Google Scholar] [CrossRef] [Green Version]
  47. He, Q.; Feng, C.; Chen, N.; Zhang, D.; Hou, T.; Dai, J.; Hao, C.; Mao, B. Characterizations of dissolved organic matter and bacterial community structures in rice washing drainage (RWD)-based synthetic groundwater denitrification. Chemosphere 2019, 215, 142–152. [Google Scholar] [CrossRef]
  48. Neina, D. The role of soil pH in plant nutrition and soil remediation. Appl. Environ. Soil Sci. 2019, 2019, 1–9. [Google Scholar] [CrossRef]
  49. Musa, A.M.; Ishak, C.F.; Karam, D.S.; Jaafar, N.M. Effects of fruit and vegetable wastes and biodegradable municipal wastes co-mixed composts on nitrogen dynamics in an Oxisol. Agronomy 2020, 10, 1609. [Google Scholar] [CrossRef]
  50. Zhang, Y.; Xu, W.; Duan, P.; Cong, Y.; An, T.; Yu, N.; Zou, H.; Dang, X.; An, J.; Fan, Q.; et al. Evaluation and simulation of nitrogen mineralization of paddy soils in Mollisols area of Northeast China under waterlogged incubation. PLoS ONE 2017, 12, 1–19. [Google Scholar] [CrossRef]
  51. Rousk, J.; Brookes, P.C.; Bååth, E. Contrasting soil pH effects on fungal and bacterial growth suggest functional redundancy in carbon mineralization. Appl. Environ. Microbiol. 2009, 75, 1589–1596. [Google Scholar] [CrossRef] [Green Version]
  52. Gómez-Brandón, M.; Lazcano, C.; Domínguez, J. The evaluation of stability and maturity during the composting of cattle manure. Chemosphere 2008, 70, 436–444. [Google Scholar] [CrossRef]
  53. Gao, M.; Li, B.; Yu, A.; Liang, F.; Yang, L.; Sun, Y. The effect of aeration rate on forced-aeration composting of chicken manure and sawdust. Bioresour. Technol. 2010, 101, 1899–1903. [Google Scholar] [CrossRef]
  54. Ding, X.; Jiang, Y.; Zhao, H.; Guo, D.; He, L.; Liu, F.; Zhou, Q.; Nandwani, D.; Hui, D.; Yu, J. Electrical conductivity of nutrient solution influenced photosynthesis, quality, and antioxidant enzyme activity of pak choi (Brassica campestris L. sp. Chinensis) in a hydroponic system. PLoS ONE 2018, 13, e202090. [Google Scholar] [CrossRef] [PubMed]
  55. Nemali, K.S.; Van Iersel, M.W. Light intensity and fertilizer concentration: I. Estimating optimal fertilizer concentrations from water-use efficiency of wax begonia. HortScience 2004, 39, 1287–1292. [Google Scholar] [CrossRef] [Green Version]
  56. Adugna, G. A review on impact of compost on soil properties, water use and crop productivity. Agric. Sci. Res. J. 2016, 4, 93–104. [Google Scholar] [CrossRef]
  57. Dunlap, C.A.; Kim, S.J.; Kwon, S.W.; Rooney, A.P. Bacillus velezensis is not a later heterotypic synonym of Bacillus amyloliquefaciens; Bacillus methylotrophicus, Bacillus amyloliquefaciens subsp. Plantarum and ‘Bacillus oryzicola’ are later heterotypic synonyms of Bacillus velezensis based on phylogenom. Int. J. Syst. Evol. Microbiol. 2016, 66, 1212–1217. [Google Scholar] [CrossRef] [PubMed]
  58. Aeron, A.; Kumar, D.; Gurukula, M.; Vishwavidyalaya, K.; Pgpr, Z.S.; View, I.; Jha, C.K. Enterobacter: Role in plant growth promotion. In Bacteria in Agrobiology; Springer: Berlin/Heidelberge, Germany, 2011; pp. 159–182. [Google Scholar]
  59. Chen, X.H.; Koumoutsi, A.; Scholz, R.; Eisenreich, A.; Schneider, K.; Heinemeyer, I.; Morgenstern, B.; Voss, B.; Hess, W.R.; Reva, O.; et al. Comparative analysis of the complete genome sequence of the plant growth-promoting bacterium Bacillus amyloliquefaciens FZB42. Nat. Biotechnol. 2007, 25, 1007–1014. [Google Scholar] [CrossRef] [PubMed] [Green Version]
  60. Iniguez, A.L.; Dong, Y.; Triplett, E.W. Nitrogen fixation in wheat provided by Klebsiella pneumoniae 342. Mol. Plant-Microbe Interact. 2004, 17, 1078–1085. [Google Scholar] [CrossRef] [PubMed] [Green Version]
  61. Shariati, V.J.; Malboobi, M.A.; Tabrizi, Z.; Tavakol, E.; Owilia, P.; Safari, M. Comprehensive genomic analysis of a plant growth-promoting rhizobacterium Pantoea agglomerans strain P5 /631/208/212/748 /631/208/464 /38/43 /45 article. Sci. Rep. 2017, 7, 15820. [Google Scholar] [CrossRef]
  62. Messiha, N.A.S.; van Diepeningen, A.D.; Farag, N.S.; Abdallah, S.A.; Janse, J.D.; van Bruggen, A.H.C. Stenotrophomonas maltophilia: A new potential biocontrol agent of Ralstonia solanacearum, causal agent of potato brown rot. Eur. J. Plant Pathol. 2007, 118, 211–225. [Google Scholar] [CrossRef] [Green Version]
  63. Suhaimee, S.; Ibrahim, I.Z.; Abdul Wahab, M.A.M. Organic agriculture in Malaysia. Available online: https://ap.fftc.org.tw/article/1010 (accessed on 27 September 2021).
  64. Park, H.; DuPonte, M.W. How to Cultivate Indigenous Microorganisms. Trop. Agric. Univ. Hawaii 2008, 9, 1–7. [Google Scholar]
  65. Yadav, A.N.; Kumar, R.; Kumar, S.; Kumar, V.; Sugitha, T.C.K.; Singh, B.; Chauahan, V.S.; Dhaliwal, H.S.; Saxena, A.K. Beneficial microbiomes: Biodiversity and potential biotechnological applications for sustainable agriculture and human health. J. Appl. Biol. Biotechnol. 2017, 5, 45–57. [Google Scholar] [CrossRef] [Green Version]
  66. Zakry, F.A.A.; Shamsuddin, Z.H.; Khairuddin, A.R.; Zin, Z.Z.; Anuar, A.R. Inoculation of Bacillus sphaericus UPMB-10 to young oil palm and measurement of its uptake of fixed nitrogen using the 15N isotope dilution technique. Microbes Environ. 2012, 27, 257–262. [Google Scholar] [CrossRef] [Green Version]
  67. Katupitiya, S.; Millet, J.; Vesk, M.; Viccars, L.; Zeman, A.; Lidong, Z.; Elmerich, C.; Kennedy, I.R. A mutant of Azospirillum brasilense Sp7 impaired in flocculation with a modified colonization pattern and superior nitrogen fixation in association with wheat. Appl. Environ. Microbiol. 1995, 61, 1987–1995. [Google Scholar] [CrossRef] [PubMed] [Green Version]
  68. Naher, U.A.; Radziah, O.; Shamsuddin, Z.H.; Halimi, M.S.; Mohd Razi, I. Isolation of diazotrophs from different soils of Tanjong Karang rice growing area in Malaysia. Int. J. Agric. Biol. 2009, 11, 547–552. [Google Scholar]
  69. Tang, A.; Haruna, A.O.; Majid, N.M.A.; Jalloh, M.B. Potential PGPR properties of cellulolytic, nitrogen-fixing, and phosphate-solubilizing bacteria of a rehabilitated tropical forest soil. Microorganisms 2020, 8, 442. [Google Scholar] [CrossRef] [PubMed] [Green Version]
  70. Tang, A.; Haruna, A.O.; Majid, N.M.A.; Jalloh, M.B. Effects of selected functional bacteria on maize growth and nutrient use efficiency. Microorganisms 2020, 8, 854. [Google Scholar] [CrossRef]
  71. Talaat, N.B.; Ghoniem, A.E.; Abdelhamid, M.T.; Shawky, B.T. Effective microorganisms improve growth performance, alter nutrients acquisition and induce compatible solutes accumulation in common bean (Phaseolus vulgaris L.) plants subjected to salinity stress. Plant Growth Regul. 2015, 75, 281–295. [Google Scholar] [CrossRef]
  72. Dastager, S.G.; Deepa, C.K.; Puneet, S.C.; Nautiyal, C.S.; Pandey, A. Isolation and characterization of plant growth-promoting strain Pantoea NII-186. from Western Ghat forest soil, India. Lett. Appl. Microbiol. 2009, 49, 20–25. [Google Scholar] [CrossRef]
  73. Rodríguez, H.; Fraga, R. Phosphate solubilizing bacteria and their role in plant growth promotion. Biotechnol. Adv. 1999, 17, 319–339. [Google Scholar] [CrossRef]
  74. Pérez, E.; Sulbarán, M.; Ball, M.M.; Yarzábal, L.A. Isolation and characterization of mineral phosphate-solubilizing bacteria naturally colonizing a limonitic crust in the south-eastern Venezuelan region. Soil Biol. Biochem. 2007, 39, 2905–2914. [Google Scholar] [CrossRef] [Green Version]
  75. Sugumaran, P.; Janarthanum, B. Solubilization of potassium containing minerals by bacteria and their effect of plant growth. World J. Agric. Sci. 2007, 3, 350–355. [Google Scholar]
  76. We, A.C.E.; Aris, A.; Zain, N.A.M.; Muda, K.; Sulaiman, S. Influence of static mixer on the development of aerobic granules for the treatment of low-medium strength domestic wastewater. Chemosphere 2021, 263, 128209. [Google Scholar] [CrossRef]
  77. Karakas, I.; Sam, S.B.; Cetin, E.; Dulekgurgen, E.; Yilmaz, G. Resource recovery from an aerobic granular sludge process treating domestic wastewater. J. Water Process Eng. 2020, 34, 101148. [Google Scholar] [CrossRef]
  78. Sancho, I.; Licon, E.; Valderrama, C.; de Arespacochaga, N.; López-Palau, S.; Cortina, J.L. Recovery of ammonia from domestic wastewater effluents as liquid fertilizers by integration of natural zeolites and hollow fibre membrane contactors. Sci. Total Environ. 2017, 584–585, 244–251. [Google Scholar] [CrossRef] [PubMed]
  79. Lee, W.; An, S.; Choi, Y. Ammonia harvesting via membrane gas extraction at moderately alkaline pH: A step toward net-profitable nitrogen recovery from domestic wastewater. Chem. Eng. J. 2021, 405, 126662. [Google Scholar] [CrossRef]
  80. Sahu, O.; Rao, D.G.; Gopal, R.; Tiwari, A.; Pal, D. Treatment of wastewater from sugarcane process industry by electrochemical and chemical process: Aluminum (metal and salt). J. Water Process Eng. 2017, 17, 50–62. [Google Scholar] [CrossRef]
  81. Guerreiro, R.C.S.; Jerónimo, E.; Luz, S.; Pinheiro, H.M.; Prazeres, A.R. Cheese manufacturing wastewater treatment by combined physicochemical processes for reuse and fertilizer production. J. Environ. Manage. 2020, 264, 110470. [Google Scholar] [CrossRef]
  82. Gonçalves, R.F.; Assis, T.I.; Maciel, G.B.; Borges, R.M.; Cassini, S.T.A. Co-digestion of municipal wastewater and microalgae biomass in an up flow anaerobic sludge blanket reactor. Algal Resour. 2020, 52, 102117. [Google Scholar] [CrossRef]
  83. Cainglet, A.; Tesfamariam, A.; Heiderscheidt, E. Organic polyelectrolytes as the sole precipitation agent in municipal wastewater treatment. J. Environ. Manag. 2020, 271, 111002. [Google Scholar] [CrossRef] [PubMed]
  84. Lahav, O.; Telzhensky, M.; Zewuhn, A.; Gendel, Y.; Gerth, J.; Calmano, W.; Birnhack, L. Struvite recovery from municipal-wastewater sludge centrifuge supernatant using seawater NF concentrate as a cheap Mg(II) source. Sep. Purif. Technol. 2013, 108, 103–110. [Google Scholar] [CrossRef]
  85. Sakiah; Wahyuni, M. Analysis of C-organic, nitrogen, phosphorus, and potassium in application areas and without application of palm oil mill effluent. J. Agric. Vet. Sci. 2018, 11, 23–27. [Google Scholar]
  86. Muyang, K.S.T.; Ahmed, O.H.; Khew, C.Y.; Zehnder, J.A.M.; Jalloh, M.B.; Musah, A.A.; Abdu, A. Chemical and biological characteristics of organic amendments produced from selected agro-wastes with potential for sustaining soil health: A laboratory assessment. Sustainability 2021, 13, 4919. [Google Scholar] [CrossRef]
Figure 1. Uniform manifold approximation and projection (UMAP) analysis of fermentation, washing intensity, and volumetric water-to-rice ratio (W:R) on the measured chemical properties and nutrient content in washed rice water (WRW). The variance in data was mostly explained by W:R and fermentation, with little or no contribution by the washing intensity factor. Note: 1:1, 3:1, and 6:1 denote W:R.
Agronomy 11 02391 g001
Figure 2. Interaction between washing intensity, volumetric water-to-rice ratio (W:R), and fermentation on the means (±SE) of EC, NO 3 - N , 2.57 to 39.72 NH 4 + -N, P, K, Ca, Mg, and Zn of WRW. 0d, 3d, 6d, and 9d are the fermentation periods for 0-, 3-, 6-, and 9-day, respectively, and 1:1, 3:1, and 6:1 are the water-to-rice volume ratios. Except for EC (which is in µS cm−1), all units are in mg kg−1.
Agronomy 11 02391 g002
Figure 3. Interaction trend between washing intensity, volumetric water-to-rice ratio (W:R), and fermentation period on the means (±SE) of pH, C, Cu, N, and S content of WRW. 0d, 3d, 6d, and 9d are the fermentation periods for 0-, 3-, 6-, and 9-day, respectively, and 1:1, 3:1, and 6:1 are the W:R ratios. Except for C (%) and pH, all units of the elements are in mg kg−1.
Agronomy 11 02391 g003
Figure 4. Interaction means (±SE) of total bacterial population in WRW at different W:R ratio within fermentation periods of (a) 100 rpm, (b) 80 rpm and (c) 50 rpm. Means with the same letters within the same column are not statistically different from each other based on Tukey test (p > 0.05).
Agronomy 11 02391 g004
Figure 5. Molecular Phylogenetic analysis by Maximum Likelihood method of Phylogenetic tree derived from analysis of the partial 16S rRNA sequences of WRW1, WRW3, WRW4, WRW6–14 and related sequences obtained from NCBI database. Scale bar, 0.02 substitutions per nucleotide position.
Agronomy 11 02391 g005
Figure 6. Means (± SE) of the pH of the medium by isolates inoculations. 6d and 12d are 6 and 12 days of culture incubation periods.
Agronomy 11 02391 g006
Figure 7. Means (±SE) of acetylene reduction assay of selected strains. Means with different letters are significantly different from one another using HSD at 5% level of significance.
Agronomy 11 02391 g007
Figure 8. Means (±SE) of solubilized phosphorus (A) and potassium (B) of the isolated microbes at different days. Means with different letters within the same chart are significantly different using HSD at 5%. 6d, 12d, 5d, 10d, and 15d represent 6-, 12-, 5-, 10-, and 15-day of incubation period.
Agronomy 11 02391 g008
Table 1. Means (± SE) element analyzes of medium-grained rice and the tap water used for washing the rice.
ParametersRice GrainWRW *Tap Water
pH6.53 ± 0.026.58 ± 0.02
EC (µS cm−1)372.83 ± 34.53125.36 ± 28.21
Ash (%)0.95 ± 0.04
TOC (%)30.30 ± 0.212.64 ± 0.72Trace
Moisture (%)14.39 ± 0.0699.32 ± 0.31
Total C (%)40.30 ± 0.013.87 ± 0.240.03 ± 0.002
Total N (mg kg−1)12,500 ± 100.7080.50 ± 5.20 30.20 ± 4.12
NH 4 + -N (mg kg−1)215.45 ± 4.4118.88 ± 1.681.44 ± 0.04
NO 3 - N (mg kg−1)100.82 ± 8.5316.02 ± 1.411.45 ± 0.03
C:N32.24 ± 0.0248.3 ± 5.640.50 ± 0.001
S (mg kg−1)1000 ± 38.12452 ± 62.15100 ± 9.64
P (mg kg−1)1320.83 ± 34.0464.64 ± 5.760.05 ± 0.02
K (mg kg−1)1130.83 ± 22.64130.66 ± 2.555.74 ± 0.15
Ca (mg kg−1)427.08 ± 5.7223.97 ± 2.6810.95 ± 0.06
Mg (mg kg−1)244.93 ± 10.2625.23 ± 1.780.97 ± 0.06
Cu (µg kg−1)5250 ± 120.40 188.52 ± 11.502.4 ± 1.02
Zn (µg kg−1)5020 ± 97.04 73.77 ± 7.735.3 ± 1.30
B (µg kg−1)1400 ± 96.45 121.18 ± 23.931.2 ± 1.02
Note: All % for rice grains are based on dry weight basis;—not determined; measured in mg L−1; * unfermented washed rice water averaged across all washing intensities (50, 80, and 100 rpm) and volumetric water-to-rice ratios (W:R) (1:1, 3:1, and 6:1).
Table 2. Chemical properties of unfermented washed rice water (WRW) due to the: (a) main effect W:R and (b) interaction effect between washing intensity (R) and volumetric water-to-rice ratio (W:R).
(a)
W:R pHCC:N NH 4 + -N NO 3 - N CaS
% mg kg−1
1:1 6.48b2.48c35.17b9.94c9.78b9.05c110.68c
3:1 6.47b3.76b38.68b17.74b14.94b21.02b449.33b
6:1 6.63a5.37a68.05a28.95a23.35a41.84a797.13a
SE (±) 0.040.135.351.231.480.5549.80
(b)
Washing
Intensity
(R)
W:RECTNPKMgCuZn
rpm µS cm−1mg kg−1
100 1:1607.0b115.0a98.0a129.7c35.4a0.111e0.105ab
80 551.3c67.0bc90.8ab118.1de34.9a0.112e0.101ab
50 671.7a56.6c93.3ab117.5de36.5a0.133de0.144a
100 3:1332.0d101.0ab82.0b141.9b25.7bc0.243a0.060bcd
80 291.1d93.0ab57.7c123.8cd19.3cd0.193bc0.060bcd
50 283.4d100.6ab79.2b139.6b30.0ab0.161cd0.089bc
100 6:1223.5e50.0c19.6e112.9e13.5d0.244a0.046cd
80 212.7e47.0c35.4d153.1a17.2d0.260a0.040d
50 182.7e35.4c25.3de138.9b14.2d0.240ab0.018d
W:R ******ns*ns*ns
R *********************
R × (W:R) *****************
SE (±) 10.907.143.131.761.470.00980.0095
Within the same column, means with the same letters are not significantly different from one another according to the Tukey test (p > 0.05). *** significant at 0.1%, ** significant at 1%, * significant at 5%.
Table 3. Bacterial identification using 16S rRNA gene amplification.
Molecular Identification
StrainFermentation Period Accession NumberClose Relatives in NCBISimilarity (%)
WRW-13dMW365554.1Bacillus velezensis strain HSB199.35
WRW-33dMW365555.1Enterobacter ludwigii strain SDI-1998.75
WRW-43dMW365556.1Enterobacter sp. Strain LSB1999.10
WRW-60dMW365557.1Enterobacter sp. Strain LSB397.59
WRW-76dMW365558.1Enterobacter mori strain BC198.51
WRW-86dMW365559.1Bacillus velezensis strain 265699.70
WRW-96dMW365560.1Stenotrophomonas maltophilia strain JM1199.87
WRW-109dMW365561.1Enterobacter sp. Strain LSB1099.49
WRW-119dMW365562.1Enterobacter mori strain BC199.19
WRW-123dMW365563.1Klebsiella pneumoniae strain LB-AMP3KSU99.87
WRW-133dMW365564.1Pantoea agglomerans stain SVMR97.92
WRW-149dMW365565.1Stenotrophomonas maltophilia strain F4199.47
Table 4. Qualitative biochemical characterizations of the screened strains.
StrainsN2 FixationPSKSPSIKSIGram Stain
Bacillus velezensis strain WRW-1++1.31.2
Enterobacter ludwigii strain WRW-3+++1.40+
Enterobacter sp. strain WRW-4+++1.20
Enterobacter sp. strain WRW-6++1.20
Enterobacter mori strain WRW-7++1.20+
Bacillus velezensis strain WRW-8++1.41.3+
Stenotrophomonas maltophilia strain WRW-9+++++1.51.3
Enterobacter sp. strain 10+++1.60
Enterobacter mori strain WRW-11+1.160
Klebsiella pneumoniae strain WRW-12++++++1.502.3
Pantoea agglomerans strain 13++++++1.531.2
Stenotrophomonas maltophilia strain WRW-14+++1.21.1
Note: PS is phosphorus solubilization, PSI is phosphorus solubilization index, KS potassium solubilization, KSI is potassium solubilization index, −is negative, +, ++, +++ indicates the intensity as low, moderate, and high of the color or clarity of the halo zones.
Publisher’s Note: MDPI stays neutral with regard to jurisdictional claims in published maps and institutional affiliations.

