Response of Switchgrass Grown for Forage and Bioethanol to Nitrogen, Phosphorus, and Potassium on Semiarid Marginal Land

1
Key Laboratory of Agricultural Water Resources, Hebei Key Laboratory of Agricultural Water-Saving, Center for Agricultural Resources Research, Institute of Genetics and Developmental Biology, Chinese Academy of Science, Shijiazhuang 050022, China
2
College of Agronomy and Biotechnology, China Agricultural University, Beijing 100193, China
3
National Energy R&D Center for Non-food Biomass, China Agricultural University, Beijing 100193, China
*
Author to whom correspondence should be addressed.
Agronomy 2020, 10(8), 1147; https://doi.org/10.3390/agronomy10081147
Submission received: 13 July 2020
/
Revised: 1 August 2020
/
Accepted: 2 August 2020
/
Published: 6 August 2020
(This article belongs to the Special Issue Biomass Crop Production, Management, and Ecophysiology)
Abstract
:A two-year nutrient omission trial was conducted on semiarid wasteland to determine the effects of nitrogen (N), phosphorus (P), and potassium (K) on the chemical composition and theoretical ethanol yield (TEY) of switchgrass (Panicum virgatum L.). The fertilizer treatments were the following: NPK, PK, NK, NP, and no nutrient inputs (CK). Results indicated that the crude protein (CP) content and protein yield of switchgrass aboveground biomass decreased significantly in the PK treatment (N omission) and the CK, compared with the NPK treatment. The omission of N, P, or K did not significantly affect the other feed and energy quality indicators. When averaged across the two years, the neutral- and acid-detergent fiber contents were lower in the NPK and NP treatments, but the CP, dry matter digestibility, dry matter intake, total digestible nutrients, net energy for lactation, and relative feed value were higher, indicating that the suitable application with combination of N and P was helpful to improve the forage quality of switchgrass. In PK and CK treatments, the contents of soluble sugar, cellulose, and hemicellulose were higher but that of ash was lower than that in other three treatments, indicating that no N application meant better quality of switchgrass aboveground biomass for bioethanol production. The TEY at NPK was 2532 L ha−1 in 2015 and 2797 L ha−1 in 2016; in particular, the TEY decreased significantly by 15.1% in PK, 14.7% in NK, 10.5% in NP, and 29.9% in CK in 2016. To conclude, N was the most limiting factor in switchgrass productivity and the combined N, P, and K nutrient supply management strategy is recommended based on the consideration of quality and quantity of switchgrass as forage and bioenergy feedstock on semiarid marginal land.
1. Introduction
Switchgrass (Panicum virgatum L.) is a perennial C4 grass widely distributed in North America. In recent years, it has been successfully introduced in northern China [1,2]. The crop is one of the most photosynthetically efficient crops and therefore has been proposed as a model feedstock crop to generate both forage and non-food bioethanol [3]. The most desirable characteristics of switchgrass, when it is considered as a bioenergy feedstock, include its low input requirements, high biomass yield potential, and high cellulose but low lignin and ash contents [4,5]. Because of the adequate nutrients, such as a high crude protein (CP) content and quality of fibers, switchgrass aboveground parts are widely used as forage [6].
Moreover, switchgrass is popularly planted on marginal lands in semiarid regions due to its high tolerance to various stresses and high nutrient- and water-use efficiencies [7,8]. The sustainable development of switchgrass on marginal lands at low-cost and with high-yielding biomass feedstock of desirable quality is currently a promising solution to address the China’s increasing demand for bioenergy feedstock, as well as to overcome the country’s shortages of forage. However, poor infrastructure and soil fertility are problems that face crop production on marginal lands, resulting in a lower biomass quality and yield compared to the same crop grown in normal croplands [9]. Therefore, the proper management of nutrients is of great significance in promoting the development of switchgrass grown on marginal lands [10].
Nitrogen (N) is the most important nutrient and cellular structural protein in the process of plant growth and plays a key role in cell division [11]. Phosphorus (P) is also an important component of plant, which is involved in plant photosynthesis and respiration as the basic substance of nucleic acids [12,13]. Potassium (K) is primarily involved in enzyme activation [14,15]. The application of NPK fertilizer affects switchgrass growth and development processes and contributes to dry matter formation [16,17]. Previous studies suggested that N is the foremost agronomic stimulant for plants’ productivity [18]; however, for the most efficient use of N and to increase production and stabilize crops yield, the crops also require the uptake of sufficient P and K [19,20,21]. Accordingly, the response of crops productivity to nutrient omissions has been the focus of extensive research. Subedi and Ma [22] reported that lack of N and K application reduced maize (Zea mays L.) yields by 10–22% and 13%, respectively, but the omission of P had a lesser effect, in a humid temperate region of eastern Canada. Dai et al. [23] reported that in China Huaihe River Basin the most limiting element is N for the growth and yield of rice (Oryza sativa L.) and winter wheat (Triticum aestivum L.), compared with P and K. In a nutrient omission study, Kurwakumire et al. [24] discovered that N and P remained the most limiting nutrients for maize productivity, whereas the addition of K did not increase grain yield. Wang et al. [25] found that seed yield and dry biomass of winter oilseed rape (Brassica napus L.) are reduced, respectively, 61.0% and 60.6% by N deficiency, 38.3% and 37.2% by P deficiency, and 14.4% and 14.3% by K deficiency.
Switchgrass produced for biofuel responds positively to N fertilizer in numerous studies, although there were some variety and location variations [10,26,27,28]. Hoagland et al. [29] reported the positive response of biomass and thermal energy yields of switchgrass to N fertilizer. In addition, Sadeghpour et al. [30] found that N fertilizer had little effect on biofuel quality (minerals and non-structural carbohydrates) of switchgrass. Ameen et al. [31] elucidated that the application of N fertilizer significantly increased switchgrass CP content, protein yield, and bioethanol yield, but did not affect other quality components of forage and biofuel feedstock. The response of switchgrass produced for both forage and bioenergy to P and K fertilization has also been examined [13,15,32]. However, little information is available on the effects of N, P, or K nutrients deficiency on chemical compositions of switchgrass produced on semiarid marginal land under rain-fed conditions. Moreover, the management practices of the switchgrass used for bioenergy and forage are different [33]. For bioenergy purpose, the focus is primarily on biomass yield and quality, whereas for forage, the nutritive value is equally important. To make the fertilizer management of switchgrass clearer and more efficient for forage or biofuel production, a better understanding of the effects of different nutrient treatments on the feedstock and identifying the limiting nutrient is needed.
Thus, the objectives here were (1) to clarify the quality compositions and theoretical ethanol yield (TEY) (quantitative index) of switchgrass for forage and bioenergy in responses to N, P, and K omissions; and (2) to determine which of the N, P, and K is the most limiting factor in switchgrass productivity. The findings of this study are expected to help determine the N, P, and K fertilization strategy of switchgrass grown as a bioethanol and forage feedstock in rain-fed, sandy wastelands in semiarid regions.
2. Materials and Methods
2.1. Experimental Site
A two-year field experiment was conducted on a sandy wasteland in Ganqika (42°58’ N, 122°51´ E, 179 m above sea level) in East Inner Mongolia, North China. The study site has a semiarid climate and the soil belongs to Aridosol with texture of loamy sand according to the USA soil classification [34]. Multi-year (30-year) average precipitation is 451 mm compared with the potential evaporation of 2000 mm. Multi-year mean maximum and minimum air temperatures are 13.6 °C and 2.3 °C, respectively. The switchgrass growing period was from May to September, and the precipitation during the period was 421 mm in 2015 and 344 mm in 2016 (Figure 1). The mean maximum and minimum air temperatures were 26.6 °C and 15.4 °C in 2015 and 27.4 °C and 16.1 °C in 2016, respectively. Loamy sand soil (79% sand, 11% silt, and10% clay) had a pH of 8.3 with 8.9 g kg−1 organic matter. The total nitrogen (0.6 g kg−1), available phosphorus (8.8 mg kg−1), and available potassium (129.3 mg kg−1) were tested within 20 cm of surface layer soil, used the average values for 2015 and 2016.
2.2. Experimental Design and Operation
Firstly, a switchgrass (var. Blackwell, Oklahoma, USA) field with a 5-ha area was planted in rows in 2008. The width between rows was 60 cm, however, as the growing years increased, the plant row width increased continuously, and by 2015 the row width was about 20 cm, while the width between rows was about 40 cm. Before planting, the land was ploughed with depth of 20 cm. During the first three years of planting, irrigation was carried out in the field once a year with 60 m3 fresh water, weeds were removed, and 300 kg ha−1 urea was applied. Mowing was carried out annually before frost with stubble height of 5 cm. The experiment was conducted in the field in 2015 and 2016, at which time the average plant tillers density was 1202 m−2. A randomized complete block design with four replications was implemented with the nutrient treatments showing in Table 1 and including a complete dose of the recommended fertilizer mixtures of NPK, doses with PK, NK, or NP, and no fertilizer input as control (CK). The total area of the experiment was 800 m2, and each replicate plot was 3 m × 6 m in size.
In the both study years, the switchgrass plants returned to green stage on 18 May. On 6 July (elongation date), and 11 August (anthesis date) in both years, fertilizers of N as urea, P2O5 as triple superphosphate, and K2O as potassium sulfate were applied according to the treatments design (Table 1). The switchgrass cultivation trials were rain-fed, and weeds were removed manually in either year. Chemicals were not applied to control weeds, insects, and diseases, which did not adversely affect the crop.
2.3. Sample Collection and Measurements
On 27 September 2015 and 28 September 2016, a 1 m2 area (three random rows, each row harvested with the length of 55.6 cm) of aboveground switchgrass plants was harvested manually in each plot. Additionally, for detecting biomass, each plot fresh weight was collected. A part of the switchgrass samples was separated into three tissues, namely leaves (blade and sheath), stems, and panicles. The three parts of plant were weighed separately for fresh weight test. Samples were cut into 2–3 cm lengths by using a hand hay cutter and then subsampled and weighted. To calculate the dry biomass yield, one subsample of fresh weight was weighed before inserting into an oven at 70 °C to dry at a constant weight. The dried aboveground samples (stems, leaves, and panicles) were sieved to pass through a 0.5-mm mesh, and then the samples were temporarily stored in a 4 °C refrigerator for chemical analysis.
We measured the CP content by Kjeldahl distillation method [35] and protein yield was calculated by multiplying CP by the biomass yield. The soluble sugar content was determined by the anthrone method [36] with a UV-VIS spectrometer (TU-1901, Beijing Purkinje Instruments Co., Ltd., Beijing, China). Neutral- and acid-detergent fiber (NDF, ADF) and acid detergent lignin were measured with an Ankom apparatus (Ankom 220, Fairport, NY, USA) [37]. Cellulose and hemicellulose were calculated by the difference between ADF and acid detergent lignin and the difference between NDF and ADF, respectively. The ash content was determined in a muffle furnace (VULCAN 3–550, Densply International Inc., York, PA, USA) at 550 °C.
2.4. Calculations and Data Analyses
Some animal feed quality indices were calculated by formulas [38,39], such as dry matter digestibility (DMD), dry matter intake (DMI), relative feed value (RFV), total digestible nutrients (TDN), and net energy for lactation (NEL).
In this study, theoretical ethanol yield (TEY) included two components one was soluble sugar (TEYSS) and another was insoluble sugar (cellulose and hemicellulose) (TEYIS), which were calculated by the following equation [40]:
where F1 = 0.51, is the conversion factor of sugar to ethanol; F2 = 0.85, is the process efficiency of sugar converted to ethanol; F3 = 1.11, is the conversion factor of cellulose and hemicellulose to sugar; F4 = 0.85, is the process efficiency of cellulose and hemicellulose to sugar; ρ = 0.79 g mL−1, is the specific gravity of ethanol.
Four replications were used to calculate the means and standard errors. To assess the effects of year, nutrient treatment, and their interaction, SPSS 24.0 analytical software package (IBM SPSS Inc., Chicago, IL, USA) was used to perform the ANOVA analysis. For significance analysis of the means, the F-protected least significant difference test was carried out at the p < 0.05 level.
3. Results
3.1. Effects of Year, Nutrient Treatment, and Their Interaction
The ANOVA results for the effects of year, nutrient treatment, and year × nutrient treatment on all studied parameters are presented in Table 2. Both year and nutrient treatment significantly affected the ash (p < 0.001, p < 0.05, respectively) and TEY (p < 0.05, p < 0.001, respectively). The NDF (p < 0.001), DMI (p < 0.001), RFV (p < 0.001), soluble sugar (p < 0.05), and hemicellulose (p < 0.001) were significant affected by year, whereas the nutrient treatment showed significant effected on CP content (p < 0.001) and protein yield (p < 0.001). The year × nutrient treatment interaction significantly affected NDF, DMI, and RFV (p < 0.01).
3.2. Biomass Compositions
The average CP content in aboveground switchgrass in the nutrient treatments across the two experimental years was 53.5 g kg−1 in NPK, 55.2 g kg−1 in NP, 51.4g kg−1 in NK, and 47.1 g kg−1 in PK (Table 3). These CP values were higher (p < 0.05) than that of CK by 26.0% (NPK), 30.5% (NP), 21.5% (NK), and 11.3% (PK). The highest CP values were in the NP treatment, with 54.8 g kg−1 and 55.5 g kg−1 in 2015 and 2016, respectively. The other compositions of aboveground forage quality (i.e., NDF, ADF, DMD, DMI, TDN, NEL, and RFV) were not significantly affected by nutrient treatments, and no obvious patterns were observed in these chemical compositions during the two years (Table 3). The highest NDF and ADF values were in the NK treatment in 2015 but in the NP or PK treatment in 2016. The results of DMD, DMI, TDN, NEL and RFV are opposite; these parameters values were higher in the NP and NPK treatments in 2015, and correspondingly were higher in the NK in 2016. When averaged across nutrient treatments, the NDF content was lower by 5.7% in 2015 than that in 2016 (p < 0.05). However, the DMI and RFV averaged across the five nutrient treatments in 2015 were higher (p < 0.05) by 5.8% and 7.2%, respectively, than those for 2016 (Table 3).
Contents of soluble sugar, cellulose, hemicellulose, and ash in aboveground switchgrass were not significantly different among the various nutrient treatments in either year (Table 4), except for hemicellulose in 2015 and ash in 2016. The average soluble sugar content over the years was 9.7% higher in the PK (N omission) than that in the NPK (74.6 g kg−1). For the two-year average, the highest cellulose (319.3 g kg−1) and hemicellulose (276.9 g kg−1) content were observed in the CK. By contrast, the plant ash content was significantly lower in the PK and CK than that in the N nutrient treatments (NPK, NK, and NP). The average soluble sugar content of each nutrient treatments was higher in 2015 (82.0 g kg−1) than that in 2016 by 10.7% (p < 0.05); whereas, the opposite trend was found for hemicellulose and ash contents, which were higher (p < 0.05) in 2016 than in 2015.
3.3. Partitioning of Chemical Compositions
Unexpectedly, nutrient treatments had non-significant effects on most of the selected forage and bioenergy quality components of leaves, stems, and panicles. Averaged across nutrient treatments and both years, panicles had the highest values of CP, DMI, DMD, TDN, NEL, RFV, and ash, followed by leaves and stems (Figure 2). The opposite order was observed for NDF, ADF, soluble sugar, cellulose, and hemicellulose contents. The CP content in panicles averaged across years and treatments was 1.8-fold higher than that in leaves and 5.6-fold higher (p < 0.05) than that in stems. Compared with contents in panicles, the NDF and ADF averaged across years and treatments were significantly higher in stems, by approximately 25.3% and 32.1%, respectively (p < 0.05). Whereas, the values of DMI, DMD, TDN, NEL, and RFV in panicles were 25.6%, 12.6%, 23.9%, 19.5%, and 41.5% higher than that in stems, respectively (p < 0.05). Moreover, the highest NDF and ADF values in stems were observed in the NK treatment. Similarly, the highest values of DMD, DMI, TDN, NEL, and RFV for panicles averaged across years were in the NK treatment (P omission).
When averaged across nutrient treatments and years, the contents of soluble sugar (2.2-fold), cellulose (1.3-fold), and hemicellulose (1.2-fold) were higher (p < 0.05) in stems than in panicles (Figure 2). By contrast, the ash (1.6-fold) content was higher in panicles than in stems. Furthermore, the highest contents of soluble sugar, cellulose, and hemicellulose in stems were in the CK, compared with the other nutrient treatments. The highest level of ash was in panicles in the NP treatment in both years, with 78.8 g kg−1 in 2015 and 94.9 g kg−1 in 2016.
3.4. Crude Protein Yield and Theoretical Ethanol Yield
The average protein yields across the two years were 421.3 kg ha−1 for the NPK, 372.4 kg ha−1 for the NP, and 355.5 kg ha−1 for the NK (Figure 3), which were significantly higher than the yields for the PK (299.2 kg ha−1) and the CK (227.2 kg ha−1).
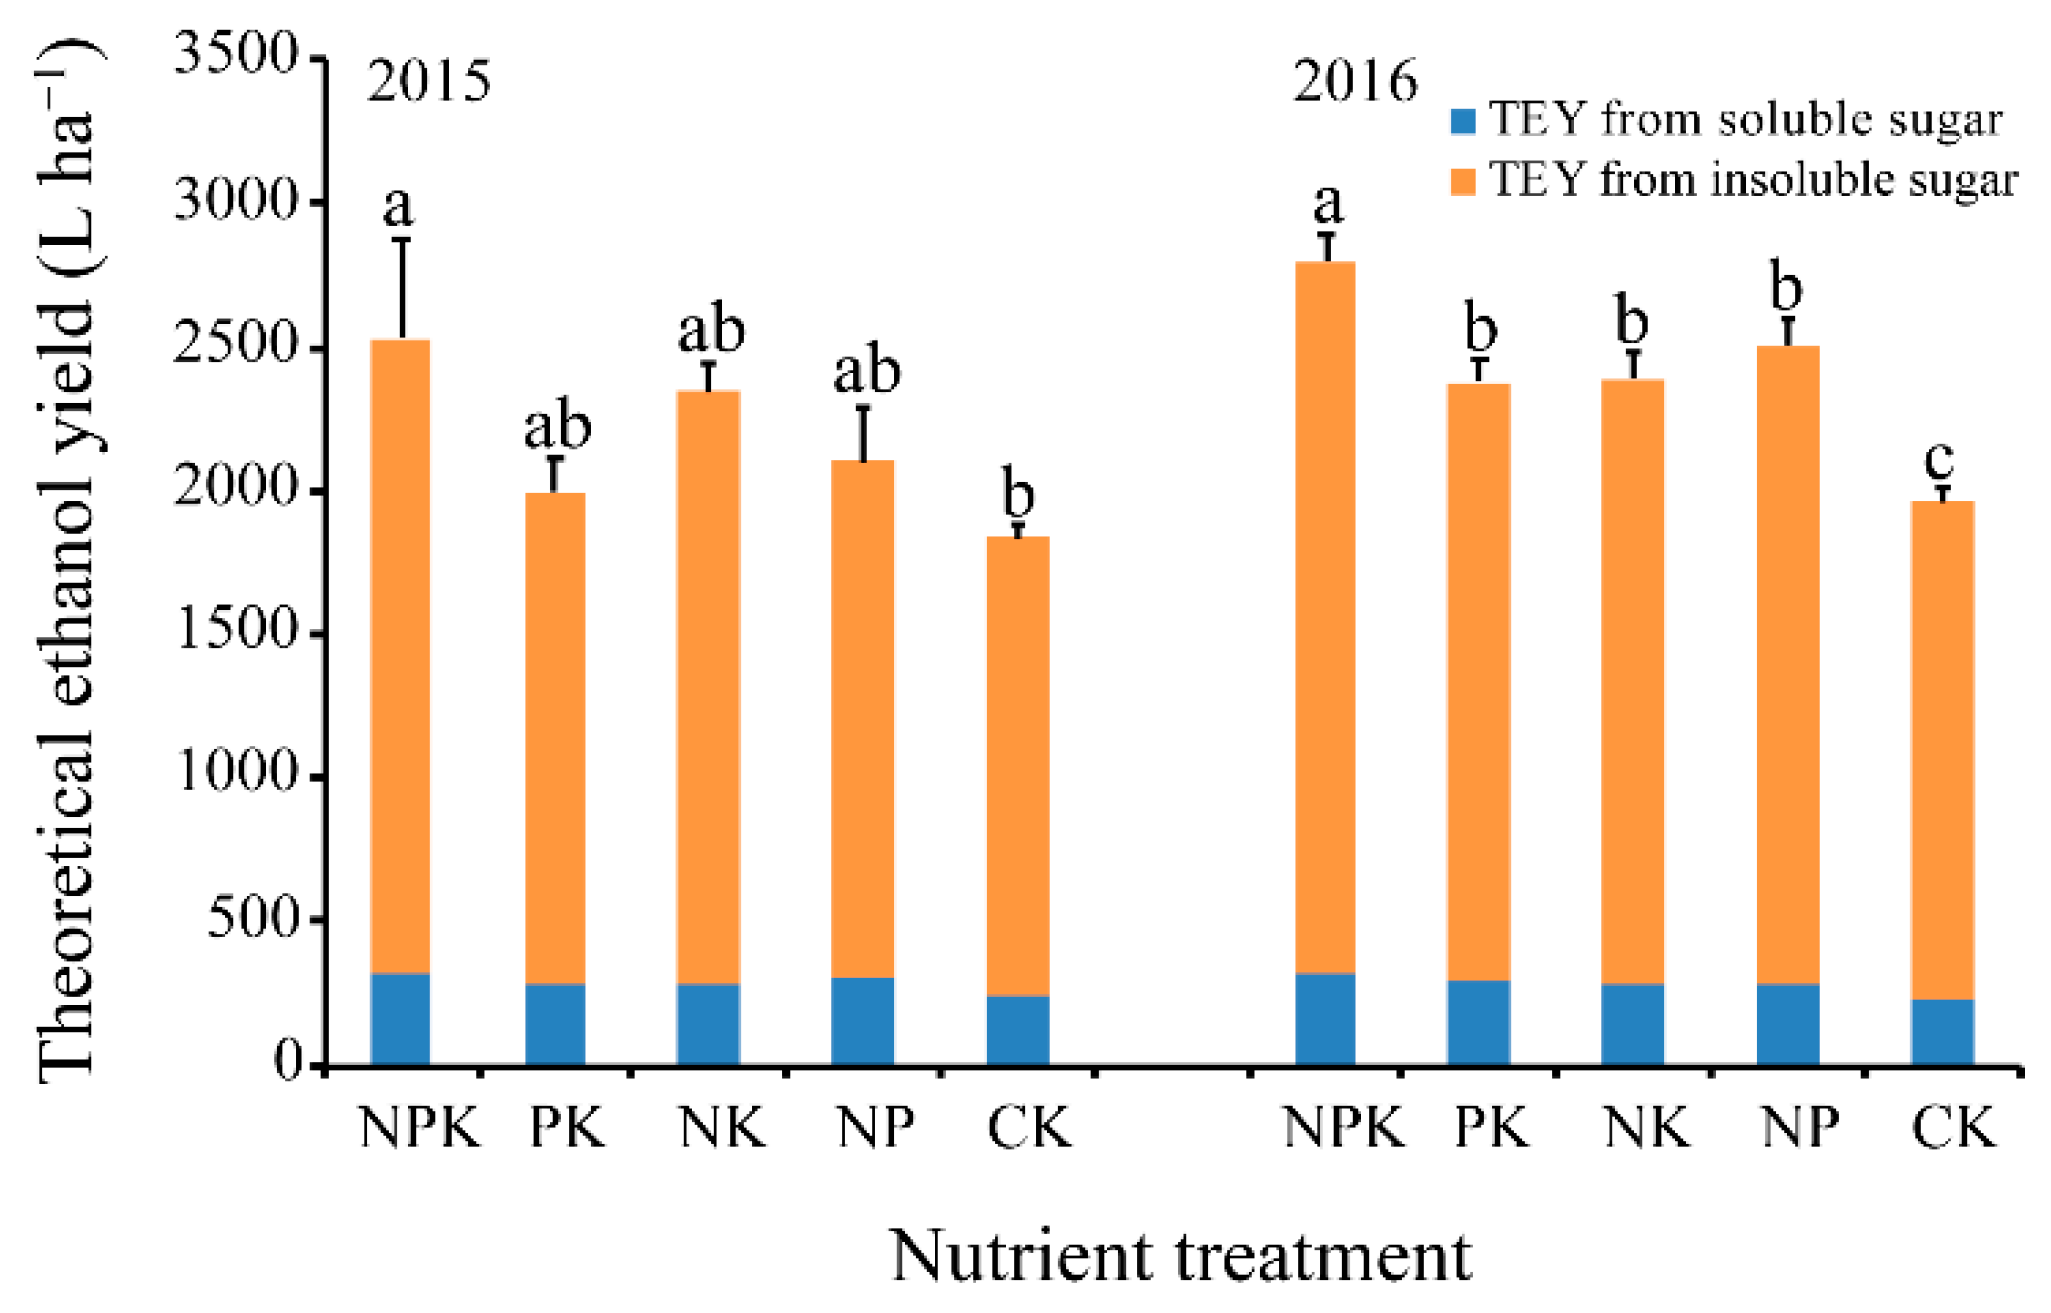
The TEY ranged from 1836 to 2532 L ha−1 in 2015 and from 1960 to 2797 L ha−1 in 2016 and tended to be the highest in the NPK and the lowest in the CK (Figure 4). Compared with the NPK treatment, the PK, NK, and NP treatments resulted in a significant (p < 0.05) reduction in TEY (15.1%, 14.7%, and 10.5% lower) in 2016; but, the TEY was not significant in 2015 for these treatments. The TEY from insoluble sugar (cellulose and hemicellulose) was the highest proportion (87.6%) of total yield, regardless of nutrient treatment or year (Figure 4). Furthermore, a significant positive relationship was detected between protein yield and TEY (r = 0.825, p < 0.01), indicating that the protein yield and TEY could be improved synergistically.
4. Discussion
4.1. N Supply Needs to Be the Focus for Switchgrass as a Candidate Forage Crop
Although maize is currently the more common silage crop, switchgrass is emerging as an alternative or supplement forage crop that can be cultivated in marginal conditions because of its lower nitrogen and water requirements. When compared with the full application of all macro-elements in this study, the CP content and protein yield of switchgrass decreased significantly with the omission of N, whereas the omission of P and K had less effect in both cropping years, suggesting a soil deficiency of N. This result is consistent with that of previous studies that confirm N is the major nutrient requirement for switchgrass [3,28,41]. Nitrogen application can improve the forage quality of switchgrass by increasing CP content [42]. Burton et al. [43] reached similar conclusions and found that N greatly increased CP in Bermuda grass (Cynodon dactylon L. ‘Coastal’) and that the omission of P and K reduced annual forage yields but had little, if any, effect on the CP. Indeed, in the P and K omission treatments in this study, a slight reduction was observed in protein yield. Furthermore, switchgrass receiving a combined application of fertilizers produces more biomass than with the N fertilizer alone [13,15,32,44]. Therefore, nutrient supply and demand should be matched when developing sustainable switchgrass cropping systems, and a proper scheme of N, P, and K nutrient in low-fertility wastelands (i.e., specific soil conditions) should be fully considered.
Although slightly better forage quality was observed in aboveground switchgrass in the NPK or NP treatment when averaged across years, the N, P, or K deficiency had relatively little effect on fiber quality than protein yield, indicating the forage quality of switchgrass was greatly limited by other factors, such as genotype, growth year, harvest frequency and time, and water supply [41,42,45,46]. As Allison et al. [45], Kering et al. [15], and Ameen et al. [31] reported that the application of fertilizers had limited effects on switchgrass cell wall composition. The latter authors suggested that a rate of N fertilization (60 kg N ha−1) combined with P (100 kg ha−1) and K (45 kg ha−1) is sufficient to produce good quality forage on semiarid marginal land. Furthermore, the panicles of switchgrass showed significant increases in forage quality compositions compared with those in stems and leaves. These results are consistent with those reports by Burner et al. [47] and Cherney et al. [48]. Combined with high N content of panicles has a negative impact on the feedstock quality for bioenergy utilization, so switchgrass panicle is more suitable for forage.
4.2. Application of NPK Needs to Be the Focus for Switchgrass as a Candidate Bioenergy Crop
The increasing demand for maize-based ethanol will create a significant arable land requirement [49]. Currently, switchgrass is considered a viable long-term ethanol feedstock to replace maize, and with the use of marginal lands, the emerging switchgrass bioenergy industry is likely to have economic, environmental, and social benefits [6,50,51].
It was found that TEY of CK decreased significantly, which revealed that nutrient reserve of sand wasteland in the study area was insufficient, and fertilization was still the key to efficient production. Of the various treatments with nutrient deficiencies, N deficiency had the largest negative effects on the TEY. Similarly, Jungers et al. [52] reported that N fertilization consistently increases switchgrass ethanol yield, whereas the effect of P and K fertilizers is limited. The ethanol yield dropped in the N, P, and K omission (particularly N omission) compared with NPK which was consistent with previous reports [31,53]. The consistently higher average ethanol yields in the NPK treatment than those in the other treatments, coupled with the lower variability in yield observed for this treatment, indicate that amendment with NPK helps to reduce spatial-temporal variability [19]. Thus, the input of N is important for switchgrass produced in marginal lands for bioenergy feedstock, and the proper nutrient management (N, P, and K) is required for maximum biofuel production [15]. Moreover, the average ethanol yields on marginal land in this study (2665 L ha−1) are comparable with yields in previous field experiments conducted under similar marginal conditions. For example, the TEY of switchgrass approached 2491 L ha−1 on a semiarid sandy wasteland [54]. Ameen et al. [31] found that ethanol production fluctuated from 2126 to 2426 L ha−1 for switchgrass conducted at the same site as in the present study. On saline-alkali land in a semi-humid region, the TEY of maize straw is 1800 L ha−1 [55]. It was reported that the TEY of switchgrass was 3919 L ha−1, when applying best management practices, slightly higher than that of maize aboveground plant, which ranged from 2862 to 3826 L ha−1 on marginal land [53]. These results highlight that switchgrass dedicated for bioenergy use will need to have similar or greater TEY than that of the current annual crop (maize) for widespread adoption to meet renewable energy demands, particularly on marginal, infertile soils in semiarid, rain-fed regions.
In addition to ethanol yield, the soluble sugar, cellulose, and hemicellulose are important quality parameters when switchgrass is produced as feedstock for biofuel. However, the omission of N, P, or K had no significant effect on these indicators. With the omission of N (PK) and CK treatments, the feedstock quality of switchgrass as a biofuel crop was marginally greater than with the other nutrient treatments. Similar to previous studies, it indicated that N fertilization has no meaningful effect on the biomass quality other than the yield of the biofuel produced [16,31,56]. Therefore, the desired feedstock characteristics can be manipulated via breeding programs and other types of cultivation managements.
For the ideal quality of switchgrass as ethanol feedstock, high contents of soluble sugar, cellulose, and hemicellulose and low contents of N and ash are desired. The stems and leaves are more meaningful compared with panicles of switchgrass for TEY production; they not only contribute the greatest proportion to total plant biomass but also have better quality of the compositions mentioned above. These results are similar to the reports of Madakadze et al. [57] and Cherney et al. [48]. As switchgrass matures, more energy is partitioned to reproductive (stem) development, and stems have greater fiber and total non-structural carbohydrates contents [47,58]. To obtain optimal bioenergy crop production, minimizing ash and N contents of stem and leaf tissues is beneficial [30,59,60]. In another study, a low N content in samples minimized NOx emissions during the combustion process and showed a positive correlation between with a high heating value [47,61]. Overall, stem and leaf are more suitable than panicles as bioethanol feedstock or combustion feedstock for electricity generation.
5. Conclusions
Switchgrass is proposed as a candidate feedstock for either bioethanol or silage production on sandy wastelands in the semiarid, rain-fed conditions of North China. The N omission treatment had the greatest negative effect on CP content, protein yield, and TEY, followed by P or K deficiency. However, the forage and bioenergy quality compositions of switchgrass were less sensitive to the omission of N, P, or K. The partitioning of compositions indicated the panicles of switchgrass had higher contents of nutrients for forage, whereas the compositions of stems and leaves were better suited for bioethanol production. Overall, N was the most limiting factor in switchgrass productivity and integrated NPK nutrient management has an overriding effect on the switchgrass cultivation systems in semiarid marginal lands.
Author Contributions
C.-C.T. performed the laboratory experiments and drafted the manuscript. L.-P.H. designed and conducted the field experiment, collected the data, and revised the manuscript. G.-H.X. supervised the field and laboratory work and finalized the manuscript. All authors have read and agreed to the published version of the manuscript.
Funding
This work was supported by the National Natural Science Foundation of China (31470555) and Youth Innovation Promotion Association of Chinese Academy of Sciences (2018132).
Acknowledgments
We sincerely thank Xiong Shaojun and Tongliao Sanhe grass co., LTD for their site assistance in this study.
Conflicts of Interest
The authors declare that they have no conflict of interest.
References
- Xiong, S.; Zhang, Q.G.; Zhang, D.Y.; Olsson, R. Influence of harvest time on fuel characteristics of five potential energy crops in northern China. Bioresour. Technol. 2008, 99, 479–485. [Google Scholar] [CrossRef] [PubMed]
- Yue, Y.; Hou, X.; Fan, X.; Yi, Z.; Zhao, C.; Wu, J. Biomass yield components for 12 switchgrass cultivars grown in Northern China. Biomass Bioenergy 2017, 102, 44–51. [Google Scholar] [CrossRef]
- Guretzky, J.A.; Biermacher, J.T.; Cook, B.J.; Kering, M.K.; Mosali, J. Switchgrass for forage and bioenergy: Harvest and nitrogen rate effects on biomass yields and nutrient composition. Plant Soil 2011, 339, 69–81. [Google Scholar] [CrossRef] [Green Version]
- Mclaughlin, S.B.; Kszos, L.A. Development of switchgrass (Panicum virgatum) as a bioenergy feedstock in the United States. Biomass Bioenergy 2005, 28, 515–535. [Google Scholar] [CrossRef]
- Schmer, M.R.; Vogel, K.P.; Mitchell, R.B.; Perrin, R.K. Net energy of cellulosic ethanol from switchgrass. Proc. Natl. Acad. Sci. USA 2008, 105, 464–469. [Google Scholar] [CrossRef] [Green Version]
- Mitchell, R.B.; Schmer, M.R.; Anderson, W.F.; Jin, V.; Balkcom, K.S.; Kiniry, J.; White, P. Dedicated energy crops and crop residues for bioenergy feedstocks in the central and eastern USA. Bioenergy Res. 2016, 9, 384–398. [Google Scholar] [CrossRef] [Green Version]
- Berti, M.T.; Johnson, B.L. Switchgrass establishment as affected by seeding depth and soil type. Ind. Crops Prod. 2013, 41, 289–293. [Google Scholar] [CrossRef]
- Duclos, D.V.; Ray, D.T.; Johnson, D.J.; Taylor, A.G. Investigating seed dormancy in switchgrass (Panicum virgatum L.): Understanding the physiology and mechanisms of coat-imposed seed dormancy. Ind. Crops Prod. 2013, 45, 377–387. [Google Scholar] [CrossRef]
- Tang, C.; Li, S.; Li, M.; Xie, G.H. Bioethanol potential of energy sorghum grown on marginal and arable lands. Front. Plant Sci. 2018, 9, 440. [Google Scholar] [CrossRef] [Green Version]
- Anderson, E.K.; Parrish, A.S.; Voigt, T.B.; Owens, V.N.; Hong, C.H.; Lee, D.K. Nitrogen fertility and harvest management of switchgrass for sustainable bioenergy feedstock production in Illinois. Ind. Crops Prod. 2013, 48, 19–27. [Google Scholar] [CrossRef]
- Stals, H.; Inzé, D. When plant cells decide to divide. Trends Plant Sci. 2001, 6, 359–364. [Google Scholar] [CrossRef]
- Fredeen, A.L.; Rao, I.M.; Terry, N. Influence of phosphorus nutrition on growth and carbon partitioning in Glycine max. Plant Physiol. 1989, 89, 225–230. [Google Scholar] [CrossRef] [PubMed] [Green Version]
- Kering, M.K.; Butler, T.J.; Mosali, J.; Guretzky, J.A. Biomass yield and nutrient responses of switchgrass to phosphorus application. Bioenergy Res. 2012, 5, 71–78. [Google Scholar] [CrossRef] [Green Version]
- Kayser, M.; Isselstein, J. Potassium cycling and losses in grassland systems: A review. Grass Forage Sci. 2010, 60, 213–224. [Google Scholar] [CrossRef]
- Kering, M.K.; Butler, T.J.; Biermacher, J.T.; Mosali, J.; Guretzky, J.A. Effect of potassium and nitrogen fertilizer on switchgrass productivity and nutrient removal rates under two harvest systems on a low potassium soil. Bioenergy Res. 2013, 6, 329–335. [Google Scholar] [CrossRef] [Green Version]
- Lemus, R.; Brummer, E.C.; Burras, C.L.; Moore, K.J.; Barker, M.F.; Molstad, N.E. Effects of nitrogen fertilization on biomass yield and quality in large fields of established switchgrass in southern Iowa, USA. Biomass Bioenergy 2008, 32, 1187–1194. [Google Scholar] [CrossRef] [Green Version]
- Hong, C.O.; Owens, V.N.; Bransby, D.; Farris, R.; Fike, J.; Heaton, E.; Viands, D. Switchgrass response to nitrogen fertilizer across diverse environments in the USA: A regional feedstock partnership report. Bioenergy Res. 2014, 7, 777–788. [Google Scholar] [CrossRef]
- Hao, B.; Xue, Q.; Bean, B.W.; Rooney, W.L.; Becker, J.D. Biomass production, water and nitrogen use efficiency in photoperiod-sensitive sorghum in the Texas High Plains. Biomass Bioenergy 2014, 62, 108–116. [Google Scholar] [CrossRef]
- Njoroge, S.; Schut, A.G.T.; Giller, K.E.; Zingore, S. Strong spatial-temporal patterns in maize yield response to nutrient additions in African smallholder farms. Field Crops Res. 2017, 214, 321–330. [Google Scholar] [CrossRef] [Green Version]
- Ameen, A.; Tang, C.; Han, L.; Xie, G.H. Short-term response of switchgrass to nitrogen, phosphorus, and potassium on semiarid sandy wasteland managed for biofuel feedstock. Bioenergy Res. 2018, 11, 228–238. [Google Scholar] [CrossRef]
- Emami Bistgani, Z.; Ataollah Siadat, S.; Bakhshandeh, A.; Ghasemi Pirbalouti, A.; Hashemi, M.; Maggi, F.; Reza Morshedloo, M. Application of combined fertilizers improves biomass, essential oil yield, aroma profile, and antioxidant properties of Thymus daenensis Celak. Ind. Crops Prod. 2018, 121, 434–440. [Google Scholar] [CrossRef]
- Subedi, K.D.; Ma, B.L. Assessment of some major yield-limiting factors on maize production in a humid temperate environment. Field Crops Res. 2009, 110, 21–26. [Google Scholar] [CrossRef]
- Dai, X.Q.; Zhang, H.Y.; Spiertz, J.H.J.; Yu, J.; Xie, G.H.; Bouman, B.A.M. Crop response of aerobic rice and winter wheat to nitrogen, phosphorus and potassium in a double cropping system. Nutr. Cycl. Agroecosyst. 2010, 86, 301–315. [Google Scholar] [CrossRef]
- Kurwakumire, N.; Chikowo, R.; Mtambanengwe, F.; Mapfumo, P.; Snapp, S.; Johnston, A.; Zingore, S. Maize productivity and nutrient and water use efficiencies across soil fertility domains on smallholder farms in Zimbabwe. Field Crops Res. 2014, 164, 136–147. [Google Scholar] [CrossRef]
- Wang, Y.; Liu, T.; Li, X.K.; Tao, R.; Cong, R.H.; Lu, J.W. Nutrient deficiency limits population development, yield formation, and nutrient uptake of direct sown winter oilseed rape. J. Integr. Agric. 2015, 14, 670–680. [Google Scholar] [CrossRef] [Green Version]
- Springer, T.L. Effect of nitrogen fertilization and residual nitrogen on biomass yield of switchgrass. Bioenergy Res. 2017, 10, 648–656. [Google Scholar] [CrossRef]
- Nazli, R.I.; Tansi, V.; Ozturk, H.H.; Kusvuran, A. Miscanthus, switchgrass, giant reed, and bulbous canary grass as potential bioenergy crops in a semi-arid Mediterranean environment. Ind. Crops Prod. 2018, 125, 9–23. [Google Scholar] [CrossRef]
- An, Y.; Gao, Y.; Ma, Y. Growth performance and weed control effect in response to nitrogen supply for switchgrass after establishment in the semiarid environment. Field Crops Res. 2018, 221, 175–181. [Google Scholar] [CrossRef]
- Hoagland, K.C.; Ruark, M.D.; Renz, M.J.; Jackson, R.D. Agricultural management of switchgrass for fuel quality and thermal energy yield on highly erodible land in the driftless area of Southwest Wisconsin. Bioenergy Res. 2013, 6, 1012–1021. [Google Scholar] [CrossRef]
- Sadeghpour, A.; Gorlitsky, L.E.; Hashemi, M.; Weis, S.A.; Herbert, S.J. Response of switchgrass yield and quality to harvest season and nitrogen fertilizer. Agron. J. 2014, 106, 290–296. [Google Scholar] [CrossRef]
- Ameen, A.; Tang, C.; Liu, J.; Han, L.; Xie, G.H. Switchgrass as forage and biofuel feedstock: Effect of nitrogen fertilization rate on the quality of biomass harvested in late summer and early fall. Field Crops Res. 2019, 235, 154–162. [Google Scholar] [CrossRef]
- Haque, M.; Biermacher, J.T.; Kering, M.K.; Guretzky, J.A. Economics of alternative fertilizer supply systems for switchgrass produced in phosphorus-deficient soils for bioenergy feedstock. Bioenergy Res. 2013, 6, 351–357. [Google Scholar] [CrossRef] [Green Version]
- Muir, J.P.; Sanderson, M.A.; Ocumpaugh, W.R.; Jones, R.M.; Reed, R.L. Biomass production of ‘Alamo’ switchgrass in response to nitrogen, phosphorus, and row spacing. Agron. J. 2001, 93, 896–901. [Google Scholar] [CrossRef]
- Foth, H.D. Fundamentals of Soil Science, 8th ed.; John Wiley & Sons: New York, NY, USA, 1990. [Google Scholar]
- Nelson, D.W.; Sommers, L.E. Total nitrogen analysis of soil and plant tissues. J. Assoc. Off. Anal. Chem. 1980, 63, 770–777. [Google Scholar] [CrossRef]
- Hewitt, B.R. Spectrophotometric determination of total carbohydrate. Nature 1958, 182, 246–247. [Google Scholar] [CrossRef]
- Van Soest, P.; Robertson, J.; Lewis, B. Methods for dietary fiber, neutral detergent fiber, and nonstarch polysaccharides in relation to animal nutrition. J. Dairy Sci. 1991, 74, 3583–3597. [Google Scholar] [CrossRef]
- Lithourgidis, A.S.; Vasilakoglou, I.B.; Dhima, K.V.; Dordas, C.A.; Yiakoulaki, M.D. Forage yield and quality of common vetch mixtures with oat and triticale in two seeding ratios. Field Crop Res. 2006, 99, 106–113. [Google Scholar] [CrossRef]
- Jahanzad, E.; Jorat, M.; Moghadam, H.; Sadeghpour, A.; Chaichi, M.R.; Dashtaki, M. Response of a new and a commonly grown forage sorghum cultivar to limited irrigation and planting density. Agric. Water Manag. 2013, 117, 62–69. [Google Scholar] [CrossRef]
- Zhao, Y.L.; Dolat, A.; Steinberger, Y.; Wang, X.; Osman, A.; Xie, G.H. Biomass yield and changes in chemical composition of sweet sorghum cultivars grown for biofuel. Field Crop Res. 2009, 111, 55–64. [Google Scholar] [CrossRef]
- Liu, X.J.A.; Fike, J.H.; Galbraith, J.M.; Fike, W.B.; Parrish, D.J.; Evanylo, G.K.; Strahm, B.D. Effects of harvest frequency and biosolids application on switchgrass yield, feedstock quality, and theoretical ethanol yield. GCB Bioenergy 2015, 7, 112–121. [Google Scholar] [CrossRef]
- Waramit, N.; Moore, K.J.; Fales, S.L. Forage quality of native warm-season grasses in response to nitrogen fertilization and harvest date. Anim. Feed Sci. Technol. 2012, 174, 46–59. [Google Scholar] [CrossRef]
- Burton, G.W.; Wilkinson, W.S.; Carter, R.L. Effect of nitrogen, phosphorus and potassium levels and clipping frequency on the forage yield and protein, carotene, and xanthophyll content of coastal bermudagrass. Agron. J. 1969, 61, 60–64. [Google Scholar] [CrossRef]
- Haque, M.; Biermacher, J.T.; Kering, M.K.; Guretzky, J.A. Economic evaluation of switchgrass feedstock production systems tested in potassium-deficient soils. Bioenergy Res. 2014, 7, 260–267. [Google Scholar] [CrossRef] [Green Version]
- Allison, G.G.; Morris, C.; Lister, S.J.; Barraclough, T.; Yates, N.; Shield, I.; Donnison, I.S. Effect of nitrogen fertiliser application on cell wall composition in switchgrass and reed canary grass. Biomass Bioenergy 2012, 40, 19–26. [Google Scholar] [CrossRef]
- Ashworth, A.J.; Weiss, S.A.; Keyser, P.D.; Allen, F.L.; Tyler, D.D.; Taylor, A.; Pote, D.H. Switchgrass composition and yield response to alternative soil amendments under intensified heat and drought conditions. Agric. Ecosyst. Environ. 2016, 233, 415–424. [Google Scholar] [CrossRef] [Green Version]
- Burner, D.M.; Tew, T.L.; Harvey, J.J.; Belesky, D.P. Dry matter partitioning and quality of Miscanthus, Panicum, and Saccharum genotypes in Arkansas, USA. Biomass Bioenergy 2009, 33, 610–619. [Google Scholar] [CrossRef]
- Cherney, J.H.; Cherney, D.J.R.; Paddock, K.M. Biomass yield and composition of switchgrass bales on marginal land as influenced by harvest management scheme. Bioenergy Res. 2018, 11, 33–43. [Google Scholar] [CrossRef]
- Keshwani, D.R.; Cheng, J.J. Switchgrass for bioethanol and other value-added applications: A review. Bioresour. Technol. 2009, 100, 1515–1523. [Google Scholar] [CrossRef] [Green Version]
- Gelfand, I.; Sahajpal, R.; Zhang, X.; Izaurralde, R.C.; Gross, K.L.; Robertson, G.P. Sustainable bioenergy production from marginal lands in the US Midwest. Nature 2013, 493, 514–517. [Google Scholar] [CrossRef]
- Dale, B.E.; Anderson, J.E.; Brown, R.C.; Steven, C.; Dale, V.H.; Gary, H.; Lynd, L.R. Take a closer look: Biofuels can support environmental, economic and social goals. Environ. Sci. Technol. 2014, 48, 7200–7203. [Google Scholar] [CrossRef]
- Jungers, J.M.; Sheaffer, C.C.; Lamb, J.A. The effect of nitrogen, phosphorus, and potassium fertilizers on prairie biomass yield, ethanol yield, and nutrient harvest. Bioenergy Res. 2015, 8, 279–291. [Google Scholar] [CrossRef]
- Schmer, M.R.; Vogel, K.P.; Varvel, G.E.; Follett, R.F.; Mitchell, R.B.; Jin, V.L. Energy potential and greenhouse gas emissions from bioenergy cropping systems on marginally productive cropland. PLoS ONE 2014, 9. [Google Scholar] [CrossRef] [PubMed]
- Fu, H.M.; Meng, F.Y.; Molatudi, R.L.; Zhang, B.G. Sorghum and switchgrass as biofuel feedstocks on marginal lands in northern China. Bioenergy Res. 2016, 9, 633–642. [Google Scholar] [CrossRef]
- Tang, C.C.; Yang, X.L.; Xie, G.H. Establishing sustainable sweet sorghum-based cropping systems for forage and bioenergy feedstock in North China Plain. Field Crops Res. 2018, 227, 144–154. [Google Scholar] [CrossRef]
- Parrish, D.J.; Fike, J.H. The biology and agronomy of switchgrass for biofuels. Crit. Rev. Plant Sci. 2005, 24, 423–459. [Google Scholar] [CrossRef]
- Madakadze, I.C.; Stewart, K.; Peterson, P.R.; Coulman, B.E.; Smith, D.L. Switchgrass biomass and chemical composition for biofuel in eastern Canada. Agron. J. 1999, 91, 696–701. [Google Scholar] [CrossRef]
- Waramit, N.; Moore, K.J.; Heggenstaller, A.H. Composition of native warm-season grasses for bioenergy production in response to nitrogen fertilization rate and harvest date. Agron. J. 2011, 103, 655–662. [Google Scholar] [CrossRef]
- Sanderson, M.A.; Reed, R.L.; McLaughlin, S.B.; Wullschleger, S.D.; Conger, B.V.; Parrish, D.J.; Hussey, M.A. Switchgrass as a sustainable bioenergy crop. Bioresour. Technol. 1996, 56, 83–93. [Google Scholar] [CrossRef]
- Lewandowski, I.; Kicherer, A. Combustion quality of biomass: Practical relevance and experiments to modify the biomass quality of Miscanthus x giganteus. Eur. J. Agron. 1997, 6, 163–177. [Google Scholar] [CrossRef]
- Zhang, K.; Zhou, L.; Brady, M.; Xu, F.; Yu, J.; Wang, D. Fast analysis of high heating value and elemental compositions of sorghum biomass using near-infrared spectroscopy. Energy 2017, 118, 1353–1360. [Google Scholar] [CrossRef] [Green Version]
Figure 1.
Monthly precipitation and maximum and minimum temperatures during the switchgrass growth period in 2015 and 2016.
Figure 1.
Monthly precipitation and maximum and minimum temperatures during the switchgrass growth period in 2015 and 2016.
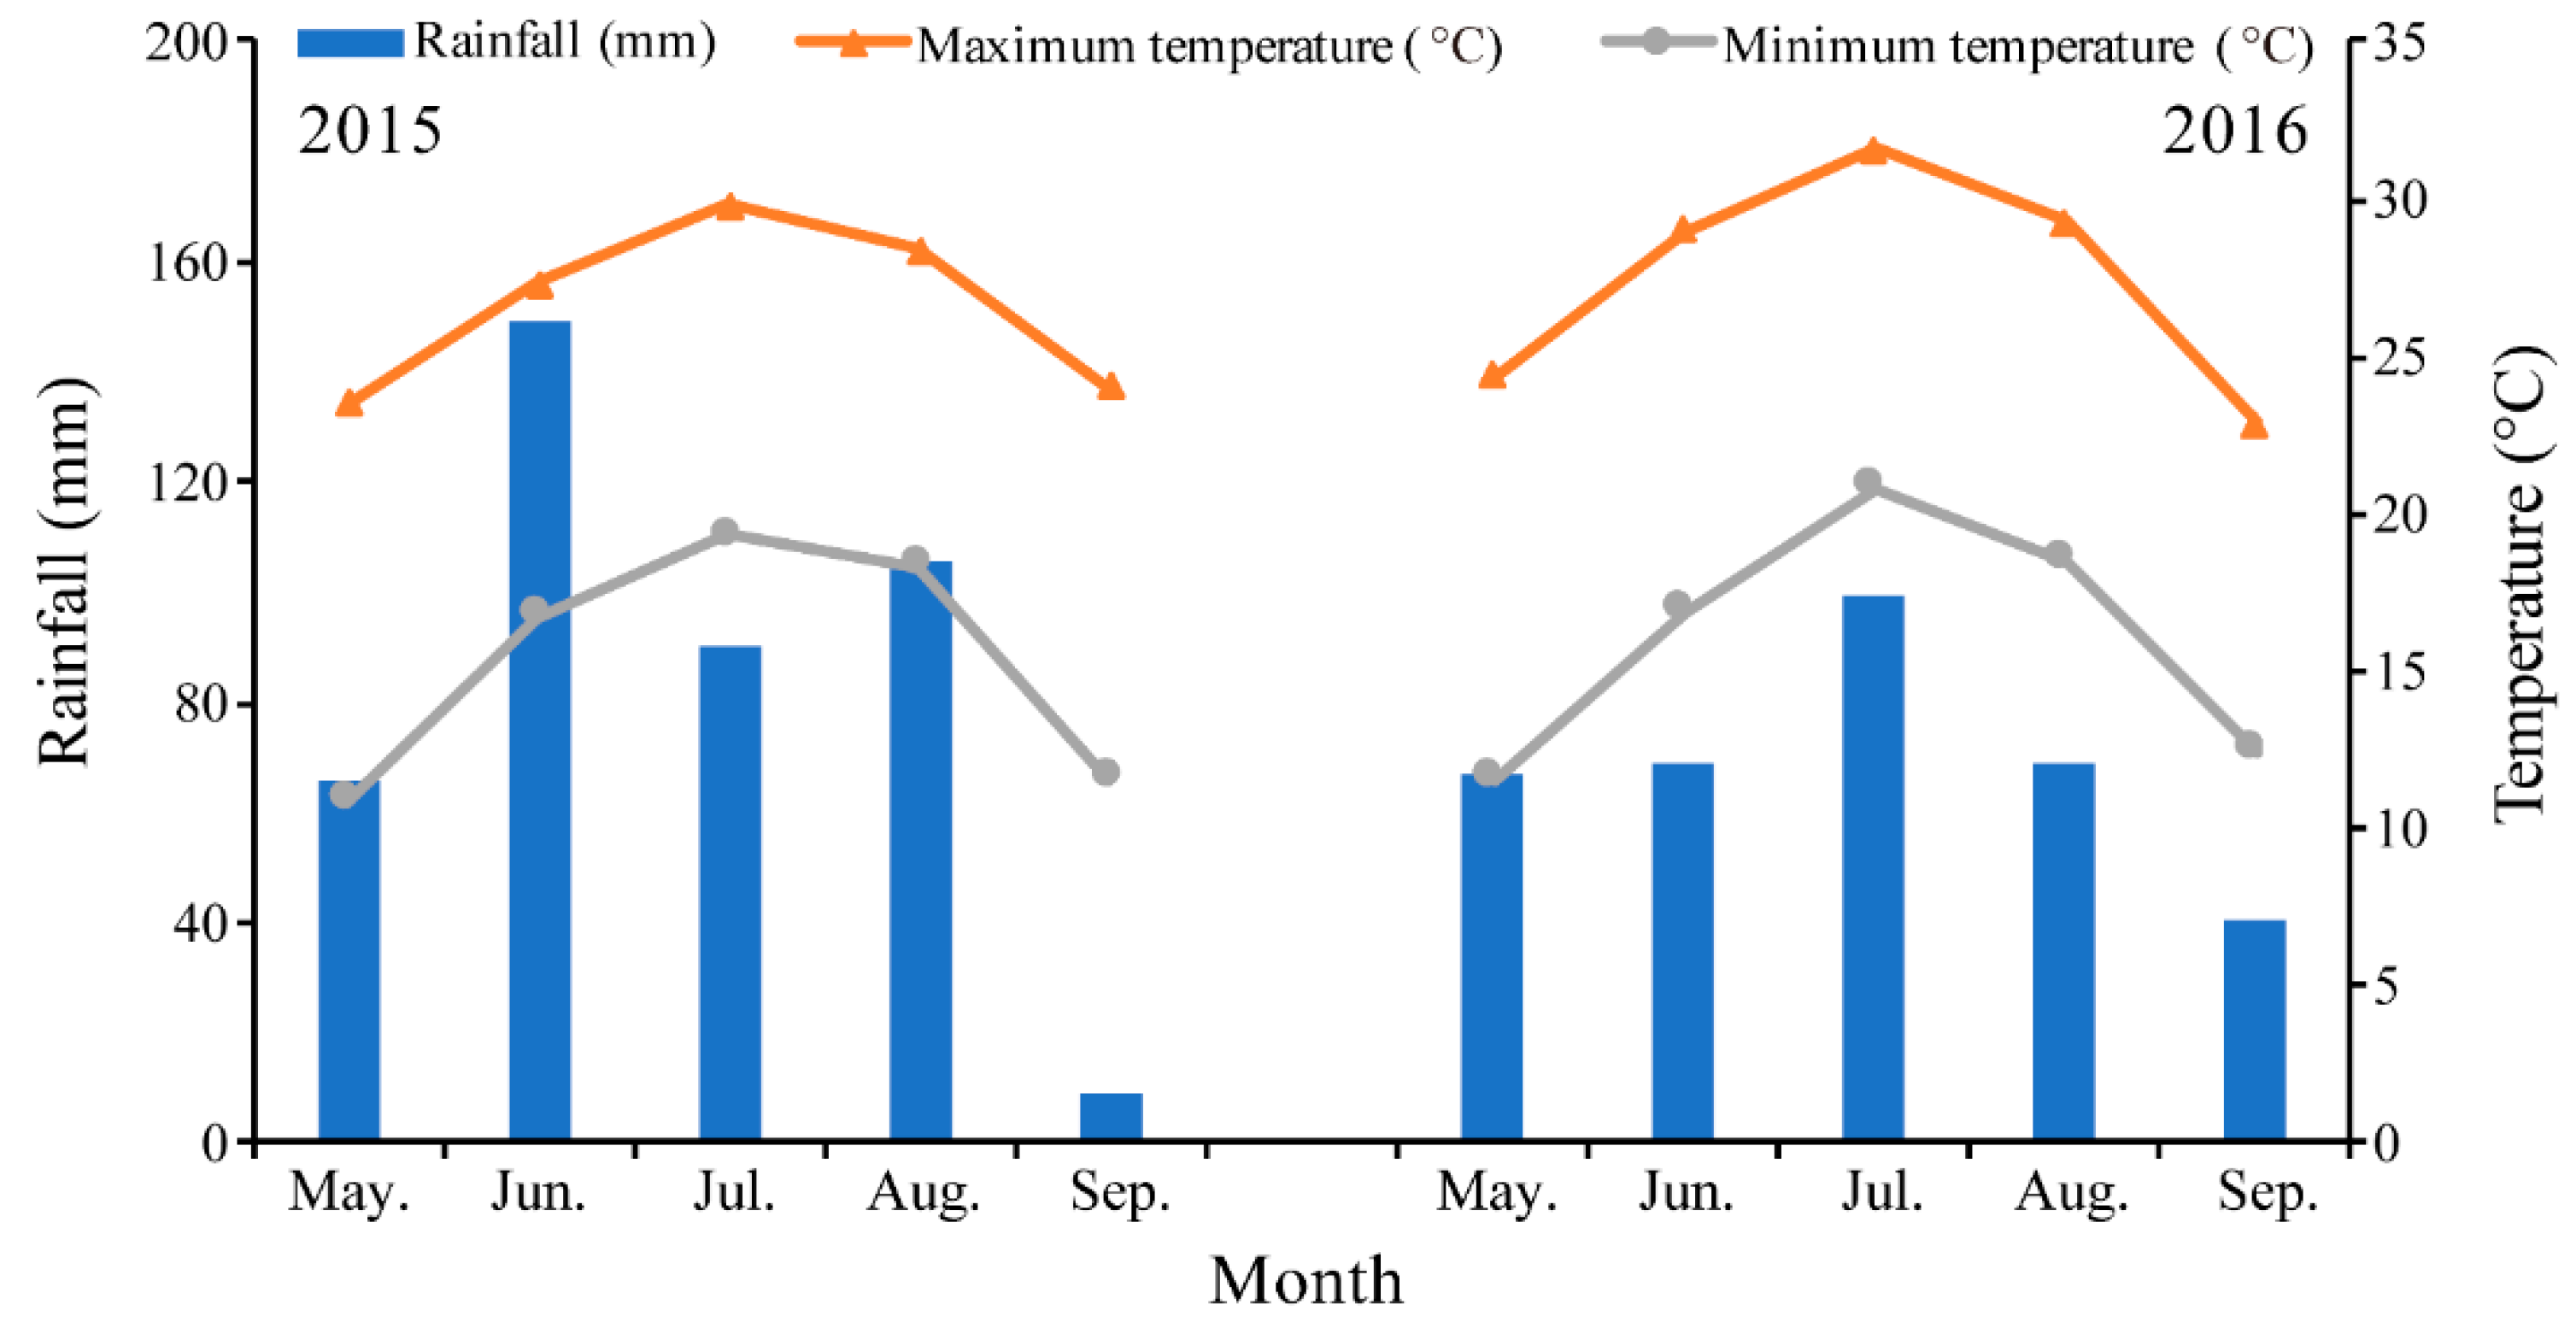
Figure 2.
The chemical compositions in switchgrass stems, leaves, and panicles, including crude protein (CP), neutral- and acid-detergent fiber (NDF, ADF), dry matter intake (DMI), dry matter digestibility (DMD), total digestible nutrients (TDN), net energy for lactation (NEL), relative feed value (RFV), soluble sugar, cellulose, hemicellulose, and ash averaged across the treatments (NPK, PK, NK, and NP and the blank control) and both years. Different small letters denote significant differences among tissues within a year (p < 0.05). The bars represent the standard error.

Figure 3.
Differences in protein yield of switchgrass for the nutrient treatments NPK, PK, NK, and NP and the blank control (CK) in two years. Different small letters denote significant differences among the treatments for each year (p < 0.05). The bars represent the standard error.
Figure 3.
Differences in protein yield of switchgrass for the nutrient treatments NPK, PK, NK, and NP and the blank control (CK) in two years. Different small letters denote significant differences among the treatments for each year (p < 0.05). The bars represent the standard error.

Figure 4.
Differences in the theoretical ethanol yield (TEY) from soluble sugar (SS), insoluble sugar (IS), and total sugar in switchgrass for the nutrient treatments NPK, PK, NK, and NP and the blank control (CK) in 2015 and 2016. Different small letters denote significant differences among the treatments (p < 0.05). The bars indicate the standard error.

Table 1.
Fertilizer dose (kg ha−1) of nitrogen (N), phosphorus (P), and potassium (K) in the treatments NPK, PK (N omission), NK (P omission), and NP (K omission) and the blank control (CK) for switchgrass grown in 2015 and 2016. Fertilizer application splits (%) are shown for elongation and anthesis.
| Nutrient | Treatment | Split | |||||
|---|---|---|---|---|---|---|---|
| (kg ha−1) | NPK | PK (N Omission) | NK (P Omission) | NP (K Omission) | CK (Blank Control) | Elongation (%) | Anthesis (%) |
| N | 120 | 0 | 120 | 120 | 0 | 65 | 35 |
| P | 100 | 100 | 0 | 100 | 0 | 100 | 0 |
| K | 45 | 45 | 45 | 0 | 0 | 100 | 0 |
Table 2.
ANOVA results for year, nutrient treatment (N, P, and K), and their interactions on crude protein, protein yield, neutral- and acid-detergent fiber (NDF, ADF), dry matter digestibility (DMD), dry matter intake (DMI), relative feed value (RFV), total digestible nutrients (TDN), net energy for lactation (NEL), soluble sugar, cellulose, hemicellulose, ash, and theoretical ethanol yield (TEY) of switchgrass in 2015 and 2016.
| Parameter | Year (df = 1) | Nutrient Treatment (df = 4) | Year × Nutrient Treatment (df = 4) |
|---|---|---|---|
| Crude Protein (%) | ns | *** | ns |
| Protein Yield (kg ha−1) | ns | *** | ns |
| NDF (%) | *** | ns | ** |
| ADF (%) | ns | ns | ns |
| DMD (%) | ns | ns | ns |
| DMI (%) | *** | ns | ** |
| TDN (%) | ns | ns | ns |
| NEL (%) | ns | ns | ns |
| RFV (%) | *** | ns | ** |
| Soluble Sugar (g kg−1) | * | ns | ns |
| Cellulose (g kg−1) | ns | ns | ns |
| Hemicellulose (g kg−1) | *** | ns | ns |
| Ash (g kg−1) | *** | * | ns |
| TEY (L ha−1) | * | *** | ns |
ns: non- significant; *: significant at p < 0.05; **: significant at p < 0.01; ***: significant at p < 0.001.
Table 3.
Crude protein (CP), neutral- and acid-detergent fiber (NDF, ADF), dry matter digestibility (DMD), dry matter intake (DMI), total digestible nutrients (TDN), net energy for lactation (NEL), and relative feed value (RFV) of the switchgrass aboveground plant for the treatments NPK, PK, NK, and NP and the blank control (CK) in 2015 and 2016.
| Treatment | Forage Quality (%) | |||||||
|---|---|---|---|---|---|---|---|---|
| CP | NDF | ADF | DMD | DMI | TDN | NEL | RFV | |
| 2015 | ||||||||
| NPK | 5.46 ± 0.15 a | 58.1 ± 2.8 bc | 32.9 ± 2.3 | 63.2 ± 1.8 | 2.07 ± 0.10 ab | 58.8 ± 3.0 | 1.44 ± 0.06 | 101.5 ± 7.4 a |
| PK | 4.34 ± 0.46 bc | 58.8 ± 2.4 abc | 33.4 ± 1.4 | 62.9 ± 1.4 | 2.04 ± 0.09 abc | 58.2 ± 2.4 | 1.42 ± 0.05 | 99.6 ± 6.3 ab |
| NK | 5.14 ± 0.60 ab | 62.4 ± 0.7 a | 35.1 ± 0.8 | 61.5 ± 0.6 | 1.92 ± 0. 02 c | 56.0 ± 1.1 | 1.38 ± 0.02 | 91.8 ± 1.8 b |
| NP | 5.48 ± 0.94 a | 57.1 ± 1.8 c | 32.9 ± 2.1 | 63.3 ± 1.7 | 2.10 ± 0.07 a | 58.9 ± 2.77 | 1.44 ± 0.06 | 103.2 ± 4.8 a |
| CK | 3.92 ± 0.50 c | 60.9 ± 2.9 ab | 34.0 ± 2.0 | 62.4 ± 1.6 | 1.97 ± 0.09 bc | 57.4 ± 2.6 | 1.41 ± 0.05 | 95.5 ± 6.6 ab |
| 2016 | ||||||||
| NPK | 5.20 ± 0.31 ab | 63.4 ± 0.8 ab | 35.0 ± 0.6 | 61.7 ± 4.9 | 1.89 ± 0.02 ab | 56.2 ± 0.8 | 1.38 ± 0.02 | 90.5 ± 0.6 b |
| PK | 5.07 ± 0.36 ab | 63.2 ± 3.1 ab | 35.1 ± 1.3 | 61.6 ± 1.0 | 1.90 ± 0.09 ab | 56.1 ± 1.7 | 1.38 ± 0.03 | 90.8 ± 4.4 b |
| NK | 5.13 ± 0.67 ab | 60.7 ± 0.6 b | 33.9 ± 0.9 | 62.5 ± 0.7 | 1.98 ± 0.02 a | 57.6 ± 1.2 | 1.41 ± 0.02 | 95.9 ± 1.9 a |
| NP | 5.55 ± 0.54 a | 64.0 ± 1.4 a | 35.0 ± 0.3 | 61.6 ± 0.3 | 1.87 ± 0.04 b | 56.1 ± 0.4 | 1.38 ± 0.01 | 89.5 ± 2.2 b |
| CK | 4.53 ± 0.43 c | 63.0 ± 1.7 ab | 34.4 ± 1.8 | 62.1 ± 1.4 | 1.91 ± 0.05 ab | 56.9 ± 2.3 | 1.40 ± 0.05 | 91.8 ± 4.3 ab |
Values are expressed as means ± standard deviation. Different letters in a column indicate significant differences (p < 0.05).
Table 4.
Soluble sugar, cellulose, hemicellulose, and ash content of the switchgrass aboveground plant for the treatments NPK, PK, NK, and NP and the blank control (CK) in 2015 and 2016.
Table 4.
Soluble sugar, cellulose, hemicellulose, and ash content of the switchgrass aboveground plant for the treatments NPK, PK, NK, and NP and the blank control (CK) in 2015 and 2016.
| Treatment | Bioenergy Quality (g kg−1) | |||
|---|---|---|---|---|
| Soluble Sugar | Cellulose | Hemicellulose | Ash | |
| 2015 | ||||
| NPK | 77.0 ± 11.2 | 294.6 ± 36.1 | 251.9 ± 11.0 ab | 54.6 ± 9.1 |
| PK | 85.7 ± 7.1 | 305.5 ± 26.7 | 253.8 ± 12.7 ab | 50.0 ± 3.6 |
| NK | 75.3 ± 1.6 | 307.1 ± 14.0 | 272.7 ± 7.1 a | 55.1 ± 5.0 |
| NP | 88.0 ± 3.3 | 296.1 ± 18.5 | 242.1 ± 25.6 b | 57.4 ± 7.4 |
| CK | 83.9 ± 15.3 | 318.4 ± 16.6 | 268.6 ± 13.8 a | 54.8 ± 3.2 |
| 2016 | ||||
| NPK | 72.1 ± 4.7 | 312.2 ± 7.3 | 284.6 ± 13.7 | 75.9 ± 5.6 abc |
| PK | 77.9 ± 4.2 | 315.6 ± 20.1 | 280.9 ± 35.4 | 70.6 ± 5.6 bc |
| NK | 71.9 ± 8.9 | 313.8 ± 10.9 | 268.4 ± 6.7 | 78.4 ± 3.7 ab |
| NP | 72.6 ± 10.2 | 318.7 ± 9.3 | 290.2 ± 12.5 | 82.1 ± 8.8 a |
| CK | 76.2 ± 13.6 | 320.2 ± 19.4 | 285.1 ± 7.6 | 67.6 ± 5.8 c |
Values are expressed as means ± standard deviation. Different letters in a column indicate significant differences (p < 0.05).
© 2020 by the authors. Licensee MDPI, Basel, Switzerland. This article is an open access article distributed under the terms and conditions of the Creative Commons Attribution (CC BY) license (http://creativecommons.org/licenses/by/4.0/).
Share and Cite
MDPI and ACS Style
Tang, C.-C.; Han, L.-P.; Xie, G.-H. Response of Switchgrass Grown for Forage and Bioethanol to Nitrogen, Phosphorus, and Potassium on Semiarid Marginal Land. Agronomy 2020, 10, 1147. https://doi.org/10.3390/agronomy10081147
AMA Style
Tang C-C, Han L-P, Xie G-H. Response of Switchgrass Grown for Forage and Bioethanol to Nitrogen, Phosphorus, and Potassium on Semiarid Marginal Land. Agronomy. 2020; 10(8):1147. https://doi.org/10.3390/agronomy10081147
Chicago/Turabian StyleTang, Chao-Chen, Li-Pu Han, and Guang-Hui Xie. 2020. "Response of Switchgrass Grown for Forage and Bioethanol to Nitrogen, Phosphorus, and Potassium on Semiarid Marginal Land" Agronomy 10, no. 8: 1147. https://doi.org/10.3390/agronomy10081147
Note that from the first issue of 2016, this journal uses article numbers instead of page numbers. See further details here.