Article

High Sowing Densities in Rainfed Common Beans (Phaseolus vulgaris L.) in Mexican Semi-Arid Highlands under Future Climate Change

by
Alma Delia Baez-Gonzalez
1,*,
Ricardo Fajardo-Díaz
2,
Giovanni Garcia-Romero
3,
Esteban Osuna-Ceja
1,
James R. Kiniry
4 and
Manyowa N. Meki
5
1
Pabellon Research Station, National Institute of Forestry, Agriculture and Livestock Research, km. 32.5 Carretera Aguascalientes-Zacatecas, 20670 Aguascalientes, Mexico
2
Autonomous University of Aguascalientes, Basic Sciences Center, Av. Universidad 940, 20130 Aguascalientes, Mexico
3
Environment Department, Av. Miguel Hidalgo y Costilla 426, 44100 Guadalajara, Mexico
4
USDA, Agricultural Research Service, Grassland Soil and Water Research Laboratory, 808 E. Blackland Rd., Temple, TX 76502, USA
5
Texas A&M AgriLife Research, Blackland Research and Extension Center, 720 E. Blackland Rd., Temple, TX 76502, USA
*
Author to whom correspondence should be addressed.
Agronomy 2020, 10(3), 442; https://doi.org/10.3390/agronomy10030442
Submission received: 13 January 2020 / Revised: 12 February 2020 / Accepted: 2 March 2020 / Published: 23 March 2020

Abstract

:
Mexico holds the largest single bean production area in the world that is vulnerable to drought. Using field data and two future climate scenarios (RCP4.5 and RCP8.5) for the period 2020–2039, this study evaluated three common bean (Phaseolus vulgaris L.) cultivars planted under rainfed conditions at different densities in two locations in the north-central Mexican semi-arid temperate highlands. The sowing densities were 90,000, 145,000, and 260,000 plants ha−1 established in single rows (SR), three rows (3R), and six rows (6R), respectively. The climate change scenarios were derived from an assembly model integrating 11 general circulation models (GCM) selected for Mexico with a 30” arc resolution. The baseline climate was for the period 1961–2010. The ALMANACMEX model (USDA-ARS-INIFAP, Temple, USA) was parameterized and evaluated and then re-run using the climate scenarios. Beans planted at 6R showed the highest increase in seed yield in both climate scenarios, although the response varied by cultivar and time periods. For the growth habit III cultivars, Flor de Mayo Bajio showed no difference in yield, while Pinto Saltillo, a drought-resistant cultivar, showed increases of 13% to 16% at 6R only until 2033. Growth habit I cultivar Azufrado 2 showed more than 60% increases at 6R in both climate scenarios for the full period 2020–2039. These results suggest that considering the projected climate conditions, high sowing densities may be a viable agronomic option for common bean production under rainfed conditions in semi-arid temperate regions, such as the highlands of Mexico, in the near future; however, the selection of the cultivar is a key element to consider in this regard.

1. Introduction

Common bean (Phaseolus vulgaris L.) is an essential food crop in Central and South America, Sub-Saharan Africa, and parts of Asia—regions that are predicted to be negatively impacted by climate change in the next few decades [1]. With the predicted decreases in water availability and increases in temperature in major agricultural production areas [2,3,4], sustainable production will be a central issue in agricultural and food systems in these areas. In this regard, common bean and other legumes could play an important role as they provide high-quality food and feed and help reduce the emission of greenhouse gases [5].
However, drought presents a risk to common bean production around the world, with Northeastern Brazil and the central and northern highlands of Mexico being the most vulnerable areas in Latin America [6,7,8]. Drought in relation to beans is defined as inadequate water availability (including precipitation and soil moisture storage capacity) in terms of quantity and distribution during the growing period that prevents the cultivar from achieving its full genetic potential [9]. The highlands of Mexico hold the largest single drought susceptible production area in the world, where more than 1,000,000 hectares of beans are cultivated [10]. Yields fall below 0.4 Mg ha−1 in dry years due to droughts and inadequate capital investment in irrigation in the dry areas, which are also poverty hotspots [10,11].
The use of high sowing density in improving bean production under future climatic scenarios needs to be further explored, especially in semi-arid production systems. Sowing density is considered a major management factor, affecting the growth and development of grain crops by modifying the canopy light environment and interplant competition for water and nutrients [12]. The effects of sowing density on the vegetative and reproductive growth traits of common beans have been explored previously [13,14,15] but mostly under non-limiting management conditions and without considering future climate change. The present study evaluated the use of high sowing densities on common bean cultivars under rainfed conditions in semi-arid temperate highlands in Mexico, considering predicted changes in precipitation and temperatures.

2. Materials and Methods

2.1. Study Area

The field study was conducted at two research stations of the Instituto Nacional de Investigaciones Forestales, Agricolas y Pecuarias (National Institute of Forestry, Agriculture and Livestock Research) (INIFAP) in Aguascalientes State in the semi-arid temperate highland common bean region of Mexico. The Pabellon de Arteaga research station, located at 22°11′ latitude north and 102°20′ longitude west and 1912 m a.s.l., has Calsicol soil with sandy-loam soil texture, 0.48 m depth 2.0% of organic matter and pH of 7.9 [16]; average annual rainfall is 460 mm [17]. The Sandovales research station, located at 22°09′ latitude north and 102°17′ west at 2000 m a.s.l., has Calcisol and Planosol soils with sandy-clay soil texture, 0.45 m depth, pH of 6.2, and 1% of organic matter [16]; the average annual rainfall is 400 mm [17].
Both sites have a semi-arid climate, with 308 to 349 mm of mean precipitation during the bean growing season (July to October), mean annual temperature of 16.2 °C, and mean maximum and minimum temperature of 20 °C and 7.1 °C, respectively [17,18].

2.2. Cultivars and Sowing Densities

The cultivars used in the study were Pinto Saltillo (PS), Flor de Mayo Bajio (FMB), and Azufrado 2 (A2). PS and FMB are growth habit III cultivars, i.e., indeterminate, with prostrate architecture, while A2 is a growth habit I determinate cultivar, with bush-type architecture [19]. These bean cultivars (Table 1) were from the Bean Genetic Improvement Program of INIFAP. The early maturing cultivars FMB and PS are generally preferred by Mexican farmers [20].
The three cultivars were established during three consecutive agricultural seasons (2011, 2012, 2013) in Pabellon de Arteaga and two seasons (2012 and 2013) in Sandovales. During the years of study, the sowing densities evaluated were as follows: (a) 90,000 ha−1 plants established under the conventional single-row (SR) sowing method; (b) 145,000 plants ha−1 in beds with three rows (3R); and (c) 260,000 plants ha−1 established in beds with six rows (6R).
At the time of sowing, the seed was inoculated with the Glomus intraradices rhizobia strain at a dose of 350 g ha−1 of micro-rustic substrate. Before sowing, the land was prepared with a multi-plow to break the ground without inverting it, followed by harrowing. The sowing was done using an experimental prototype mechanical seeder designed by INIFAP [21] that enables the three methods of establishment, with distances of 0.76, 0.40, and 0.20 m between rows for SR, 3R, and 6R, respectively. Planting in Pabellon de Arteaga was done on 30 July in 2011 and 31 July in 2012 and 2013. Planting in Sandovales was on August 1 in 2012 and 2013.

2.3. Precipitation During the Years of Study

The precipitation during the growing season of rainfed beans (July–October) in the years of study was 175 mm, 208 mm, and 492 mm for the Pabellon de Arteaga research station during 2011, 2012, and 2013, respectively, and 168 mm and 364 mm in Sandovales during 2012 and 2013.
Considering that the July–October mean precipitation of the two semi-arid locations is 308 to 349 mm [17], it was possible to obtain information of the crop under two rainfall regimes: dry (<308 mm) in the two locations (175 and 208 mm in Pabellon de Arteaga during 2011 and 2012 and 168 mm in Sandovales during 2012), and wet (>349 mm) in both locations during 2013 (492 and 364 mm for Pabellon de Arteaga and Sandovales, respectively). Modeling the behavior of the crop under these two common water conditions in rainfed areas gives greater certainty to the parameters in the parameterization process and in the evaluation of the model.

2.4. Field Measurements

The leaf area index (LAI) was measured in Pabellon de Arteaga during the 2011 growing season, using a 0.8 m long LP-80 ceptometer (Decagon, Pullman, WA, USA). Three fixed points were randomly established per experimental unit consisting of four, six, and 12 rows of 30 m length per cultivar with three repeats for SR, 3R, and 6R, respectively. The readings were made between 10:00 and 13:00, during which time the incidence of solar radiation is relatively stable [22]. As the evaluated cultivars differ in development and precocity (Table 1), a calendar of measurements was established considering days after sowing (DDS); this made it possible to compare LAI in the same period of plant development. Samples were taken at 19, 25, 40, 45, 79, and 87 DDS.
Seed yield was evaluated at the end of the growing season of each cultivar. To obtain the yield data (Mg ha−1), plots of 1.5 m width and 2.0 m length were randomly selected from the two central rows of each experimental unit.

2.5. ALMANACMEX Model

The study used the ALMANACMEX model (USDA-ARS-INIFAP, Temple, USA) [23], which is a version of the ALMANAC model [24] that includes a Mexican interface with data on the climates and soils of Mexico. The model simulates processes of crop growth and soil water balance including light interception by leaves, dry matter production, and the partitioning of biomass into grain. Light interception is simulated by Beer’s Law and considers the total leaf area and height of the canopy [24]. The water and nutrient balance subroutines are from the Erosion Productivity Impact Calculator (EPIC) model [25]. The simulated water demand is critical for yield simulation in water-limited conditions. Potential evaporation (Eo) is calculated first. Then, the potential soil water evaporation (ES) and potential plant water transpiration (EP) are derived from the potential evaporation and leaf area index (LAI). In addition, the model estimates stresses caused by water, nutrients (N and P), temperature, and aeration. The water stress factor is computed by considering supply and demand in the equation:
W S i = l = 1 M u i , l   E p i
where WS is the water stress factor, u is the water use in layer l , and Ep is the potential plant water use on day i. This is consistent with the concept that drought stress limits biomass production in proportion to transpiration reduction [26].

2.6. Model Parameterization

The first step in the modeling process was parameterization, i.e., finding parameters with the best correlation between the model and the reality being simulated [27]. The initial selection of parameters was refined during model calibration by running the model with the parameters and comparing the model results with observed data [28] so as to determine the best fit for the regional environment of interest [29]. This process has been used to derive parameters that are not available for important agricultural areas or crops [30,31,32].
In this study, the model was parameterized using two sources of crop parameters: (1) the bean crop parameters already available in the model (radiation use efficiency, plant height, etc.) and (2) the parameters reported for some common beans grown in the same study region (Aguascalientes) [33]: potential LAI, potential Harvest Index (HI), and Potential Heat Units (PHUs). Once the parameters had been incorporated into the model, it was run considering the climatic and edaphic characteristics of the study area of Pabellon de Arteaga. Daily weather data were obtained from the automated weather station closest to the plot (100 m). The soil data considered were soil depth, organic matter, soil texture, and pH as previously described in the Study Area section.
The model was run using these initial parameters together with observed daily climatic data (maximum and minimum temperature and precipitation) of the year 2011. The model results (simulated LAI and seed yield) were compared with the observed LAI and seed yield during the year 2011.

2.7. Model Evaluation

Model evaluation is defined as the process of demonstrating that, under certain conditions, the model is capable of performing simulations with sufficient precision [34].
Model evaluation was performed considering the seed yield and daily climatic conditions (maximum and minimum temperature and precipitation) observed during 2012 and 2013 in the study areas of Pabellon de Arteaga and Sandovales under rainfed conditions. The weather stations where daily weather data were gathered were located 100 to 150 m from the experimental plot on both sites.
The statistical indices mean bias error (MBE), root mean square error (RMSE), and the agreement index (d) [35,36] were used for the evaluation of the simulation performance of ALMANACMEX. The MBE of seed yield was calculated considering the difference between observed and simulated seed yield, using the following equation:
MBE = 1 N i = 1 N ( S i O i )
where N denotes the observation numbers used for comparisons, and Si and Oi are the simulated and observed seed yield.
The root mean square error (RMSE) was used to determine the difference between observed and simulated seed yield. The RMSE was computed by using Equation (3) to determine the degree of predictability [37]:
R M S E = ( 1 N ) i = 1 N ( S i O i ) 2
where N denotes the observation numbers used for comparisons and Si and Oi are the simulated and observed seed yield.
The computed values of RMSE and MBE determined the degree of agreement between the predicted values and their respective observed values. To determine the degree of model prediction error, the index of agreement (d) [36] was used in this study, applying the following equation:
d = 1 [ s u m ( O S ) 2 ] / s u m ( ( a b s ( S m e a n ( O ) ) + a b s ( O m e a n ( O ) ) ) 2 )
where O and S are the observed and simulated yield, respectively. The numerator is the mean square error. The denominator is related to the variability in the observed and simulated values [35]. The d values range from 0 to 1; the closer the d index value is to unit (1), the better the fit and model simulation.
A linear regression analysis was also done using GraphPad Prism 5® (GraphPad Software, Inc. San Diego, USA) statistic software to describe, during model evaluation, the relationship between simulated and observed yields for the three bean cultivars grown in the two sites under study. In addition, the differences between observed and simulated seed yield were assessed using Fisher’s paired t-test.

2.8. Future Climate Change Scenarios

Climate change scenarios for 2020–2039 were used in the analysis to determine the short- and medium-term impact of climate change. This period was selected because of the need to generate timely options that could be implemented early by Mexican producers to ensure production stability in the face of projected climatic changes in the next two decades.
For the estimation of future climate scenarios, we used a database with monthly anomalies of maximum temperature, minimum temperature, and monthly average precipitation derived from an assembly model that integrated 11 general circulation models (GCM) (BCC-CSM1-1, CCSM4, GISS-E2-R, HadGEM2-AO, HadGEM2-ES, IPSLCM5A-LR, MIROC-ESM-CHEM, MIROC-ESM, MIROC5, MRI-CGCM3, NorESM1-M), reduced in scale and calibrated for Mexico for the representative concentration pathways (RCP) of greenhouse gases (GHG) 4.5 and 8.5 for the period 2020–2039. The GCMs used are part of the climate modeling developed by the project on inter-comparison of coupled models Phase 5 (CMIP5) [38]. All the information was obtained from the WorldClim climate change data portal using raster images with a spatial resolution of 30”arc [38]. For the baseline climate (1961–2010), the monthly data of the minimum, maximum average temperatures, and the monthly precipitation were obtained for each experimental site from the reference climatology database [39].
The ALMANACMEX model contains a weather database with the monthly weather station parameters of more than 3000 stations located in Mexico [23]. This database is used by the weather generator component of the model to generate daily weather data. The weather parameters of average monthly maximum temperature, average monthly minimum temperature, and average monthly precipitation were manually updated by introducing the monthly anomalies projected for the period 2020–2039 for the weather stations located in Pabellon de Arteaga and Sandovales to reflect the predicted 20-year average from 2020 to 2039 for the RCP4.5 and RCP8.5 scenarios. All other weather and wind variables remained unchanged. The management and soil data input remained the same.

2.9. Model Application to Determine Sowing Density Impact

After the ALMANACMEX model had been parameterized and evaluated, the model was re-run using the climate scenarios while keeping constant the sowing methods and management conditions for SR, 3R, and 6R and the soil type of each site. A similar approach has been used in other climate impact studies [40,41,42].
The impact of sowing density in terms of increases or decreases in common bean seed yield during the period 2020–2039 was determined by calculating the difference between the baseline simulated yield, which was the yearly simulated yield under SR, and the yield under plant density 3R and 6R.

3. Results and Discussion

3.1. Crop Model Parameterization and Crop Parameters

In the parameterization process, the simulated LAI was not different (p ≥ 0.05) from that observed in SR, 3R, and 6R at 40, 45, 79, and 87 DDS for any of the three cultivars under study, as shown in Figure 1 and in the values presented in the supplementary (Table S1). Similarly, the simulated seed yield was not different (p ≥ 0.05) from the observed seed yield under the three sowing conditions (Table 2).
The model parameterization process generated a set of key crop parameters for the three tested cultivars under study (Table 3). The key parameters observed among the cultivars were the biomass–energy ratio; optimal, minimum, and maximum temperature; maximum height and root depth; dry matter; decline rate; and harvest index. Table 3 shows other parameters that are linked to LAI and that reflect the characteristics of the cultivar and its response to sowing density.
The PHUs responded to the cultivar cultivation growing cycle with 1100 to 1200 PHUs for the early maturing cultivars (FMB and PS) and 1600 for the intermediate cultivar (A2).
While ALMANAC simulates the grain yield using the Harvest Index (HI), it also simulates the decrease in HI with drought stress near anthesis. The model assumes that anthesis occurs the same date as when the LAI is at its maximum. This occurs in the simulation when the DLAI (fraction of growing season when leaf area declines) fraction of PHUs is reached. The model makes HI sensitive to drought stress when the stress occurs between 5% of the heat units before DLAI until 10% of the heat units after. Five days of severe drought stress during this period decreases the HI to the input value for minimum HI (WSYF). For this study, HI was assumed to be 0.36 for all varieties and the WSYF was 0.23 [33]. With DLAI set to 0.77, as it is for some of the varieties in this study, then 5 days of severe drought stress occurring between 0.72 and 0.87 of PHU decreases the simulated HI from 0.36 to 0.23. Thus, each day of severe drought stress during this interval decreases the simulated HI by 0.026.

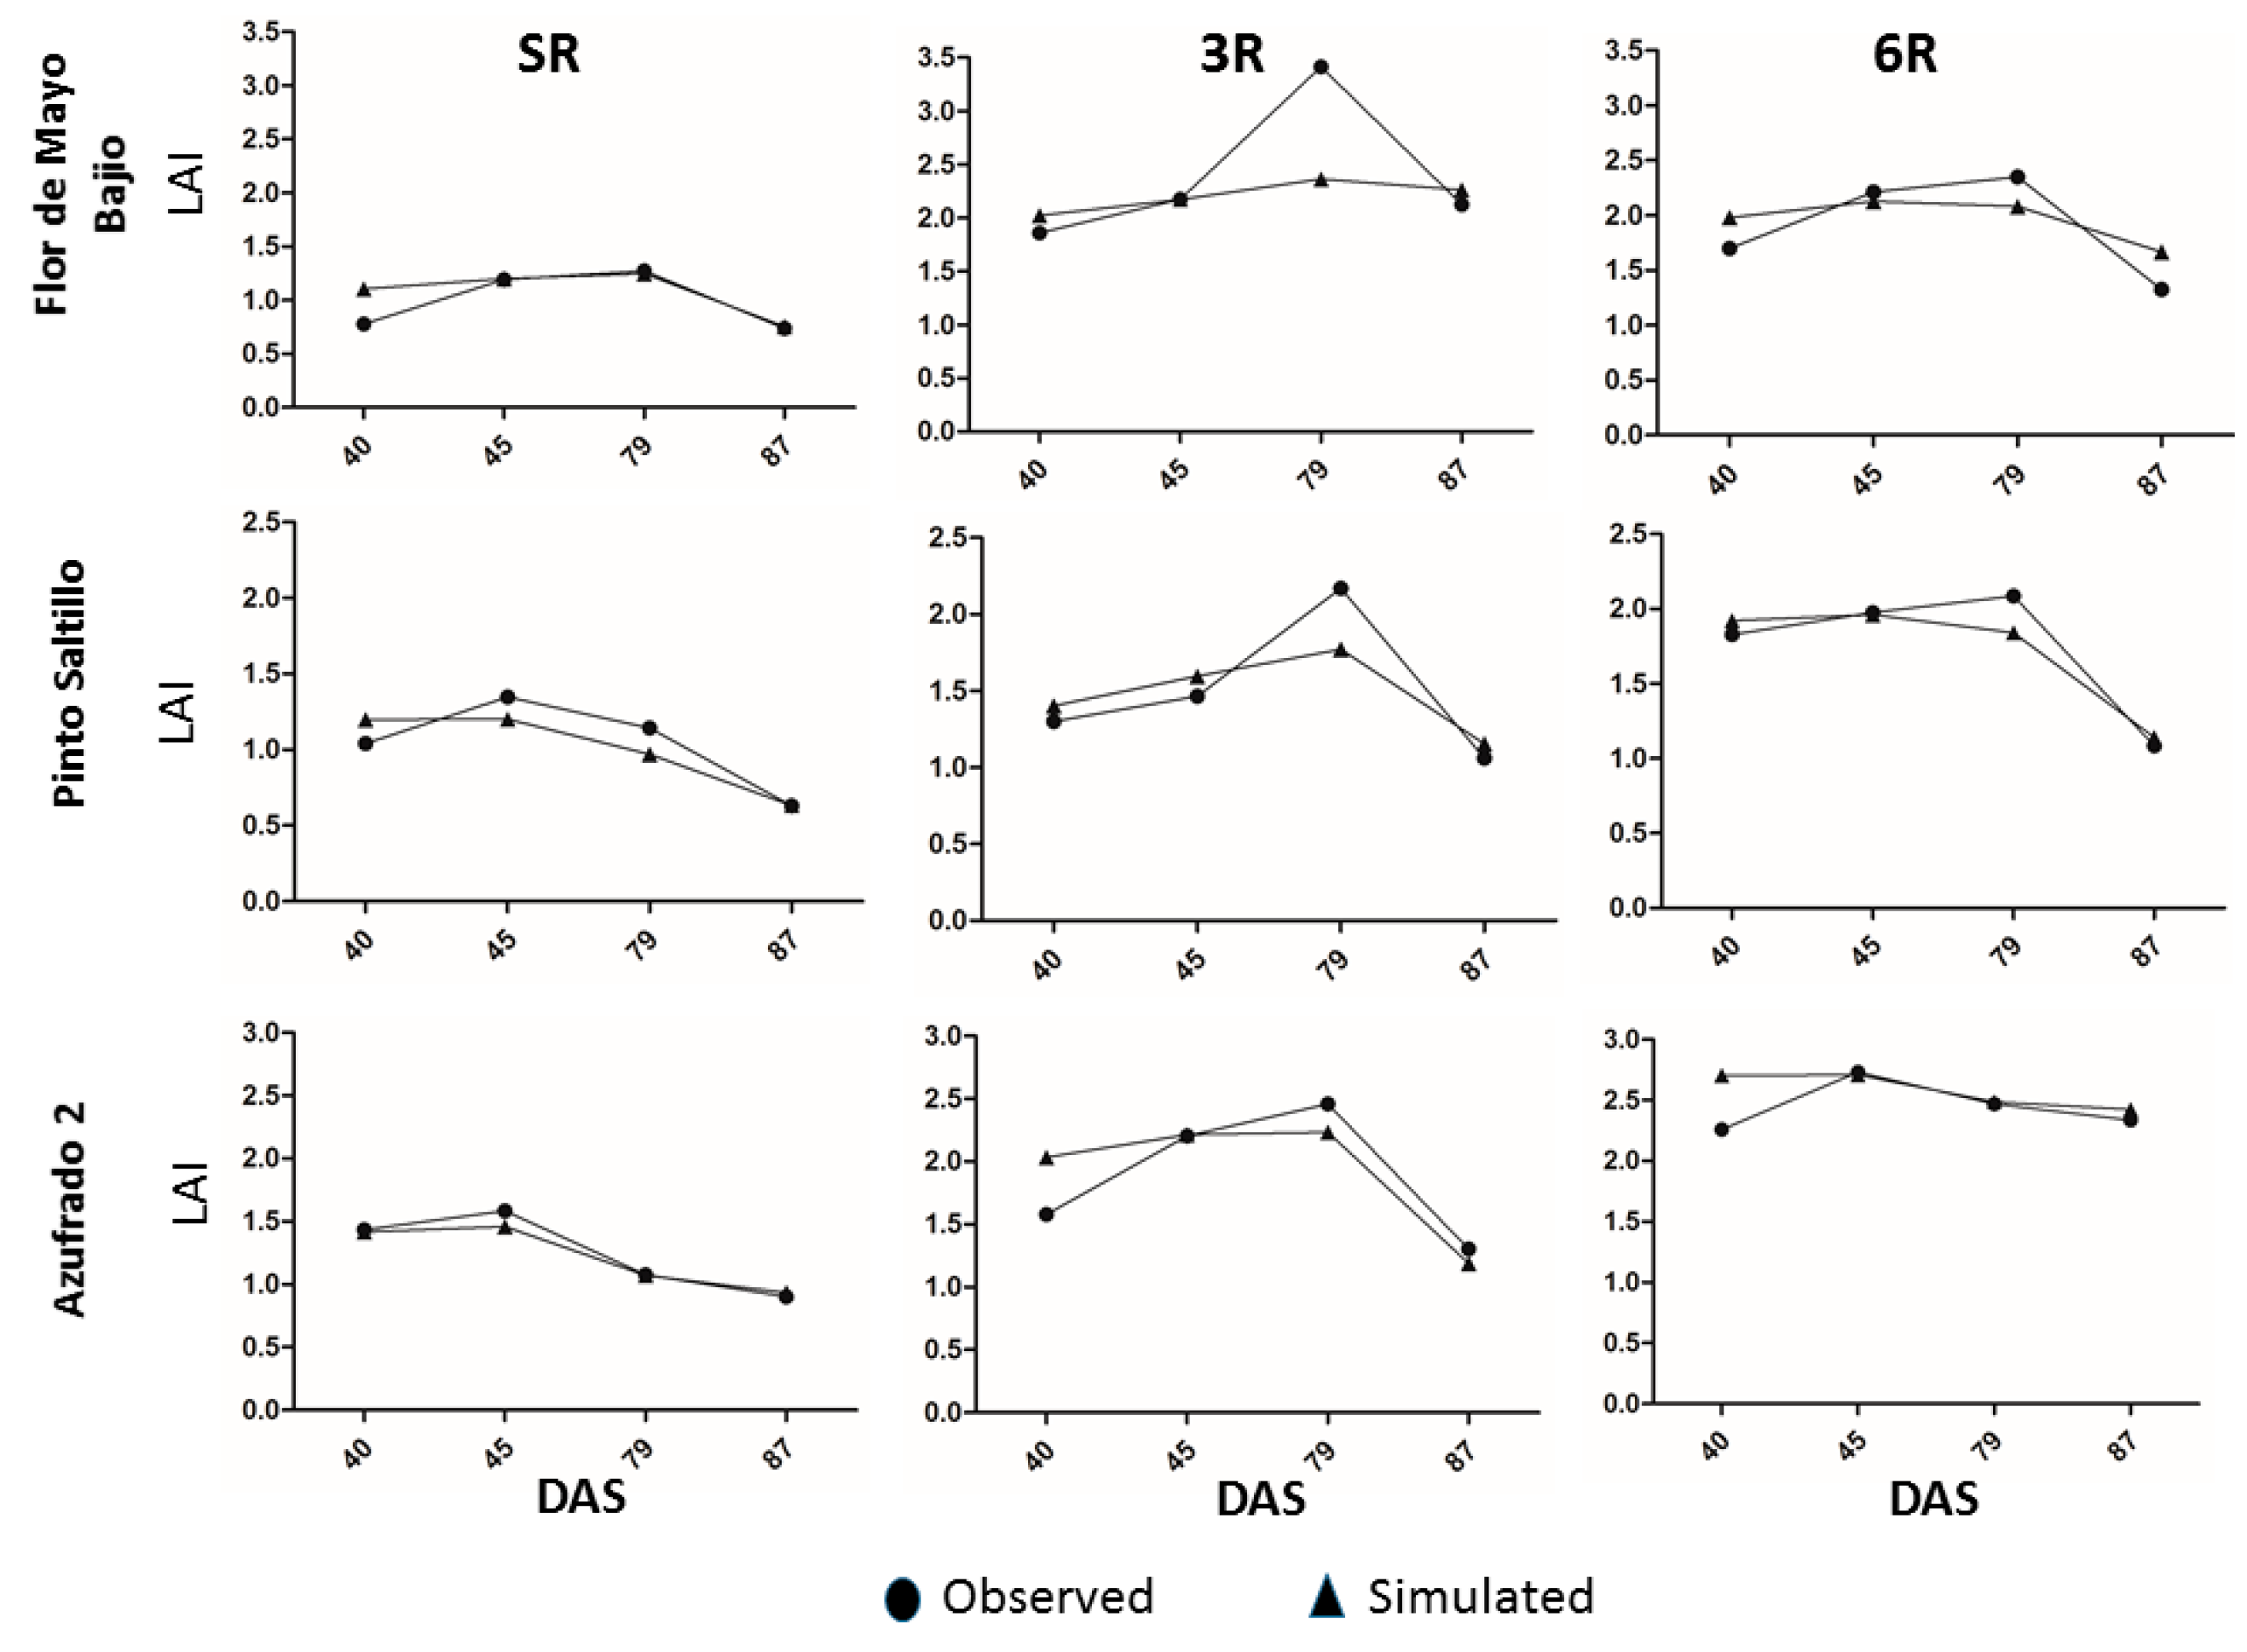
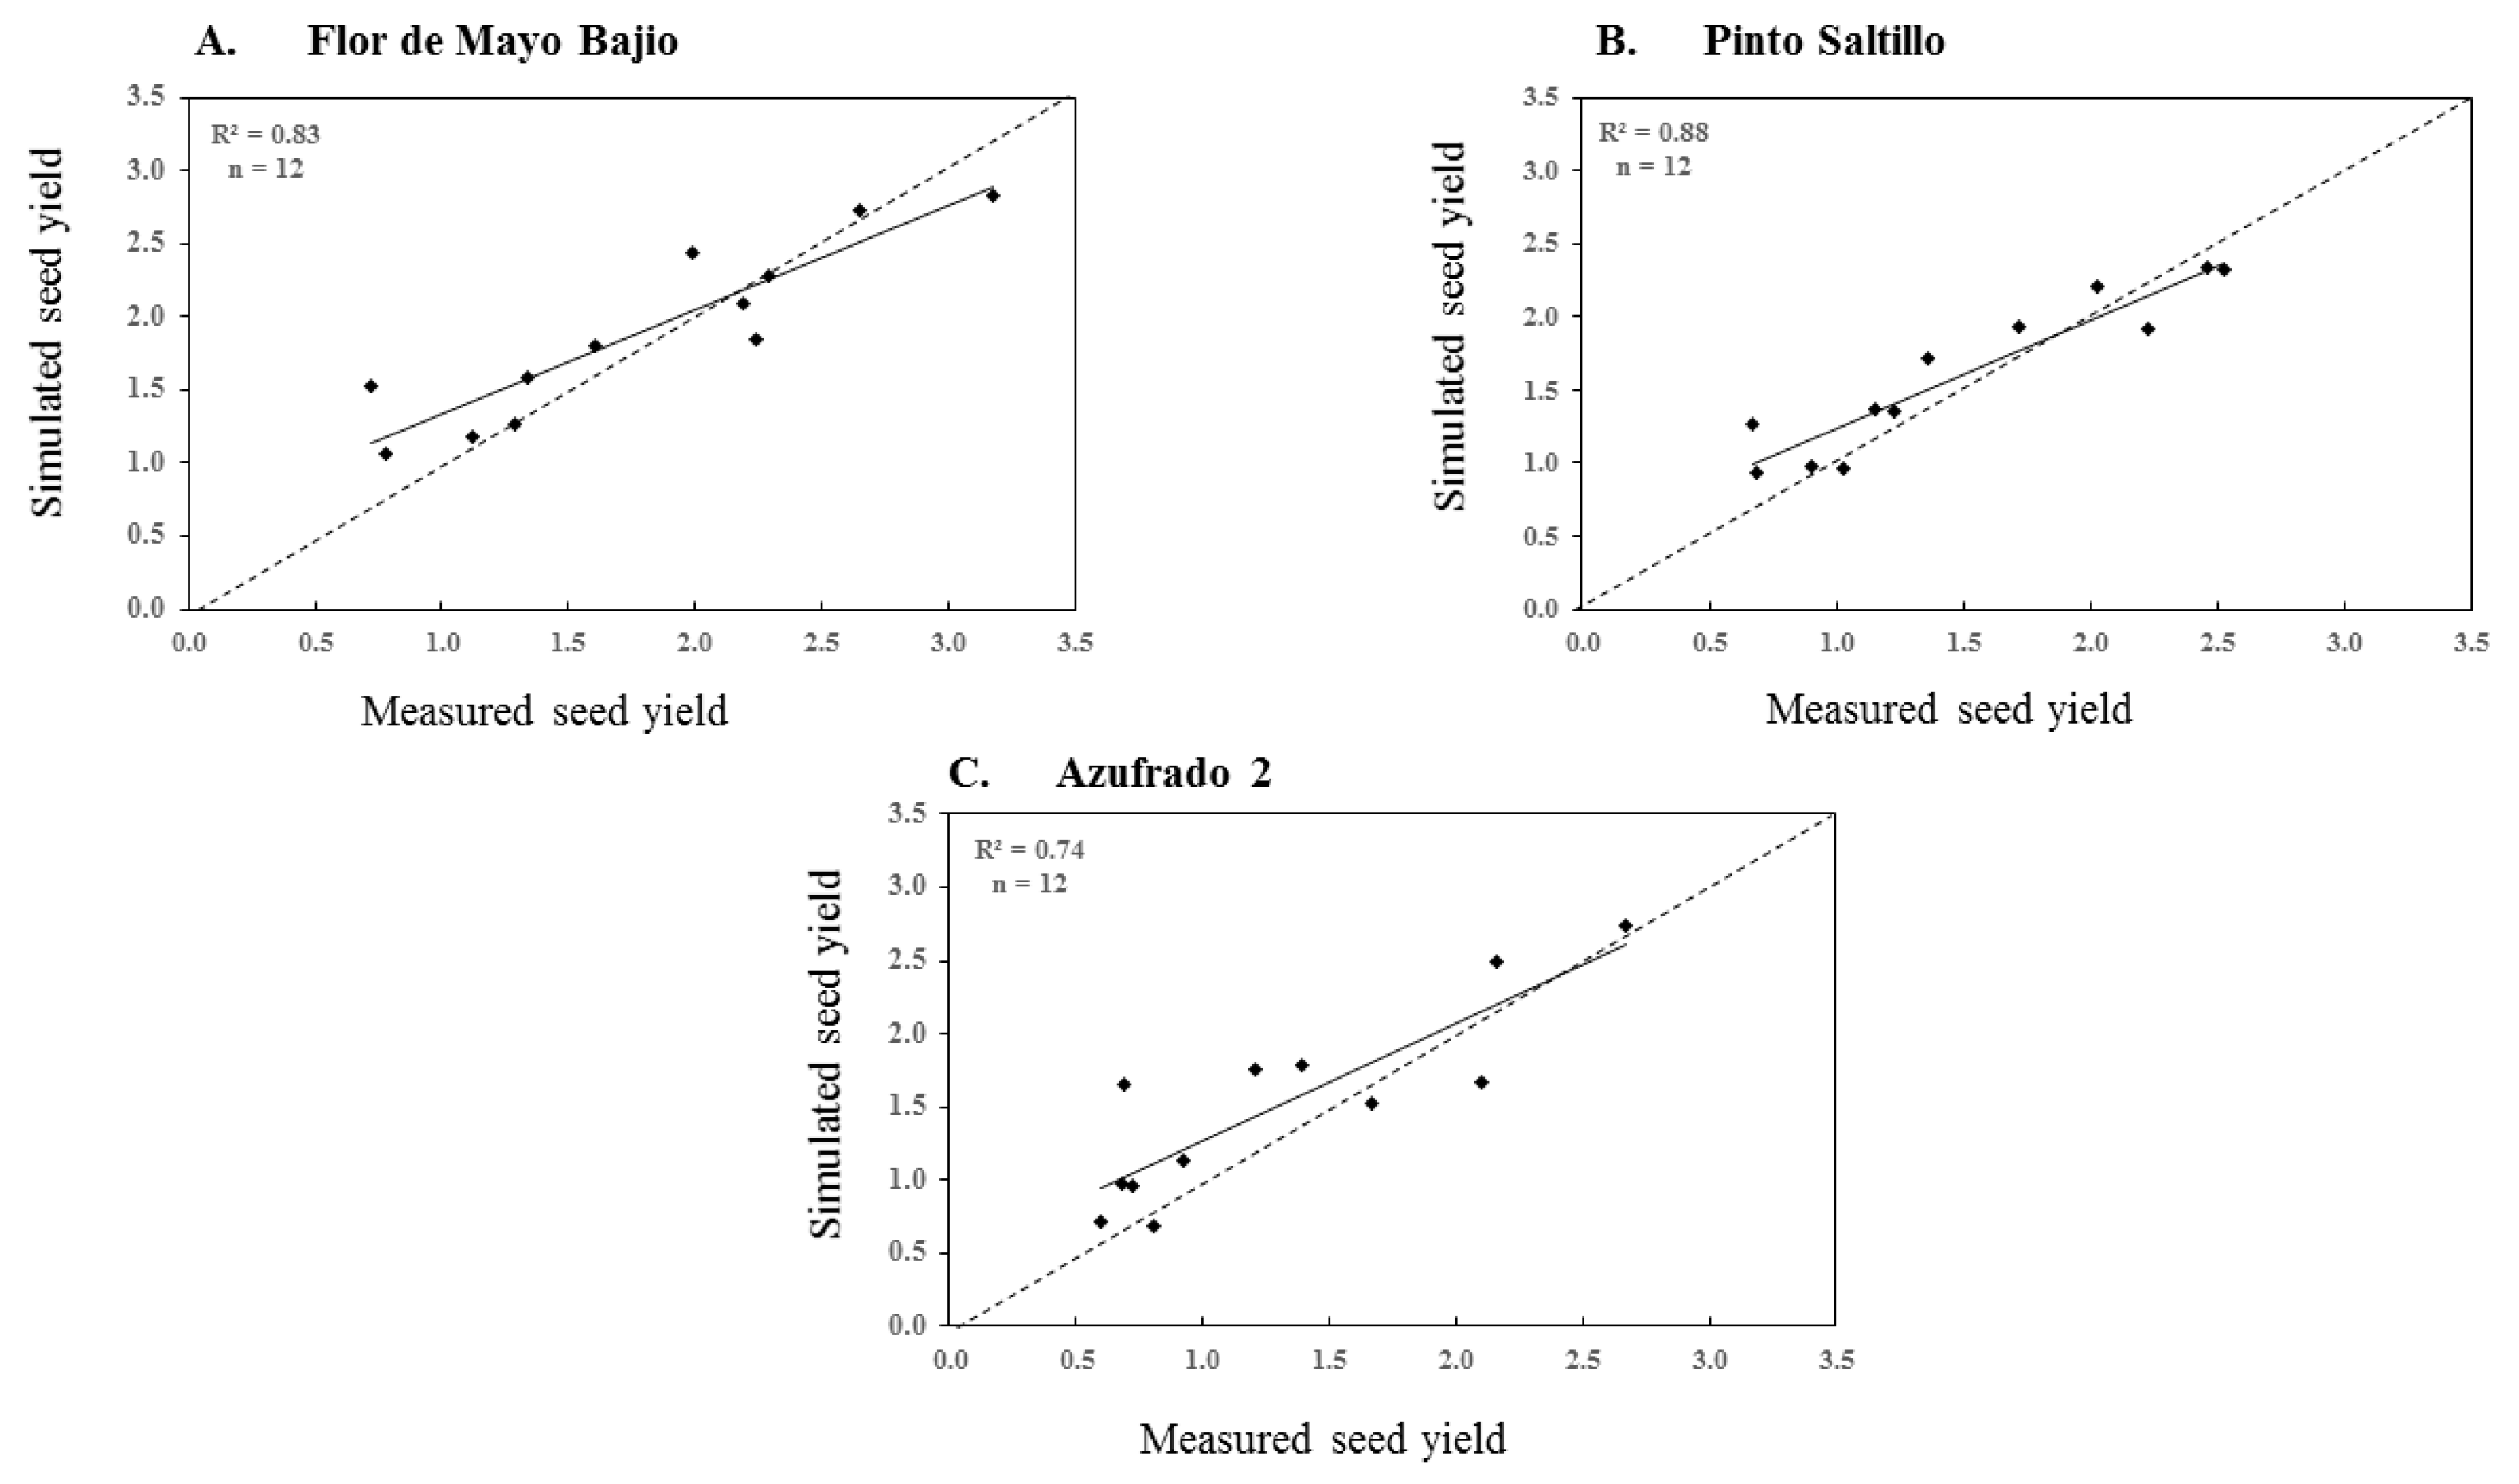
3.2. Model Evaluation

When the optimized parameters were used to simulate the yield of each cultivar in the two sites under study and under the two conditions of precipitation, i.e., dry and wet years, the MBE of the model was −0.1 for both FMB and PS and −0.2 for AZ2 (negative values mean underestimation). The RMSE was 0.3 Mg ha−1 for FM and PS and 0.4 Mg ha−1 for AZ2. The d-index was 0.9 for the three cultivars. As shown in Table 4 and Figure 2, there was no significant difference (p ≥ 0.05) between the simulated and the observed yield of the three cultivars during the seasons evaluated. In addition, the slope and intercept of the regression line shown in Figure 2 were not significantly different from 1 and 0, respectively.
The calculated paired t test of 1.42, 1.08, and 1.99 with 11 degrees of freedom and the Pearson correlation coefficients of 0.94, 0.91, and 0.86 (Table 4) for FMB, PS, and A2 cultivars, respectively, likewise show no significant differences (p ≥ 0.05) between the simulated and observed seed yield of the three cultivars.

3.3. Projected Changes in Temperature and Precipitation

It is predicted that climate change will result in rising temperatures and changes in precipitation patterns [43]. As the current and projected climatic factors are temporally and spatially variable in dryland cereal production systems in different countries [44], it is necessary to determine the impact of climate change in each region.
Figure 3 shows the increases of maximum and minimum temperature and precipitation projected in the RCP4.5 and RCP8.5 scenarios for Pabellon de Arteaga and Sandovales. Under these scenarios, the increases in projected temperatures during the common bean growing season (July–October) are 1.5° and 1.3 °C for the maximum and minimum temperature, respectively, for Pabellon de Arteaga and 2.5° and 2.3 °C, respectively, for Sandovales. This means that the increases will be greater by 1 °C in Sandovales (Figure 3). The higher minimum temperature will be a cause of concern because common beans are sensitive to high night-time temperatures during reproductive development [2]. A 1 °C increase in temperature would be equivalent to a 150 km northward shift of isotherms (lines joining places with similar temperature) or about 150 m lower altitude [45,46].
As for the predicted precipitation, the analysis of monthly projections shows decreases and increases of precipitation during the growing season in the two locations. During the initial months of the growth period, i.e., July and August, precipitation will be reduced by 5 and 20 mm for Pabellon de Arteaga and 9.0 mm and 31 mm for Sandovales, under scenarios RCP4.5 and RCP8.5, respectively. However, toward the end of the growing season, i.e., September and October, increases of 4 mm and 40 mm are projected for Pabellon de Arteaga and 5 mm and 45 mm for Sandovales, under RCP4.5 and RCP8.5 climate scenarios, respectively.

3.4. Impact of Sowing Density on Seed Yield

Simulated seed yield of the cultivars under study showed different responses to the sowing method in the two climatic scenarios. For the FMB cultivar (growth habit III), no difference was found in seed yield using the three sowing methods under the two climatic scenarios (Figure 4). The yields of SR versus 3R and SR versus 6R were similar (p ≥ 0.05) in both climate scenarios and in both locations (Figure 4). Table 5 shows that the average increments of seeds (%) in relation to SR projected for the period 2020–2039 for FMB were from 1% to 2% for 3R and from 1% to 4% in 6R in the two locations (Table 5).
As for the PS cultivar (growth habit III), which is considered a drought-tolerant cultivar [47], seed yield in both locations increased when the sowing method was changed from SR to 3R and 6R (Figure 5). As seen in Table 5, the potential increases in seed production within the period 2020–2039 were from 8% to 11% when changing from SR to 3R and from 13% to 16% when changing from SR to 6R in the two locations (Table 5). Rosales-Serna et al. [48] mention that with common bean cultivars such as PS that are resistant to drought stress, maturity acceleration coupled with a high seed filling rate helps lessen the impact of drought.
PS cultivar production presented less variability in 6R than in 3R (Figure 5). However, this was seen only in the first 11 and 14 years within the period 2020–2039 in Pabellon de Arteaga and Sandovales, respectively. Starting from 2030 and 2033, in Pabellon and Sandovales, respectively, both the 3R and 6R methods presented the same variability in production as the SR method (Figure 5). This is in agreement with Folberth et al. [49], who mention that crop management may be the main factor in obtaining yield targets and sustaining agroecosystems but only until a certain time (2060s).
In order to analyze the response of the PS cultivar to the treatments, we made further analysis of the water available for cultivation in the study area of Pabellon de Arteaga for 2024 (the year with high production under 6R treatment compared to SR) and for 2030 (the year in which the treatments were similar in production) (Figure 5) under the climatic scenario RCP4.5. For water balance (Figure 6 and Figure 7), we used the information on rain (mm), evapotranspiration (mm), and surface runoff (mm) simulated daily by the model during the two years. Likewise, the simulated LAI was used daily for each treatment.
In Figure 6A,B, it is observed that during the 2024 growing season, there was an intermittent water deficiency (less than 0) with the most severe occurring during the period from 33 to 43 days after sowing (DAS) and from 49 to 51 DAS when the cultivar had not yet reached maximum LAI (Figure 6B). However, if we compare the LAI during one of the critical days of water deficiency, on day 33 after planting, the SR treatment had 1.1 LAI while 3R and 6R had 0.5 and 1.40 LAI, respectively. Apparently, water stress had no effect on LAI development in the 6R treatment since it showed a maximum LAI of 2.5 in contrast to 1.4 of SR. As mentioned earlier, one of the qualities of the model is that it calculates the days of water stress. During the whole cycle (2024), the total days of water stress were 39 for SR and 3R and 45 for 6R, and the seed yields were 1.9, 1.8, and 2.3 Mg ha−1 for SR, 3R and 6R, respectively. This demonstrates that high yields can be obtained without additional water and also that evapotranspiration does not change in higher plant populations if the water supply is adequate, as mentioned by some authors [50]. Figure 7A,B shows the water balance during the year 2030. Starting from this year, the planting density using the cultivar PS did not present any advantage under projected changes of precipitation and temperature conditions for the highlands. Figure 7A shows that the cultivar had moisture deficiencies throughout the growing season affecting the LAI development (Figure 7B) and seed yield. The total days with stress were 29, 26, and 53 for SR, 3R, and 6R, respectively, with seed yields (Mg ha−1) of 2.1 for SR, 2.5 for 3R, and 2.3 for 6R.
In the case of the AZ2 (Figure 8), increases in seed yield were over 60% in 6R compared to SR in both locations for the full period of 2020–2039 under the two climate scenarios (Table 5). This indicates that AZ2 at 6R (260,000 plants ha−1) seems the most viable option for production under rainy conditions in the study areas, considering the future climatic scenarios.
Figure 9A,B shows the water balance in 2032, the year which presented the greatest increase in production for 6R (Figure 8) compared to SR (2.7 versus 1.5 Mg ha−1). During almost the entire growing season, there were periods of water deficit (Figure 9A). The total water stress days were 34, 41, and 46 for SR, 3R, and 6R, respectively. Figure 9B shows that the most critical water stress for the 6R treatment was recorded during days 37 to 45 after sowing, with available water values −9.6 to 0.0 mm, during which time the LAI reached its maximum (3.5) and subsequently declined. However, even with this abrupt stop to LAI development, the final production of 6R was 180% higher than that of the SR treatment.
The performance of this cultivar AZ2 under high sowing density could be associated with the high significant correlation between yield and seeds per plant, seeds per pod, and pods per plant, as has been previously reported [51,52].
Our results show that the use of high sowing density in common beans as a means of adapting to climatic change in semi-arid temperate regions can be a viable agronomic option, but results may vary according to the growth habit of the cultivar. This is in agreement with the findings of Nienhuis and Singh [53]. Our results show that growth habit III cultivars such as PS, which was developed and released for drought-stressed environments in the northern highlands [49], will respond favorably to the change in sowing density only until a certain time. However, after 2033, with more extreme weather conditions projected in the localities under study, the use of a bush-type architecture cultivar (growth habit I), such as AZ2, at high sowing densities (260,000 plants ha−1) is viable for these semi-arid temperate regions.
The architecture of the cultivar and its response in terms of LAI and intercepted radiation will play an important role in future management strategies, such as sowing densities. Ricaurte et al. [12] reported that growth habit I cultivars had approximately 30% lower LAI in relation to growth habit III cultivars but only under lower densities. On the other hand, Gardiner et al. [54], reporting on the behavior of a bush cultivar in different sowing densities, found that leaf abscission and the reduction of LAI were greater for the 45.5-cm row spacing in relation to the 91-cm row spacing from 54 to 72 days after planting, but narrow spacing still intercepted a greater percentage of the photosynthetically active radiation (PAR) at 72 days.
The architecture of the root also plays an important role in the response of the cultivars under drought conditions. Early investigations at CIAT (International Center for Tropical Agriculture) have shown that root architecture differs among common bean cultivars exposed to drought stress under different soil conditions; deeper basal roots are considered advantageous under water stress conditions [2]. Despite being an essential component in combating stress, roots have not been given enough attention in bean breeding efforts. In the present study, the measurement of the root in the cultivars under study was not considered. Therefore, this component should be considered in future research work related to the responses of cultivars to high sowing densities.

4. Conclusions

The physiological parameters generated for the three bean cultivars under different sowing densities were adequate to simulate their behavior under rainfed conditions. For the growth habit III cultivars, Flor de Mayo Bajio obtained increases in seed yield of less than 2% under climatic scenarios RCP4.5 and RCP8.5, while Pinto Saltillo showed increases ranging from 8% to 16% when planted at high densities (140,000 or 260,000 plants ha−1), although the positive response to this agronomic management was only until 2033. On the other hand, habit I growth cultivar Azufrado 2 planted at the highest densities (260,000 plants ha−1) showed seed increases of 60% even in the most critical scenario, i.e., RCP8.5, during the full period 2020–2039. These results suggest that considering the projected climate conditions, high sowing densities may be a viable agronomic option for common bean production under rainfed conditions in semi-arid temperate regions, such as the highlands of Mexico, in the near future; however, the selection of the cultivar is a key element to consider in this regard.

Supplementary Materials

The following is available online at https://www.mdpi.com/2073-4395/10/3/442/s1: Table S1. Observed (O) and simulated (S) leaf area index at different days after sowing (DAS) of common bean cultivars growth habit III Flor de Mayo Bajio and Pinto Saltillo and growth habit I Azufrado 2 planted at seed densities of 90 (SR),145 (3R) and 260 (6R) thousand plants ha−1 under rainfed conditions in Mexican highlands.

Author Contributions

A.D.B.-G. conceptualized the study, contributed to the acquisition and analysis of data and the discussion of results, and wrote the final draft; R.F.-D. contributed to data acquisition and analysis; G.G.-R. and E.O.-C. contributed to the acquisition of data on climatic change and seed yield, respectively; J.R.K. and M.N.M. contributed to reviewing the results and editing the final draft. All authors read and approved the final manuscript.

Funding

This research received no external funding.

Acknowledgments

The authors thank the anonymous reviewers for their valuable suggestions and Elvira Aranda Tabobo for her help in editing the manuscript.

Conflicts of Interest

The authors declare no conflict of interest.

References

  1. Lobell, D.B.; Burke, M.B.; Tebaldi, C.; Mastrandrea, M.D.; Falcon, W.P.; Naylor, R.L. Prioritizing climate change adaptation needs for food security in 2030. Science 2008, 319, 607–610. [Google Scholar] [CrossRef]
  2. Mc Clean, P.E.; Burridge, J.; Beebe, S.; Rao, I.M.; Porch, T.G. Crop improvement in the era of climate change: An integrated, multi-disciplinary approach for common bean (Phaseolus vulgaris). Funct. Plant Biol. 2011, 38, 927–933. [Google Scholar] [CrossRef]
  3. Battisti, D.S.; Naylor, R.L. Historical warnings of future food insecurity with unprecedented seasonal heat. Science 2009, 323, 240–244. [Google Scholar] [CrossRef] [PubMed] [Green Version]
  4. Lobell, D.B.; Bänziger, M.; Magorokosho, C.; Vivek, B. Nonlinear heat effects on African maize as evidenced by historical yield trials. Nat. Clim. Chang. 2011, 1, 42–45. [Google Scholar] [CrossRef]
  5. Stagnari, F.; Maggio, A.; Galieni, A.; Pisante, M. Multiple benefits of legumes for agriculture sustainability: An overview. Chem. Biol. Technol. Agric. 2017, 4, 2. [Google Scholar] [CrossRef] [Green Version]
  6. Mata, L.J.; Campos, M.; Basso, E.; Compagnucci, R.; Fearnside, P.; Magrin, G.; Villamizar, A. Latin America. In Climate Change 2001: Impacts, Adaptations, and Vulnerability. Contribution of Working Group II to the Thirds Assessment Report of the International Panel on Climate Change; McCarty, J.J., Canzini, O.F., Leary, N.A., Dokken, D.J., White, K.S., Eds.; Cambridge University Press: Cambridge, UK, 2001. [Google Scholar]
  7. Magrin, G.; Gay García, C.D.; Cruz Choque, J.C.; Giménez, A.R.; Moreno, G.J.; Nagy, C.N.; Villamizar, A. Latin America. In Climate Change 2007: Impacts, Adaptation and Vulnerability. Contribution of Working Group II to the Fourth Assessment Report of the Intergovernmental Panel on Climate Change; Parry, M.L., Canziani, O.F., Palutikof, J.P., van der Linden, P.J., Hanson, C.E., Eds.; Cambridge University Press: Cambridge, UK, 2007. [Google Scholar]
  8. Beebe, S.E.; Rao, I.M.; Cajiao, C.; Grajales, M. Selection for drought resistance in common bean also improves yield in phosphorus limited and favorable environments. Crop Sci. 2008, 48, 582–592. [Google Scholar] [CrossRef]
  9. Beebe, S.; Ramirez, J.; Jarvis, A.; Rao, I.M.; Mosquera, G.; Bueno, J.M.; Blair, M.W. Genetic improvement of common beans and the challenges of climate change. In Crop Adaptation to Climate Change; Yadav, S.S., Redden, R., Hatfield, J.L., Lotze-Campen, H., Hall, A., Eds.; John Wiley & Sons, Inc: Hoboken, NJ, USA, 2011. [Google Scholar]
  10. Beebe, S.; Rao, I.M.; Blair, M.; Acosta, G.J. Phenotyping common beans for adaptation to drought. Front. Physiol. 2013, 35, 1–20. [Google Scholar] [CrossRef] [Green Version]
  11. Borja-Bravo, M.; Osuna-Ceja, E.S.; Arellano-Arciniega, S.; García-Hernández, R.V.; Martínez-Gamiño, M.Á. Competitividad y eficiencia en la producción de frijol en condiciones de temporal con tecnología tradicional y recomendada. Rev. Fitotec. Mex. 2018, 41, 443–450. [Google Scholar]
  12. Ricaurte, J.; Clavijo, M.J.A.; Sinclair, T.R.; Rao, I.M. Sowing density effect on common bean leaf area development. Crop Sci. 2016, 56, 1–9. [Google Scholar] [CrossRef] [Green Version]
  13. Soratto, R.P.; Catuchi, T.A.; Souza, E.D.F.C.D.; Garcia, J.L.N. Plant density and nitrogen fertilization on common bean nutrition and yield. Rev. Caatinga 2017, 30, 670–678. [Google Scholar] [CrossRef]
  14. Nurk, L.; Graß, R.; Pekrun, C.; Wachendorf, M. Effect of sowing method and weed control on the performance of maize (Zea mays L.) intercropped with climbing beans (Phaseolus vulgaris L.). Agriculture 2017, 7, 51. [Google Scholar] [CrossRef] [Green Version]
  15. Clavijo, M.J.A.; Ricaurte, J.; Sinclair, T.R.; Rao, I.M.; Beebe, S.E. Influence of plant density and growth habit of common bean on leaf area development and N accumulation. J. Crop Improv. 2019, 33, 1–14. [Google Scholar]
  16. Osuna-Ceja, E.S.; Reyes-Muro, L.; Padilla-Ramírez, J.S.; Martínez-Gamiño, M.A. Rendimiento de frijol Pinto Saltillo en altas densidades de población bajo temporal. Revista Mexicana De Ciencias Agrícolas 2012, 3, 1389–1400. [Google Scholar] [CrossRef] [Green Version]
  17. Medina, G.G.; Maciel, P.; Ruíz, C.; Serrano, A.; Silva, S. Estadísticas Climatológicas Básicas Del Estado de Aguascalientes (Período 1961–2003). Available online: https://www.researchgate.net/institution/INIFAP_Instituto_Nacional_de_Investigaciones_Forestales_Agricolas_y_Pecuarias (accessed on 4 March 2020).
  18. García, E. Climas (Clasificación de Köppen, Modificada por García). Escala1:1000000. CONABIO. México. Available online: http://idegeo.centrogeo.org.mx/layers/geonode%3Aclima1mgw/layer_info_metadata (accessed on 20 July 2018).
  19. Debouck, D.G. Phaseolus Germplasm Collection in Northwestern Argentina. Available online: https://cgspace.cgiar.org/bitstream/handle/10568/81395/Informe%20Colecta%20Argentina-1986.pdf?sequence=1 (accessed on 5 August 2019).
  20. Osuna, C.E.S.; Acosta, G.J.A.; Reyes, M.L.; Martínez, G.M.A.; Padilla, R.J.S.; Ventura, R.E.; González, G.E.; Cortés, C.M.A.; Garibaldi, M.F.; Hernández, R.I. Tecnología Para Incrementar la Producción de Frijol de Temporal en el Altiplano Semiárido de México. Instituto Nacional de Investigaciones Forestales, Agrícolas y Pecuarias (INIFAP). Available online: http://biblioteca.inifap.gob.mx:8080/xmlui/bitstream/handle/123456789/1375/783.pdf?sequence=1 (accessed on 4 March 2020).
  21. Garibaldi, M.F.; Osuna, C.E.S.; Vidal, G.H.; RMartinez, R.E. Sembradora Neumática Para Siembra en Camas. Instituto Nacional de Investigaciones Forestales, Agrícolas y Pecuarias (INIFAP). Available online: http://biblioteca.inifap.gob.mx:8080/jspui/handle/123456789/4457?show=full (accessed on 4 March 2020).
  22. Baez-González, A.D.; Williams Amber, S.; Kiniry, J. Medición de Parámetros Fisiológicos en Plantas Utilizando el AccuPAR (Ceptómetro LP-80). Instituto Nacional de Investigaciones Forestales, Agrícolas y Pecuarias (INIFAP). Available online: https://www.ars.usda.gov/ARSUserFiles/30980500/Medici%C3%B3n%20de%20Par%C3%A1metros%20en%20Plantas%20Utilizando%20AccuPAR.pdf (accessed on 4 March 2020).
  23. Baez-González, A.D.; Kiniry, J.R.; Williams, J. ALMANACMEX. Agricultural Land Management Alternatives with Numerical Assessment Criteria Model (ALMANAC) with Mexican Interface. Versión 1.0.18. User’s Manual. Instituto Nacional de Investigaciones Forestales, Agrícolas y Pecuarias (INIFAP). Available online: https://www.ars.usda.gov/ARSUserFiles/30980500/ManualdeUsuarioAlmanacMex(Espanol)August2017.pdf (accessed on 4 March 2020).
  24. Kiniry, J.R.; Williams, J.R.; Gassman, P.W.; Debaeke, P. A general, process-oriented model for two competing plant species. Trans. Am. Soc. Agric. Eng. 1992, 35, 801–810. [Google Scholar] [CrossRef]
  25. Williams, J.R.; Jones, C.A.; Dyke, P.T. The EPIC model and its application. In Proceedings of the International Symposium on Minimum Data Sets for Agrotechnology Transfer ICRISAT Center, Patancheru, India, 21–26 March 1983; pp. 111–121. [Google Scholar]
  26. Hanks, R.J. Yield and water-use relationships: An overview. In Limitations to Efficient Water Use in Crop Production; Taylor, H.M., Jordan, W.R., Sinclair, T.R., Eds.; American Society of Agronomy, Inc.; Crop Science Society of America, Inc.; Soil Science Society of America, Inc.: Madison, WI, USA, 1983; pp. 393–411. [Google Scholar]
  27. Skrehota, O. Quantitative Structure-Property Relationship Modeling Algorithms, Challenges and IT Solutions. Thesis. Masaryk, University Faculty of Informatics, Czechoslovakia. Available online: https://theses.cz/id/qjv0rf/ (accessed on 6 August 2019).
  28. Ahuja, L.R.; Ma, L. Parameterization of agricultural system models: Current approaches and future needs. In Agricultural System Models in Field Research and Technology Transfer; Ahuja, L.R., Ma, L., Howell, T.A., Eds.; Lewis Publishers: London, UK, 2002. [Google Scholar]
  29. Ko, J.; Fox, D. GP-Bayes Filters: Bayesian filtering using Gaussian process prediction and observation models. Auton. Robot. 2009, 27, 75–90. [Google Scholar] [CrossRef] [Green Version]
  30. Driessen, P.M.; Konijn, N.T. Land-Use Systems Analysis. WAU and Interdisciplinary Research (INRES). Available online: https://research.wur.nl/en/publications/land-use-systems-analysis (accessed on 4 March 2020).
  31. Monteiro, L.A.; Sentelhas, P.C. Potential and actual sugarcane yields in southern Brazil as a function of climate conditions and crop management. Sugar Tech 2014, 16, 264–276. [Google Scholar] [CrossRef]
  32. Odongo, V.O.; Onyando, J.O.; Mutua, B.M.; Becht, R. Sensitivity analysis and calibration of the modified universal soil loss equation (MUSLE) for the upper Malewa catchment, Kenya. Int. J. Sediment Res. 2013, 28, 368–383. [Google Scholar] [CrossRef]
  33. Baez-Gonzalez, A.D.; Kiniry, J.R.; Ramirez, J.S.P.; Garcia, G.M.; Gonzalez, J.L.R.; Ceja, E.S.O. Parameterization of ALMANAC crop simulation model for non-irrigated dry bean in semi-arid temperate areas in Mexico. Interciencia 2015, 40, 185–189. [Google Scholar]
  34. Arnold, J.G.; Moriasi, D.N.; Gassman, P.W.; Abbaspour, K.C.; White, M.J.; Srinivasan, R.; Santhi, C.; Harmel, R.D.; Van Griensven, A.; Van Liew, M.W.; et al. SWAT: Model use, calibration, and validation. Trans. ASABE 2012, 55, 1491–1508. [Google Scholar] [CrossRef]
  35. Wallach, D. Evaluating crop models. In Working with Dynamic Crop Models. Evaluating, Analyzing, Parameterizing and Using Them; Wallach, D., Makowski, D., Jones, J.W., Eds.; Elsevier: Amsterdam, The Netherlands, 2006. [Google Scholar]
  36. Willmott, C.J.; Ackleson, S.G.; Davis, R.E.; Feddema, J.J.; Klink, K.M.; Legates, D.R.; Rowe, C.M. Statistics for the evaluation and comparison of models. J. Geophys. Res. Ocean. 1985, 90, 8995–9005. [Google Scholar] [CrossRef] [Green Version]
  37. Soler, C.M.T.; Sentelhas, P.C.; Hoogenboom, G. Application of the CSM-CERES-Maize model for planting date evaluation and yield forecasting for maize grown off-season in a subtropical environment. Eur. J. Agron. 2007, 27, 165–177. [Google Scholar] [CrossRef]
  38. Walton, D.; Meyerson, J.; Neelin, J.D. Accessing, downloading, and viewing CMIP5 data. Earth Syst. Grid Fed. 2013, 25. [Google Scholar]
  39. Ruiz-Corral, J.; Medina-García, G.; Rodríguez-Moreno, V.; Sánchez-González, J.; Villavicencio García, R.; Durán Puga, N.; Grageda Grageda, J.; García Romero, G. Regionalizaciόn del cambio climático en México. Revista Mexicana De Ciencias Agrícolas 2017, 13, 2451–2464. [Google Scholar] [CrossRef] [Green Version]
  40. Knox, J.; Hess, T.; Daccache, A.; Wheeler, T. Climate change impacts on crop productivity in Africa and South Asia. Environ. Res. Lett. 2012, 7, 1–8. [Google Scholar] [CrossRef]
  41. Jones, P.G.; Thornton, P.K. Generating downscaled weather data from a suite of climate models for agricultural modelling applications. Agric. Syst. 2013, 114, 1–5. [Google Scholar] [CrossRef]
  42. Baez-Gonzalez, A.D.; Kiniry, J.R.; Meki, M.N.; Williams, J.R.; Alvarez-Cilva, M.; Ramos-Gonzalez, J.L.; Magallanes-Estala, A. Potential impact of future climate change on sugarcane under dryland conditions in Mexico. J. Agron. Crop Sci. 2018, 204, 515–528. [Google Scholar] [CrossRef]
  43. Jessoe, K.; Manning, D.T.; Taylor, J.E. Climate change and labour allocation in rural Mexico: Evidence from annual fluctuations in weather. Econ. J. 2017, 128, 230–261. [Google Scholar] [CrossRef]
  44. O’Leary, G.J.; Pramod, K.A.; Calderini, D.F.; Connor, D.J.; Craufurd, P.; Sanford, D.E.; Xue, H.; Jerry, L.; Hatfield, L.H. Challenges and Responses to Ongoing and Projected Climate Change for Dryland Cereal Production Systems throughout the World. Agronomy 2018, 8, 34. [Google Scholar] [CrossRef] [Green Version]
  45. IPCC. Synthesis Report. In Climate Change 2007. Contribution of Working Groups I, II and III to the Fourth Assessment Report of the Intergovernmental Panel on Climate Change; Pachauri, R.K., Reisinger, A., Eds.; Cambridge University Press: New York, NY, USA, 2007; 103p. [Google Scholar]
  46. Salih, F.A.; El Hardallou, S.B. The yield performance and proximate analysis of twelve cultivars of faba beans grown at five sites in the Northern region of the Sudan. FABIS Newsl. 1986, 15, 52–55. [Google Scholar]
  47. Sanchez-Valdez, I.; Acosta-Gallegos, J.A.; Ibarra-Perez, F.J.; Rosales-Serna, R.; Singh, S.P. Registration of Pinto Saltillo common bean. Crop Sci. 2004, 44, 1865–1866. [Google Scholar] [CrossRef]
  48. Rosales-Serna, R.; Kohashi-Shibata, J.; Acosta-Gallegos, J.A.; Lopez, C.T.; Ortiz-Cereceres, J.; Kelly, J.D. Biomass distribution, maturity acceleration and yield in drought-stressed common bean cultivars. Field Crop. Res. 2004, 85, 203–211. [Google Scholar] [CrossRef]
  49. Folberth, C.; Yang, H.; Gaiser, T.; Liu, J.; Wang, X.; Williams, J.; Schulin, R. Effects of ecological and conventional agricultural intensification practices on maize yields in sub-Saharan Africa under potential climate change. Environ. Res. Lett. 2014, 9, 044004. [Google Scholar] [CrossRef] [Green Version]
  50. Basso, B.; Ritchie, J.T. Evapotranspiration in High-Yielding Maize and under Increased Vapor Pressure Deficit in the US Midwest. Agric. Env. Lett. Res. Lett. 2018, 3, 1–6. [Google Scholar] [CrossRef]
  51. Tedla, Y.R.; Habtamu, Z. Genetic Variability on Morpho-Physiological Traits of Drought Resistance in Small Red Seeded Common Bean (Phaseolus vulgaris L.) Genotypes at Goffa. Ph.D. Thesis, Haramaya University, Haramaya, Ethiopia, 2010. [Google Scholar]
  52. Sadeghi, A.; Cheghamirza, K.; Dorri, H.R. The study of morphoagronomic traits relationship in common bean (Phaseolus vulgaris L.). Biharean Biol. 2011, 5, 102–108. [Google Scholar]
  53. Nienhuis, J.; Singh, S.P. Effects of location and plant density on yield and architectural traits in dry beans. Crop Sci. 1985, 25, 579–584. [Google Scholar] [CrossRef]
  54. Gardiner, T.R.; Craker, L.; Vietor, D. Growth habit and row width effects on leaf area development and light interception of field beans. Can. J. Plant Sci. 1979, 59, 191–199. [Google Scholar] [CrossRef]
Figure 1. Observed and simulated leaf area index (LAI) of common bean cultivars growth habit III Flor de Mayo Bajio and Pinto Saltillo and growth habit I Azufrado 2 at different days after sowing (DAS) at seed densities of 90,000 (single rows, SR), 145,000 (three rows, 3R), and 260,000 (six rows, 6R) plants ha−1 under rainfed conditions in Mexican highlands.
Agronomy 10 00442 g001
Figure 2. Simulated and observed seed yield (Mg ha−1) of three common bean cultivars growth habit III (Flor de Mayo Bajio and Pinto Saltillo) and growth habit I (Azufrado 2) under rainfed conditions in Mexican semi-arid temperate highlands.
Agronomy 10 00442 g002
Figure 3. Historical and forecasted monthly maximum (Tmax) and minimum (Tmin) temperature and precipitation (Ppt) under the climatic change scenarios RCP4.5 and RCP8.5 for the period 2020–2039 for common beans under rainfed condition in the semi-arid temperate highlands of Pabellon de Arteaga and Sandovales in Aguascalientes, Mexico.
Agronomy 10 00442 g003
Figure 4. Forecasted seed yield (Mg ha−1) increase or decrease for 2020–2039 under climatic scenarios RCP4.5 and RCP8.5 for rainfed Flor de Mayo Bajio common beans cultivar (growth habit III) under sowing densities of 145,000 (3R) and 260,000 (6R) plants ha−1 compared to the baseline sowing density 90,000 plants ha−1 (SR) in the semi-arid temperate highlands of Pabellon de Arteaga and Sandovales in Aguascalientes, Mexico.
Agronomy 10 00442 g004
Figure 5. Forecasted seed yield (Mg ha−1) increase or decrease for 2020–2039 under climatic scenarios RCP4.5 and RCP8.5 for Pinto Saltillo common bean cultivar (growth habit III) under sowing densities of 145,000 (3R) and 260,000 (6R) plants ha−1, compared to baseline sowing density 90,000 plants ha−1 (SR) under rainfed conditions in the semi-arid temperate highlands of Pabellon de Arteaga and Sandovales in Aguascalientes, Mexico.
Agronomy 10 00442 g005
Figure 6. Water balance (A) and leaf area index (LAI) (B) for 2024 under climatic scenarios RCP4.5 for common bean cultivar Pinto Saltillo (growth habit III) under sowing densities of 90,000 (SR), 145,000 (3R), and 260,000 (6R) plants ha−1 under rainfed conditions in the semi-arid temperate highland of Pabellon de Arteaga in Aguascalientes, Mexico.
Agronomy 10 00442 g006
Figure 7. Water balance (A) and leaf area index (LAI) (B) for 2030 under climatic scenarios RCP4.5 for rainfed common bean cultivar Pinto Saltillo (growth habit III) under sowing densities of 90,000 (SR), 145,000 (3R) and 260,000 (6R) plants ha−1 in the semi-arid temperate highland of Pabellon de Arteaga in Aguascalientes, Mexico.
Agronomy 10 00442 g007
Figure 8. Forecasted seed yield (Mg ha−1) increase or decrease for 2020–2039 under climatic scenarios RCP4.5 and RCP8.5 for Azufrado 2 (growth habit I) common bean cultivar (growth habit I) under sowing densities of 145,000 (3R) and 260,000 (6R) plants ha−1 compared to a baseline sowing density of 90,000 plants ha−1 (SR) under rainfed conditions in the semi-arid temperate highlands of Pabellon de Arteaga and Sandovales in Aguascalientes.
Agronomy 10 00442 g008
Figure 9. Water balance (A) and leaf area index (LAI) (B) for the growing season 2032 under climatic scenario RCP4.5 for rainfed common bean cultivar Azufrado 2 (growth habit I) under sowing densities of 90,000 (SR), 145,000 (3R) and 260,000 (6R) plants ha−1 in the semi-arid temperate highland of Pabellon de Arteaga in Aguascalientes, Mexico.
Agronomy 10 00442 g009
Table 1. Morphological characteristics of common bean cultivars Flor de Mayo Bajio, Pinto Saltillo, and Azufrado 2.
CultivarGrowth Habit Plant Cycle (Days)Grain Size and Color
Flor de Mayo Bajio Type III 85–90Small, spotted with light background
Pinto SaltilloType III 85–90 Medium, mottled cream brown
Azufrado 2Type I91–115Large, light yellow
† Type I. Determinate bush. Type III. Indeterminate prostrate.
Table 2. Observed (O) and simulated (S) seed yield (Mg ha−1) of common bean cultivars growth habit III Flor de Mayo Bajio and Pinto Saltillo and growth habit I Azufrado 2 planted at seed densities of 90,000 (SR), 145,000 (3R), and 260,000 (6R) plants ha−1 under rainfed conditions in Mexican highlands.
Plant Densities
SR3R6R
CultivarOSOSOS
Flor de Mayo Bajio1.5 ± 0.21.61.5 ± 0.21.61.6 ± 0.31.6
Pinto Saltillo1.5 ± 0.31.81.9 ± 0.32.01.9 ± 0.12.0
Azufrado 21.1 ± 0.21.30.9 ± 0.21.31.7 ± 0.21.8
± Standard Deviation.
Table 3. Crop parameters for common bean cultivars growth habit III Flor de Mayo Bajio and Pinto Saltillo and growth habit I Azufrado 2 sown at seed densities of 90,000 (SR), 145,000 (3R), and 260,000 (6R) plants ha−1 under rainfed conditions in Mexican semi-arid temperate highlands.
Crop Parameter
Biomass–energy ratio (g MJ−1 m−2)25.0
Optimal Temperature for Plant Growth (°C)30.0
Minimum Temperature for Plant Growth (°C)8.0
Maximum Crop Height (m)0.50
Maximum Root Depth (m)0.60
Dry Matter Decline Rate Index0.10
Harvest Index0.36
PINTO SALTILLOFLOR DE MAYO BAJIOAZUFRADO 2
SR3R6RSR3R6RSR3R6R
Maximum Leaf Area Index (LAI) 1.83.53.52.05.05.02.04.25.0
Fraction of Season When LAI Starts to Decline0.750.770.770.770.780.800.600.770.77
Light Extinction Coefficient for Beer’s Law0.330.410.470.330.410.470.300.350.55
First Point on Optimal LAI Curve *10; 2515; 1010; 1515; 1515; 1015; 1015; 1520; 1015; 15
Second Point on Optimal LAI Curve *40; 9955; 7050; 9650; 8055; 7055; 7042; 9152; 842; 95
Potential Heat Units (°C) 1200 1100 1600
* Two points on optimal (nonstress) leaf area development curve. Numbers before semicolon are % of growing season. Numbers after semicolon are fractions of maximum potential leaf area index (LAI).
Table 4. Paired t-test statistics to assess differences between observed and simulated seed yield (Mg ha−1) of common bean cultivars growth habit III and I sown under rainfed conditions in Mexican semi-arid temperate highlands.
Data VariableCultivars
Flor de Mayo Bajio (III)Pinto Saltillo (III)Azufrado 2 (I)
Observed YieldSimulated YieldObserved YieldSimulated Yield Observed YieldSimulated Yield
Mean1.51.61.81.91.31.5
Variance0.40.30.60.40.50.4
Observations121212121212
Pearson Correlation0.940.910.86
Degrees of Freedom111111
t Statistics1.421.081.99
P (T ≤ 1) Two-Tail0.180.310.07
t Critical Two-Tail2.202.202.20
Table 5. Forecasted seed yield increments for 2020–2039 under climatic scenarios RCP4.5 and RCP8.5 for three common bean cultivars under sowing densities of 145,000 (3R) and 260,000 (6R) plants ha−1 compared to a baseline sowing density of 90,000 plants ha−1 under rainfed conditions in the semi-arid temperate highlands of Pabellon de Arteaga and Sandovales in Aguascalientes, Mexico.
Crop Cultivar
SiteClimatic ScenarioSowing DensityFlor de Mayo Bajio Pinto Saltillo Azufrado 2 ¥
Seed Yield Increments (%)
Pabellon de Arteaga
RCP4.53R1112
6R11364
RCP8.53R280
6R21563
Sandovales
RCP4.53R2100
6R11660
RCP8.53R490
6R41661
‡ Growth habit III. ¥ Growth habit I.

