Identifying Ways to Narrow Maize Yield Gaps Based on Plant Density Experiments
by
 ,
,
Jian Li
1,†, 
Man Wu
1,†,
Keru Wang
2,
Bo Ming
2,
Xiao Chang
1,
Xiaobo Wang
1,
Zhaosheng Yang
1,
Ruizhi Xie
2,* and
Shaokun Li
2,* 1
Institute of Cotton Research, Chinese Academy of Agricultural Sciences/State Key Laboratory of Cotton Biology, Anyang 455000, China
2
Institute of Crop Sciences, Chinese Academy of Agricultural Sciences/Key Laboratory of Crop Physiology and Ecology, Ministry of Agriculture, Beijing 100081, China
*
Authors to whom correspondence should be addressed.
†
Contributed equally to this work.
Agronomy 2020, 10(2), 281; https://doi.org/10.3390/agronomy10020281
Submission received: 29 January 2020
/
Revised: 6 February 2020
/
Accepted: 13 February 2020
/
Published: 16 February 2020
Abstract
:Exploring the maximum grain yields (GYs) and GY gaps in maize (Zea mays L.) can be beneficial for farmer to identify the GY-limiting factors and take adaptive management practices for a higher GY. The objective of this work was to identify the optimum maize plant density range and the ways to narrow maize GY gaps based on the variation of the GYs, dry matter (DM) accumulation and remobilization with changes in plant density. Field experiments were performed at the 71 Group and Qitai Farm in Xinjiang, China. Two modern cultivars, ZhengDan958 and ZhongDan909, were planted at 12 densities, ranging from 1.5 to 18 plants m−2. With increased plant density, single plant DM decreased exponentially, whereas population-level DM at the pre- (DMBS) and post- (DMAS) silking stages increased, and the amount of DM remobilization (ARDM) increased exponentially. Further analysis showed that plants were divided four density ranges: range I (<6.97 plants m−2), in which no DM remobilization occurred, DMBS and DMAS correlated significantly with GY; range II (6.97–9.54 plants m−2), in which the correlations of DMBS, DMAS, and ARDM with GY were significant; range III (9.54–10.67 plants m−2), in which GY and DMAS were not affected by density, DMBS increased significantly, and only the correlation of DMAS with GY was significant; and range IV (>10.67 plants m−2), in which the correlations of DMBS and ARDM with GY decreased significantly, while that of DMAS increased significantly. Therefore, ranges I and II were considered to be DM-dependent ranges, and a higher GY could be obtained by increasing the population-level DMAS, DMAS, and ARDM. Range III was considered the GY-stable range, increasing population-level DMBS, as well as preventing the loss of harvest index were the best way to enhance maize production. Range IV was interpreted as the GY-loss range, and a higher GY could be obtained by preventing the loss of HI and population-level DMAS.
1. Introduction
A significant grain yield (GY) gap between the potential and actual farm GY was reported by many researchers in maize (Zea mays L.) [1,2]. Narrowing the GY gap was one ways of increasing maize GY, and it can be narrowed by taking adaptive cultivation practices, such as fertilizer application, maize varieties, irrigation, sowing time, sowing density, and row and plant spacing [3,4]. The improved actual farm GYs by those cultivation practices were mainly attributed to an increasing maize dry matter (DM) accumulation or remobilization to the ear during maize growth stage [5,6].
In maize cultivation, plant density has the most significant influence on DM accumulation and partitioning, as well as on GY gaps [5,6,7,8]. A higher plant density increases the interception of photosynthetically active radiation by the canopy [9], thereby promoting population-level DM accumulation, especially for early varieties [10,11]. The relationship between population-level DM accumulation and maize plant density is linear within a certain range [12,13]. In addition, the higher accumulation rate of DM at the pre-silking stage results in greater allocation of assimilates in reproductive sinks, benefiting differentiated spikelets [10,14,15]. However, once the plant density of maize varieties exceeds a certain level, the interception of photosynthetically active radiation by the canopy increases, while the efficiency of the conversion of the intercepted photosynthetically active radiation to DM (or GY) decreases [16,17]. Consequently, the supply of photosynthetic products will be insufficient, resulting in kernel abortion [18,19]. Although higher plant density promotes the allocation of photosynthetic products to the kernels, the GY will be low (<20%), attributable to the low levels of assimilates available before the silking stage [5,6]. These analyses suggested that the amount of DM (from the pre-silking stage) transferred to GY does not compensate for yield reduction, nor does increasing plant density compensate for reductions in single-plant DM accumulation or single-plant GY. The response of the population-level GY is usually parabolic with increasing plant population density, while the highest population-level GY is obtained only within a narrow range of plant population density, as well as the GY gaps still exist among different plant densities [8,20]. DM accumulation and partitioning are the basis of maize grain productivity [6,7]; thus, studying variations in GY, DM accumulation, and partitioning with changes in plant density can help identify the optimum maize plant density and ways to take adaptive management practices for narrowing maize GY gaps.
Many methods for determining suitable maize plant densities have been studied. Some of these showed that the optimum plant population density can be evaluated using the relationship between population-level GY and plant population density because the population-level GY responds to the plant population density in a parabolic fashion; the suitable plant population density was obtained at the highest population-level GY [21,22]. Other studies confirmed that the optimum plant density can be evaluated based on Beer’s law equation and the optimum light interception (95% of light interception) [12,23]. Moreover, there are still some studies showed that the optimum plant density can be evaluated using maize growth models, such as the Crop-Environment Resource Synthesis (CERES) Maize model [24,25,26]. Unfortunately, although there are many reported methods for calculating the optimum plant density, it is difficult to obtain the ideal value for field maize production. One reason is that the optimum plant density varies with environmental factors and cultural practices, such as agro-ecological conditions, management systems, labor, and cash availability [27,28], and the most important factor is having the optimum plant density within an appropriate range [29]. Although previous studies have examined the variation in maize GY, DM accumulation, and partitioning with changes in plant density and described the relationship among them [6,7,8,9,10], it is still necessary to obtain detailed information on their relationships at different plant density ranges, and to identify ways to narrow maize yield gaps. Therefore, to find out the optimum plant density range of modern maize hybrid, and identify ways to narrow maize yield gaps, two field density experiments were conducted. The aims of this study were to: (I) investigate the variability in maize GY, DM accumulation, and DM remobilization at different plant densities; (II) analyze the relationships among maize GY, DM accumulation, DM remobilization, and plant density; (III) identify maize DM-dependent, GY-stable, and GY lose ranges by analyzing the relationships in (II); and (IV) identify the GY-limiting factors and ways to narrow maize yield gaps. The methods from this study could help the farmer to find the optimum plant density for a new hybrid maize, and take an effective way to management the maize for a higher GY.
2. Materials and Methods
Field experiments were conducted as described in [27]. Two field-density experiments were conducted at two typical high-yield sites in 2010, 2011, and 2012: one at 71 Group (43°30′ N, 83°13′ E), Xinjiang, Northwest China, and the other at Qitai Farm (43°50′ N, 89°46′ E), Xinjiang, Northwest China. The soil at the two sites was calcareous soil; the soil chemical properties at the start of the experiment are described in Table 1. The field experiments were conducted using a split-plot design with three replicates, with the plant density treatments in the main plots and the maize hybrids in the subplots. Based on our team’s results in previous studies of the changes in maize hybrids, plant density, and GY at Ningxia University Farm, Bole, 71 Group, and Qitai Farm in northwestern China, 12 stand densities (range 1.5 to 18.0 plants m−2, density gradient 1.5 plants m−2) and two maize hybrids (ZhengDan958 and ZhongDan909) were chosen. Information on the hybrids was given in Table 2; both were the dominant hybrids grown in China at the time of their release [22].
The plots were 10 m long and 6 m wide and contained 10 maize rows. Based on the chemical profile of the soil and a maximum expected yield of 18 Mg ha−1 [30], the plots were treated with 75 kg ha−1 potassium sulfate, 75 kg ha−1 urea, and 150 kg ha−1 super phosphate before maize sowing; on an additional 800–850 kg ha−1, urea was applied four or five times (150–200 kg ha−1 urea each time). The maize irrigation intervals and duration were in accordance with local field management practices. Irrigation was applied 8–10 times using drip irrigation during the growing stage (600–650 m3 ha−1 each time). To prevent late lodging and harden the seedlings, no irrigation or urea was provided 150 days after sowing. At each experimental site, the crops were kept free from pests, weeds, and diseases using standard approved pesticides. Further information can be found in [23,27].
At the silking and mature stages, five plants in the center row of each subplot were continuously selected. The different plant pa rts were separated (i.e., stem, leaves, husks, and grain). The DM samples were dried to a constant weight at 75 °C and weighed.
The amount of DM accumulation pre-silking (DMBS) was measured at 2 days after the silking stage.
The amount of DM accumulation post-silking (DMAS) and DM remobilization (ARDM) were calculated as described in Equations (1) and (2):
At the physiological maturity stage, a 10 m2 area (the four center rows) in each plot was harvested manually and the grain mass was measured, the total numbers of plants and ears were counted, and the harvest plant density was determined. Twenty representative ears were chosen from the ears harvested in each plot and the grain mass per ear was counted for each ear, grain moisture content measured with a portable moisture meter (PM8188; Kett Electric Laboratory, Tokyo, Japan), and grain weight was determined at a 14% moisture content.
The differences according to the date were compared using one-way analysis of variance (ANOVA) at a 0.05 level of probability, followed by Duncan’s test and the t-test. Correlations between the GY, DM accumulation, DM remobilization, and plant density were simulated using linear, logarithmic, and quadratic models, and the power model with the highest significant Pearson’s correlation coefficient was chosen as having a better fit. All statistical analyses were performed using statistics analysis system (SAS) statistical software (ver. 9.0; SAS Institute, Cary, NC, USA).
3. Results
3.1. Single-Plant DM Accumulation
Plant density significantly affected single-plant DM. At the pre-silking stage, the single-plant DMBS decreased as the plant density increased, and the relationship between them fit a linear equation (Figure 1A). The same trend was found at the post-silking stage (Figure 1B); the single-plant DMBS also decreased as the plant density increased, and the relationship between the two variables could be described with a logarithmic equation. The above results show that a higher plant density had a poor effect on the single-plant DMBS. The DMBS/DMAS increased significantly with plant density, and the relationship between the two variables could be described by an exponential equation (Figure 1C). Analysis of the variation of single-plant DMBS and DMAS in different maize growing conditions showed that only hybrids and plant density influenced single-plant DMBS and DMAS significantly (Table 3).
3.2. Population-Level DM Accumulation
Plant density significantly affected population-level DM. The variation of population-level DM with increasing of plant density was opposite to that of single-level DM accumulation per plant. At the pre-silking stage, the population-level increased as the plant density increased, and the relationship between the two variables fit a linear equation (Figure 2A). At the post-silking stage, the population-level DMBS increased quadratically as the plant density increased, and the highest population-level DMAS (16.84 t ha−1) was obtained at a plant density of 9.54 plants m−2, a point referred to as point “O” (Figure 2B). Analysis of the variation of population-level DMBS and DMAS in different maize growing conditions showed that only hybrids and plant density influenced population-level DMBS and DMAS significantly (p < 0.01) (Table 3).
3.3. The Remobilization of DM
Plant density significantly affected the remobilization of DM. At the single-plant level, ARDM increased as the plant density increased, and the relationship between the two variables fit a logarithmic equation (Figure 3A). The same trend was found at the population-level (Figure 1B), ARDM also increased as the plant density increased, and the relationship between the two variables could be described with a quadratic equation (Figure 3B). Further analysis showed that DM remobilization occurred at a plant density >6.97 plants m−2, but at a plant density <6.97 plants m−2 ARDM was <0, which means that there was no DM remobilization. Analysis of the variation of population-level DMBS and DMAS in different maize growing conditions showed that only plant density influenced population-level ARDM and single plant ARDM significantly (Table 3).
3.4. The Grain Yield and Its Composition
Plant density significantly affected the GY and its composition (Table 4). At the single plant level, GY decreased as the plant density increased, and the relationship between the two variables fit a logarithmic equation [27]. At the population-level, GY increased quadratically as the plant density increased. Further analysis showed that highest population-level GY occurred at a plant density of 10.57 plants m−2 [27]. Harvest index (HI) decreased as the plant density increased, and the relationship between the two variables fit a cubic-curve equation [27]. Grain number and 1000-grain weight decreased linearly as the plant density increased. Analysis of the variation of single and population-level GY in different maize growing conditions showed that only plant density and hybrids influenced single and population-level GY significantly (p < 0.01) (Table 3).
3.5. Division of Plant Density Ranges
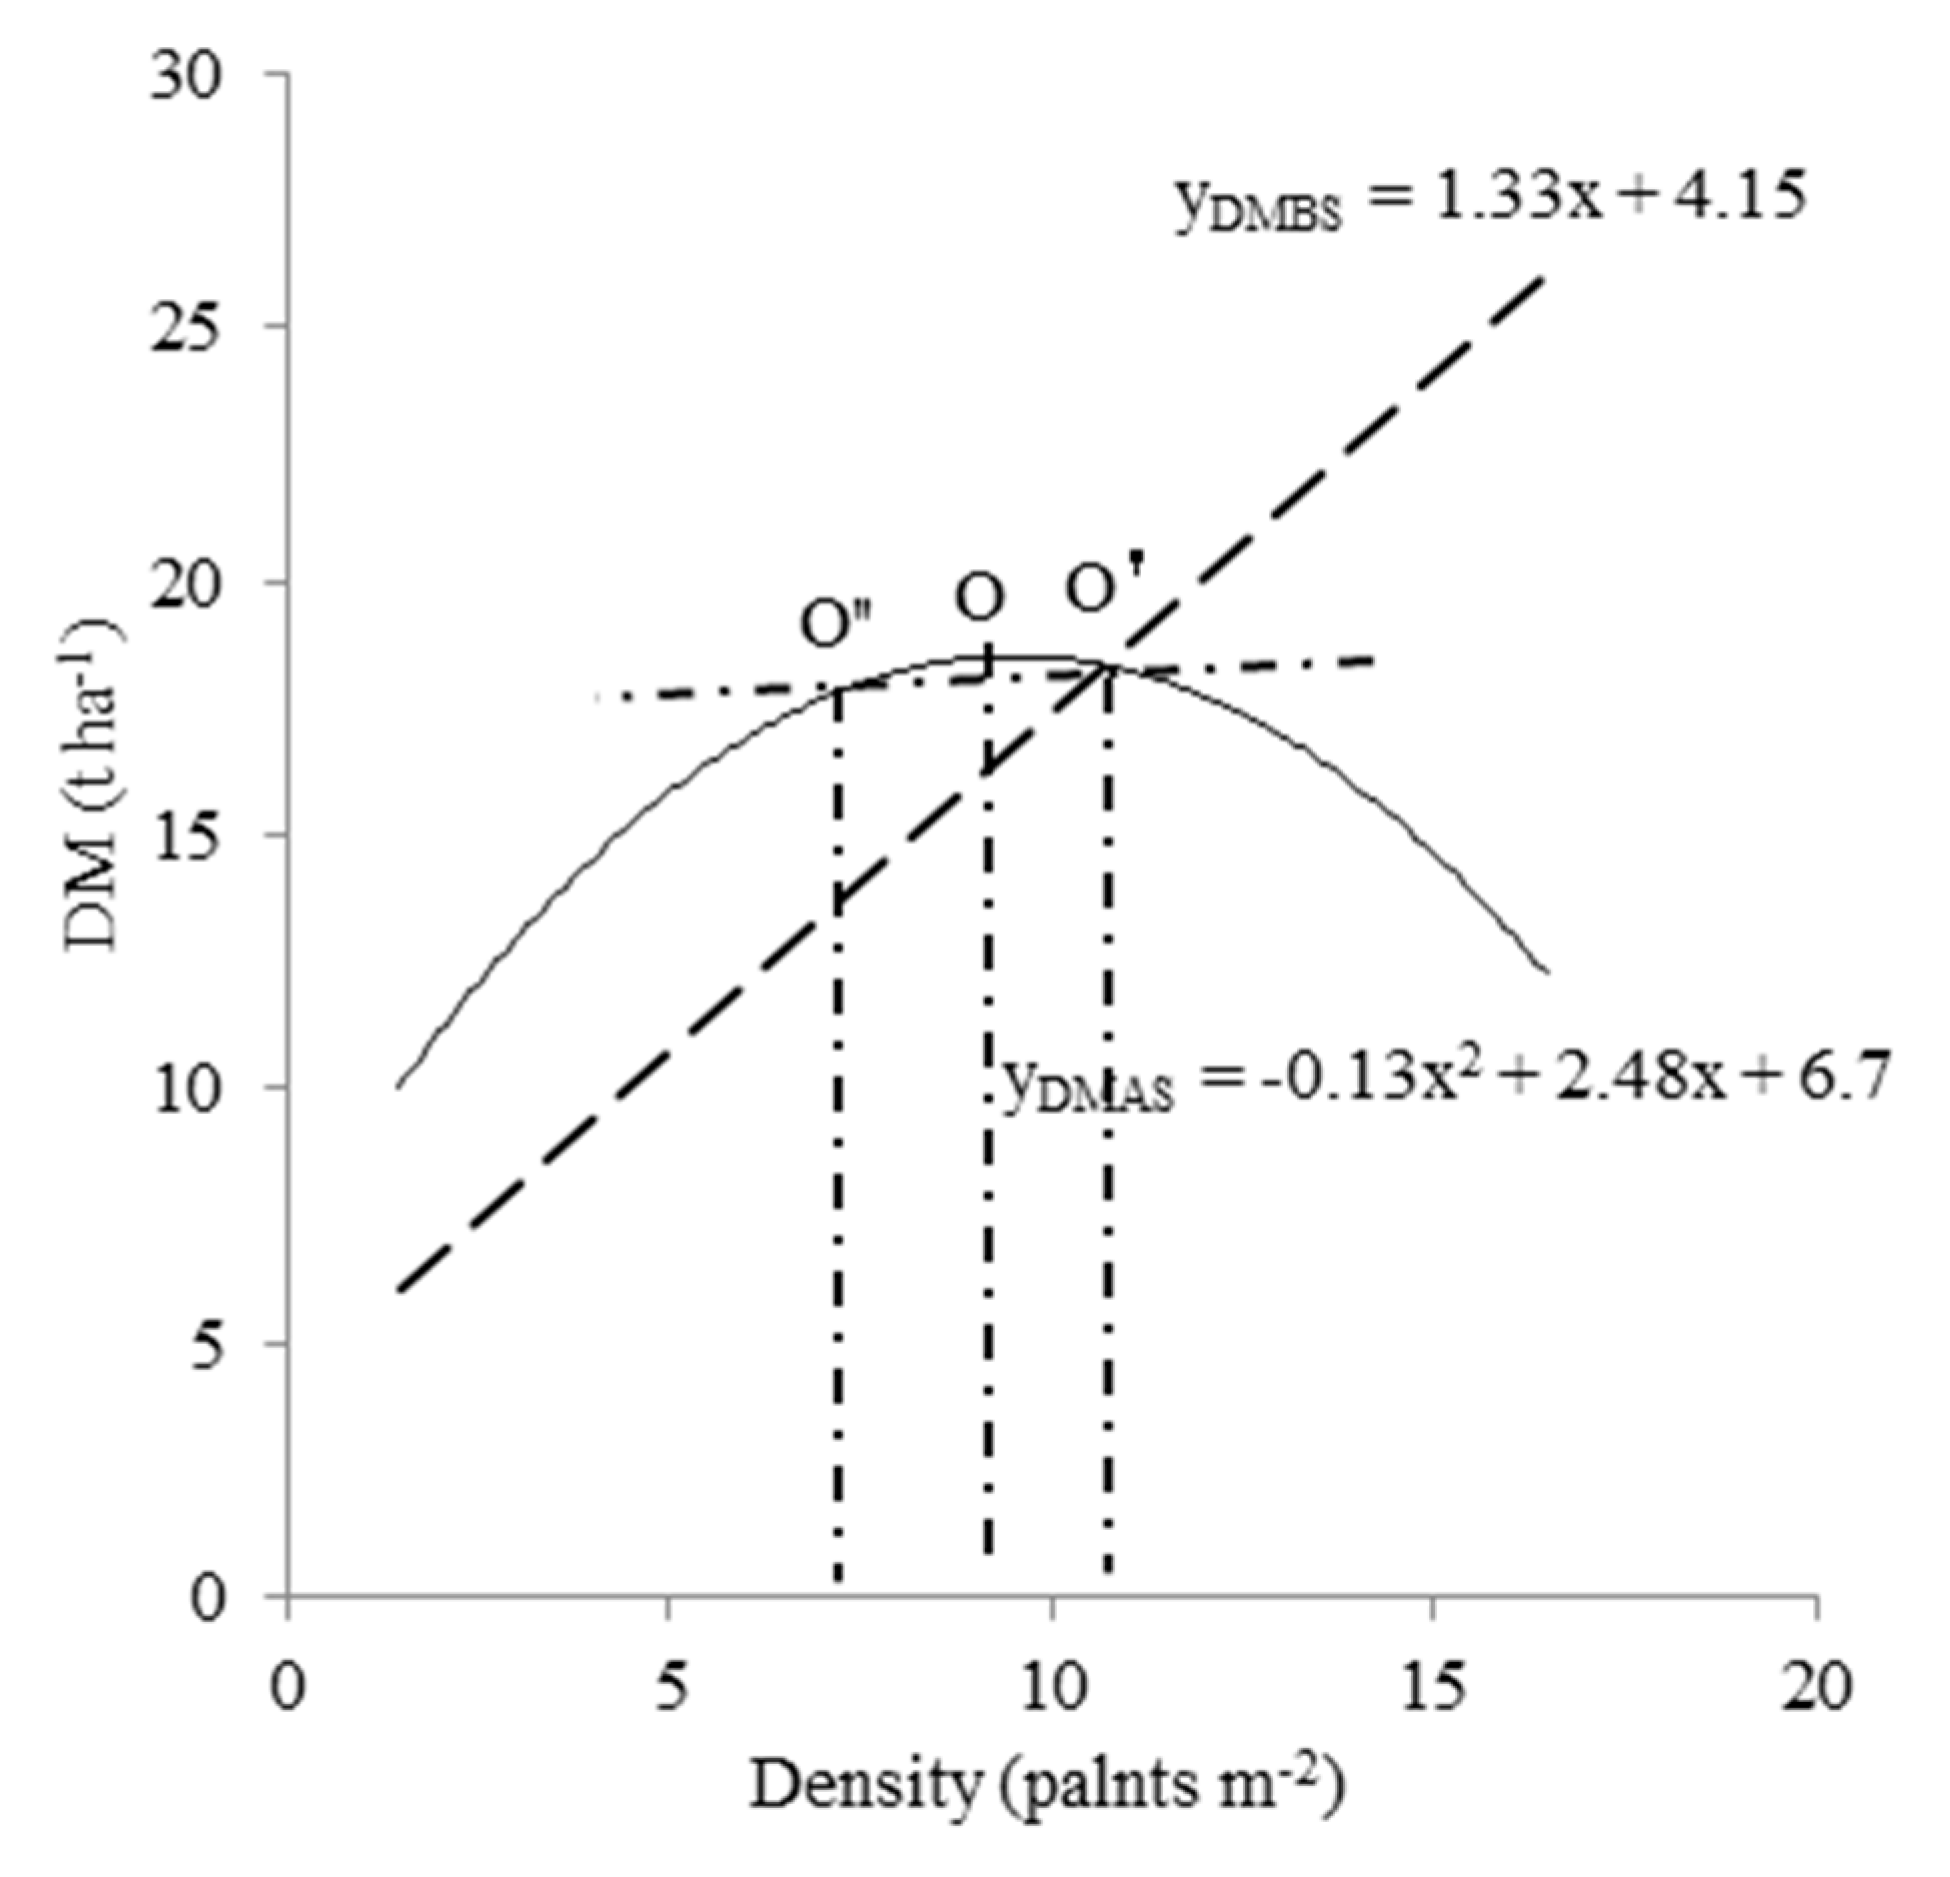
Further analysis of the relationships between population-level DMBS (Figure 2A), population-level DMAS (Figure 2B) and plant density showed that the respective regression equations converged at a point designated as O’ (Figure 4). At this point, population-level DMBS was equal to population-level DMAS, occurred at a plant density of 10.67 plants m−2, and the population-level DM was 18.36 T ha−1. Accordingly, at a plant density <10.67 plants m−2, population-level DMBS was lower than population-level DMAS. At a plant density >10.67 plants m−2, population-level DMBS was higher than population-level DMAS. The relationship between population-level DMAS and plant density in this study was best described by a quadratic equation, with the highest DMAS per area occurred at 9.54 plants m−2 (Figure 2B), such that the plant density at O was lower than that at O’ (Figure 4). Therefore, at a population-level DMAS of 18.36 t ha−1, the corresponding densities occurred at 8.4 (point O’’) and 10.67 plants m−2 (point O’). This result implies that a plant density between 8.4 and 10.67 plants m−2 is an important range for population-level DM. Taking the single plant ARDM into account (DM remobilization occurred at a plant density >6.97 plants m−2) (Figure 3A), we then divided the plant density into four ranges: <6.97, 6.97–8.4, 8.4–10.67, and >10.67 plants m−2. Because population-level GY increased quadratically as the plant density increased, and highest population-level GY occurred at a plant density of 10.57 plants m−2 (Table 4), four plant density ranges can be also considered as four different population-level GY ranges.
3.6. The Response of Popolation-Level DMBS, DMAS, ARDM, GY, and HI at Four Different GY Ranges
According to the variation of the population level DMBS, population level DMAS and single plant ARDM with changes in plant density, four different GY level ranges were divided (Table 5 and Table 6):
In range I (<6.97 plants m−2), population-level GY, DMBS, DMAS, and DMM correlated significantly with changing in plant density, but there was no population level ARDM in this density range, and HI decreased as the plant density increased significantly. Analysis of the relationships between these indexes and the population-level GY showed that population-level DMBS, DMAS, and DMM correlated significantly with population-level GY, except for HI. Therefore, this range can be considered as population level DM independent range.
In range II (6.97–8.4 plants m−2), population-level GY, DMBS, DMAS, ARDM, and DMM correlated significantly with changing in plant density, but the HI was stable in this density range. Analysis of the relationships between these indexes and the population-level GY showed that population-level DMBS, DMAS, ARDM and DMM correlated significantly with population-level GY, except for HI. Therefore, this range can also be considered as population level DM independent range.
In range III (8.4–10.67 plants m−2), with increasing plant density, population level GY and DMAS were stable, but population level DMBS, ARDM, and DMM increased significantly. An analysis of the relationships between these indices and the population-level GY showed that only population-level DMAS and DMM correlated significantly with population-level GY. Therefore, this range can be considered as population level GY stable range.
In range IV (>10.67 plants m−2), with increasing plant density, population level DMM was stable, population-level GY, DMAS and HI decreased significantly, but population-level ARDM increased significantly. An analysis of the relationships between these indexes and the population-level GY showed that population-level DMAS and HI correlated significantly with population-level GY, but DMBS and ARDM decreased significantly. Therefore, this range can be considered as population level GY-loss range.
4. Discussion
4.1. The Variation of the GY, DM Accumulation, and Partitioning with Changes in Plant Density
Due to improved tolerance to high plant populations and low yield potential per plant, modern maize hybrids are generally regarded as strongly population-dependent [16,31], and the maximum population-level GYs are achieved primarily in high plant density populations [19,22], especially in the super-high maize yield areas [8,29]. Echarte et al. [5] showed that a higher plant density reduces the time to canopy closure. Tollenaar et al. [7] showed that a higher plant density increases the interception of seasonal incident radiation and net photosynthesis, and improves the availability of assimilates for DM accumulation. Similar findings were obtained by Westgate et al. [10] and Toler et al. [11]. Results from Tollenaar et al. [31] and Echarte et al. [32] showed that the HI of maize varieties has remained at around 50% over the past 70 years, with differences in HI seen only for hybrids grown under relatively stress conditions [33,34]. Result of this study showed that population-level DMAS, DMBS, ARDM, and GY increased with increasing planting density, while HI decreased. Those results were consistent with previously published studies [5,6,7,8], but the response of the variation characteristics to plant densities can be described by a logarithmic equation or a quadratic equation, which were not coincide with that of previous studies [10,13]. Those differences may be associated with the larger plant density range and the smaller density gradients, which added new more accurate regression equation effect in this paper.
4.2. Methods for Determining Suitable Maize Plant Densities
Although maximum GYs are achieved primarily in high-density populations, high density is not always beneficial for GY, DM accumulation, and remobilization. Result from Borrás et al. [6] showed that higher plant density accelerates the rate of leaf senescence, reducing post-silking net photosynthesis and the availability of assimilates for kernel growth, especially at supra-optimal densities. Li et al. [22] and Sangoi et al. [8] showed that the response of the population-level GY was parabolic with increasing plant population density, while the highest population-level GY was obtained only within a narrow range of plant population density. Therefore, identifying the optimum maize plant density is the best way for maize hybrids reaching maximum GY.
DM accumulation and remobilization are the basis of maize grain production [35]. Previous studies showed that population-level DMAS is crucial for the formation of GY [16,36], and that a higher population-level DMAS improves both assimilate availability for kernel growth and population-level GY [19]. Thus, the point at which population-level DMBS = population-level DMAS was used for identifying the optimum maize plant density in current study. According to the current findings, an equilibrium was obtained at a planting density of 10.67 plants m−2. Considering the relationship between population-level DMAS and plant density follows a quadratic equation, plant density range from 8.4 to 10.67 plants m−2 can be seen as an optimum population-level DMBS range. Further analysis of the variation of the GY, DM accumulation, and partitioning with changes in plant density within this range (range III), and the result showed that population-level DMBS, ARDM, and DMM increased significantly with changing in plant density, but population level GY and DMAS were stable, which may be related to decreasing of HI significantly. Therefore, this plant density range can be also seen as an optimum maize plant density range, and it was similar with our former research based on the variation of the population-level GY, DMM, and HI with changes in plant densities (an optimum maize plant density range from 8.3 to 10.75 plants m−2 was calculated [27]). From the above analysis, it can be inferred that the current study was a further study based on our previous research, and the optimum maize plant densities can be also identified by analysis of the variation of the GY, DM accumulation, and partitioning with changes in plant density.
4.3. Ways of Narrowing Maize Yield Gaps at Different GY Ranges
The studies about high-yield formation and cultivation for improving maize yield have been carried out by many countries and organizations in the world [15,16,17,18,19,20,21,22], and the focus of those discussions were mainly on two aspects: one was how to improve potential maize GY [28,29,30], another was how to narrow the gap between potential maize GY and farmers’ actual GY [1,2,3,4,5,6,7,8,9]. Among which, in terms ways of improving maize GY potential and narrowing the GY gaps were reported. For example, new maize hybrids with high stress tolerance (density tolerance, disease, and insect resistance) were bred [6,17,28]. High-yield cultivation techniques (advanced chemical control, scientific water management) were adopted [37,38,39,40], and a number of high-yield records were created one after another [41,42]. However, the GY of potential in the world was generally four times higher than that of farmers [43], and the difference GYs were founded in different regions, as well as the same region [22,41]. Thus, narrowing the GY gaps was still one of the important ways to improve the maize GY and maize production efficiency.
Increasing plant density is one of ways to increase the grain yield of modern maize hybrids [11,22,35], but too high plant density is badly for GY, DM accumulation, and remobilization [20,29,44]. Different population-level GY can be created by planting different densities. In order to identify ways to enhance maize production at different GY ranges, the variation of the DM accumulation and partitioning with changes in plant density and GY at different GY ranges were analyzed.
Within the range I, there was no increase in the population-level ARDM. A significant increase in population-level DMM was related to increases in population-level DMBS and DMAS. The decrease in HI can be compensated by increasing population-level DMM, and which were consistent with our previous study [27]. The significant increase in population-level GY was related to increasing in population-level DMM, especially in population-level DMAS and DMAS. Therefore, increasing population-level DMBS and DMAS were the best way for improving population-level GY in this range.
Within range II, HI was stable with increasing plant density. A significant increase in population-level DMM was related to increases in population-level DMBS, DMAS, and ARDM. The significant increase in population-level GY was related to increasing in population-level DMM (population-level DMAS and DMAS) and ARDM. Therefore, increasing population-level DMAS, DMAS, and ARDM were the best way for improving population-level GY in this range.
Within range III, there was no increase in the population-level GY and DMAS, A significant increase in population-level DMM was related to increases in population-level DMBS. Population level GY was stable with increasing plant density may be related to decreasing of HI significantly. A significant increase in population-level GY was related to increases in population-level DMAS and DMM. Therefore, increasing population-level DMBS and preventing the loss of HI were the best way for improving population-level GY in this range.
Within range IV, population-level DMM was stable with increasing plant density, and it may be related to increases in population-level DMBS and decreases in DMAS. The decrease in HI was not compensated by increasing population-level ARDM, and that may be the reason why population-level GY was decreasing significantly with increasing plant density. A significant increase in population-level GY was related to increases in population-level DMAS and HI. Therefore, keeping population-level DMBS and ARDM at a certain level and preventing the loss of HI and population-level DMAS were the best way for improving population-level GY in this range.
It can be seen from the above analysis that the GY gap between two diffident ranges was obtained, and which was mainly caused by different maize GY-limiting factors. Therefore, narrowing different GY gaps should be taken different management practices.
In the current paper, all data were obtained under conditions optimal for the growth and development of the maize hybrids ZhengDan958 and Zhongdan909, both of which are widely grown in China, and the results from this study could benefit a better understanding of the relationships among GY, DM accumulation, DM remobilization, and plant density, and those relationships are essential for determining optimal plant density and identifying the ways of maximizing the northwest spring maize yield in China.
5. Conclusions
Plant density significantly affected DM accumulation and remobilization. With changing in plant densities, the single plant DM accumulation decreased, except for ARDM, while at the population-level, DMBS increased linearly, DMBS, and ARDM increased quadratically. Further analysis the relationships between DM accumulation and remobilization and plant density showed that plant density could be divided into four ranges: range I (<6.97 plants m−2) and range II (6.97–8.4 plants m−2) were considered to be DM-dependent ranges, and a higher GY could be obtained by increasing the population-level DMAS, DMAS, and ARDM. Range III (8.4–10.67 plants m−2) was considered the GY-stable range, and increasing population-level DMBS and preventing the loss of HI were the best way to enhance maize production. Range IV (>10.67 plants m−2) was interpreted as the GY-loss range, and a higher GY could be obtained by preventing the loss of HI and population-level DMAS. The methods from this study could help the farmer to find the optimum plant density for a new hybrid maize, and take an effective way to management the maize for a higher GY.
Author Contributions
R.X. and S.L. conceived and designed the experiment; J.L., M.W., X.W., X.C. and Z.Y. performed the experiments; J.L., M.W. and B.M. analyzed the data; K.W., R.X. and S.L. supervised the research; J.L. and M.W. wrote the paper; and R.X. and S.L. revised the final draft manuscript. All authors have read and agreed to the published version of the manuscript.
Funding
This research was funded by the National Key Research and Development Program of China, project number 2017YFD0300302; the China Agriculture Research System, project number CARS-02; and Fundamental Research Funds for the Central Research Institutes, project number 1610162019050906.
Acknowledgments
We are grateful for the support from the National Key Research and Development Program of China, China Agriculture Research System, and the Fundamental Research Funds for the Central Research Institutes for financial support.
Conflicts of Interest
The authors declare no conflict of interest.
References
- Wang, J.; Wang, E.; Yin, H.; Feng, L.P.; Zhang, J.P. Declining yield potential and shrinking yield gaps of maize in the North China Plain. Agric. For. Meteorol. 2014, 195, 89–101. [Google Scholar] [CrossRef]
- Zhao, Y.; Chen, X.P.; Cui, Z.L.; Lobell, D.B. Using satellite remote sensing to understand maize yield gaps in the North China Plain. Field Crops Res. 2015, 183, 31–42. [Google Scholar] [CrossRef]
- Sileshi, G.; Akinnifesi, F.K.; Debusho, L.K.; Beedy, T.; Ajayi, O.C.; Mong, O.S. Variation in maize yield gaps with plant nutrient inputs, soil type and climate across sub-Saharan Africa. Field Crops Res. 2010, 116, 1–13. [Google Scholar] [CrossRef]
- Pasuquin, J.M.; Pampolino, M.F.; Witt, C.; Dobermann, A.; Oberthur, T.; Fisher, M.J.; Inubushi, K. Closing yield gaps in maize production in Southeast Asia through site-specific nutrient management. Field Crops Res. 2014, 156, 219–230. [Google Scholar] [CrossRef]
- Echarte, L.; Luque, S.; Andrade, F.H.; Sandras, V.O.; Cirilo, A.; Otegui, M.E.; Vega, C.R.C. Response of maize kernel number to plant population in Argentinean hybrids released between 1965 and 1993. Field Crops Res. 2000, 68, 1–8. [Google Scholar] [CrossRef]
- Borrás, L.; Maddonni, G.A.; Otegui, M.E. Leaf senescence in maize hybrids: Plant population, row spacing and kernel set effects. Field Crops Res. 2003, 82, 13–26. [Google Scholar] [CrossRef]
- Tollenaar, M.; Wu, J. Yield improvement in temperate maize is attributable to greater stress tolerance. Crop Sci. 1999, 39, 1597–1604. [Google Scholar] [CrossRef]
- Sangoi, L.; Gracietti, M.A.; Rampazzo, C.; Bianchetti, P. Response of Brazilian maize hybrids from different ears to changes in plant density. Field Crops Res. 2002, 79, 39–51. [Google Scholar] [CrossRef]
- Major, D.J.; Beasley, B.W.; Hamilton, R.I. Effect of maize maturity on radiation-use efficiency. Agron. J. 1991, 83, 895–903. [Google Scholar] [CrossRef]
- Westgate, M.E.; Forcella, F.; Reicosky, D.C.; Somsen, J. Rapid canopy closure for maize production in the northern US corn belt: Radiation-use efficiency and grain yield. Field Crops Res. 1997, 49, 249–258. [Google Scholar] [CrossRef]
- Toler, J.E.; Murdock, E.C.; Stapleton, G.S.; Wallace, S.U. Corn leaf orientation effects on light interception, intraspecific competition, and grain yields. J. Prod. Agric. 1999, 12, 396–399. [Google Scholar] [CrossRef]
- Watiki, J.M.; Fukai, S.; Banda, J.A.; Keating, B.A. Radiation interception and growth of maize/cowpea intercrop as affected by maize plant density and cowpea cultivar. Field Crops Res. 1993, 35, 123–133. [Google Scholar] [CrossRef]
- Maddonni, G.A.; Otegui, M.E.; Cirilo, A.G. Plant population density, row spacing and hybrid effects on maize canopy architecture and light attenuation. Field Crops Res. 2001, 71, 183–193. [Google Scholar] [CrossRef]
- Andrade, F.H.; Uhart, S.A.; Arguissain, G.G.; Ruiz, R.A. Radiation use efficiency of maize growing in a cool area. Field Crops Res. 1992, 28, 345–354. [Google Scholar] [CrossRef]
- Edwards, J.T.; Purcell, L.C.; Vories, E.D. Light interception and yield potential of short-season maize hybrids in the midsouth. Agron. J. 2005, 97, 225–234. [Google Scholar]
- Tollenaar, M.; Bruulsema, T.W. Efficiency of maize dry matter production during periods of complete leaf area expansion. Agron. J. 1988, 80, 580–585. [Google Scholar] [CrossRef]
- Flenet, F.; Kiniry, J.R.; Board, J.E.; Westgate, M.E.; Reicosky, D.C. Row spacing effects on light extinction coefficients of corn, sorghum, soybean, and sunflower. Agron. J. 1996, 88, 185–190. [Google Scholar] [CrossRef]
- Hashemi-Dezfouli, A.; Herbert, S.J. Intensifying plant-density response of corn with artificial shade. Agron. J. 1992, 84, 547–551. [Google Scholar] [CrossRef]
- Cusicanqui, J.A.; Lauer, J.G. Plant density and hybrid influence on corn forage yield and quality. Agron. J. 1999, 91, 911–915. [Google Scholar] [CrossRef] [Green Version]
- Troyer, A.F. Breeding widely adapted, popular maize hybrids. Euphytica 1996, 92, 163–174. [Google Scholar] [CrossRef]
- Tokatlidis, I.S.; Koutroubas, S.D. A review of maize hybrids’ dependence on high plant populations and its implications for crop yield stability. Field Crops Res. 2004, 88, 103–114. [Google Scholar] [CrossRef]
- Li, J.; Xie, R.Z.; Wang, K.R.; Hou, P.; Ming, B.; Guo, Y.Q.; Sun, Y.L.; Zhang, G.Q.; Zhao, R.L.; Li, S.K. Changes in plant-to-plant variability among maize individuals and their relationships with plant density and grain yield. Philipp. Agric. Sci. 2015, 98, 89–97. [Google Scholar]
- Li, J.; Xie, R.Z.; Wang, K.R.; Hou, P.; Ming, B.; Zhang, G.Q.; Liu, G.Z.; Wu, M.; Yang, Z.S.; Li, S.K. Response of canopy structure, light interception and grain yield to plant density in maize. J. Agric. Sci. 2018, 156, 785–794. [Google Scholar] [CrossRef]
- Tang, L.; Ma, W.; Noor, M.A.; Li, L.; Hou, H.; Zhang, X.; Zhao, M. Density resistance evaluation of maize varieties through new “Density-Yield Model” and quantification of varietal response to gradual planting density pressure. Sci. Rep. 2018, 8, 172–181. [Google Scholar] [CrossRef]
- Li, T.; Liu, J.L.; Wang, S.J.; Zhang, Y.; Zhan, A.; Li, S.Q. Maize Yield Response to Nitrogen Rate and Plant Density under Film Mulching. Agron. J. 2018, 110, 996–1007. [Google Scholar] [CrossRef] [Green Version]
- Cazanga, R.; Ledent, J.F.; Bennewitz, E. Adaptation of CERES-Maize model for a better simulation of plant population density effects. Field Crops Res. 2019, 238, 27–34. [Google Scholar] [CrossRef]
- Li, J.; Xie, R.Z.; Wang, K.R.; Ming, B.; Guo, Y.Q.; Zhang, G.Q.; Li, S.K. Variations in maize dry matter, harvest index, and grain yield with plant density. Agron. J. 2015, 107, 829–834. [Google Scholar] [CrossRef]
- Monneveux, P.; Zaidi, P.H.; Sanchez, C. Population density and low nitrogen affects yield-associated traits in tropical maize. Crop Sci. 2005, 45, 535–545. [Google Scholar] [CrossRef]
- Luís, S. Understanding plant density effects on maize growth and development: An important issue to maximize grain yield. Ciência Rural 2000, 31, 158–168. [Google Scholar]
- Hou, P.; Gao, Q.; Xie, R.Z.; Li, S.K.; Meng, Q.F.; Kirkby, E.A.; Römheld, V.; Müller, T.; Zhang, F.S.; Cui, Z.L.; et al. Grain yields in relation to N requirement: Optimizing nitrogen management for spring maize grown in China. Field Crops Res. 2012, 129, 1–6. [Google Scholar] [CrossRef]
- Tollenaar, M.; Dibo, A.A.; Aguilara, A.; Weise, S.F.; Swanton, C.J. Effect of crop density on weed interference in maize. Agron. J. 1994, 86, 591–595. [Google Scholar] [CrossRef]
- Echarte, L.; Andrade, F.H. Harvest index stability of Argentinean maize hybrids released between 1965 and 1993. Field Crops Res. 2003, 82, 1–12. [Google Scholar] [CrossRef]
- Tollenaar, M. Is low plant population a stress in maize? Maydica 1992, 37, 305–311. [Google Scholar]
- Vega, C.R.C.; Sadras, V.O.; Andrade, F.H.; Uhart, S.A. Reproductive allometry in soybean, maize and sunflower. Ann. Bot. 2000, 85, 461–468. [Google Scholar] [CrossRef] [Green Version]
- Tollenaar, M. Physiological basis of genetic improvement of maize hybrids in Ontario from 1959 to 1988. Crop Sci. 1991, 31, 119–124. [Google Scholar] [CrossRef]
- Tollenaar, M.; Lee, E.A. Dissection of physiological processes underlying grain yield in maize by examining genetic improvement and heterosis. Maydica 2006, 51, 399–408. [Google Scholar]
- Payero, J.O.; Tarkalson, D.D.; Irmak, S.; Davison, D.; Petersen, J.L. Effect of timing of a deficit-irrigation allocation on corn evapotranspiration, yield, water use efficiency and dry mass. Agric. Water Manag. 2009, 96, 1387–1397. [Google Scholar] [CrossRef] [Green Version]
- Qin, S.J.; Li, S.E.; Kang, S.Z.; Du, T.S.; Tong, L.; Ding, R.S. Can the drip irrigation under film mulch reduce crop evapotranspiration and save water under the sufficient irrigation condition? Agric. Water Manag. 2016, 177, 128–137. [Google Scholar] [CrossRef]
- Rana, G.; Katerji, N. Measurement and estimation of actual evapotranspiration in the field under Mediterranean climate: A review. Eur. J. Agron. 2000, 13, 125–153. [Google Scholar] [CrossRef]
- Rosegrant, M.W.; Ringler, C.; Zhu, T.J. Water for agriculture: Maintaining food security under growing scarcity. Environ. Resour. 2009, 34, 205–222. [Google Scholar] [CrossRef]
- Li, S.K.; Wang, C.T. Analysis on change of production and factors promoting yield increase of corn in China. J. Maize Sci. 2008, 16, 26–30. [Google Scholar]
- Li, S.K.; Wang, C.T. Evolution and development of maize production techniques in China. Sci. Agric. Sin. 2009, 42, 1941–1951. [Google Scholar]
- Li, S.K.; Wang, K.R.; Xie, R.Z.; Hou, P.; Ming, B.; Yang, X.X.; Han, D.S.; Wang, Y.H. Implementing higher population and full mechanization technologies to achieve high yield and high efficiency in maize production. Crops 2016, 4, 1–6. [Google Scholar]
- Ruget, F. Contribution of storage reserves during grain filling of maize in northern European conditions. Maydica 1993, 38, 51–59. [Google Scholar]
Figure 1.
Relationships between per-plant dry matter accumulation at per-silking (DMBS) (A) and post-silking (DMAS) (B) stages, DMBS/DMAS (C) and the densities of hybrids ZhengDan958 and ZhongDan909; n, sample size; ** p < 0.01.
Figure 1.
Relationships between per-plant dry matter accumulation at per-silking (DMBS) (A) and post-silking (DMAS) (B) stages, DMBS/DMAS (C) and the densities of hybrids ZhengDan958 and ZhongDan909; n, sample size; ** p < 0.01.
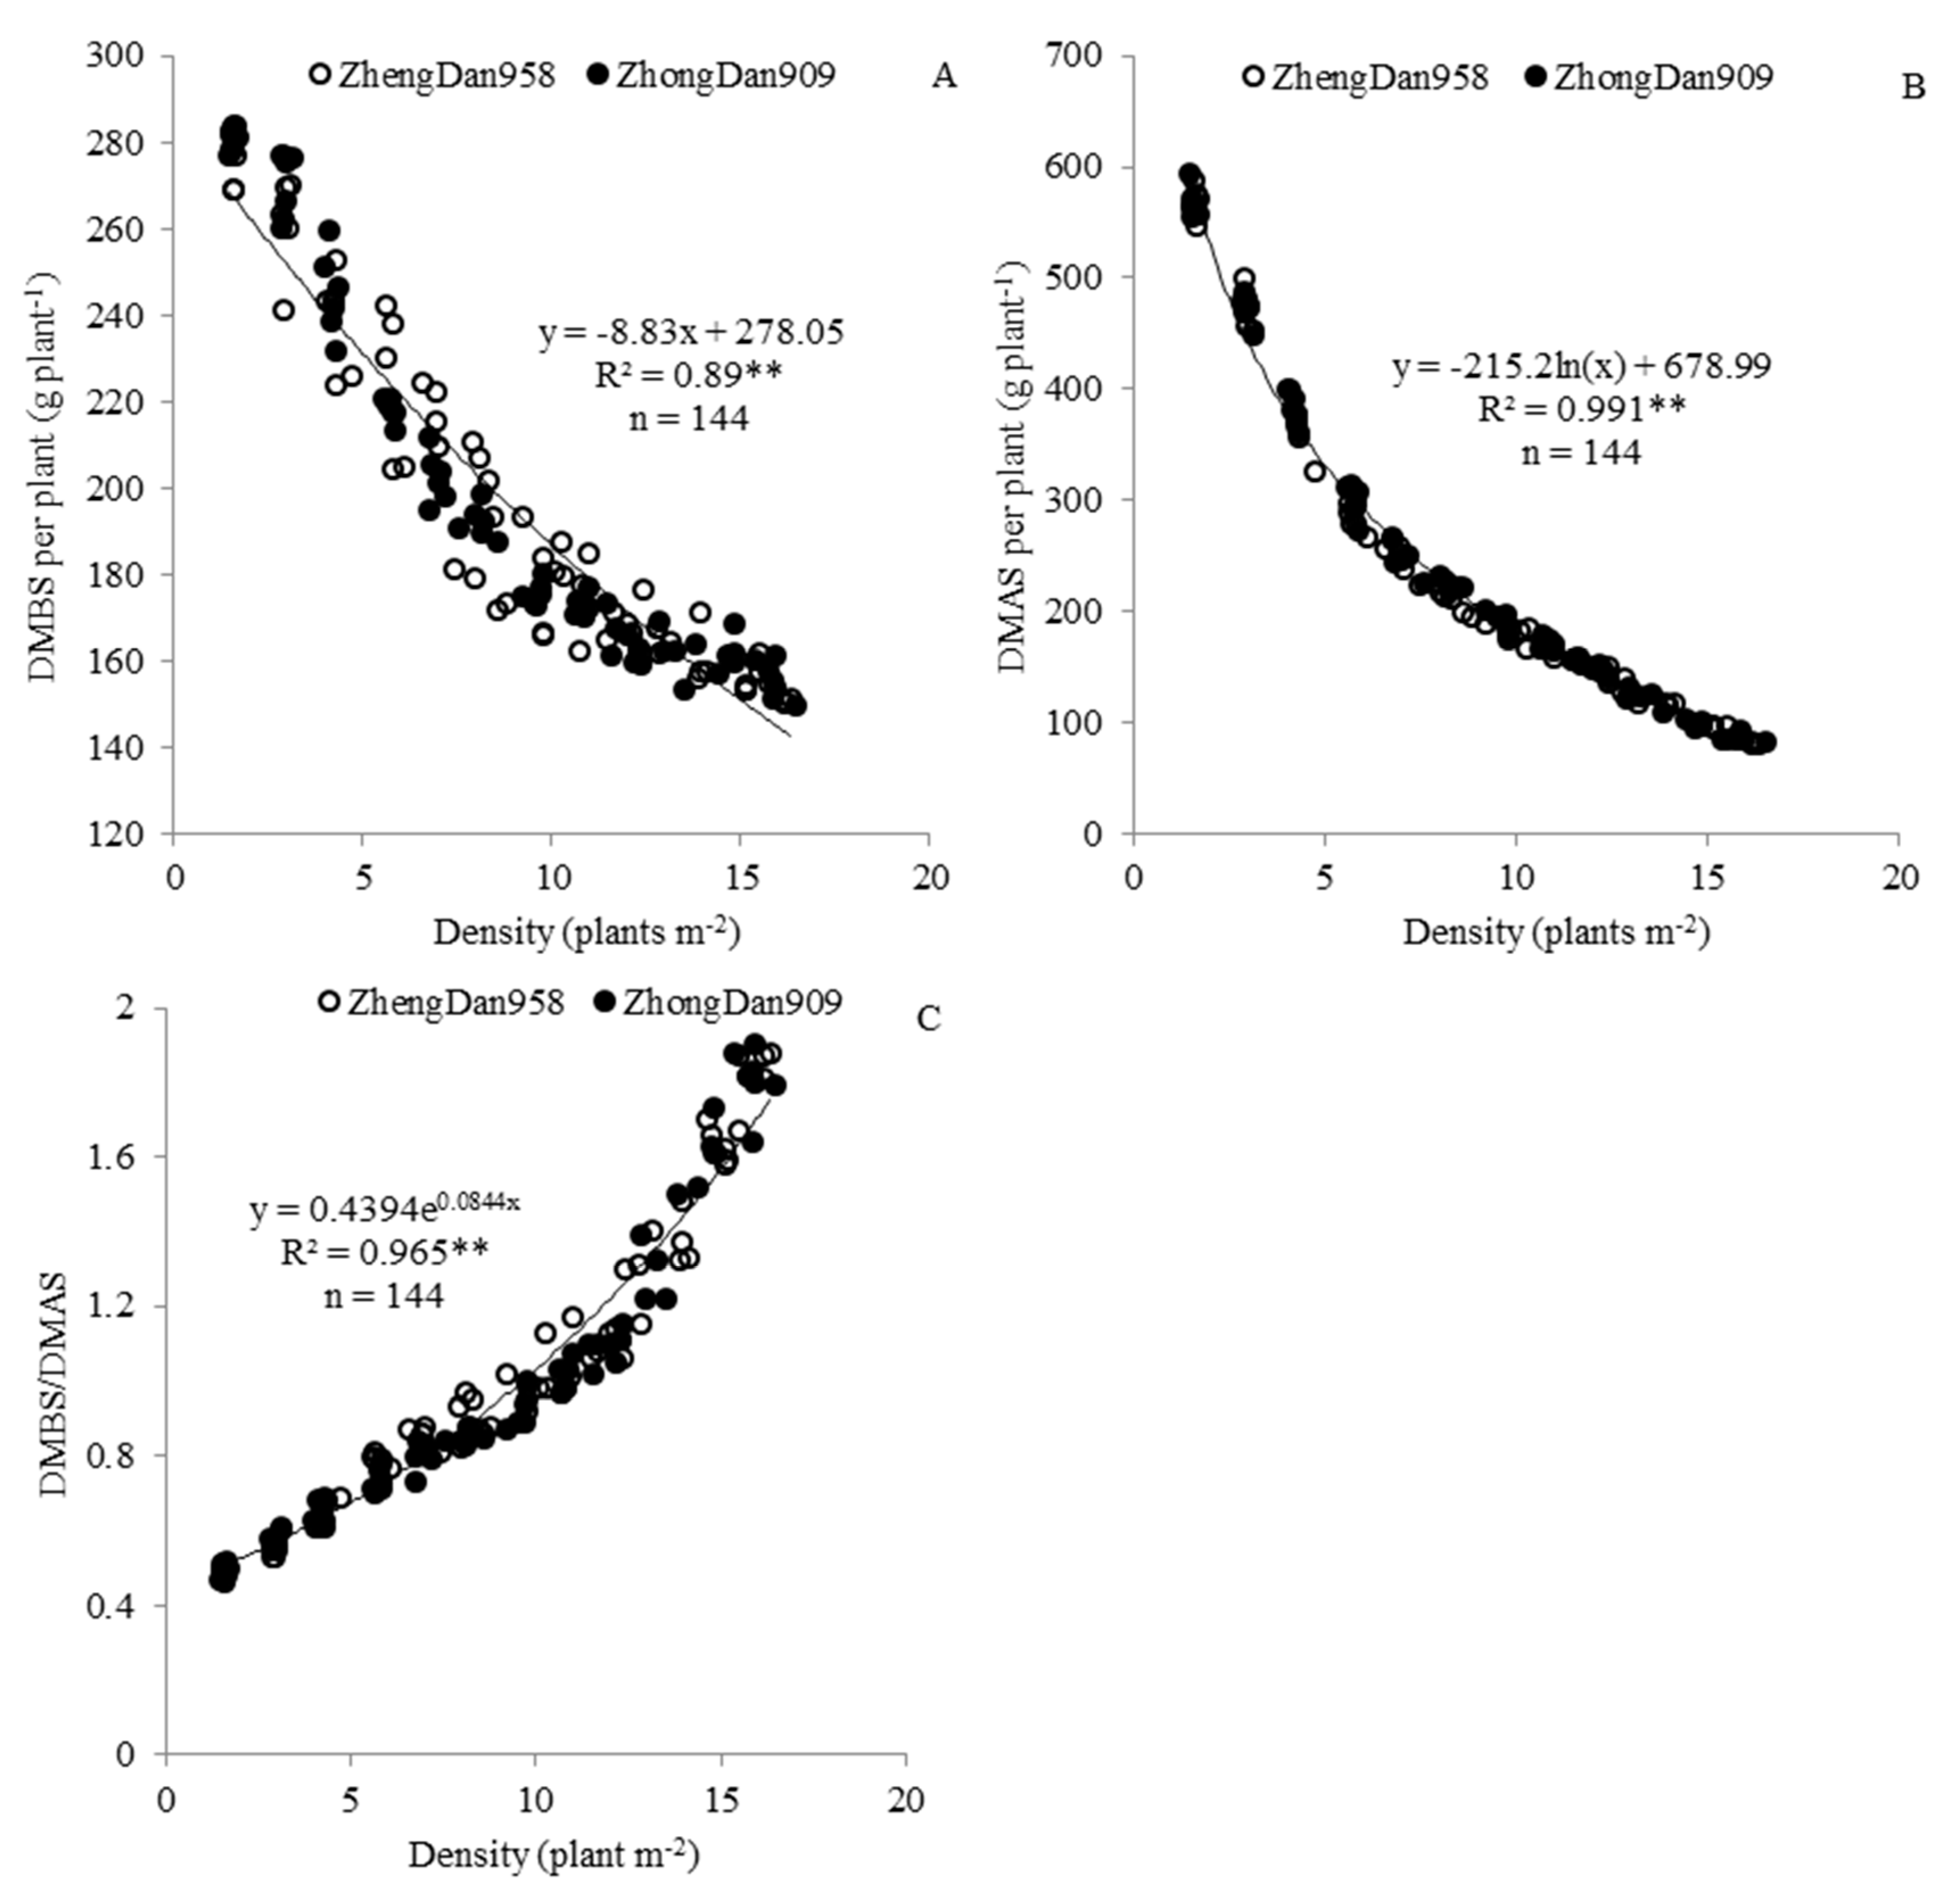
Figure 2.
Relationships between population-level dry matter accumulation at per-silking (DMBS) (A) and post-silking (DMAS) (B) stages and the densities of hybrids ZhengDan958 and ZhongDan909. O indicates the highest DMAS per area, calculated from the equation in (B); n, sample size; ** p < 0.01.
Figure 2.
Relationships between population-level dry matter accumulation at per-silking (DMBS) (A) and post-silking (DMAS) (B) stages and the densities of hybrids ZhengDan958 and ZhongDan909. O indicates the highest DMAS per area, calculated from the equation in (B); n, sample size; ** p < 0.01.
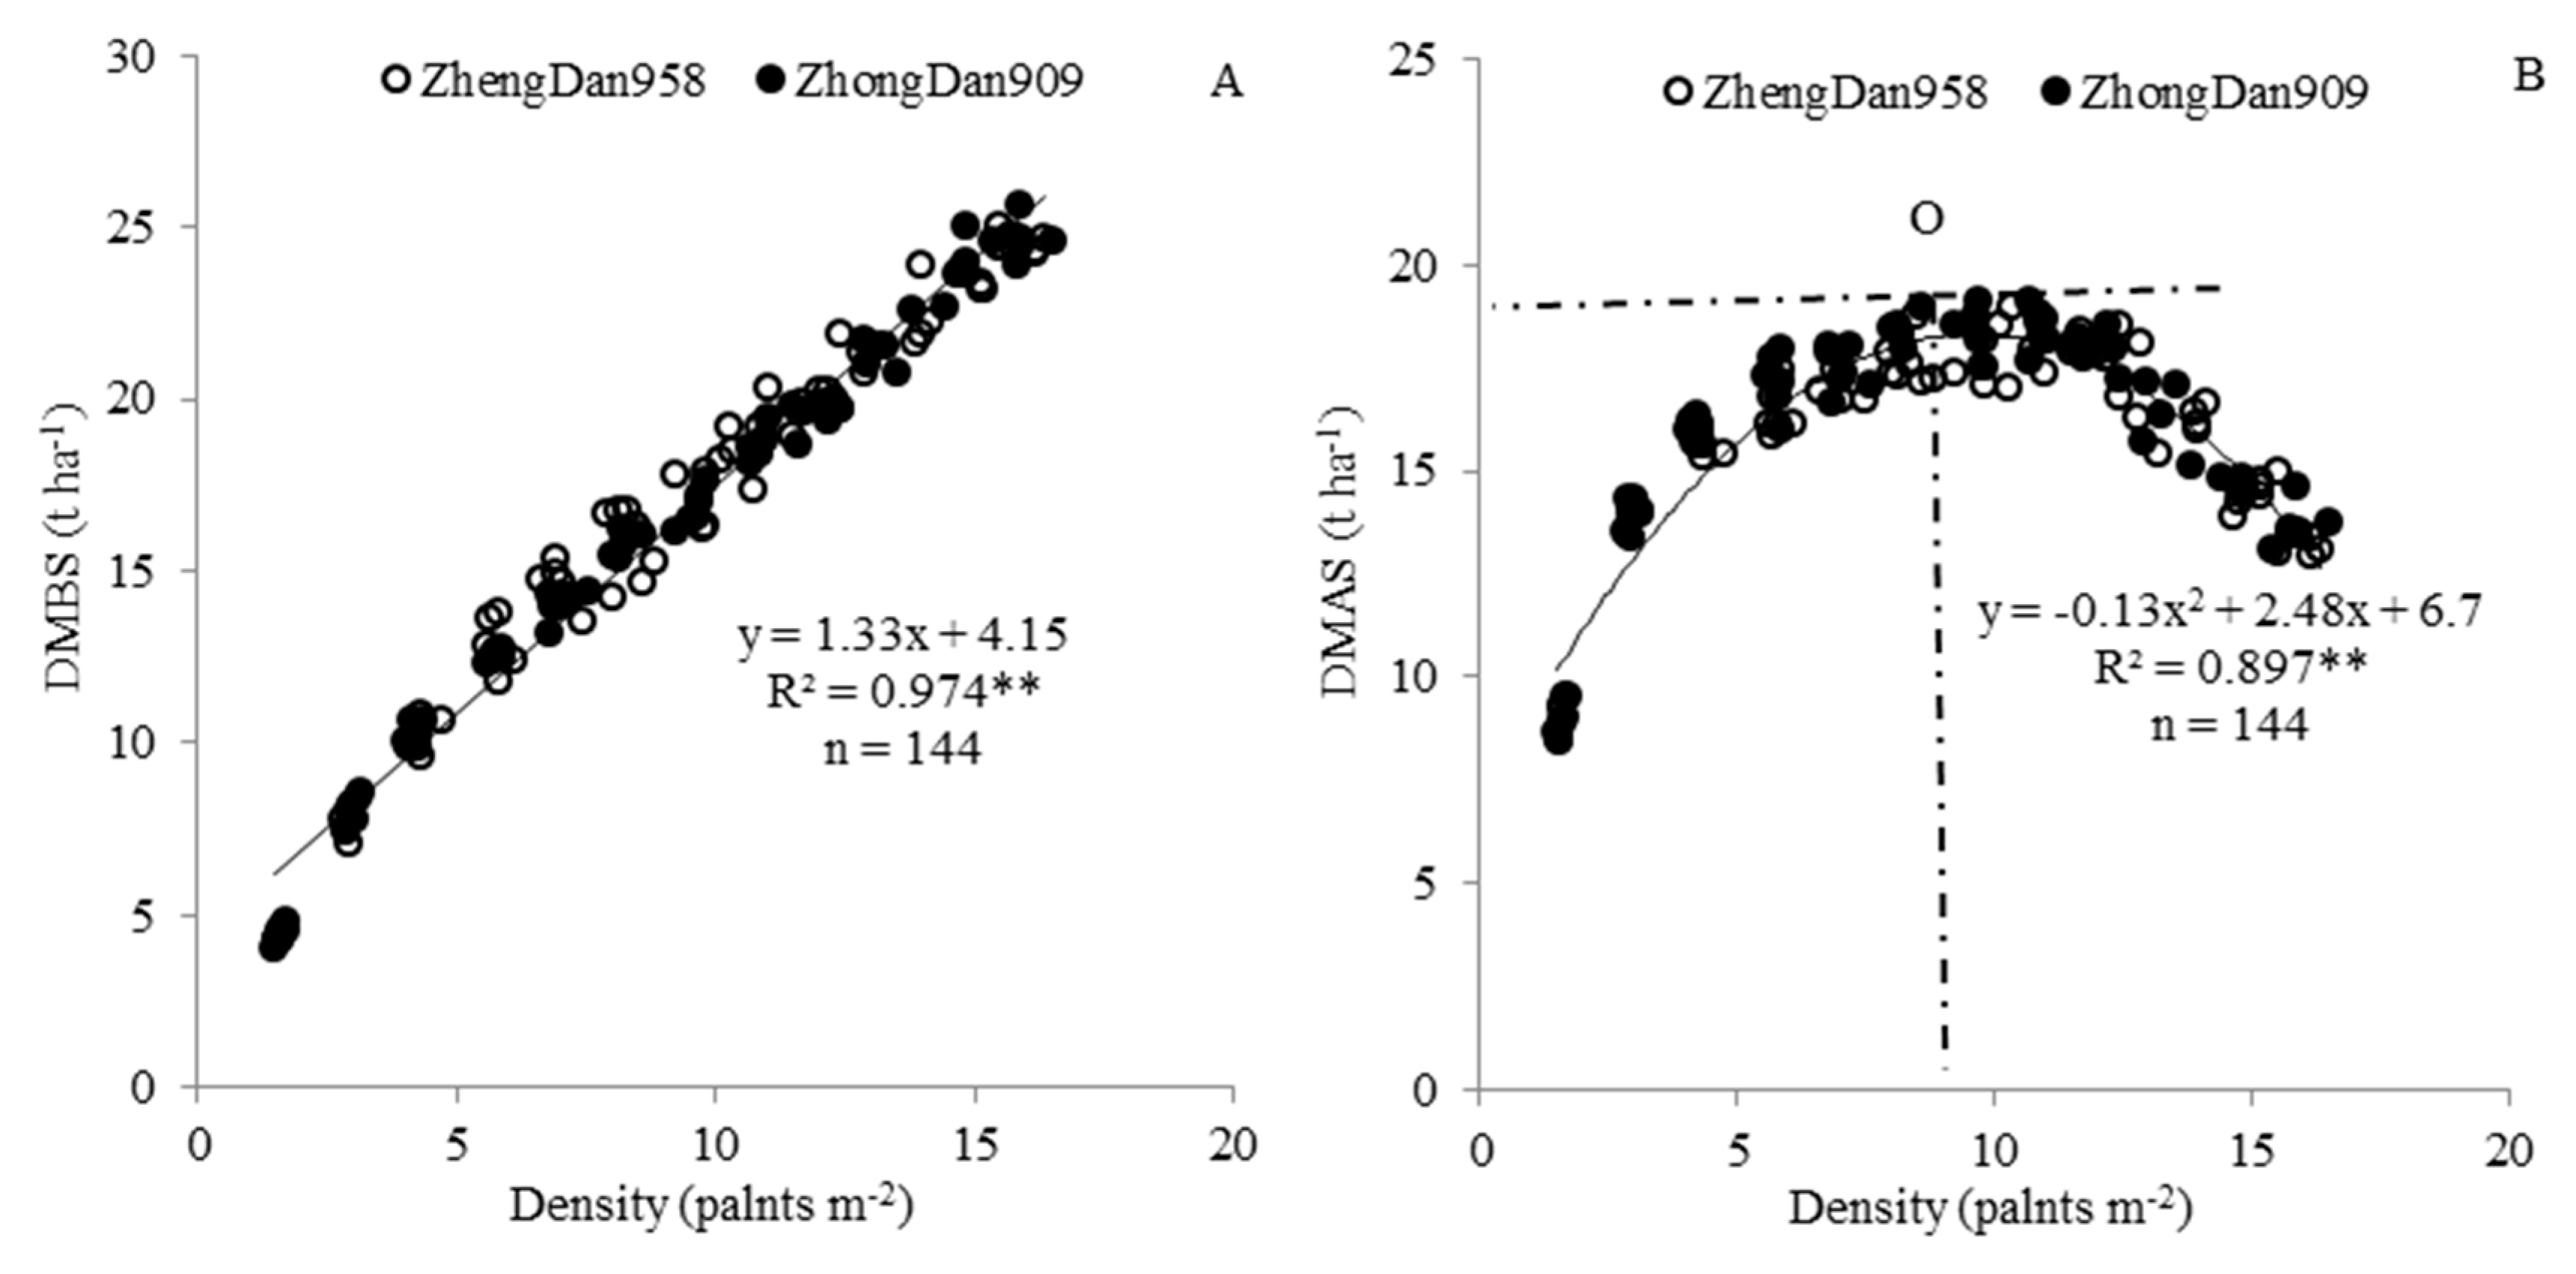
Figure 3.
Relationship between single plant ARDM (A), population-level ARDM (B) and the densities of hybrids ZhengDan958 and ZhongDan909; n, sample size; ** p < 0.01.
Figure 3.
Relationship between single plant ARDM (A), population-level ARDM (B) and the densities of hybrids ZhengDan958 and ZhongDan909; n, sample size; ** p < 0.01.

Figure 4.
Four plant density ranges were divided based on the variance of population-level DM at per (DMBS) and post-silking (DMAS) stage with changes in plant density. O indicates the highest DMAS per area and the corresponding plant density; O’ the point where DMBS per area is equal to DMAS per area; and O’’ the point where the DMAS per area is equal to that at point O’.

Table 1.
Soil chemical properties in experimental fields.
| Experiment Sites | Alkali–Hydrolyzed Nitrogen (mg kg−1) | Available Phosphorus (mg kg−1) | Available Potassium (mg kg−1) | Organic Matter (mg kg−1) | pH |
|---|---|---|---|---|---|
| Qitai Farm | 82.1 | 63.2 | 139.9 | 16.1 | 8.1 |
| 71 Group | 78.3 | 60.1 | 89.7 | 10.4 | 7.8 |
Table 2.
Details of maize hybrids used.
| Hybrids | Parent Combination | Breeding Institution | Maturity Type | Release Year |
|---|---|---|---|---|
| ZhengDan958 | Zheng58 × C7–2 | Institute of Crop Sciences, Henan Academy of Agricultural Sciences, Henan province | Late maturity | 2000 |
| ZhongDan909 | Zheng58 × HD568 | Institute of Crop Sciences, Chinese Academy of Agricultural Sciences, Beijing | Late maturity | 2011 |
Note: Official date of variety release.
Table 3.
Analysis of variance of DM at per (DMBS) and post-silking (DMAS) stage, DM remobilization (ARDM) and the grain yield (GY) for ZhengDan958 and ZhongDan909.
Table 3.
Analysis of variance of DM at per (DMBS) and post-silking (DMAS) stage, DM remobilization (ARDM) and the grain yield (GY) for ZhengDan958 and ZhongDan909.
| Indexes | Hybrid (H) | Year (Y) | Density (D) | H × Y | H × D | Y × D | H × Y × D | ||
|---|---|---|---|---|---|---|---|---|---|
| DMBS | Single plant | F | 0.08 | 4 | 180.65 | 4.57 | 0.33 | 0.42 | 0.4 |
| P | 0.78 | 0.02 | <0.001 | 0. 1 | 0.98 | 0.99 | 0.99 | ||
| Population level | F | 5.26 | 0.45 | 225.42 | 1.07 | 0.98 | 0.95 | 0.68 | |
| P | 0.03 | 0.64 | <0.001 | 0.35 | 0.47 | 0.54 | 0.84 | ||
| DMAS | Single plant | F | 7.36 | 1.13 | 1470.38 | 3.77 | 0.88 | 0.63 | 0.44 |
| P | 0.01 | 0.33 | <0.001 | 0.03 | 0.56 | 0.88 | 0.98 | ||
| Population level | F | 4.81 | 0.85 | 287.53 | 0.57 | 0.94 | 0.92 | 0.67 | |
| P | 0.03 | 0.43 | <0.001 | 0.57 | 0.51 | 0.57 | 0.85 | ||
| ARDM | Single plant | F | 0.42 | 0.11 | 1812.54 | 9.14 | 0.44 | 0.98 | 0.99 |
| P | 0.52 | 0.9 | <0.001 | <0.001 | 0.93 | 0.5 | 0.49 | ||
| Population level | F | 6.53 | 2.31 | 698.08 | 1.54 | 1.31 | 1.2 | 1.08 | |
| P | 0.1 | 0.11 | <0.001 | 0.22 | 0.24 | 0.28 | 0.39 | ||
| GY | Single plant | F | 7.37 | 1.34 | 1209.4 | 2.86 | 0.94 | 0.63 | 0.41 |
| P | 0.01 | 0.27 | <0.001 | 0.06 | 0.51 | 0.89 | 0.99 | ||
| Population level | F | 4.14 | 0.62 | 280.23 | 0.48 | 0.86 | 0.83 | 0.68 | |
| P | 0.05 | 0.54 | <0.001 | 0.62 | 0.58 | 0.68 | 0.84 | ||
Note: F indicates F value; P indicates P value.
Table 4.
Variation of the grain yield (GY) and its composition with changes in plant density of hybrids ZhengDan958 and ZhongDan909.
Table 4.
Variation of the grain yield (GY) and its composition with changes in plant density of hybrids ZhengDan958 and ZhongDan909.
| Density (Plants m−2) | Grain Number (Kernels Ear−1) | 1000-Grain Weight (g) | Singe Plant GY (g Plant−1) | Popoulation-Level GY (t ha−1) | HI |
|---|---|---|---|---|---|
| 1.5 | 578.13 ± 6.81a | 368.63 ± 8.73 a | 539.16 ± 14.25 l | 8.5 ± 0.41 i | 0.64 ± 0.01 k |
| 3.0 | 574.15 ± 7.83 a | 363.09 ± 9.65 ab | 454.61 ± 15.7 k | 13.4 ± 0.34 h | 0.61 ± 0.01 j |
| 4.5 | 567.36 ± 10.21 ab | 355.43 ± 10.32 bc | 359.76 ± 20.41 j | 15.26 ± 0.31 g | 0.58 ± 0.01 i |
| 6.0 | 557.98 ± 11.61 bc | 348.92 ± 8.92 cd | 287.01 ± 15.88 i | 16.51 ± 0.78 f | 0.56 ± 0.01 h |
| 7.5 | 546.77 ± 12.16 cd | 341.56 ± 7.21 de | 248.51 ± 15.79 h | 17.52 ± 0.58 e | 0.55 ± 0.01 gh |
| 9.0 | 533.19 ± 15.02 d | 334.08 ± 8.55 e | 222.85 ± 11.49 g | 18.32 ± 0.7 e | 0.54 ± 0.01 fg |
| 10.5 | 499.4 ± 23.92 e | 325.05 ± 8.19 f | 193.71 ± 7.92 f | 18.79 ± 0.71 d | 0.53 ± 0.01 ef |
| 12.0 | 468.97 ± 23.73 f | 318.05 ± 9.22 fg | 179.01 ± 6.99 e | 19.49 ± 0.66 c | 0.53 ± 0.01 e |
| 13.5 | 433.33 ± 22.69 g | 310.4 ± 12.53 gh | 163.18 ± 5.35 d | 19.52 ± 0.38 bc | 0.52 ± 0.01 d |
| 15.0 | 373.58 ± 26.06 h | 302.69 ± 12.17 h | 138.13 ± 8.71 c | 18.26 ± 0.62 b | 0.48 ± 0.02 c |
| 16.5 | 320.65 ± 20.42 i | 293.34 ± 15.11 i | 114.32 ± 6.09 b | 16.95 ± 0.47 a | 0.44 ± 0.01 b |
| 18.0 | 292.01 ± 16.73 j | 285.66 ± 13.88 i | 100.68 ± 4.72 a | 15.97 ± 0.59 a | 0.42 ± 0.01 a |
Note: Data are indicated as mean (mean of three-year) value ± standard error; different letters indicates p < 0.05.
Table 5.
Relationships between plant density and DM accumulation and remobilization at four different ranges.
Table 5.
Relationships between plant density and DM accumulation and remobilization at four different ranges.
| Density Range (Plants m−2) | n | GY (t ha−1) | DMBS (t ha−1) | DMAS (t ha−1) | ARDM (t ha−1) | DMM (t ha−1) | Harvest Index (HI) | |
|---|---|---|---|---|---|---|---|---|
| I | <6.97 | 54 | y = 1.65x + 7.26 (R2 = 0.862 **) | y = 1.9x + 1.85 (R2 = 0.972 **) | y = 1.59x + 7.95 (R2 = 0.83 **) | - | y = 3.49x + 9.8 (R2 = 0.93 **) | y = −0.02x + 0.67 (R2 = 0.883 **) |
| II | 6.97–8.4 | 14 | y = 1.1x + 9.37 (R2 = 0.386 *) | y = 1.82x + 1.13 (R2 = 0.542 **) | y = 0.74x + 11.89 (R2 = 0.38 *) | y = 4.08x − 28.81 (R2 = 0.664 **) | y = 2.26x + 15.46 (R2 = 0.5 **) | y = −0.01x + 0.65 (R2 = 0.18) |
| III | 8.4–10.67 | 18 | y = 0.23x + 16.47 (R2 = 0.043) | y = 1.48x + 2.92 (R2 = 0.61 **) | y = −0.09x + 18.91 (R2 = 0.006) | y = 0.31x − 2.36 (R2 = 0.76 **) | y = 1.39x + 21.78 (R2 = 0.364 *) | y = −0.01x + 0.67 (R2 = 0.389 **) |
| IV | >10.67 | 58 | y = −0.76x + 28.33 (R2 = 0.839 **) | y = 1.18x + 5.91 (R2 = 0.913 **) | y = −1.02x + 29.83 (R2 = 0.892 **) | y = 0.25x − 1.54 (R2 = 0.951 **) | y = 0.16x + 35.75 (R2 = 0.15) | y = −0.02x + 0.78 (R2 = 0.91 **) |
Note: n, sample size; * p < 0.05; ** p < 0.01.
Table 6.
Relationships between GY and DM accumulation and remobilization at four different ranges.
| Density Range (Plants m−2) | n | DMBS (t ha−1) | DMAS (t ha−1) | ARDM (t ha−1) | DMM (t ha−1) | HI | |
|---|---|---|---|---|---|---|---|
| I | <6.97 | 54 | y = 1.65x + 7.26 (R2 = 0.861 **) | y = 1.02x −0.73 (R2 = 0.997 **) | - | y = 0.49x + 2.3 (R2 = 0.98 **) | y = −78.26x + 60.28 (R2 = 0.722 **) |
| II | 6.97–8.4 | 14 | y = 0.44x + 11.18 (R2 = 0.378 *) | y = 1.09x + 1.41 (R2 = 0.702 **) | y = 0.02x + 0.81 (R2 = 0.381 *) | y = 0.35x + 6.62 (R2 = 0.591 **) | y = 6.06x + 14.71 (R2 = 0.02) |
| III | 8.4–10.67 | 18 | y = 0.19x + 15.39 (R2 = 0.1.07) | y = 0.84x + 3.45 (R2 = 0.779 **) | y = −0.01x + 18.67 (R2 = 0.001) | y = 0.36x + 5.97 (R2 = 0.564 **) | y = 9.98x + 13.34 (R2 = 0.04) |
| IV | >10.67 | 58 | y = −0.62x + 31.5 (R2 = 0.837 **) | y = 0.77x + 5.56 (R2 = 0.99 **) | y = −2.95x + 23.61 (R2 = 0.831 **) | y = −0.29x + 28.98 (R2 = 0.02) | y = 34.74x + 1.51 (R2 = 0.951 **) |
Note: n, sample size; * p < 0.05; ** p < 0.01.
© 2020 by the authors. Licensee MDPI, Basel, Switzerland. This article is an open access article distributed under the terms and conditions of the Creative Commons Attribution (CC BY) license (http://creativecommons.org/licenses/by/4.0/).
Share and Cite
MDPI and ACS Style
Li, J.; Wu, M.; Wang, K.; Ming, B.; Chang, X.; Wang, X.; Yang, Z.; Xie, R.; Li, S. Identifying Ways to Narrow Maize Yield Gaps Based on Plant Density Experiments. Agronomy 2020, 10, 281. https://doi.org/10.3390/agronomy10020281
AMA Style
Li J, Wu M, Wang K, Ming B, Chang X, Wang X, Yang Z, Xie R, Li S. Identifying Ways to Narrow Maize Yield Gaps Based on Plant Density Experiments. Agronomy. 2020; 10(2):281. https://doi.org/10.3390/agronomy10020281
Chicago/Turabian StyleLi, Jian, Man Wu, Keru Wang, Bo Ming, Xiao Chang, Xiaobo Wang, Zhaosheng Yang, Ruizhi Xie, and Shaokun Li. 2020. "Identifying Ways to Narrow Maize Yield Gaps Based on Plant Density Experiments" Agronomy 10, no. 2: 281. https://doi.org/10.3390/agronomy10020281
Note that from the first issue of 2016, this journal uses article numbers instead of page numbers. See further details here.