Article

Genome-wide Association Study and Genomic Prediction for Fusarium graminearum Resistance Traits in Nordic Oat (Avena sativa L.)

1
University of Helsinki, FI-00100 Helsinki, Finland
2
Boreal Plant Breeding Ltd., FI-31600 Jokioinen, Finland
3
Natural Resources Institute Finland (Luke), FI-31600 Jokioinen, Finland
*
Author to whom correspondence should be addressed.
Agronomy 2020, 10(2), 174; https://doi.org/10.3390/agronomy10020174
Submission received: 21 December 2019 / Revised: 16 January 2020 / Accepted: 20 January 2020 / Published: 25 January 2020
(This article belongs to the Special Issue Breeding Healthy Cereals: Genetic Improvement of Fusarium Resistance)

Abstract

:
Fusarium head blight (FHB) and the accumulation of deoxynivalenol (DON) mycotoxin induced by Fusarium graminearum and other Fusarium fungi cause serious problems for oat production in the Nordic region (Scandinavia, Fennoscandia). Besides toxin accumulation, FHB causes reduction in grain yield and in germination capacity. Here, genomic approaches for accelerating breeding efforts against FHB and DON accumulation were studied. Resistance-related traits included DON content, F. graminearum DNA (relative to oat DNA) content (qFUSG) measured with real-time quantitative polymerase chain reaction (PCR), Fusarium-infected kernels (FIKs) and germination capacity (GC). Plant germplasm used in the study consisted of mostly breeding lines, and additionally, a few cultivars and exotic accessions. Genome-wide association study (GWAS) and genomic prediction, enabling genomic selection (GS) on the resistance-related and collected agronomic traits, were performed. Considerable genetic correlations between resistance-related traits were observed: DON content had a positive correlation (0.60) with qFUSG and a negative correlation (−0.63) with germination capacity. With the material in hand, we were not able to find any significant associations between markers and resistance-related traits. On the other hand, in genomic prediction, some resistance-related traits showed favorable accuracy in fivefold cross-validation (GC = 0.57). Genomic prediction is a promising method and genomic estimated breeding values (GEBVs) generated for germination capacity are applicable in oat breeding programs.

1. Introduction

Spring oat (Avena sativa L.) is an important cereal crop in Finland. By cultivation area, it was the second largest cereal crop, after barley, in 2018 [1]. Worldwide, oat cultivation is concentrated to Russia, Canada, Australia, and Eastern and Northern Europe [2]. At least, in Finland [3,4], Norway [5,6,7,8], Russia [9], Sweden [10], Denmark [11], Germany [12,13], the UK [14,15], Canada [16,17,18] and the US [19], the occurrence of Fusarium head blight (FHB) in oats has been recorded. In most of the countries, deoxynivalenol (DON) is the predominant mycotoxin caused by Fusarium infection. Instead, in the UK, T-2/HT-2 toxin produced by various Fusarium species is observed more frequently than DON in oats [14,15]. All these mycotoxins are harmful for both humans and animals [20,21]. Besides toxin production, FHB has been related to yield losses and low germination capacity [22,23]. In European Union (EU) countries, legislation limits the use of unprocessed cereals with DON levels above 1250 µg/kg, unprocessed oat 1750 µg/kg and processed cereal foods 750 µg/kg [24]. In Norway, oat lots exceeding these limits are given a price penalty [8]. In Finland, oat lots for human consumption with toxin accumulation above the limits are discarded in the cereal trade. For animal feed, the EU recommendations are generally not as strict (8000 µg/kg) but vary depending upon the age of the animal and species. Thus, it can be concluded that FHB is a major concern from both health and economic aspects.
In the Nordic region, infections caused by Fusarium species have become more prominent during the last 10–20 years. Recently, Fusarium graminearum Schwabe has become the most dominant DON-producing Fusarium species, and has replaced its close relative, F. culmorum (Wm.G. Sm.) Sacc. [4,8,25,26,27]. F. langsethiae Torp and Nirenberg has been recognized as the most important T2/HT-2 toxin producer [25]. In Finland, the Finnish Cereal Committee (VYR) has taken samples of commercial cereal lots since 1999 for DON content analysis. Between 2000 and 2014, seven percent of all cereal samples had DON content higher than the acceptable EU limit [28], whereas 11% of the oat samples exceeded the limits. In these surveys, oat represented 60% of the total collected samples, and had more infected samples than spring barley and spring wheat. Accumulation of DON has been rarely observed in winter cereals. According to these empirical results, in Finland oat has more DON accumulation compared to other cereals. In the processing industry, on average 90% of the remaining toxins are removed by dehulling oats [15,29].
Weather has a large influence on the FHB severity and the accumulation of DON. The F. graminearum infection level and higher DON content depend upon moisture [30], temperature [31], light intensity and wind [32]. The highest risk of an infection is during anthesis, but infection can occur with diminishing probability later during the growing season [23,33,34]. Higher F. graminearum infection level is related to moist and warm weather during anthesis for cereals [32]. Warm, moist and rainy weather conditions around anthesis, but also dry conditions during germination and tillering, enhance the higher DON content in oat. Warm and moist weather followed by cool and dry conditions around harvest are associated with lower DON accumulation [35].
Resistance toward FHB can be divided into five components. Type 1 [36] is the resistance towards initial infection, which has not been reported for FHB in oat [37]. Type 2 is the resistance to spreading of an infection. Type 3 covers the kernel-induced infection [38], which has been complicated to observe in oat, due to the seed hull [37]. Type 4 includes the tolerance towards infection, which can be measured as yield stability and minimal yield loss in infected trials [38]. The type 5 is resistance to toxin formation [39]. It has been suggested that more than one type of resistance should be measured when determining the FHB resistance of oat genotypes [37].
In North America, oat is not considered as the most susceptible cereal to FHB [18,40,41]. In fact, it was found to be more resistant than wheat and barley. In morphology, oat panicles differ from wheat and barley heads. Infection has been rarely found to move from spikelet to spikelet, due to longer distance through rachilla, pedicles and rachis compared to the more compact heads [33,41]. Therefore, oat has a good type 2 resistance [33,41]. In contrast, oat flowering endures for a longer time (on average eight days) than the flowering of wheat (around 3 to 6 days) [37,42,43], which prolongs the time of susceptibility.
There are multiple studies on traits which have correlation either with FHB resistance or DON accumulation. These agronomic traits are not resistance mechanisms as such, but rather give an escape mechanism to infection. Hull-less oats have been reported to have less FHB and to accumulate less DON [9,44,45]. There are implications on other morphological characteristics giving resistance to FHB, including the color of the lemma [44,46,47]. In modern oat cultivars, the most studied traits correlated with FHB resistance are plant height, days to heading, days to flowering, days to maturity and anther extrusion. Taller plants have been reported to either escape the disease pressure, have a linkage with FHB resistance-affecting genes, or resistance is a result of pleiotropy [7,8,48], but at the same time lodging promotes FHB and the accumulation of DON [7,49]. In a Russian oat study, no correlation between FHB severity and plant height was found [50]. Earliness has been more of a contradictory trait.
In Norway, a high negative correlation between FHB and days to flowering or days to maturity was reported [8,48]. Correlation between low DON content and late maturity was not as strong. In contrast, opposite results have been reported in Finland and Russia [50,51], where early maturing oat lines were more resistant to DON accumulation. In wheat, taller and later plant lines have been reported to have less FHB [52,53,54]. Anther extrusion have been described as a trait correlated with wheat FHB and DON accumulation [54,55,56]. The more the anthers are extruded, the less disease is observed. In oat, preliminary studies have been conducted, and evidence of a similar, but not as clear connection, has been reported [33,37,57,58].
Besides the correlated agronomic traits, visually scored FHB and DON content have often been found to have a positive correlation in barley and wheat [59,60]. In oat, visual scoring has not been found to be a reliable method, because in the field, disease symptoms can easily be mixed with maturing spikelets [37,48,61]. In three studies [8,37,48], correlations between FHB and DON content have been 0.43, −0.05 and −0.19, respectively. These results imply that visual scoring may be reliable if a broad spectrum of susceptibility does exist in the tested material and the level of infection is high, but otherwise visual scoring is not reliable [8]. Evaluation of Fusarium infection in oat is commonly done after harvest in the laboratory. Mycotoxins can be measured with different methods, such as chromatography [62,63] or enzyme-linked immunosorbent assays (ELISAs). The level of Fusarium infection can be measured by growing seeds on a selective media and visually assessing the number of infected kernels (Fusarium-infected kernels, FIKs) [38,60,64] or with a real-time polymerase chain reaction (real-time quantitative PCR = qPCR) by identifying the fungal DNA mass of a sample [65,66,67,68]. Type 3 resistance (kernel infection) has been quantified by a germination capacity assay [23].
When reliable measurements for FHB resistance have been carried out and genotypic information on tested lines is available, genome-wide studies can be performed. Genome-wide association studies (GWAS) can be used to search for important associations between measured traits and genetic markers [69,70,71]. Spurious associations may rise from population structure or close relatedness within the population [72,73]. In order to correct for population structure, assumption-free PCA is often used [74]. Genome-wide marker data can also be used to calculate genomic estimated breeding values (GEBVs) and use them in a genomic selection (GS) approach [75,76]. In GS, a training population with genotypic and phenotypic information are connected with a statistical model that is then used to predict GEBVs for unphenotyped individuals with genotypic information [76]. The prediction models differ in their ability to estimate marker effects [77,78]. One of the most used models, genomic best linear unbiased prediction (GBLUP), is a robust, infinitesimal model for polygenic traits. The prediction model is validated with methods, like k-fold cross-validation or leave-one-out, and the accuracy of the prediction is received.
Genomic studies are still scarce in oat. One of the reasons is in its complex genome, which is known to carry three genomes, each containing seven chromosomes. The genomes are designated as AA, CC and DD [79]. There are major translocation events described in the genomes, like in 7C and 17A (7C-17A) [80]. The current oat consensus map [81] is not yet perfect, and only part of the merged linkage groups have been assigned to chromosomes. The merged linkage groups are numbered from 1 to 33, and if the group has been assigned to a specific chromosome, it is shown after a slash (e.g., 12/13A). Recently, a GWAS study was made for FHB resistance in oat [8]. Bjørnstad et al. (2017) used an oat core population, which contained oat lines from the Nordic region and North America. In their results, visually scored FHB had significant association with several markers on merged linkage groups, i.e., preliminary chromosomes, 12/13A, 02/9D and 03/4C [81]. However, when days to flowering was added as a covariate, these associations were not significant, suggesting that at least some of the variation in FHB was due to growing time. DON content had as well significant associations with multiple markers on merged linkage groups 03/4C, 09/6C, 18, 23/11A and 28 [81] (7C-17A) [82]. Other GWAS studies made in oats are for beta-glucan [83,84], crown rust [85], lodging, plant height [86] and frost tolerance [87]. All of these studies implicate that oat generally has less genetic variation and a weak population structure compared to other cereals.
A lot of genomic studies have been reported for FHB resistance in wheat [88] and some in barley [89,90]. In wheat, a major gene influencing on resistance, Fhb1, has been found from Chinese germplasm [91,92,93]. For wheat FHB resistance, several authors have reported reasonable genomic prediction accuracies [94,95,96,97]. The five-fold cross-validation accuracy for the DON content was 0.64 and for the Fusarium-infected kernel, it was 0.82 [94]. Similar accuracy was computed for the FHB index, which contained both the severity and incidence of the infection [95]. GS studies point out the potential benefit of using GS in breeding for FHB resistance in wheat. To our knowledge, validated genomic predictions have not been reported before for FHB resistance in oat. GS studies in oat include traits, like grain yield [98,99], which imply that the use of GS in breeding for quantitative traits may be beneficial in oats.
FHB resistance and DON accumulation seem to be quantitatively inherited traits in oat [8,48], and no single major QTL resistance source, like in wheat (Fhb1), has been found. However, multiple associated QTLs for two mapping populations and a diversity panel have been found [8,48]. The aim of this study is to observe the existing genetic variation of FHB resistance and DON accumulation, trait relations and heritabilities, within a commercial oat breeding population. Possible significant trait and marker associations are studied. Breeding for quantitatively inherited traits with the GS approach may be beneficial, but it requires adequate amounts of phenotypic and genotypic information, in order to receive reliable estimates of the GEBVs. Genomic prediction accuracies, for data accumulated so far in the breeding program, are computed, and the possibilities of using genomic models to assist oat resistance breeding are evaluated.

2. Materials and Methods

2.1. Plant Germplasm and Genotype Data

Plant lines in our study were provided by Boreal Plant Breeding Ltd. and were listed in Supplementary 1. A total of 327 tested lines contained inbred breeding lines (F4:8), cultivars and some accessions from the N.I. Vavilov Research Institute of Plant Industry (VIR 6963, VIR 7766, VIR 7934 and VIR 8479) [9,45]. Tested lines contained the best and the worst hulled lines in DON accumulation based on a previous, unpublished study, where available resistance sources were thoroughly studied. The set of tested lines was altered every year as new breeding lines were included in the trials. On average, 41% of the lines were shared between the trials. Tested lines represented 162 biparental families. The largest family contained 10 progenies, while most of the families were represented by one line.
Plant lines, referred to as GID, were genotyped with a customized, unpublished 6K single-nucleotide polymorphism (SNP) chip. Quality of the SNP markers was checked, and markers were removed if the call rate was less than 90%, the minor allele frequency (MAF) was less than 5% and the heterozygosity was more than 5%. Those remaining 2785 markers were used in the further analysis. Missing SNPs were imputed with a mean value with the A.mat function in the rrBLUP R package [100]. An unpublished genetic consensus map based upon several mapping populations was used. The SNP markers which did not have a map position (n = 608) where assigned into “chromosome 22”. Linkage disequilibrium (LD) was measured (r2) for each marker pair per chromosome. The decay of LD was examined visually by plotting each marker pair against their distance (cM), and by fitting a nonlinear regression based on Hill and Weir [101]. The computation was done in software R, with version 3.6.0 [102], and the code was provided by Marroni [103]. All the markers were used in principal component analyses (PCA) to compute the population structure for GWAS. Computation was as well done in R [102].

2.2. Phenotypic Data

Field experiments were in Jokioinen (Jok, WGS 84 coordinates: 60.811163, 23.497720) between the years 2015 and 2018, and in Laukaa (Lau, WGS 84 coordinates: 62.326318, 25.991806), in the years 2016 and 2017. Trials, referred in the analysis as TRIAL, were planted according to a row-column design with three replications [104]. Check cultivars across trials consisted of 20 cultivars, three of them were specifically selected to represent the different levels of FHB resistance.
The three checks were chosen based on a previous unpublished study: Finnish cultivar Niklas was found to be moderately resistant, Swedish cultivar Belinda intermediate and Finnish cultivar Mirella susceptible. The number of replicates for checks varied between trials, but mostly checks were replicated six times per a trial. In the Jokioinen 2018a trial, only Belinda was included. The experimental unit was a 1-m long row. In 2015, plant lines were placed as single rows, in 2016 and 2017 as double rows and in 2018 as single rows with guard rows set as borders to equalize disease pressure within rows. Trials were spawn inoculated once before heading, at latest at Zadoks 49 stage [105]. The preparation of the inoculum is described by Tekle et al. [37]. Briefly, a mixture of five Finnish F. graminearum isolates were grown on autoclaved oat kernels. Once the inoculum was ready it was spread by evenly dispersing seeds between each row with density of 10 g/m2. The experiments were mist-irrigated between 7 PM and 10 PM from anthesis until yellow maturity. Fertilizer was used according to each field standards, and no fungicides were used during the growing season. Rows were harvested by hand in bags, threshed and cleaned with an indoor thresher (Saatmeister, Kurt Pelz, Germany).
Phenotyped agronomic traits included days to heading (DH), which was recorded when 50% of the panicles were visible; maturity class (MC) (1-early, 5-late) was recorded when 50% of the panicles reached yellow maturity; and plant height (PH) was measured from ground level to the top of the panicles at yellow maturity.
Resistance-related traits recorded were the germination capacity (GC), frequency of Fusarium-infected kernels (FIKs) [106], DON mycotoxin content and the relative amount of F. graminearum fungus DNA (pg) per oat DNA (100 ng) measured by qPCR [67], which is referred to later as qFUSG (quantity of F. graminearum). All the resistance-related traits were measured from each replicate. Germination capacity was determined with the standard paper germination test used in Finnish authority laboratories (ISTA 2006). Germinated seedlings were assessed as germinated if the shoot growth was normal. In the case of abnormal growth, the seedlings were not determined as germinated. The seedlings were grown up to 10 cm before assessing the germination. Fusarium-infected kernels were determined by plating 100 seeds on a selective media [107]. The Fusarium-infected kernel level was estimated after three days or one week of incubation at 23 °C, depending on the progress of the infection rate. Grain samples of 10 g for DON mycotoxin analysis were taken after mixing the threshed row samples. The samples were milled (Lab Mill 120, Perten Instruments, Hägersten, Sweden) and DON content was measured with an ELISA kit (R5906 Ridascreen DON 96 test, R-Biopharm, Darmstadt, Germany). To control the variation between measurements, the commercial reference sample for DON, TR-D100 (R-Biopharm, Darmstadt, Germany), was used. The same milled samples were used in qPCR (QuantStudio 5 Real-Time PCR System, Thermo Fisher Scientific, Waltham, USA) with the method, including probes and primers, from Divon et al. 2012 [108]. The quantity of oat and F. graminearum DNA were analyzed in a multiplex reaction, where each reaction was repeated two or three times and the means were calculated and used for further analysis. Each qPCR run contained a dilution series for both species. The sample data was processed with Standard Curve version 3.9 app (Thermo Fisher Connect, Waltham, MA, USA).

2.3. Experimental Analysis

The data analysis was done in two stages. In the first stage spatial effects were corrected for each trial separately. A model without corrections for spatial effects was compared with models with replication, column, row, column within a replication and/or row within a replication. During the process, clear outliers were removed. An optimal model was selected [109] for each trait in each trial based on the Bayesian information criterion (BIC). The best linear unbiased estimates (BLUEs) for each line per trial (referred to as per trial computed BLUEs later) were derived and used for further analysis. Broad-sense heritability for each trial as well as across trials was computed based on Piepho and Möhring (2007) [110]:
h 2 = σ G 2 σ G 2   +   ½ MVD
where σ G 2 presents the genetic variance and MDV the mean variance of a difference within the BLUEs. Computations were done according to Schmidt et al. (2019) [111]. The trait data per trial was removed if the broad-sense heritability was below 0.3. Testing of normality assumptions for each trait and data preparations were done in R [102]. The normality assumption was not met in the case of DON content and qFUSG. For this reason, log-transformation was done, and all presented DON contents are presented as log (DON) and qFUSG values as log (qFUSG). Before transformation, a constant (+10) was added to all qFUSG spatially-corrected phenotypes due to negative values in the data.

2.4. Association Analysis

The second stage of the analysis included GWAS and genomic prediction, which were computed separately. GWAS was performed using the Genomic Association and Prediction Integrated Tool (GAPIT) package, version 3 in R [102,112,113]. Analysis was checked following a published protocol [114]. As an extra step in GWAS, per trial computed BLUEs were calculated as BLUEs for each line (referred to as line-specific BLUEs later) using the lmer function, “lmer(TRAIT ~ GID + (1|TRIAL)”, from the lme4 R package [102,115]. Before estimation, per trial computed BLUEs were centered with “scale(TRAIT, center = T, scale = F)” to avoid an intercept being added in the first estimate. Next, in the GWAS process, principal component analysis (PCA) was used to detect the population structure. PCA was computed within GAPIT, and the number of PCs was determined visually by looking at the flattening of the curve in the scree plot of the variation explained by each of the PCs and, in addition, using BIC values provided by GAPIT while setting the “model.selection = TRUE” and “PCA.total = 10”. The actual GWAS analysis was run with four different models to assess the marker–trait association. The first model was a naive model, where no population structure or information on the relationship between lines was added. In GAPIT, model parameters were set as “group.from = 1, group.to = 1” to disable the default kinship calculation. The second model (Q) included a selected number of PCs for population structure control as covariates in the model, but no relationship between individuals was added. In the third model (K), the cryptic relatedness was tested with a kinship (K) matrix computed within GAPIT by the default method “VanRaden” [116]. To clarify, K was calculated from SNP markers. No PCs were added in the third model. The fourth model (QK) included both the selected number of PCs and the K matrix.
The naive and Q models can be described as
y = Xb + e
where y represents the line-specific BLUEs calculated for each trait, X is the design matrix, vector b describes the fixed effects, which are in the naive model only the markers, and in the Q model, markers and eigenvalues from the computed PCA, and vector e is the random error.
The K and QK model can be presented as
y = Xb + Za + e,
where y represents the line-specific BLUEs calculated for each trait. Vector b presents the fixed effects, which are in the K model only as the markers, and in the QK as the markers and the eigenvalues. Vector a describes the random additive genetic effects by including the kinship K matrix. X and Z are design matrices associating both effects to the BLUEs, and vector e is the random error. The assumptions for the models are detailed in the GAPIT manual [117]. The analysis was conducted for a single year DON content and qFUSG data as well, if the number of lines within a year exceeded 100 (DON 2017, DON 2018, qFUSG 2017 and qFUSG 2018). The significance level of the trait–marker associations was corrected with two methods, the Bonferroni multiple testing correction and by adjusting the p-value (0.10) with the false-discovery-rate (FDR) [118].

2.5. Genomic Prediction

Genomic prediction was conducted with the GBLUP model. The per trial computed BLUEs (vector y) can be represented with the model 2. In this case, vector b describes the fixed effects (TRIAL), vector a, the random additive genetic effects, and vector e the random residual effects. The per trial computed BLUEs are associated with the effects via the corresponding design matrices X and Z. The following assumptions were used
a ~ N ( 0 , G σ a 2 ) ,
where G is the additive relationship matrix calculated from SNP markers, and σ a 2 is the genetic variance, and e ~ N ( 0 , I σ e 2 ) , where I is the identity matrix and σ e 2 is the residual variance. The covariance between a and e is assumed to be zero. Variance components for genomic prediction were estimated using the Average Information REstricted Maximum Likelihood (AI-REML) [119] and calculated with DMU software version 6, release 5.2 [120]. The relationship matrix G was computed from SNP markers according to the first method from VanRaden (2008). An inverse matrix G−1 was calculated with MiX99 software [121] and used in the analysis. The same software was used to solve mixed model equations using pre-estimated variance components.
Estimates for variance components and narrow-sense heritabilities were extracted from single-trait models with DMU software. The narrow-sense heritability estimates were calculated as
h 2   =   d ( G ) σ a 2 d ( G ) σ a 2 + σ e 2
where d ( G ) is the average of the diagonal elements of the G-matrix, σ a 2 presents the additive genetic variance and σ e 2 the residual variance. The genetic correlation estimates were obtained from two-trait models with DMU software. Structures for the two-trait models can be specified as follows:
y = [ y 1   y 2 ] , e = [ e 1   e 2 ] b = [ b 1 b 2 ] ,   X = [ X 1 0 0 X 2 ] a = [ a 1 a 2 ] ,   Z = [ Z 1 0 0 Z 2 ]
For the two-trait models, the distributional assumptions included
a ~ N ( 0 , G 0 G )
where G 0 is the genetic covariance between the two traits and G is the additive relationship matrix,
e ~ N ( 0 , R 0 I ) ,
where R 0 is the residual covariance matrix and I the incidence matrix, E ( y ) = Xb   and C o v ( a , e ) = 0 . The refers to Kronecker product of the two matrices. The genetic correlations between the traits i and j were calculated as:
d ( G ) ( G 0 ) ij d ( G ) ( G 0 ) ii d ( G ) ( G 0 ) jj = ( G 0 ) ij ( G 0 ) ii ( G 0 ) jj
where d ( G ) is the average of diagonal elements of the G-matrix, ( G 0 ) ij is the genetic covariance between two traits and ( G 0 ) ii is the genetic variance for trait i and ( G 0 ) jj is the genetic variance for trait j. The phenotypic covariance matrix was computed as
d ( G ) G 0 +   R 0
and phenotypic correlations were derived from this matrix, where R 0 is the residual covariance matrix. The formulation is specified as:
( d ( G ) G 0 +   R 0 ) ij ( d ( G ) G 0 +   R 0 ) ii ( d ( G ) G 0 +   R 0 ) jj

2.6. Prediction Model Validation

Genomic prediction was validated with two schemes, random fivefold cross-validation (CV) with 100 replications, and leave-one-out (LOO), where each TRIAL was assigned as a validation set. In CV, the tested lines were randomly assigned to five subsets, and four sets were used as a training set, and one set as a validation set. The validation sets consisted of 62 lines, except that the fifth one had 60 lines, for DON content, 57 lines for qFUSG and 38 lines for the rest of the traits. The check cultivars (20 lines) were always assigned into a training set. In LOO, one of the trials was assigned as a validation set and the remaining trials were used as a training set.
The validation accuracy in CV was computed as a weighted correlation between predicted value and line-specific pseudo-phenotype. This pseudo-phenotype was calculated from complete data and each per trial computed BLUEs was adjusted for the fixed effects within a trial and averaged across. The number of observations for each line were used as a weight in the correlation. In LOO, a correlation was made between the predicted value and per trial computed BLUEs adjusted for the fixed effects estimated from the complete data.

3. Results

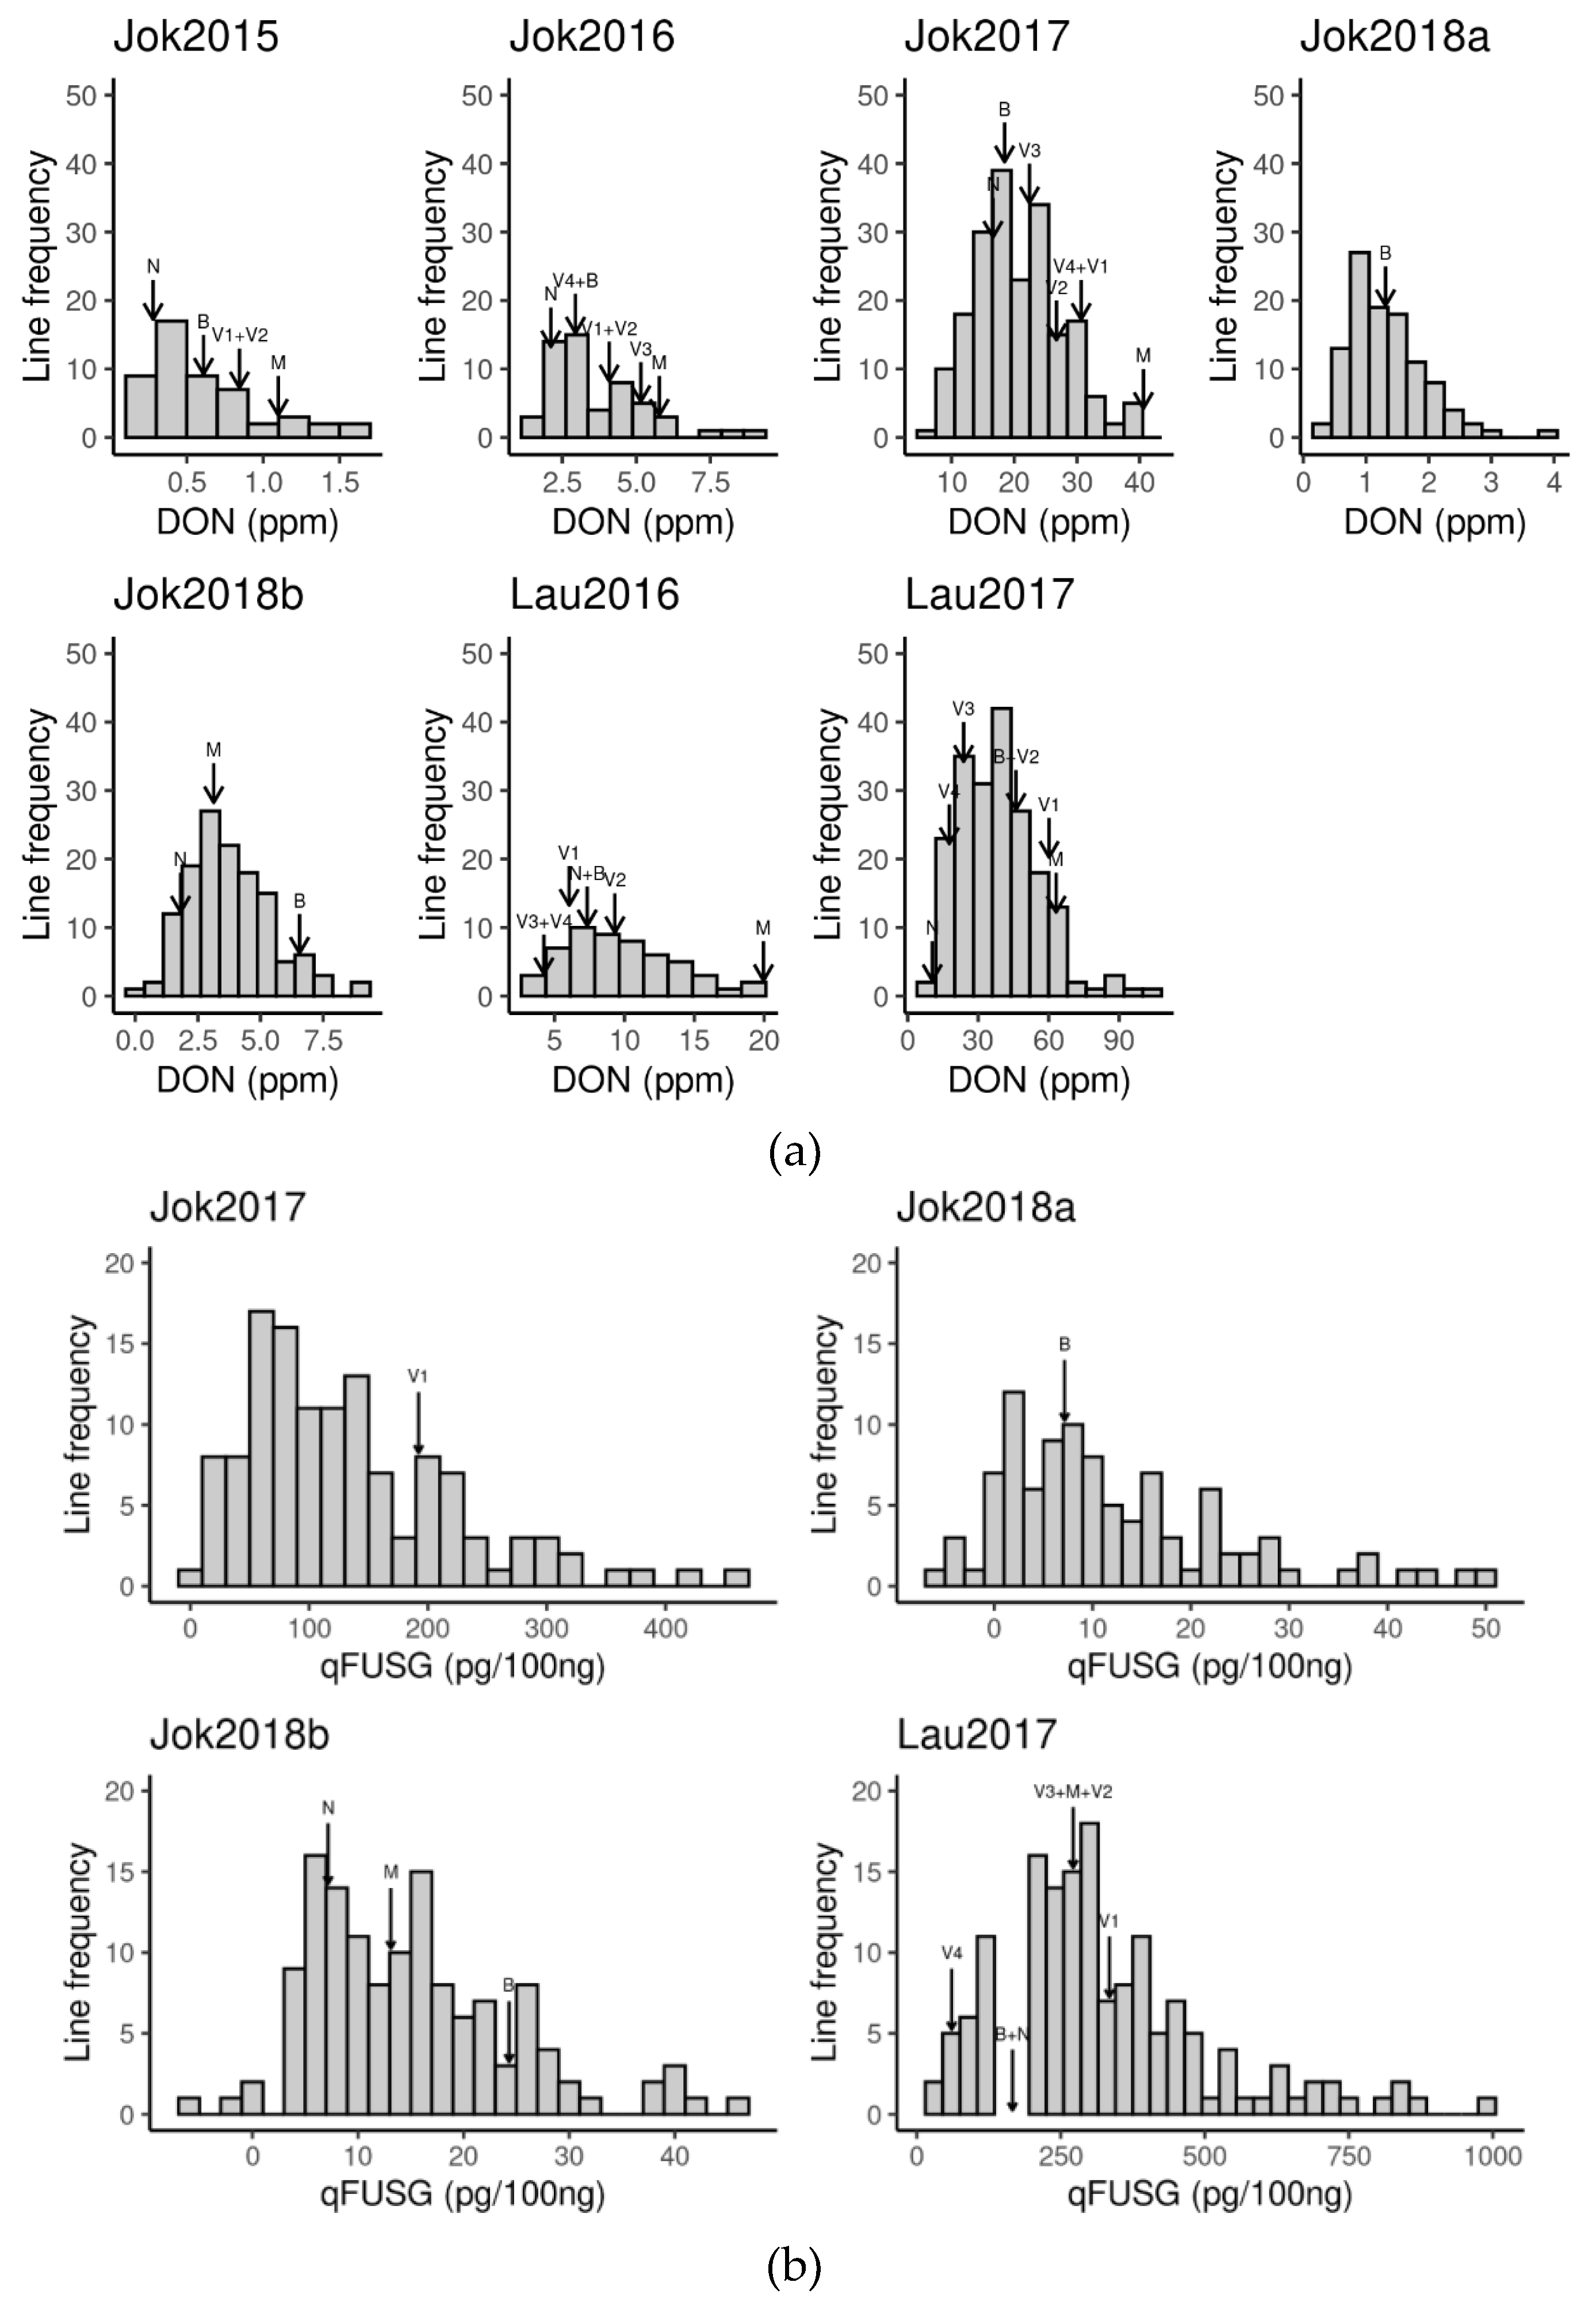
3.1. Phenotypic Records

Agronomic (DH, PH, MC) and FHB resistance-related traits (GC, FIK, DON, qFUSG) were collected from artificially infected field trials. Descriptive statistics for each trait are presented in Table 1. There was a lot of unexplained variation in DON content and qFUSG, which is indicated as high CV% and LSD values for each trial (Table 2). Least significant differences (LSDs) within the trials varied between 1.1 ppm and 22.8 ppm, with a mean of 7.8 ppm for DON content, and for qFUSG, the variation was between 17.8 and 281.6, with a mean of 132.9. On average, the coefficient of variation (CV%) was 46.2% for DON content and 65.7% for qFUSG. Distributions of DON content and qFUSG in each trial are provided in Figure 1a,b, pointing out some of the germplasm included in the trials. The level of the DON accumulation varied a lot depending on the year. In the rainy year 2017, the level of DON accumulation was higher compared to the dry year 2018. Despite the level of DON content varying yearly, the ranking of the marker cultivars, i.e., checks, in DON content, was rather constant throughout (Figure 1a). An exception was seen in the Jokioinen 2018b trial, where Belinda accumulated more DON than Mirella. Ranking of VIR lines varied between trials. In Jokioinen, VIR lines were placed between Belinda and Mirella. In Laukaa 2016, VIR lines had less accumulated DON than Niklas, which was divergent from the other trials. Data for qFUSG was missing the check cultivars and VIR-lines in some trials. The cultivars or lines were not measured, or they were removed during the data quality check. For qFUSG data (Figure 1b), in Jok2018b and Lau2017, the ranking of the marker cultivars was comparable to DON ranking. As well for Jok2018b, Belinda had higher level of qFUSG than Mirella.

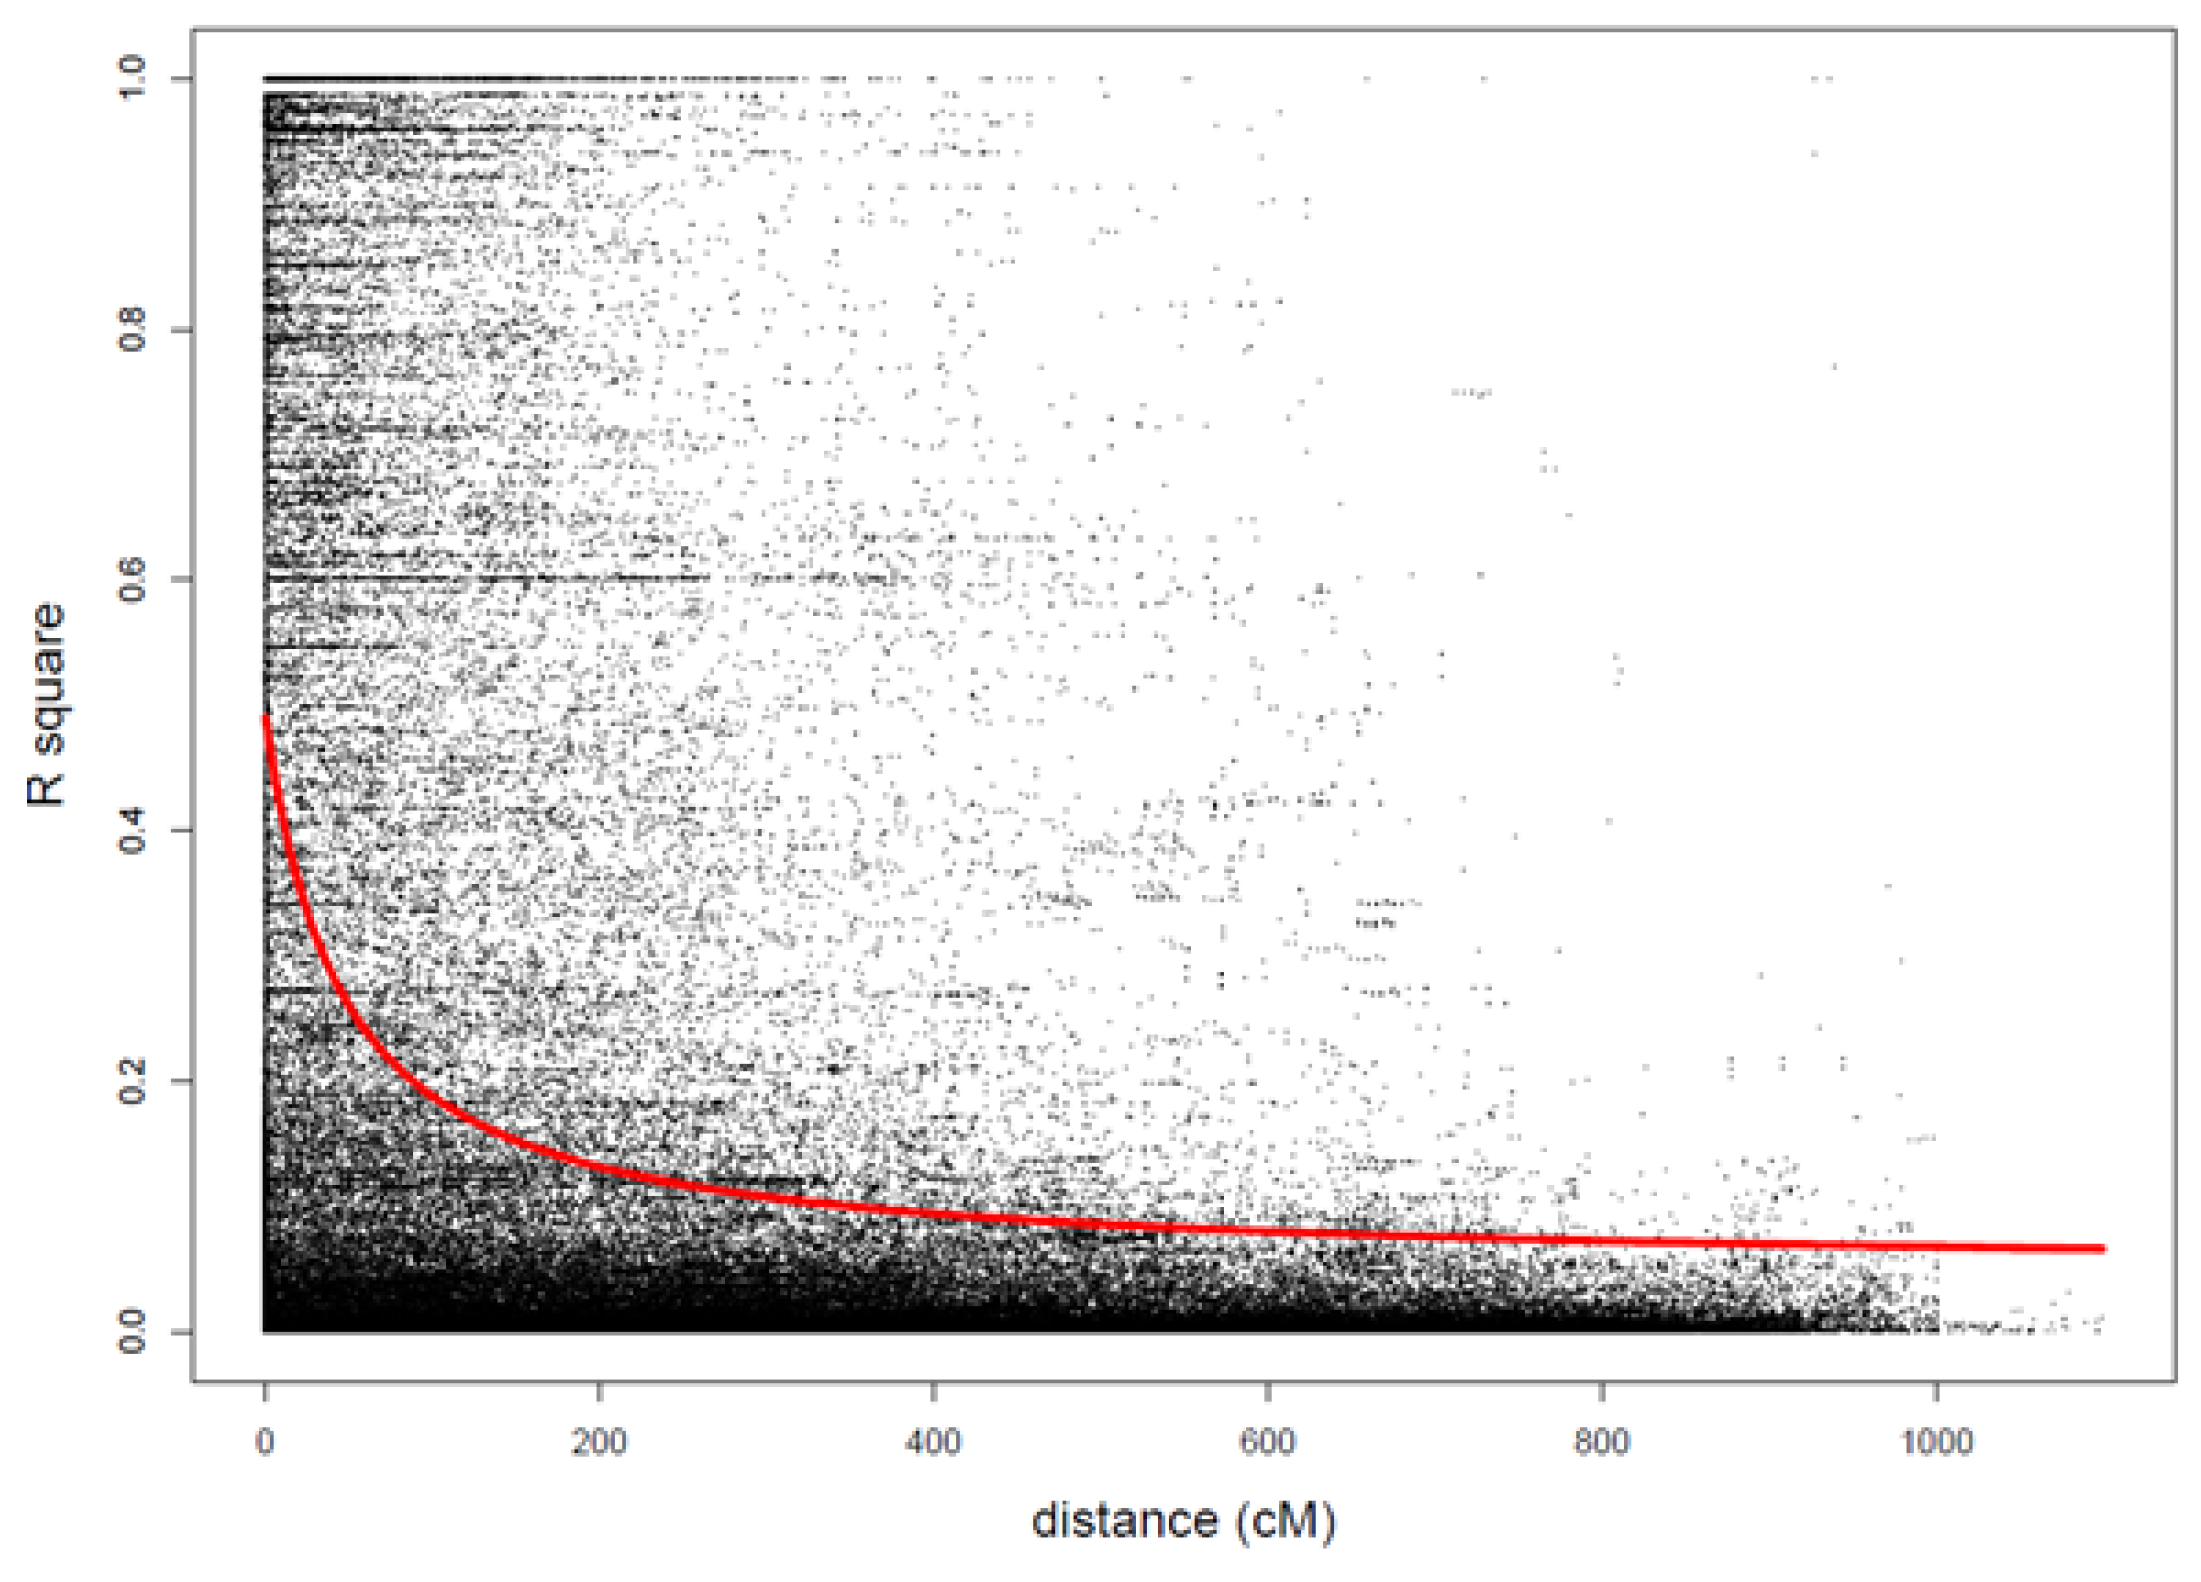
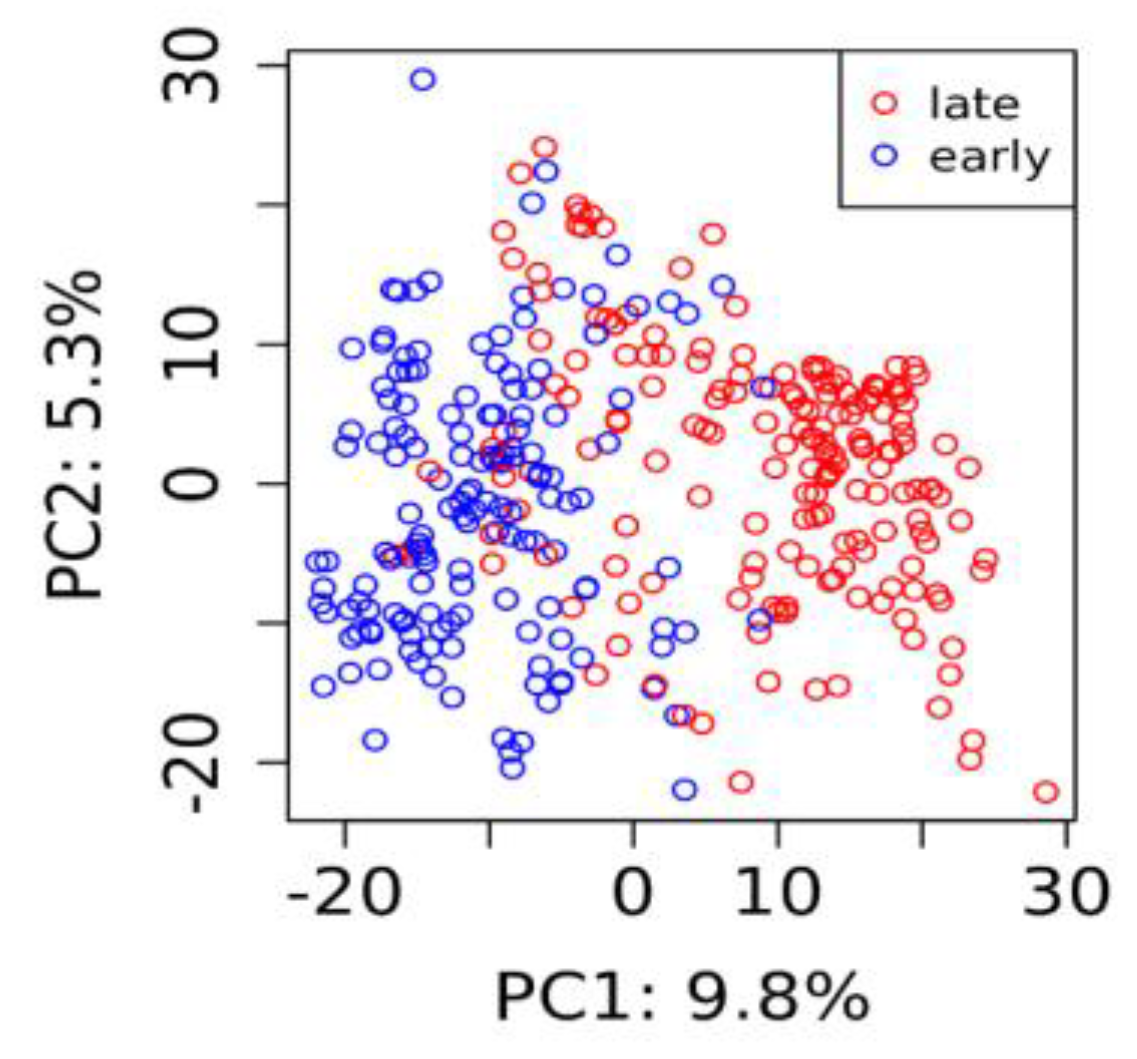
3.2. Genotypes and Population Structure

The rate of linkage disequilibrium (LD) decay was visualized by plotting the pairwise LD within a chromosome against the distance between the two markers (Figure 2). Based on the computed nonlinear regression, the distance when r2 fell below the commonly used 0.3 threshold was 35 cM.
Principle component analysis (PCA) was used as an approximation of population structure (Figure 3). The first principal component explained 9.8%, and the second 5.3% of the total variation. The sum of the first six principal components was 29.7%. The material clustered into early and late maturity groups on the first PC.

3.3. Heritability Estimates and Correlations Between Traits

The broad-sense heritability estimates were computed for each trial (Table 2) and across trials (Table 1). Two trials were removed from Fusarium-infected kernels data due to a low heritability estimate (less than 0.3). Otherwise, considerable differences between trials were found: the estimates varied between 0.31 and 0.72. Mostly, the lower estimates were connected to a lower Fusarium head blight (FHB) infection level (e.g., DON_Jok 2015 and Jok2018a, and GC_Jok2015). Comparatively, for qFUSG, the level of infection did not seem to affect the heritability estimate. The heritability estimates computed across trials were higher for agronomic traits than for FHB resistance-related traits. From the FHB resistance-related traits, germination capacity had the highest and qFUSG the lowest estimates.
Variance components were estimated, and narrow-sense heritabilities based on the estimates were computed. Agronomic traits showed higher heritability (0.45–0.56) compared to resistance-related traits (0.04–0.19) (Table 3). Genotypic and phenotypic correlations were computed with pairwise mixed models for each combination. As expected, germination capacity showed a negative genetic correlation (−0.63 and −0.45) and Fusarium-infected kernels a positive genetic correlation (0.57 and 0.66) with DON content and qFUSG, respectively. Germination capacity and Fusarium-infected kernels had a considerable negative correlation (−0.88). Genetic correlations between agronomic traits and DON content were not prominent, except for plant height and qFUSG, which had a notable negative correlation (−0.45). Phenotypic correlations were closer to zero, i.e., weaker, than the genetic correlations.

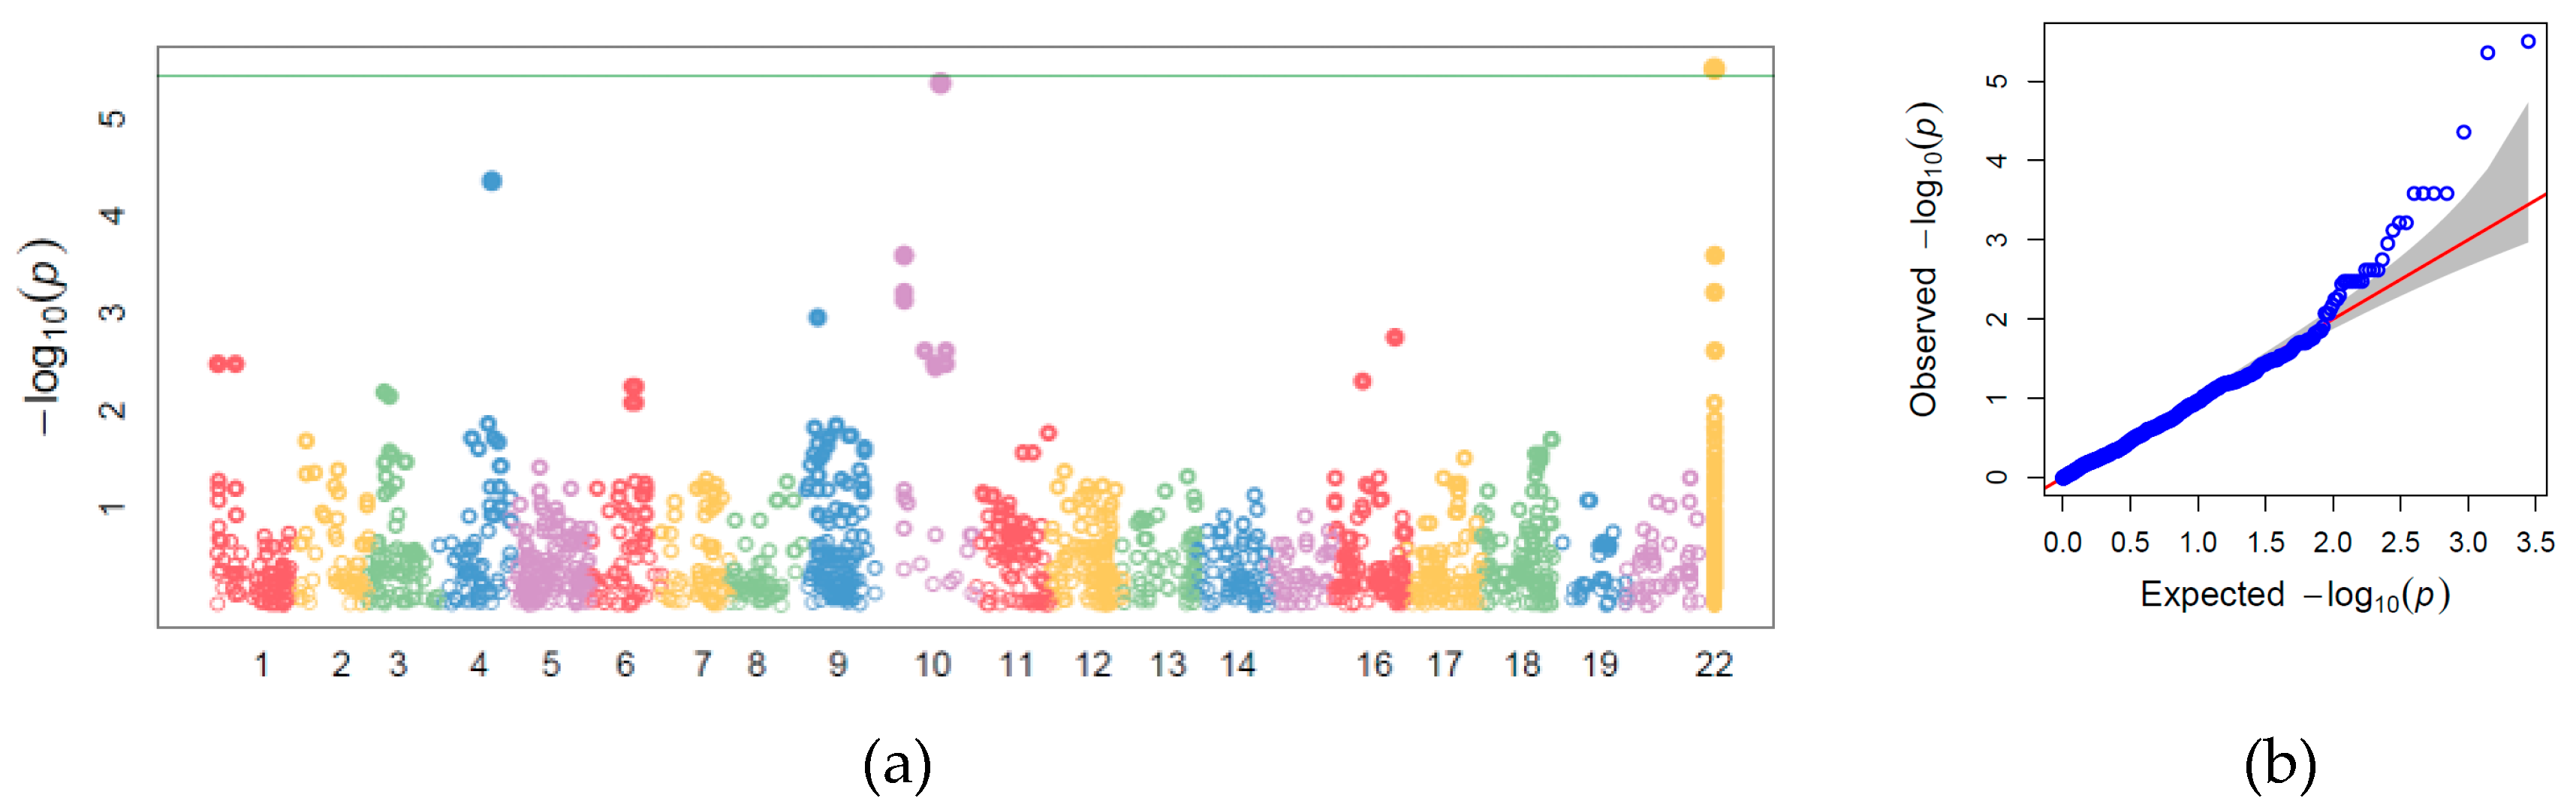
3.4. Genome-wide Association Study

The number of PCs to correct for the population structure was tested prior to GWAS. According to the BIC values for maturity class and germination capacity, the first PC should be added as a covariate. For the remaining traits, the model without PC was the best. The scree plot of the percentage of variation explained by each PC showed a level off after the sixth PC (data not shown). As a compromise, three PCs were added as covariates for each trait, when the population structure was accounted for.
Four statistical models were computed in order to find marker–trait associations for FHB resistance-related and agronomic traits (Table 4). Manhattan plot and quantile–quantile (q–q) plots for each trait are presented in Supplementary 2, Figures S1–S11. The naïve model, which did not include the K matrix or population structure, showed a substantial number of significant SNPs for all the traits (Table 4). When the population structure was considered, agronomic traits still had a large amount of associations, whereas resistance-related traits had less (three for germination capacity and 29 for qFUSG18). Associations were significantly reduced when cryptic relatedness was added into the model (only three for maturity class). With the QK model, no associations were detected. In the q–q plots, the observed −log(p-values) should follow the distribution of the expected −log(p-values), and in the case of significant association, a departure from the expected line at the highest values. Generally, q–q plots showed a strong deviation from the expected distribution when the K matrix was not included in the model. A high degree of relatedness may partly explain the large amounts of associations and the strong deviation from the line in q–q plots. Considerable, significant associations were reported for maturity class with the K model (Figure 4). Two out of three significant associations were significant even based on the conservative Bonferroni correction. These two markers (M2425 unmapped and M1103 on chromosome 10D) were highly correlated (r2 = 0.996), which indicates that they exist in the same haplotype block. M2425 and M1103 accounted for 4% each of the phenotypic variability, and the estimated allelic effect was −0.37 for both. The third association (M337) was significant with respect to the FDR corrected p-values (α = 0.05) and was located on chromosome 4C. M337 had correlation of 0.57 with the other two markers. Variability explained by the SNP was 3% and the allelic effect size was –0.29. These marker–trait associations were also significant with the published protocol used to check the analysis.

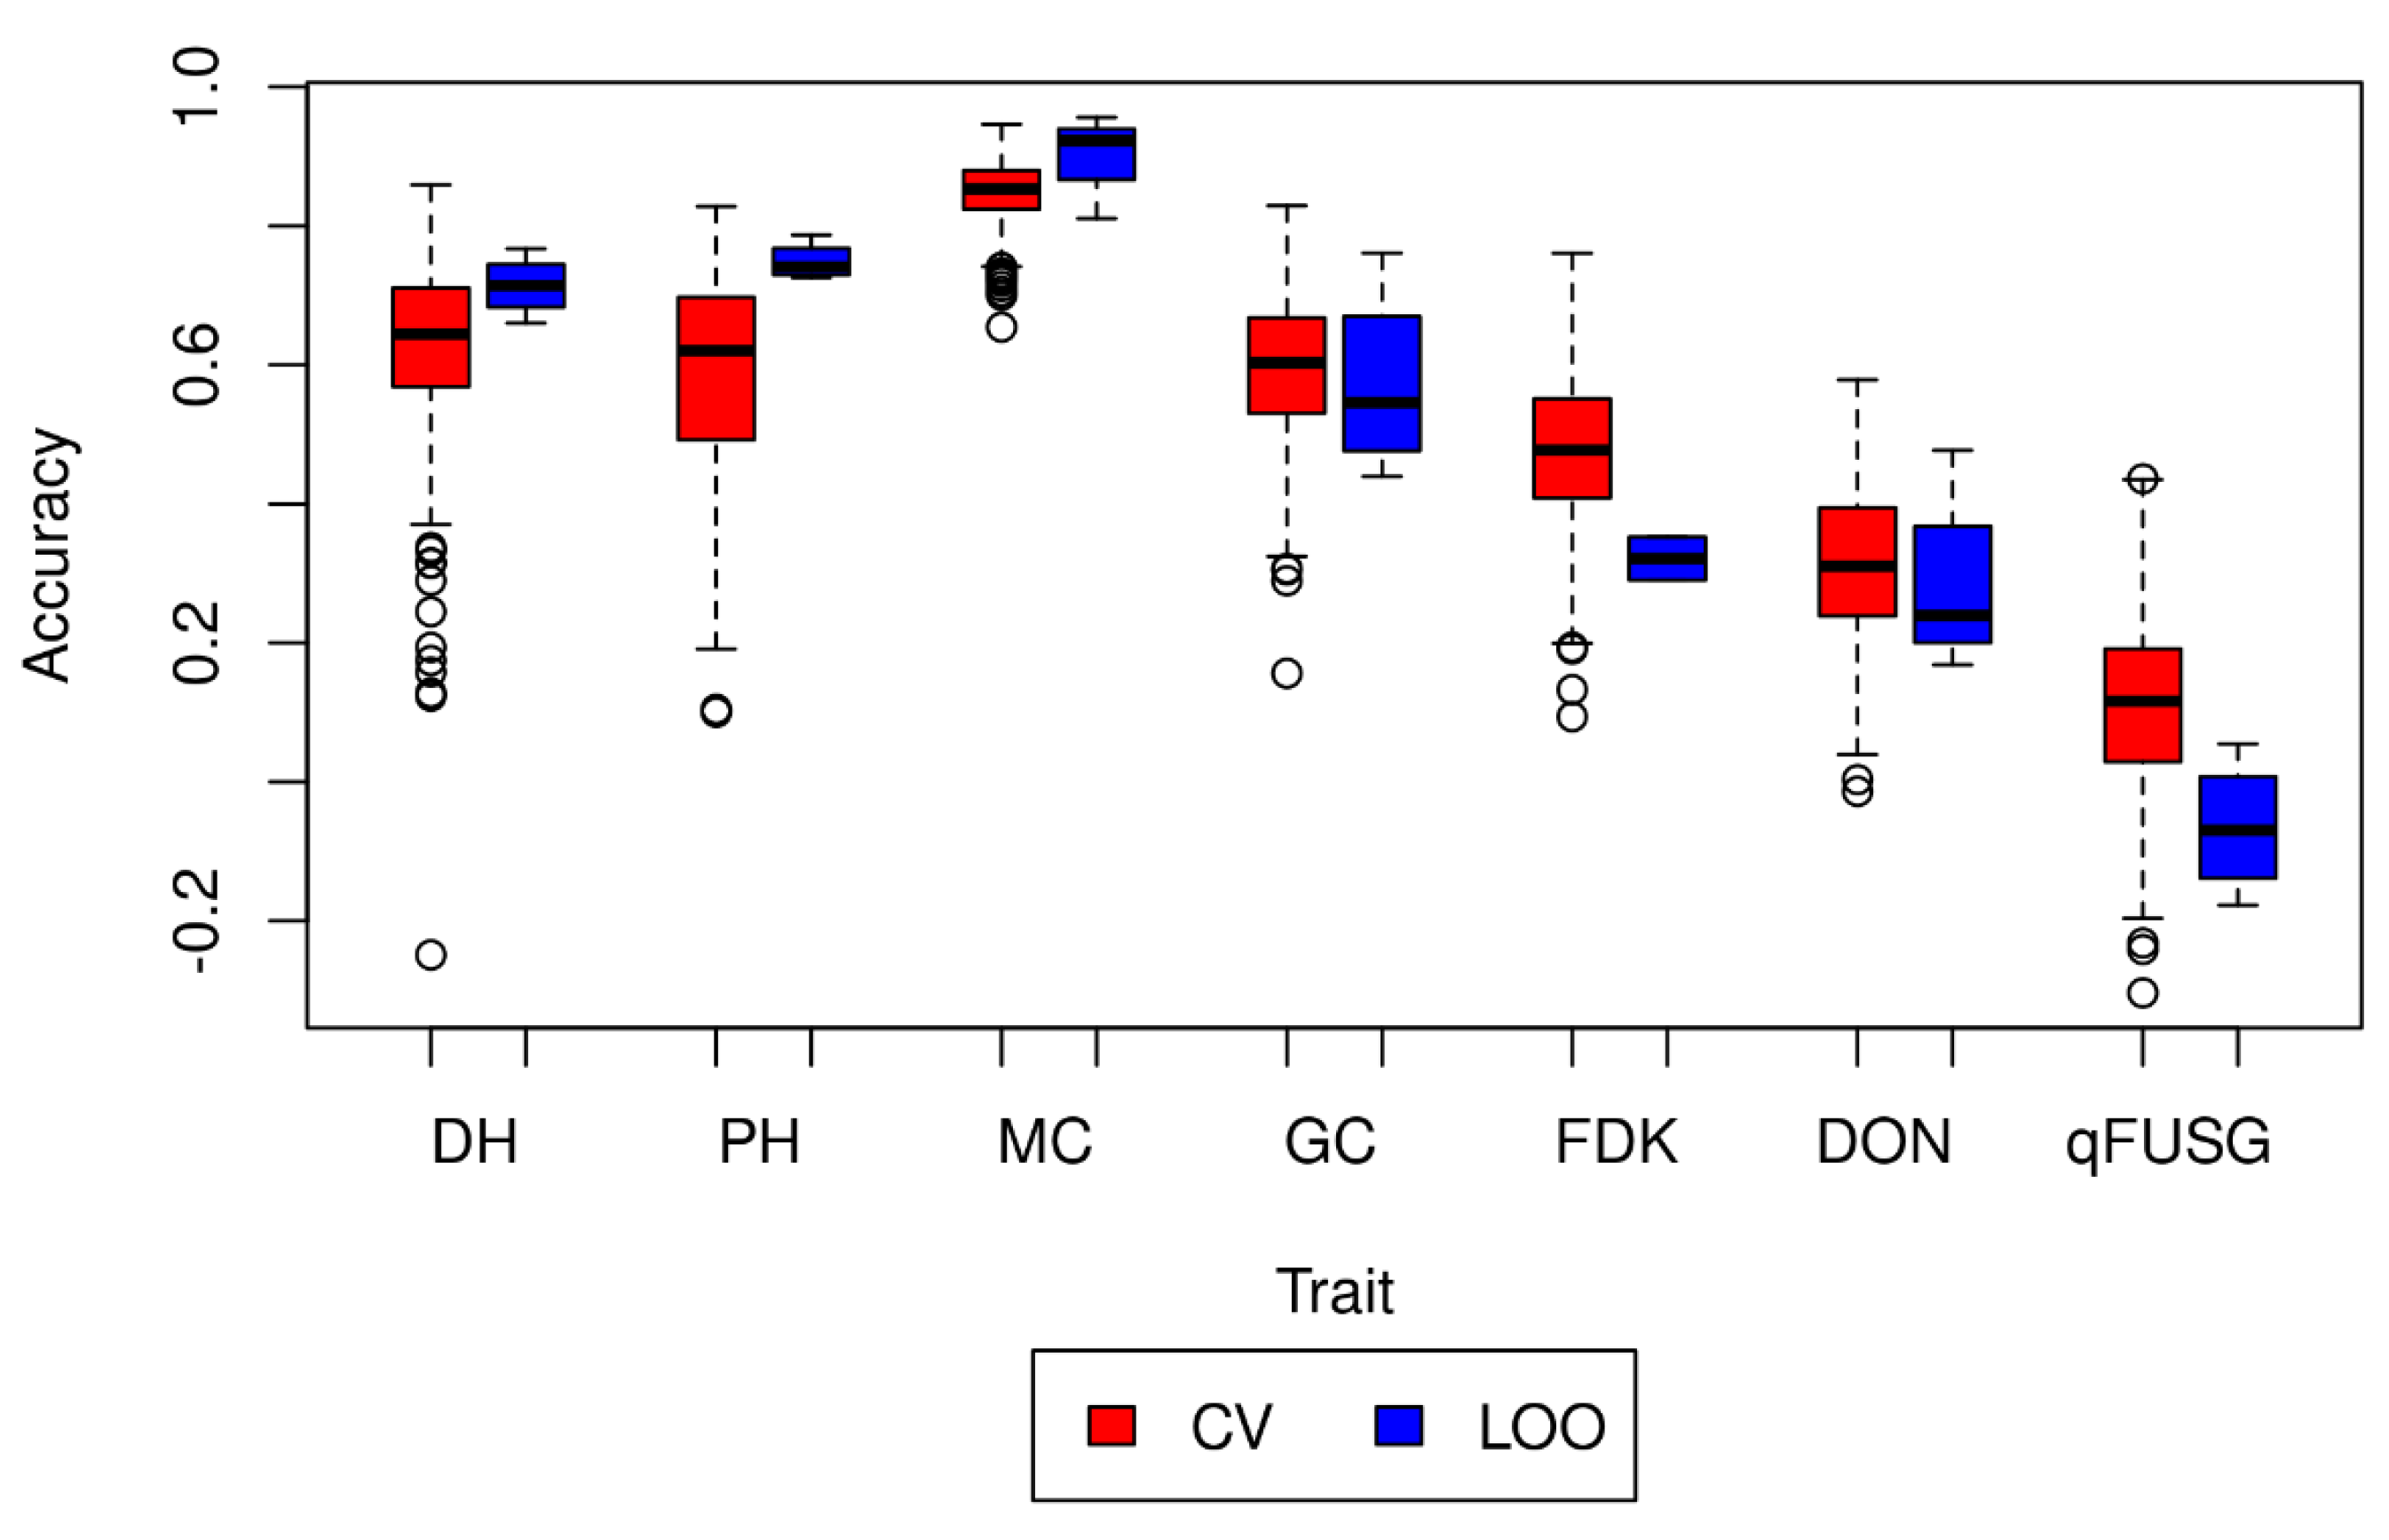
3.5. Prediction Model Validation

Prediction models were validated with two selected schemes, fivefold random cross-validation and leave-one-out. Correlations between predicted and pseudo-phenotypes (CV) or per trial computed BLUEs adjusted for fixed effects (LOO) are presented with boxplots in Figure 5. The accuracies varied substantially between the traits. In the agronomic traits, the maturity class was constant with the highest accuracy for both validation schemes, while plant height and days to heading had a lot of variability in CV, but less in LOO. From resistance-related traits, the highest accuracy in CV was observed in germination capacity and the lowest in qFUSG. The mean of the CV results for each trait was 0.62 (days to heading), 0.59 (plant height), 0.84 (maturity class), 0.59 (germination capacity), 0.47 (Fusarium-infected kernels), 0.31 (DON) and 0.11 (qFUSG); and accordingly, the mean of the LOO results was 0.71 (days to heading), 0.75 (plant height), 0.90 (maturity class), 0.57 (germination capacity), 0.32 (Fusarium-infected kernels), 0.29 (DON) and −0.07 (qFUSG).

4. Discussion

F. graminearum infection causes considerable yield losses, lower germination capacity and accumulated toxin levels in cereals. Many studies about FHB resistance concentrate upon wheat, whereas oat studies are rare. The use of genomic information is crucially important for accelerating breeding for improved resistance towards FHB. In this study, the data set generated in artificially inoculated disease nursery showed no significant associations in GWAS for resistance-related traits. We found no major gene effects for DON or qFUSG to be used directly for breeding purposes; at least the effects were not large enough to be detected with this dataset. Based on this information, the use of genomic prediction might provide a better strategy to enhance resistance breeding by enabling the enriching of small resistance alleles in the breeding material.
The within trial variation for resistance-related traits was substantial. The reported CV% (Table 2) for DON content were on a similar level (CV% mean for DON 42.6%) than found in the study by Yan et al. 2010 [29] (53.3%). The within trial variation makes the records more unreliable. Therefore, a number of observations need to be collected for adequate precision. It may be speculated that because oat has a good type 2 resistance [22,33], and the infection moves slowly from spikelet to spikelet, the differences within a panicle or a row sample can be high in respect to DON accumulation and qFUSG levels. This makes them difficult traits to correct with experimental designs based on variation within the field. Even though the observations for DON content and qFUSG may seem unreliable, the ranking of the check cultivars (not VIR lines), with known a level of resistance, was quite stable (Figure 1). Oat is prone to late tillering, which may have affected the results for some lines. In other words, late tillering may prolong the flowering period and extend the time period of the highest susceptibility, which may have increased unwanted variability. In our study, the most susceptible check was an adapted cultivar, and therefore, we might have missed a very susceptible check, which an unadapted cultivar would maybe have presented [8]. As was seen in the referred study, the photoperiod sensitive reaction might have increased susceptibility of the cultivars originating from the Mid-West. In addition, Nordic material seemed to have mid-range resistance for FHB and DON compared to studied material originating elsewhere. Lack of extreme phenotypes narrows genetic variance and may have lowered our heritability estimates, which may have influenced low success in GWAS and low accuracy in genomic prediction for the DON content and qFUSG. The most exotic lines in the study, VIR lines, were not consistent in their DON content ranking (Figure 1). We speculate that the VIR lines might have been influenced by photoperiodic responses. It was revealed in 2017, when the growing period extended, and trials were exposed to very cool weather late in the season. These conditions could explain differences between trial locations within the same year. Moreover, plausible heterogeneity within a line could have caused some inconsistency in the results as well. Finally, the level of resistance for the tested VIR-lines did not exceed the resistance of the best check cultivar, which is discussed in Hautsalo et al. (under review) [122].
The estimated broad-sense heritabilities varied between trials. Somewhat, the differences were explained by a lower FHB infection level. For example, germination capacity in Jok2015 had the lowest heritability estimate and the highest germination rate compared to the other trials. The high level of germination masked the differences between the lines. The heritability estimates per trial were quite high compared to the across-trial computed estimates. This might be due to the low repeatability of the traits in different years and genotype-by-environment interaction. The differences in germination rate might be due to other issues affecting the germination rate more than the infection level, when the germination rate was high in Jok2015, and therefore, lower the estimate across trials. The narrow-sense heritability estimates for resistance-related traits were low (germination capacity = 0.18, Fusarium-infected kernels = 0.19, DON = 0.12 and qFUSG = 0.04), which can partly be explained by limited data. The genetic correlation between germination capacity and DON content was highly negative (−0.63). A similar phenotypic correlation of the traits was observed in this study (−0.44), as in Tekle et al. 2013 [23] (−0.412 to −0.711). In Norway, selecting for low DON content supplemented with high germination capacity has been applied successfully over >10 years in the oat breeding [8].
A highly positive correlation was found between qFUSG and Fusarium-infected kernels (0.66), which implies that, as they are both measuring the same type of resistance and are both laborious methods of assessing the amount of fungus, only one of them may be needed. Overall, agronomic traits had no prominent correlation with resistance-related traits, except for plant height and qFUSG (−0.45). In the study by Bjørnstad et al. 2017 [8], a negative correlation between FHB (visual symptoms) and plant height was detected, and it was speculated that taller plants may escape some of the infection pressure [7,8,44,48], which is common for wheat. In our study, DON content had a slight negative correlation with plant height and a positive correlation with maturity, which would mean that taller and earlier lines are more resistant toward DON accumulation. These results are in line with previous studies [7,50,51], but not with all [8,48]. Especially, correlation between DON content and maturity are controversial between Finland and Norway. This may be due to the different plant genotypes used in the studies or due to climatic conditions favoring early maturing lines in Finland. In spawn inoculation nursery, early maturing lines are exposed to the infection for a longer time, since inoculant is spread before any of the early maturing lines were flowering. Depending on a year and how much difference there is in the heading of the early and late lines, early lines have more contact to the inoculate. In Finnish growing conditions, however, early and late plant lines may differ very little in their heading date.
Population structure is an important factor in genome-wide association studies, as it can cause false associations between traits and markers [73]. Low stratification was discovered in the studied data set. The first PC did separate the early and late maturing plant lines, but the percentages of variation explained by the first two PCs were rather low (9.8% and 5.3%). The percentages are very close to the results from a previous study in oat (8.9% and 5.5%) [8], where the material consisted of oats from multiple breeding programs. Other studies on population structure in oat have found the same level of variation within the first PCs as well [84,99,123]. In our study, most studied lines were breeding lines from a breeding program, supplemented with a few accessions from the gene bank and other breeding programs. Other published studies contained material from multiple breeding programs, but the level of the variation explained is relatively similar. Generally, there seems to be weak population differentiation within the oat germplasm.
GWAS with mixed linear models showed no significant associations for resistance-related traits, when relationships between tested lines were considered. Based on q–q plots from different models (Supplementary 2), when correcting for relatedness instead of population structure, the distribution of observed −log (p-values) resembled more the distribution of predicted values. Correcting only for population structure seems to be insufficient in our material, and therefore seems to produce an overestimation of associations. On the contrary, correcting with both population structure and relatedness led to underestimation in some cases (e.g., qFUSG), but mostly no obvious change compared to correcting with only kinship. It is possible that our data was not quite adequate for finding significant associations in resistance-related traits which are difficult to measure, and more data need to be generated. In Bjørnstad et al. (2017) [8]. GWAS on oat FHB resistance traits and associations were detected for DON content and visual FHB. A significant and common marker (GMI_ES17_C3969_600) was not close to significance in our material. In their study, tested germplasm contained lines with high susceptibility, which we may have lacked. He et al. (2013) [48] conducted a QTL study on DON and visual FHB for two mapping population. They found a QTL from chromosome 17A/7C, which explained 12.2%–26.6% of the phenotypic variation. In our study, there is a small indication of a peak in the same chromosome for DON, but more clearly for qFUSG, but both are highly speculative. As the correspondence between the chromosomes and map locations is uncertain, and the QTL study was done for two biparental populations, we can only speculate the results. QTLs for DON were as well discovered from chromosomes 5C, 9D, 13A, 14D and unknown_3 in their study. For DON, detected in 2017, there is indication of associations for 5C and 9D, even for the QK model in our study. If a more liberal threshold for significance is chosen (e.g., arbitrary threshold of −log (p-values) = 3), then putative associations can be seen for DON in 3C (DON 2018), 5C (DON 2017), 9D (DON 2017) and for unmapped (DON 2017, DON 2018) markers (indicated as chromosome 22), and for qFUSG 2018 in 2C, 19A and unmapped markers. For Fusarium-infected kernels and germination capacity, there are more distinct indications of associations in chromosome 9D for Fusarium-infected kernels and in chromosomes 8A and 19A for germination capacity. These putative associations should be treated with caution and studied further.
Genomic prediction was applied for both resistance-related and agronomic traits. Cross-validation results for DON content (CV = 0.31 and LOO = 0.29) and Fusarium-infected kernels (CV = 0.47 and LOO = 0.32) are lower than those found in wheat breeding population studies (DON 0.6–0.7 and Fusarium-infected kernels 0.8–0.9) with respectively similar training population size [94]. Most of the genomic selection studies done in wheat measure a visual score of FHB [95,124,125,126], which has proven to be an unreliable measure in oat [8,48,127]. Cross-validated accuracy for germination capacity was the highest among resistance-related traits and presents a potential trait for selecting FHB resistance. As more data is generated and genetic covariances between traits become more accurate, the possibility of using multi-trait or trait-assisted models [128,129], in order to improve the prediction of DON content and qFUSG, should be assessed. Even before the multi-trait prediction approach, use of the disease index should be explored. In wheat, FHB resistance-related traits have been combined successfully with an index [96].
In this study, the analysis was carried out using mostly breeding lines adapted to Nordic climatic and photoperiodic conditions. Bjørnstad et al. 2017 [8] had more diverse material in their study and speculated that photoperiodic sensitivity may have affected the susceptibility of unadapted lines originating from the Midwest. It may be that the variation within our trials was not adequate for the detection of significant associations between SNPs and resistance traits, but at least we discovered that differences in FHB resistance exist and a moderate level of resistance does occur within the studied material. Bjørnstad et al. 2017 [8] as well claimed that Nordic and Canadian originated lines have accumulated resistance, due to higher disease occurrence in the growing area, compared to US originated lines. We are positive that variation within the breeding material is adequate for resistance breeding, and with more data accumulating, GS can be used effectively to enrich resistance alleles within the breeding population. The breeding approach enhanced by genomics is a key to overcome the FHB susceptibility, and lead to accelerated resistance breeding in oat.

Supplementary Materials

The following are available online at https://www.mdpi.com/2073-4395/10/2/174/s1, Supplementary 1. Composition of germplasm collection. Figures S1–S11, GWAS results performed with GAPIT.

Author Contributions

Methodology, H.H. and O.M.; software, H.H.; validation, H.H., and O.M.; formal analysis, H.H.; investigation, H.H.; data curation, J.H., M.J. and L.P.; writing—original draft preparation, H.H.; writing—review and editing, O.M., J.H., M.J., L.P., M.V. and H.H.; supervision, O.M. All authors have read and agreed to the published version of the manuscript.

Funding

This research was funded by Business Finland (former Tekes) 1565/31/2015 and the Ministry of Agriculture and Forestry (Makera) grant number 533/03.01.02/2018.

Acknowledgments

We would like to thank you staff from Boreal Plant Breeding Ltd. and Luke for technical support, especially Luke personnel for the preparation and spreading the inoculum. Without your help, this would not have been possible. Special thanks to Timo Knürr, Esa Teperi, Marika Niskanen and Kirsi Peltoniemi, who answered many questions and provided technical support.

Conflicts of Interest

The authors declare no conflict of interest. H.H., O.M., L.P. and M.V. were hired by Boreal Plant Breeding Ltd.

References

  1. Agency for Rural Affairs (former Finnish food authority). Viljat lajikkeittain 2018. 2018. Available online: https://www.vyr.fi/document/1/735/3d6172b/tilast_cfa52da_VYR_viljat_ja_oljykasvit_lajikkeittain_2018.pdf (accessed on 23 October 2019).
  2. Marshall, A.; Cowan, S.; Edwards, S.; Griffiths, I.; Howarth, C.; Langdon, T.; White, E. Crops that feed the world 9. Oats-A cereal crop for human and livestock feed with industrial applications. Food Secur. 2013, 5, 13–33. [Google Scholar] [CrossRef]
  3. Hietaniemi, V.; Kontturi, M.; Rämö, S.; Eurola, M.; Kangas, A.; Niskanen, M.; Saastamoinen, M. Contents of trichothecenes in oats during official variety, organic cultivation and nitrogen fertilization trials in Finland. Agric. Food Sci. 2004, 13, 54–67. [Google Scholar] [CrossRef]
  4. Hietaniemi, V.; Rämö, S.; Yli-Mattila, T.; Jestoi, M.; Peltonen, S.; Kartio, M.; Sieviläinen, E.; Koivisto, T.; Parikka, P. Updated survey of Fusarium species and toxins in Finnish cereal grains. Food Addit. Contam. Part 2016, 33, 831–848. [Google Scholar] [CrossRef] [PubMed]
  5. Elen, O.; Liu, W.; Langseth, W.; Skinnes, H.; Gullord, M.; Sundheim, L. Deoxynivalenol content of cereal grain from naturally infected and artificially inoculated plants in field trials in Norway. Acta Agric. Scand. Sect. B-Soil Plant Sci. 2003, 53, 183–189. [Google Scholar] [CrossRef]
  6. Langseth, W.; Elen, O. Differences between barley, oats and wheat in the occurrence of deoxynivalenol and other trichothecenes in Norwegian grain. J. Phytopathol. 1996, 144, 113–118. [Google Scholar] [CrossRef]
  7. Langseth, W.; Høie, R.; Gullord, M. The influence of cultivars, location and climate on deoxynivalenol contamination in Norwegian oats 1985–1990. Acta Agric. Scand. Sect. B-Soil Plant Sci. 1995, 45, 63–67. [Google Scholar] [CrossRef]
  8. Bjørnstad, Å.; He, X.; Tekle, S.; Klos, K.; Huang, Y.; Tinker, N.A.; Dong, Y.; Skinnes, H. Genetic variation and associations involving Fusarium head blight and deoxynivalenol accumulation in cultivated oat (Avena sativa L.). Plant Breed. 2017, 136, 620–636. [Google Scholar] [CrossRef]
  9. Gagkaeva, T.; Gavrilova, O.; Yli-Mattila, T.; Loskutov, I. Sources of resistance to Fusarium head blight in VIR oat collection. Euphytica 2013, 191, 355–364. [Google Scholar] [CrossRef]
  10. Lindblad, M.; Börjesson, T.; Hietaniemi, V.; Elen, O. Statistical analysis of agronomical factors and weather conditions influencing deoxynivalenol levels in oats in Scandinavia. Food Addit. Contam. Part 2012, 29, 1566–1571. [Google Scholar] [CrossRef]
  11. Nielsen, L.; Jensen, J.; Nielsen, G.; Jensen, J.; Spliid, N.; Thomsen, I.; Justesen, A.; Collinge, D.; Jørgensen, L. Fusarium head blight of cereals in Denmark: Species complex and related mycotoxins. Phytopathology 2011, 101, 960–969. [Google Scholar] [CrossRef] [Green Version]
  12. Schollenberger, M.; Müller, H.-M.; Rüfle, M.; Suchy, S.; Plank, S.; Drochner, W. Natural occurrence of 16 Fusarium toxins in grains and feedstuffs of plant origin from Germany. Mycopathologia 2006, 161, 43–52. [Google Scholar] [CrossRef] [PubMed]
  13. Müller, H.; Reimann, J.; Schumacher, U.; Schwadorf, K. Natural occurrence of Fusarium toxins in oats harvested during five years in an area of southwest Germany. Food Addit. Contam. 2001, 15, 801–806. [Google Scholar] [CrossRef] [PubMed]
  14. Edwards, S.G. Fusarium mycotoxin content of UK organic and conventional oats. Food Addit. Contam. Part 2009, 26, 1063–1069. [Google Scholar] [CrossRef] [PubMed] [Green Version]
  15. Scudamore, K.; Baillie, H.; Patel, S.; Edwards, S. Occurrence and fate of Fusarium mycotoxins during commercial processing of oats in the UK. Food Addit. Contam. 2007, 24, 1374–1385. [Google Scholar] [CrossRef]
  16. Yan, W.; Pageau, D.; Martin, R.; Cummiskey, A.; Blackwell, B. Is deoxynivalenol contamination a serious problem for oat in Eastern Canada? Crop Sci. 2016, 57, 88–98. [Google Scholar] [CrossRef]
  17. Tekauz, A.; Fetch, J.; Rossnagel, B.; Savard, M. Progress in assessing the impact of Fusarium head blight on oat in Western Canada and screening of Avena germplasm for resistance. Cereal Res. Commun. 2008, 36, 49–56. [Google Scholar] [CrossRef]
  18. Tekauz, A.; Mccallum, B.; Ames, N.; Fetch, J. Fusarium head blight of oat-Current status in Western Canada. Can. J. Plant Pathol. 2004, 473–479. [Google Scholar] [CrossRef]
  19. Jones, R.; Mirocha, C. Quality parameters in small grains from Minnesota affected by Fusarium head blight. Plant Dis. 1999, 83, 506–511. [Google Scholar] [CrossRef] [Green Version]
  20. Rotter, B.; Thompson, B.; Lessard, M. Effects of deoxynivalenol-contaminated diet on performance and blood parameters in growing swine. Can J. Anim. Sci. 1995, 75, 297–302. [Google Scholar] [CrossRef]
  21. Čonková, E.; Laciaková, A.; Kováč, G.; Seidel, H. Fusarial toxins and their role in animal diseases. Vet J. 2003, 165, 214–220. [Google Scholar] [CrossRef]
  22. Bjørnstad, Å.; Skinnes, H. Resistance to Fusarium infection in oats (Avena sativa L.). Cereal Res. Commun. 2008, 36, 57–62. [Google Scholar] [CrossRef]
  23. Tekle, S.; Skinnes, H.; Bjørnstad, Å. The germination problem of oat seed lots affected by Fusarium head blight. Eur. J. Plant Pathol. 2013, 135, 147–158. [Google Scholar] [CrossRef]
  24. Commission European. Commission regulation (EC) No. 1881/2006 setting maximum levels of certain contaminants in foodstuffs. Offcial J. Eur. Union. 2006, L 364, 5–24. [Google Scholar]
  25. Hofgaard, I.; Aamot, H.; Torp, T.; Jestoi, M.; Lattanzio, V.; Klemsdal, S.; Waalwijk, C.; der Lee, V.T.; Brodal, G. Associations between Fusarium species and mycotoxins in oats and spring wheat from farmers’ fields in Norway over a six-Year period. World Mycotoxin. J. 2016, 9, 365–378. [Google Scholar] [CrossRef]
  26. Fredlund, E.; Gidlund, A.; Olsen, M.; Börjesson, T.; Spliid, N.; Simonsson, M. Method evaluation of Fusarium DNA extraction from mycelia and wheat for down-Stream real-time PCR quantification and correlation to mycotoxin levels. J. Microbiol. Meth. 2008, 73, 33–40. [Google Scholar] [CrossRef] [PubMed]
  27. Waalwijk, C.; Kastelein, P.; de Vries, I.; Kerényi, Z.; van der Lee, T.; Hesselink, T.; Köhl, J.; Kema, G. Major changes in Fusarium spp. in wheat in the Netherlands. Eur. J. Plant Pathol. 2003, 109, 743–754. [Google Scholar] [CrossRef]
  28. Finnish Cereal Committee; Yhteenveto viljan hometoksiiniseurannasta ja tuloksista viime vuosilta sekä tarpeet seurannan kehittämiselle ja hyödyntämiselle. 2015. Available online: https://www.vyr.fi/document/1/63/6ef8d20/viljan_3a17dc4_Turvallisuusraportti_web.pdf (accessed on 23 October 2019).
  29. Yan, W.; Fregeau-Reid, J.; Rioux, S.; Pageau, D.; Xue, A.; Martin, R.; Fedak, G.; de Haan, B.; Lajeunesse, J.; Savard, M. Response of oat genotypes to Fusarium head blight in Eastern Canada. Crop Sci. 2010, 50, 134–142. [Google Scholar] [CrossRef]
  30. Lacey, J.; Teman, G.; Mirocha, C. Effects of infection time and moisture on development of ear blight and deoxynivalenol production by Fusarium spp. in wheat. Ann. Appl. Biol. 1999, 134, 277–283. [Google Scholar] [CrossRef]
  31. Brennan, J.; Egan, D.; Cooke, B.; Doohan, F. Effect of temperature on head blight of wheat caused by Fusarium culmorum and F. graminearum. Plant Pathol. 2005, 54, 156–160. [Google Scholar] [CrossRef]
  32. Doohan, F.M.; Brennan, J.; Cooke, B.M. Influence of climatic factors on Fusarium species pathogenic to cereals. Eur. J. Plant Pathol. 2003, 109, 755–768. [Google Scholar] [CrossRef]
  33. Tekle, S.; Dill-Macky, R.; Skinnes, H.; Tronsmo, A.; Bjørnstad, Å. Infection process of Fusarium graminearum in oats (Avena sativa L.). Eur. J. Plant Pathol. 2012, 132, 431–442. [Google Scholar] [CrossRef]
  34. Parry, D.; Jenkinson, P.; McLeod, L. Fusarium ear blight (scab) in small grain cereals—a review. Plant Pathol. 1995, 44, 207–238. [Google Scholar] [CrossRef]
  35. Hjelkrem, A.-G.; Torp, T.; Brodal, G.; Aamot, H.; Strand, E.; Nordskog, B.; Dill-Macky, R.; Edwards, S.G.; Hofgaard, I. DON content in oat grains in Norway related to weather conditions at different growth stages. Eur. J. Plant Pathol. 2017, 148, 577–594. [Google Scholar] [CrossRef] [Green Version]
  36. Schroeder, H.; Christensen, J. Factors affecting resistance of wheat to scab caused by Gibberella zeae. Phytopathology 1963, 53, 831–838. [Google Scholar]
  37. Tekle, S.; Lillemo, M.; Skinnes, H.; Reitan, L.; Buraas, T.; Bjørnstad, Å. Screening of oat accessions for Fusarium head blight resistance using spawn-Inoculated field experiments. Crop Sci. 2018, 58, 143–151. [Google Scholar] [CrossRef] [Green Version]
  38. Mesterházy, A. Types and components of resistance to Fusarium head blight of wheat. Plant Breed. 1995, 114, 377–386. [Google Scholar] [CrossRef]
  39. Miller, J.; Young, J.; Sampson, D. Deoxynivalenol and Fusarium head blight resistance in spring cereals. J. Phytopathol. 1985, 113, 359–367. [Google Scholar] [CrossRef]
  40. Campbell, H.; Choo, T.; Vigier, B.; Underhill, L. Mycotoxins in barley and oat samples from Eastern Canada. Can. Plant Sci. 2000, 80, 977–980. [Google Scholar] [CrossRef]
  41. Langevin, F.; Eudes, F.; Comeau, A. Effect of trichothecenes produced by Fusarium graminearum during Fusarium head blight development in six cereal species. Eur. J. Plant Pathol. 2004, 110, 735–746. [Google Scholar] [CrossRef]
  42. Misonoo, G. Eological and physiological studies on the blooming of oat flowers. J. Fac. Agric. 1936, 37, 211–337. [Google Scholar]
  43. Percival, J. The Wheat Plant; Duckworth & Co: London, UK, 1921; p. 124. Available online: https://archive.org/details/wheatplantperciv00percrich/page/ (accessed on 23 October 2019).
  44. Loskutov, I.; Blinova, E.; Gavrilova, O.; Gagkaeva, Y.T. The valuable characteristics of oats genotypes and resistance to Fusarium disease. Vavilov J. Genet. Breed. 2016, 20, 286–294. [Google Scholar] [CrossRef] [Green Version]
  45. Gagkaeva, T.; Gavrilova, O.; Yli-Mattila, T.; Loskutov, I. Evaluation of oat germplasm for resistance to Fusarium head blight. Plant Breed. Seed Sci. 2011, 64, 15–22. [Google Scholar] [CrossRef]
  46. Gagkaeva, T.Y.; Gavrilova, O.P.; Orina, A.S.; Blinova, E.V.; Loskutov, I.G. Response of wild Avena species to fungal infection of grain. Crop J. 2017, 5, 499–508. [Google Scholar] [CrossRef]
  47. Rainio, A. Punahome Fusarium roseum link gibberella saubinetii (Mont,) Sacc, ja sen aiheuttamat myrkytykset kaurassa. Valt. Maatal. Julk. 1932, 50. (In Finnish) [Google Scholar]
  48. He, X.; Skinnes, H.; Oliver, R.E.; Jackson, E.W.; Bjørnstad, Å. Linkage mapping and identification of QTL affecting deoxynivalenol (DON) content (Fusarium resistance) in oats (Avena sativa L.). Theor. Appl. Genet. 2013, 126, 2655–2670. [Google Scholar] [CrossRef]
  49. Langseth, W.; Stabbetorp, H. The effect of lodging and time of harvest on deoxynivalenol contamination in barley and oats. J. Phytopathol. 1996, 144, 241–245. [Google Scholar] [CrossRef]
  50. Gavrilova, O.; Gagkaeva, T.; Burkin, A.; Kononenko, G.; Loskutov, I. Susceptibility of Oat Germplasm to Fusarium Infection and Mycotoxin Accumulation in Grains. In Proceedings of the 8th International Oat Conference, Minneapolis, USA, 27 June–2 July 2008; pp. 7–16. [Google Scholar]
  51. Parikka, P.; Hietaniemi, V.; Rämö, S.; Jalli, H. Fusarium infection and mycotoxin contents of oats under different tillage treatments. J. Plant Pathol. 2008, 90 (Suppl. 3). [Google Scholar]
  52. Buerstmayr, H.; Ban, T.; Anderson, J. QTL mapping and marker-assisted selection for Fusarium head blight resistance in wheat: A review. Plant Breed. 2009, 128, 1–26. [Google Scholar] [CrossRef]
  53. Emrich, K.; Wilde, F.; Miedaner, T.; Piepho, H. REML approach for adjusting the Fusarium head blight rating to a phenological date in inoculated selection experiments of wheat. Theor. Appl. Genet. 2008, 117, 65–73. [Google Scholar] [CrossRef]
  54. Lu, Q.; Lillemo, M.; Skinnes, H.; He, X.; Shi, J.; Ji, F.; Dong, Y.; Bjørnstad, Å. Anther extrusion and plant height are associated with Type I resistance to Fusarium head blight in bread wheat line ‘Shanghai-3/Catbird. ’ Theor. Appl. Genet. 2013, 126, 317–334. [Google Scholar] [CrossRef]
  55. Skinnes, H.; Semagn, K.; Tarkegne, Y.; Marøy, A.; Bjørnstad, Å. The inheritance of anther extrusion in hexaploid wheat and its relationship to Fusarium head blight resistance and deoxynivalenol content. Plant Breed. 2010, 129, 149–155. [Google Scholar] [CrossRef]
  56. Strange, R.N.; Smith, H. A fungal growth stimulant in anthers which predisposes wheat to attack by Fusarium graminearum. Physiol. Plant Pathol. 1971, 1, 141–150. [Google Scholar] [CrossRef]
  57. Bjørnstad, Å.; Tekle, S.; Lillemo, M.; Buraas, T.; Reitan, L. Breeding resistant cultivars to reduce mycotoxin risks in oats. In Proceedings of the 10th International Oat Conference, St. Petersburg, Russia, 11–15 July 2016. [Google Scholar]
  58. Stråbø, S. Genetic Variation of Anther Extrusion in Oat and Its Relationship to Fusarium. Master’s Thesis, Norwegian University of Life Sciences, January 2015. [Google Scholar]
  59. Buerstmayr, H.; Legzdina, L.; Steiner, B.; Lemmens, M. Variation for resistance to Fusarium head blight in spring barley. Euphytica 2004, 137, 279–290. [Google Scholar] [CrossRef]
  60. Mesterházy, A.; Lehoczki-Krsjak, S.; Varga, M.; Szabó-Hevér, Á.; Tóth, B.; Lemmens, M. Breeding for FHB resistance via Fusarium damaged kernels and deoxynivalenol accumulation as well as inoculation methods in winter wheat. Agric. Sci. 2015, 06, 970–1002. [Google Scholar] [CrossRef] [Green Version]
  61. Hautsalo, J.; Jalli, M.; Manninen, O.; Veteläinen, M. Evaluation of resistance to Fusarium graminearum in oats. Euphytica 2018, 214, 139. [Google Scholar] [CrossRef]
  62. Mirocha, C.J.; Kolaczkowski, E.; Xie, W.; Yu, H.; Jelen, H. Analysis of deoxynivalenol and its derivatives (batch and single kernel) using gas chromatography/mass spectrometry. J. Agric. Food Chem. 1998, 46, 1414–1418. [Google Scholar] [CrossRef]
  63. Kokkonen, M.K.; Jestoi, M.N. A Multi-Compound LC-MS/MS method for the screening of mycotoxins in grains. Food Anal. Methods 2009, 2, 128–140. [Google Scholar] [CrossRef]
  64. Mesterházy, Á.; Bartók, T.; Mirocha, C.; Komoróczy, R. Nature of wheat resistance to Fusarium head blight and the role of deoxynivalenol for breeding. Plant Breed. 1999, 118, 97–110. [Google Scholar] [CrossRef]
  65. Saiki, R.; Gelfand, D.; Stoffel, S.; Scharf, S.; Higuchi, R.; Horn, G.; Mullis, K.; Erlich, H. Primer-Directed enzymatic amplification of DNA with a thermostable DNA polymerase. Science 1988, 239, 487–491. [Google Scholar] [CrossRef]
  66. Niessen, L. PCR-Based diagnosis and quantification of mycotoxin producing fungi. Int. J. Food Microbiol. 2007, 119, 38–46. [Google Scholar] [CrossRef]
  67. Yli-Mattila, T.; Paavanen-Huhtala, S.; Jestoi, M.; Parikka, P.; Hietaniemi, V.; Gagkaeva, T.; Sarlin, T.; Haikara, A.; Laaksonen, S.; Rizzo, A. Real-time PCR detection and quantification of Fusarium poae, F. graminearum, F. sporotrichioides and F. langsethiae in cereal grains in Finland and Russia. Arch. Phytopathol. Plant Prot. 2008, 41, 243–260. [Google Scholar] [CrossRef]
  68. Fredlund, E.; Gidlund, A.; Pettersson, H.; Olsen, M.; Börjesson, T. Real-Time PCR detection of Fusarium species in Swedish oats and correlation to T-2 and HT-2 toxin content. World Mycotoxin J. 2010, 3, 77–88. [Google Scholar] [CrossRef]
  69. Zhu, C.; Gore, M.; Buckler, E.S.; Yu, J. Status and prospects of association mapping in plants. Plant Genome J. 2008, 1, 5–20. [Google Scholar] [CrossRef]
  70. Thornsberry, J.M.; Goodman, M.M.; Doebley, J.; Kresovich, S.; Nielsen, D.; Edward, B.S. Dwarf8 polymorphisms associate with variation in flowering time. Nat. Genet. 2001, 28, 286–289. [Google Scholar] [CrossRef] [PubMed]
  71. Risch, N.; Merikangas, K. The future of genetic studies of complex human diseases. Science 1996, 273, 1516–1517. [Google Scholar] [CrossRef] [PubMed] [Green Version]
  72. Astle, W.; Balding, D.J. Population structure and cryptic relatedness in genetic association studies. Stat. Sci. 2009, 24, 451–471. [Google Scholar] [CrossRef] [Green Version]
  73. Matthies, I.E.; van Hintum, T.; Weise, S.; Röder, M.S. Population structure revealed by different marker types (SSR or DArT) has an impact on the results of genome-wide association mapping in European barley cultivars. Mol. Breed. 2012, 30, 951–966. [Google Scholar] [CrossRef]
  74. Price, A.L.; Zaitlen, N.A.; Reich, D.; Patterson, N. New approaches to population stratification in genome-Wide association studies. Nat. Rev. Genet. 2010, 11, 459–463. [Google Scholar] [CrossRef] [Green Version]
  75. Crossa, J.; Pérez-Rodríguez, P.; Cuevas, J.; Montesinos-López, O.; Jarquín, D.; de los Campos, G.; Burgueño, J.; González-Camacho, J.M.; Pérez-Elizalde, S.; Beyene, Y.; et al. Genomic selection in plant breeding: Methods, models, and perspectives. Trends Plant Sci. 2017, 22, 961–975. [Google Scholar] [CrossRef]
  76. Meuwissen, T.; Hayes, B.; Goddard, M. Prediction of total genetic value using genome-wide dense marker maps. Genetics 2001, 157, 1819–1829. [Google Scholar]
  77. Heslot, N.; Yang, H.-P.; Sorrells, M.E.; Jannink, J.-L. Genomic selection in plant breeding: A comparison of models. Crop Sci. 2012, 52, 146–160. [Google Scholar] [CrossRef]
  78. Juliana, P.; Singh, R.P.; Singh, P.K.; Crossa, J.; Huerta-Espino, J.; Lan, C.; Bhavani, S.; Rutkoski, J.E.; Poland, J.A.; Bergstrom, G.C.; et al. Genomic and pedigree-based prediction for leaf, stem, and stripe rust resistance in wheat. Theor. Appl. Genet. 2017, 130, 1415–1430. [Google Scholar] [CrossRef] [PubMed] [Green Version]
  79. Rajhathy, T.; Thomas, H. Cytogenetics of Oats (Avena L.); Miscellaneous Publications of the Genetics Society of Canada 2; Wilkes, A., Ed.; The Genetics Society of Canada: Ottawa, Canada, 1976; p. 67. [Google Scholar]
  80. Jellen, E.; Beard, J. Geographical distribution of a chromosome 7C and 17 intergenomic translocation in cultivated oat. Crop Sci. 2000, 400, 256–263. [Google Scholar] [CrossRef]
  81. Chaffin, A.S.; Huang, Y.-F.; Smith, S.; Bekele, W.A.; Babiker, E.; Gnanesh, B.N.; Foresman, B.J.; Blanchard, S.G.; Jay, J.J.; Reid, R.W.; et al. A consensus map in cultivated hexaploid oat reveals conserved grass synteny with substantial subgenome rearrangement. Plant Genome 2016, 9, 2. [Google Scholar] [CrossRef] [Green Version]
  82. Oliver, R.E.; Tinker, N.A.; Lazo, G.R.; Chao, S.; Jellen, E.N.; Carson, M.L.; Rines, H.W.; Obert, D.E.; Lutz, J.D.; Shackelford, I.; et al. SNP discovery and chromosome anchoring provide the first physically-anchored hexaploid oat map and reveal synteny with model species. PLoS ONE 2013, 8, 3. [Google Scholar] [CrossRef]
  83. Newell, M.A.; Asoro, F.G.; Scott, M.P.; White, P.J.; Beavis, W.D.; Jannink, J.-L. Genome-wide association study for oat (Avena sativa L.) beta-glucan concentration using germplasm of worldwide origin. Theor. Appl. Genet. 2012, 125, 1687–1696. [Google Scholar] [CrossRef] [Green Version]
  84. Asoro, F.G.; Newell, M.A.; Scott, P.M.; Beavis, W.D.; Jannink, J.-L. Genome-wide association study for beta-glucan concentration in elite North American oat. Crop Sci. 2013, 53, 542–553. [Google Scholar] [CrossRef] [Green Version]
  85. Klos, K.; Yimer, B.A.; Babiker, E.M.; Beattie, A.D.; Bonman, M.J.; Carson, M.L.; Chong, J.; Harrison, S.A.; Ibrahim, A.M.; Kolb, F.L.; et al. Genome-wide association mapping of crown rust resistance in oat elite germplasm. Plant Genome 2017, 10, 2. [Google Scholar] [CrossRef] [Green Version]
  86. Tumino, G.; Voorrips, R.E.; Morcia, C.; Ghizzoni, R.; Germeier, C.U.; Paulo, M.-J.; Terzi, V.; Smulders, M.J. Genome-wide association analysis for lodging tolerance and plant height in a diverse European hexaploid oat collection. Euphytica 2017, 213, 163. [Google Scholar] [CrossRef]
  87. Tumino, G.; Voorrips, R.E.; Rizza, F.; Badeck, F.W.; Morcia, C.; Ghizzoni, R.; Germeier, C.U.; Paulo, M.-J.; Terzi, V.; Smulders, M.J. Population structure and genome-wide association analysis for frost tolerance in oat using continuous SNP array signal intensity ratios. Theor. Appl. Genet. 2016, 129, 1711–1724. [Google Scholar] [CrossRef] [Green Version]
  88. Liu, S.; Hall, M.D.; Griffey, C.A.; McKendry, A.L. Meta-analysis of QTL associated with Fusarium head blight resistance in wheat. Crop Sci. 2009, 49, 1955–1968. [Google Scholar] [CrossRef]
  89. Huang, Y.; Haas, M.; Heinen, S.; Steffenson, B.J.; Smith, K.P.; Muehlbauer, G.J. QTL mapping of Fusarium head blight and correlated agromorphological traits in an elite barley cultivar Rasmusson. Front Plant Sci. 2018, 9, 1260. [Google Scholar] [CrossRef] [PubMed]
  90. Massman, J.; Cooper, B.; Horsley, R.; Neate, S.; Dill-Macky, R.; Chao, S.; Dong, Y.; Schwarz, P.; Muehlbauer, G.; Smith, K. Genome-wide association mapping of Fusarium head blight resistance in contemporary barley breeding germplasm. Mol. Breed. 2011, 27, 439–454. [Google Scholar] [CrossRef]
  91. Li, T.; Zhang, H.; Huang, Y.; Su, Z.; Deng, Y.; Liu, H.; Mai, C.; Yu, G.; Li, H.; Yu, L.; et al. Effects of the Fhb1 gene on Fusarium head blight resistance and agronomic traits of winter wheat. Crop J. 2019. [Google Scholar] [CrossRef]
  92. Su, Z.; Bernardo, A.; Tian, B.; Chen, H.; Wang, S.; Ma, H.; Cai, S.; Liu, D.; Zhang, D.; Li, T.; et al. A deletion mutation in TaHRC confers Fhb1 resistance to Fusarium head blight in wheat. Nat. Genet. 2019, 51, 1099–1105. [Google Scholar] [CrossRef] [PubMed]
  93. Rawat, N.; Pumphrey, M.O.; Liu, S.; Zhang, X.; Tiwari, V.K.; Ando, K.; Trick, H.N.; Bockus, W.W.; Akhunov, E.; Anderson, J.A.; et al. Wheat Fhb1 encodes a chimeric lectin with agglutinin domains and a pore-forming toxin-like domain conferring resistance to Fusarium head blight. Nat. Genet. 2016, 48, 1576–1580. [Google Scholar] [CrossRef]
  94. Arruda, M.P.; Brown, P.J.; Lipka, A.E.; Krill, A.M.; Thurber, C.; Kolb, F.L. Genomic selection for predicting head blight resistance in a wheat breeding program. Plant Genome 2015, 8, 3. [Google Scholar] [CrossRef] [Green Version]
  95. Jiang, Y.; Schulthess, A.; Rodemann, B.; Ling, J.; Plieske, J.; Kollers, S.; Ebmeyer, E.; Korzun, V.; Argillier, O.; Stiewe, G.; et al. Validating the prediction accuracies of marker-assisted and genomic selection of Fusarium head blight resistance in wheat using an independent sample. Theor. Appl. Genet. 2017, 130, 471–482. [Google Scholar] [CrossRef]
  96. Rutkoski, J.; Benson, J.; Jia, Y.; Brown-Guedira, G.; Jannink, J.-L.; Sorrells, M. Evaluation of genomic prediction methods for Fusarium head blight resistance in wheat. Plant Genome J. 2012, 5, 51–61. [Google Scholar] [CrossRef] [Green Version]
  97. Mirdita, V.; Liu, G.; Zhao, Y.; Miedaner, T.; Longin, F.C.; Gowda, M.; Mette, M.; Reif, J.C. Genetic architecture is more complex for resistance to Septoria tritici blotch than to Fusarium head blight in Central European winter wheat. BMC Genom. 2015, 16, 430. [Google Scholar] [CrossRef] [Green Version]
  98. Haikka, H.; Knürr, T.; Manninen, O.; Pietilä, L.; Isolahti, M.; Teperi, E.; Mäntysaari, E.; Stranden, I. Genomic prediction of grain yield in commercial Finnish oat (Avena sativa L.) and barley (Hordeum vulgare L.) breeding programs. Plant Breed 2020. [Google Scholar] [CrossRef]
  99. Asoro, F.G.; Newell, M.A.; Beavis, W.D.; Scott, P.M.; Jannink, J.-L. Accuracy and training population design for genomic selection on quantitative traits in elite North American oats. Plant Genome J. 2011, 4, 132–144. [Google Scholar] [CrossRef] [Green Version]
  100. Endelman, J.B. Ridge regression and other kernels for genomic selection with R package rrBLUP. Plant Genome J. 2011, 4, 250–255. [Google Scholar] [CrossRef] [Green Version]
  101. Hill, W.G.; Weir, B.S. Variances and covariances of squared linkage disequilibria in finite populations. Theor. Popul. Biol. 1988, 33, 54–78. [Google Scholar] [CrossRef]
  102. R core team. R: A Language and Environment for Statistical Computing. 2017. Available online: https://www.R-project.org (accessed on 19 December 2019).
  103. Fabio Marroni’s Blog Post. Available online: https://fabiomarroni.wordpress.com/2011/08/09/estimate-decay-of-linkage-disequilibrium-with-distance/ (accessed on 21 December 2019).
  104. Williams, E.R.; Matheson, A.C.; Harwood, C.E. Experimental Design and Analysis for Tree Improvement, 2nd ed; CSIRO Publishing: Collingwood, Australia, 2002; pp. 132–135. [Google Scholar]
  105. Zadoks, J.; Chang, T.; Konzak, C. A decimal code for the growth stages of cereals. Weed Res. 1974, 14, 415–421. [Google Scholar] [CrossRef]
  106. Parikka, P.; Hietaniemi, V.; Rämö, S.; Jalli, H. The effect of cultivation practices on Fusarium langsethiae infections of oats and barley. In Proceedings of the COST SUSVAR Fusarium Workshop: Fusarium Diseases in Cereals—Potential Impact from Sustainable Cropping Systems; Velence, Hungary, 1–2 June 2007, Vogelgsang, S., Jalli, M., Kovács, G., Vida, G., Eds.;
  107. Nelson, P.; Toussoun, T.; Marasas, W. Fusarium Species, an Illustrated Manual for Identification; Pennsylvania State University Press: University Park, PA, USA, 1983. [Google Scholar]
  108. Divon, H.; Razzaghian, J.; Udnes-Aamot, H.; Klemsdal, S. Fusarium langsethiae (Torp and Nirenberg), investigation of alternative infection routes in oats. Eur. J. Plant Pathol. 2012, 132, 147–161. [Google Scholar] [CrossRef]
  109. IBM. SPSS Statistics for Windows, Version 25.0; IBM Corp: Armonk, NY, USA, 2017. [Google Scholar]
  110. Piepho, H.-P.; Möhring, J. Computing heritability and selection response from unbalanced plant breeding trials. Genetics 2007, 177, 1881–1888. [Google Scholar] [CrossRef] [Green Version]
  111. Schmidt, P.; Hartung, J.; Bennewitz, J.; Piepho, H.-P. Heritability in plant breeding on a genotype-difference basis. Genetics 2019, 212, 991–1008. [Google Scholar] [CrossRef]
  112. Lipka, A.E.; Tian, F.; Wang, Q.; Peiffer, J.; Li, M.; Bradbury, P.J.; Gore, M.A.; Buckler, E.S.; Zhang, Z. GAPIT: Genome association and prediction integrated tool. Bioinformatics 2012, 28, 2397–2399. [Google Scholar] [CrossRef] [Green Version]
  113. Zhang, Z.; Todhunter, R.; Buckler, E.; Vleck, V.L. Technical note: Use of marker-based relationships with multiple-trait derivative-free restricted maximal likelihood. J. Anim. Sci. 2007, 85, 881–885. [Google Scholar] [CrossRef]
  114. Isidro-Sánchez, J.; Akdemir, D.; Montilla-Bascón, G. Genome-wide association analysis using R. In Oat Methods and Protocols; Methods in Molecular Biology 1536; Gasparis, S., Ed.; Springer Nature: New York, USA, 2017; pp. 189–208. [Google Scholar]
  115. Bates, D.; Mächler, M.; Bolker, B.M.; Walker, S.C. Fitting linear mixed-effects models using lme4. J. Stat. Softw. 2015, 67, 1–48. [Google Scholar] [CrossRef]
  116. VanRaden, P.M. Efficient methods to compute genomic predictions. J. Dairy Sci. 2008, 91, 4414–4423. [Google Scholar] [CrossRef] [PubMed] [Green Version]
  117. User Manual for GAPIT. Available online: http://www.zzlab.net/GAPIT/gapit_help_document.pdf (accessed on 23 October 2019).
  118. Benjamini, Y.; Hochberg, Y. Controlling the false discovery rate: A practical and powerful approach to multiple testing. J. R. Stat. Soc. Ser. B Methodol. 1995, 57, 289–300. [Google Scholar] [CrossRef]
  119. Jensen, J.; Mäntysaari, E.A.; Madsen, P.; Thompson, R. Residual maximum likelihood estimation od (co) variance components in multivariate mixed linear models using average information. J. Indian Soc. Agr. Stat. 1997, 49, 215–236. [Google Scholar]
  120. Madsen, P.; Su, G.; Labouriau, R.; Christensen, O.F. Users Guide to DMU-A Package for Analyzing Multivariate Mixed Models; University of Aarhus, Tjele, Denmark, 2013. Available online: http://dmu.agrsci.dk (accessed on 19 December 2019).
  121. MiX99 Development Team. MiX99: A Software Package for Solving Large Mixed Model Equations; VIII/2015; Natural Resources Institute Finland (Luke): Jokioinen, Finland, 2015; Available online: http://www.luke.fi/mix99 (accessed on 19 December 2019).
  122. Hautsalo, J.; Jauhiainen, L.; Hannukkala, A.; Manninen, O.; Veteläinen, M.; Pietilä, L.; Peltoniemi, K.; Jalli, M. Resistance to DON accumulation in oats based on analyses of multiple field and greenhouse studies. under review.
  123. Klos, K.; Huang, Y.-F.; Bekele, W.A.; Obert, D.E.; Babiker, E.; Beattie, A.D.; Bjørnstad, Å.; Bonman, M.J.; Carson, M.L.; Chao, S.; et al. Population genomics related to adaptation in elite oat germplasm. Plant Genome 2016, 9, 1–12. [Google Scholar]
  124. Hoffstetter, A.; Cabrera, A.; Huang, M.; Sneller, C. Optimizing training population data and validation of genomic selection for economic traits in soft winter wheat. G3 Genes Genomes Genet. 2016, 6, 2919–2928. [Google Scholar] [CrossRef] [Green Version]
  125. Zwart, R.S.; Muylle, H.; Bockstaele, E.; Roldán-Ruiz, I. Evaluation of genetic diversity of Fusarium head blight resistance in European winter wheat. Theor. Appl. Genet. 2008, 117, 813–828. [Google Scholar] [CrossRef] [Green Version]
  126. Herter, C.; Ebmeyer, E.; Kollers, S.; Korzun, V.; Würschum, T.; Miedaner, T. Accuracy of within- and among-Family genomic prediction for Fusarium head blight and Septoria tritici blotch in winter wheat. Theor. Appl. Genet. 2019, 132, 1121–1135. [Google Scholar] [CrossRef]
  127. Liu, W.; Elen, O.N.; Sundheim, L.; Langseth, W.; Skinnes, H. Comparison of visual head blight ratings, seed infection levels, and deoxynivalenol production for assessment of resistance in cereals inoculated with Fusarium culmorum. Eur. J. Plant Pathol. 1997, 103, 589–595. [Google Scholar] [CrossRef]
  128. Schulthess, A.W.; Zhao, Y.; Longin, F.C.; Reif, J.C. Advantages and limitations of multiple-trait genomic prediction for Fusarium head blight severity in hybrid wheat (Triticum aestivum L.). Theor. Appl. Genet. 2018, 131, 685–701. [Google Scholar] [CrossRef]
  129. Fernandes, S.B.; Dias, K.O.; Ferreira, D.F.; Brown, P.J. Efficiency of multi-trait, indirect, and trait-assisted genomic selection for improvement of biomass sorghum. Theor. Appl. Genet. 2018, 131, 747–755. [Google Scholar] [CrossRef] [PubMed] [Green Version]
Figure 1. Distributions for deoxynivalenol (DON) content (a) and for qFUSG, (relative amount of F. graminearum fungus DNA (pg) per oat DNA (100 ng)) (b) for each field trial (Jok=Jokioinen and Lau=Laukaa). Check cultivars, Niklas (N, moderate resistance), Belinda (B, intermediate resistance) and Mirella (M, susceptible), are pointed out with arrows to observed value for each marked cultivar. Respective DON response for the marker cultivars in each trial: Jok2015 Niklas 0.28, Belinda 0.61 and Mirella 1.1, Jok2016 Niklas 2.1, Belinda 3.2 and Mirella 5.8, Jok2017 Niklas 16.6, Belinda 18.2 and Mirella 40.4, Jok2018a Belinda 1.3, Jok2018b Niklas 1.6, Belinda 6.7 and Mirella 3.8, Lau2016 Niklas 8.0, Belinda 7.8 and Mirella 34.4, and Lau2017 Niklas 10.4, Belinda 45.5 and Mirella 63.3. Respective gFUSG response for marker cultivars in each trial: Jok2018a Belinda 7.2, Jok2018b Niklas 8.4, Belinda 24.3 and Mirella 8.4, and Lau2017 Niklas 200, Belinda 166 and Mirella 285. VIR accessions are indicated accordingly VIR 6963 (V1), VIR 7766 (V2), VIR 7934 (V3) and VIR 8479 (V4) in the trials where they were tested.
Agronomy 10 00174 g001
Figure 2. Decay of the linkage disequilibrium (LD) (r2) is presented for the 2785 markers used in the analysis. The figure presents r2 LD for each marker pair within chromosomes plotted against their distance (cM). The red line is the nonlinear regression line based on Hill and Weir [101].
Agronomy 10 00174 g002
Figure 3. Principle component analysis (PCA) for the tested plant lines with 2785 single-nucleotide polymorphism (SNP) markers. The coloring indicates early (blue) and late (red) maturing lines.
Agronomy 10 00174 g003
Figure 4. Marker–trait associations for maturity class (MC) (a) Manhattan plot, where the green line represents the Bonferroni-corrected significance level. The X-axis describes the chromosome numbers (1 = 1C, 2 = 2C, 3 = 3C, 4 = 4C, 5 = 5C, 6 = 6C, 7 = 7C−17A, 8 = 8A, 9 = 9D, 10 = 10D, 11 = 11A, 12 = 12D, 13 = 13A, 14 = 14D, 15 = 15A, 16 = 16A, 18 = 18D, 19 = 19A, 20 = 20D, 21 = 21D and 22 = unmapped); (b) This q–q plot shows the distributions of observed and expected –log(p-values). Significant associations are the three highest values.
Agronomy 10 00174 g004
Figure 5. The validation results for the two exploited schemes, random fivefold cross-validation (red) and leave-one-out (blue). In CV, material was randomly divided into five folds and replicated for 100 times. In LOO, each trial was assigned as a validation set one at a time. Therefore, LOO boxplots include three to seven validation accuracies depending on the number of trials for each trait. The median is the line in the middle of the boxplot and the box is the interquartile range. The whiskers are 1.5 times the interquartile.
Agronomy 10 00174 g005
Table 1. Traits summarized are DH = Days to heading, PH = Plant height, MC = Maturity class (Maturity class 1 corresponded on average to 92 growing days, while class five to 101 days), GC = Germination capacity, FIKs = Fusarium-infected kernels, DON = deoxynivalenol content and qFUSG = relative amount of F. graminearum fungus DNA (pg) per oat DNA (100 ng). Total number of observations (n obs), number of unique lines (n lines), number of trials (n trials), mean, standard deviation (SD), min and max values are presented for each collected trait. The computed h2 equals to the broad-sense heritability across trials according to Piepho and Möhring (2007) [110].
TraitN ObsN LinesN TrialsMeanSDMinMaxh2
DH506210457.92.6451680.90
PH506210499.77.50691460.89
MC30721033.210.96150.91
GC335209467.514.026970.60
FIK254209243.917.612.791.20.45
DON 179732772.051.44-2.184.660.48
qFUSG 155531544.341.241.556.900.19
1 log-transformed.
Table 2. Descriptive statistics for DON content, qFUSG, Fusarium-infected kernel (FIK) and germination capacity (GC) traits for each trial. Trait_trial describes the trait and location * year of testing, n equals the number of unique lines in the TRIAL, mean is the arithmetic mean, standard deviation (SD) the standard deviation, CV% is the coefficient of variation after the spatial correction, similarly least significant difference (LSD) values corresponds to the values after the spatial correction, with critical level of α = 0.05 and h2 is the broad-sense heritability based on Piepho and Möhring (2007) [110].
Trait_TrialnMeanSDCV%LSD (α = 0.05)h2
DON_Jok2015510.60.463,20.70.41
DON_Jok2016553.61.752.73.00.56
DON_Jok201720020.16.933.811.20.55
DON_Jok2018a1061.30.650.11.10.31
DON_Jok2018b1323.81.655.23.30.49
DON_Lau2016549.83.932.65.20.63
DON_Lau201719938.816.936.022.80.71
qFUSG_Jok2017125133.889.995.3211.20.40
qFUSG_Jok2018a9112.011.958.621.10.54
qFUSG_Jok2018b12915.19.661.617.80.45
qFUSG_Lau2017198289.8174.447.1281.60.59
FIK_Lau20167372.510.417.420.60.51
FIK_Lau201720036.08.827.916.30.46
GC_Jok20156289.94.84.97.10.60
GC_Jok20172968.911.09.810.80.71
GC_Lau20167370.49.69.811.40.72
GC_Lau201720060.59.612.812.50.68
Table 3. Variance components with standard errors and narrow-sense heritabilities (h2) estimated with single-trait model for each trait. ADD equals to the additive genetic variance and RES to the residual variance. Genotypic correlations with confidence interval in parenthesis are presented in the lower triangle. Phenotypic correlations are printed in the upper triangle.
Variance EstimatesCorrelations
TraitADD (SE)RES (SE)h2DHPHMCGCFIKDON1qFUSG 1
DH1.78 (0.31)1.11 (0.09)0.62 0.330.61−0.030.01−0.06−0.09
PH30.4 (4.64)13.2 (1.04)0.700.50 (0.31, 0.68) 0.28−0.03−0.19−0.15−0.20
MC0.32 (0.06)0.13 (0.01)0.710.75 (0.63, 0.87)0.37 (0.17, 0.58) −0.16NA0.060.04
GC21.3 (5.91)47.9 (4.41)0.31−0.10 (−0.43, 0.23)−0.12 (−0.43, 0.18)−0.44 (−0.73, −0.15) −0.58−0.44−0.28
FIK25.1 (8.57)53.3 (6.29)0.320.05 (−0.39, 0.29)−0.26 (−0.55, 0.03)NA−0.88 (−1, −0.66) 0.500.33
DON 10.04 (0.01)0.16 (0.01)0.210.06 (−0.25, 0.36)−0.12 (−0.41, 0.16)0.15 (−0.15, 0.44)−0.63 (−0.90, −0.36)0.57 (0.23, 0.90) 0.38
qFUSG 10.03 (0.01)0.29 (0.02)0.08−0.03 (−0.50, 0.45)−0.45 (−0.84, −0.07)0.11 (−0.32, 0.53)−0.45 (−0.90, 0.01)0.66 (0.28, 1)0.60 (0.28, 0.93)
1 log-transformed.
Table 4. The number of significant associations for each model and for each trait. Significance level was based on false-discovery-rate (FDR)-adjusted p-values (α = 0.10).
TraitNaiveQKQK
DH55325300
PH33230300
MC197034930
QC1121300
FIK884000
DON 1310000
DON17956000
DON180000
qFUSG 10000
qFUSG17132000
qFUSG185342900
1 log-transformed.

