Climate Change May Imperil Tea Production in the Four Major Tea Producers According to Climate Prediction Models


1
School of Environmental and Rural Science, University of New England, Armidale 2351, Australia
2
Faculty of Animal Science and Export Agriculture, Uva Wellassa University, Passara Road, Badulla 90000, Sri Lanka
*
Author to whom correspondence should be addressed.
Agronomy 2020, 10(10), 1536; https://doi.org/10.3390/agronomy10101536
Submission received: 5 September 2020
/
Revised: 4 October 2020
/
Accepted: 5 October 2020
/
Published: 9 October 2020
(This article belongs to the Section Precision and Digital Agriculture)
Abstract
:The threat of accelerating climate change on species distribution now and in the future is a topic of increasing research interest. However, little work has been undertaken to assess how shifting climates will affect the suitability of tea cultivation. Therefore, we used MaxEnt modelling to project the impact of current and future climatic scenarios on the potential distribution of tea across the four tea-producing countries of China, India, Kenya and Sri Lanka. Projections were made for the years 2050 and 2070 with three Representative Concentration Pathways (RCPs) using seven bioclimatic predictors under three global circulation models (GCMs). The current and future habitat suitability for tea predicted by the models produced a high accuracy rate, with high areas under the receiver operating characteristic curve (AUCs) for all tested RCPs under the three GCMs for the four countries. The mean true skill statistic (TSS) values for tea in Sri Lanka, Kenya, India and China were 0.80, 0.91, 0.91, and 0.74, respectively. The kappa values (k) of the current and future models for all four countries ranged from 0.40 to 0.75, which indicates that the overall performance of the model was good. The precipitation seasonality and annual precipitation were found to be the most influential variables in Sri Lanka and India, respectively, while annual mean temperature was the most effective contributor for determining the suitability of habitat for tea in Kenya and China. An important proviso is that some existing tea-growing areas will face reduced suitability for future tea cultivation suggesting that by 2050 there will be a drastic reduction in the optimal suitability by averages of 26.2%, 14%, and 4.7% in Kenya, Sri Lanka and China, respectively. The optimal suitability will be reduced by 15.1%, 28.6% and 2.6% in Kenya, Sri Lanka and China, respectively, by 2070. India displays an advantage in projected future climates as it gains optimal suitability areas of 15% by 2050 and 25% by 2070.

1. Introduction
Tea, the most widely consumed non-alcoholic beverage in the world, is produced from the tender young shoots of Camellia sinensis (L.) O. Kuntze. Global tea production continues to surge dramatically, reaching 5.8 million metric tonnes (t) in 2018 while the export quantity came to about 1.76 million t per year [1]. Major types of tea are all gaining increasing popularity across the world, thanks to their health benefits, great taste, and ample availability in the global market [2]. Driven by the increasing demand for tea, world tea consumption has risen by 4.5% to 5.5 million t over the decade to 2016 [1]. The tea industry is important in respect of its contribution to the gross national product (GNP), health benefits, poverty reduction, and contribution to employment and its relationships to other socio-cultural activities [3].
Tea plant is an evergreen bush that flourishes in tropical, subtropical and temperate regions at elevations below 3000 m. Tea grows in a wide range of latitudes of between 30° S and 42° N that satisfy the certain eco-physiological requirements of tea plants, including thresholds of climatic variables [4,5]. The tea plant requires a minimum annual rainfall of 1200 mm and average optimal relative humidity of more than 70–75% [6]. Tea plants can survive a wide range of temperatures between 10 to 30 °C [7,8]. Solar radiation is another primary driver which plays a significant role in photosynthesis in plants [6]. Squire [9] found that the whole canopy of tea bush requires 700–800 Wm−2 to reach a photosynthetically saturated point. Excessive wind causes water deficit in tea plants due to high evapotranspiration [7]. Variation of both abiotic and biotic factors above or below tea’s thresholds initiates physiological stress in tea plants. Satisfying the above requirements, tea may be grown across the world in varied locations. India, China, Sri Lanka and Kenya are rated as the world’s largest tea-producing countries [1].
Tea has been introduced in many other parts of the world from the major hubs of cultivation in South-East Asia and is now grown in conditions ranging from Mediterranean-type climates to hot, humid tropics [10]. British planter James Taylor started a tea plantation in Kandy, Sri Lanka, in 1867 [11] and currently the country produces three main types: Ceylon black, Ceylon green, and Ceylon white tea [12]. The commercialisation of tea in Kenya started in 1924 and since then the nation has become a major producer of black tea [13]. Being the second largest producer of tea in the world, India produces an average 1,325,050 t of tea [14]. China is the largest producer of tea in the world, producing 30–35% of the total amount of tea produced in the world in year 2017, which was approximately 2,473,443 t [1].
The monsoonal climate, alternate wet and dry seasons and the high elevation of subtropical mountains in China, India, and Sri Lanka appear to provide above optimal conditions for tea cultivation [15]. A successful tea cultivation is highly dependent on climatic factors [16]. Abrupt climate change has been recognised as the foremost environmental issue for tea systems and the tea plant experiences the multi-decadal impacts of climate change all over the world as it has a long lifespan [17]. For example, climate variables such as changes in temperature, precipitation and solar radiation have been shown to impact tea yields in tea-growing countries throughout Asia and Africa [4]. Tea yield is highly vulnerable to drought which can cause irretrievable yield losses [5,18]. Heavy rains, on the other hand, can cause waterlogging, erosion, and cause nutrient leaching in soil [19]. Phytochemical profiles and organoleptic properties which determine tea quality have also been shown to vary with climate change [5,20]. Climate change has been shown to shift the geographic span for high-quality tea in many tea growing countries [21].
In view of the significance of accurately modelling tea species’ responses to a changing climate, numerous studies have been devoted to individual country assessments. Alarming evidence of climate change in the tea-growing areas of Sri Lanka, Kenya, India and China are attributed to the rising temperature, variability in rainfall, and increasing incidences of extreme events [9,22]. Using climate model projections, Jayasinghe and Kumar [23] found that regions of Sri Lanka that have been best suited for growing tea will undergo a suitability decline of about 10.5% over the course of the next 30 to 50 years. In Kenya, the suitability of tea-growing areas is expected to decline by 22.5% by the year 2075 while a suitability increase of 8% is expected by 2025 [2]. Changes in temperature and rainfall patterns pose the risk of traditional areas of Assam in India becoming inappropriate for tea cultivation [24]. These changes in tea productivity risk the maintenance of both tea yields and quality in India [13]. All tea-producing counties in China showed a decrease in tea yields associated with longer and erratic monsoon seasons [25].
To date, there have been only a few studies on the impact of climate change on the overall tea production in the world. For example, the United Nations Food and Agriculture Organisation (FAO) World Tea Model was generated with the Global Agro-ecological Zones model (GAEZ v3.0) for the Intergovernmental group on tea (IGG/Tea) in 2012 to forecast climate suitability for tea [4]. This scenario has several drawbacks, considering only two nations, and the model produces a medium-term forecast. So far no one has studied how climate suitability will shift among major tea-producing countries in order to visualise a comprehensive picture of challenges and opportunities in the future tea market. While some modelling of tea projection has been undertaken, there has been no comparison between major tea producing countries using a similar set of global circulation models (GCMs), RCPs as well as time periods. Therefore, attention needs to be paid to conducting research to model current and future habitat suitability for tea using similar GCMs, RCPs and time periods for comparing how the major tea producing countries will fare in the future.
The primary objective of this study was to investigate the potential current and future tea distribution and climatic suitability on the basis of three GCMs for the years 2050 and 2070 under RCP scenarios of 2.6, 6.0, and 8.5. We highlight relative declines and changes in climate suitability for the world’s major tea-producing countries of China, India, Kenya and Sri Lanka. We identify the main bioclimatic variables influencing tea cultivation and study the comparative shifts in areas suitable to growing tea. Quantifying climate characteristics of each tea producing country will enable more effective decision-making and policy formulating in order to sustain and enhance future tea production in the competitive international market. Further, it is worth looking to see if there is a migration of tea growing to newer and more suitable areas in the four selected countries if the traditional regions become less suitable.
2. Materials and Methods
2.1. Study Area and Its Ecological Significance
This study focused on the top four tea-producing countries, namely Sri Lanka, Kenya, India and China. The comprehensive characteristics of each country selected in this study are given in the Supplementary Materials Table S1.
2.2. MaxEnt Description
MaxEnt stands for maximum entropy modelling which has been widely used in niche modelling since it only needs presence-only species records [26]. The MaxEnt model was considered to be the best in both predictive efficiency and model stability compared to other species distribution models (SDMs) [27]. Also, MaxEnt predicts the habitat suitability of the species by analysing the occurrence data of the target species and environmental variables [28,29].
2.3. MaxEnt Modelling
The MaxEnt software (MaxEnt version 3.3.3, http://www.cs.princeton.edu/~schapire/MaxEnt/, accessed on 20 February 2020) algorithm was run with the default convergence threshold (10−5) and the maximum number of iterations (5000). The cloglog output format was used and models were each run 10 times to measure internal model variability with cross-validation run type [26]. Maximum training sensitivity plus a specificity threshold was used with 50,000 background points to run the models which allowed the models to have adequate time for convergence. The ‘fade-by-clamping’ feature was used to avoid dubious projections by the model which removes heavily clustered pixels from the final predictions [30]. In addition, we evaluated the effect of different combinations of feature types and varying degrees of regularisation in the MaxEnt program. The auto-feature configuration performed best with a regularisation multiplier of two to calibrate our final model [27].
We produced bias files for habitat suitability modelling for each country to employ the target-group background method recommended by Phillips, Dudík [31] to avoid sampling bias. The information on the dependence of the predicted suitability on a specific variable as well as the range under which the variable reached its optimal suitability when provided by response curves [27].
2.4. Estimating Species Occurrence and Climatic Predictors
The presence-only species collection techniques were used in this study. The occurrence data of tea were obtained from three sources: published literature [23,32,33,34,35], the Global Biodiversity Information Facility (GBIF, http://www.gbif.org, accessed on 24 February 2020) and Google Earth (http://ditu.google.cn/, accessed on 26 February 2020). A total of 4139 geo-referenced occurrence data of tea were collected within its known native distribution over four countries. Occurrence data of tea for each country are given in the Supplementary table (Table S2). However, for tea, this published literature and GBIF sources yielded very few records of the known native distribution of tea, especially from China and Sri Lanka. Hence, we included data from Google Earth Pro (Version 7.3.1, Google Inc.). We used expert knowledge to confirm the reliability of extracted occurrence points of each county since precise location information would ensure improved geographic accuracy and generate a better model.
R software version 2.51 was used with an additional package of ‘spThin’ to eliminate spatial clusters of concurrence points. Occurrence points were thinned at 5 km with 100 iterations for each study area. Finally, a total of 536 occurrence data of tea were included in this study (Table S2) and the occurrence points were converted into a comma-separated values (CSV) format.
2.5. Bioclimatic Variables
For modeling purposes, the set of bioclimatic variables available on the WorldClim website has been widely used [23,36,37]. Generally, the ‘current’ climate data sourced from the WorldClim use the years 1950–2000 to calculate climatic averages. This is a common method to work with current climate condition (interpolations historical observed data, representative of 1950–2000 climates) as it is easy and straightforward. That does not, however, account for recent (post-2000) climate change. Current climate: for current climatic conditions (1950–2000), 19 ‘bioclimatic’ variables were downloaded from the WorldClim database (http://www.worldclim.org/, accessed on 12 February 2020) at a spatial resolution of 30 arc-seconds (~1 km2). Based on the previous study conducted by Jayasinghe and Kumar [23], the growth conditions of tea as well as the operability and feasibility of the data, seven bioclimatic variables [annual mean temperature (BIO1), mean diurnal range (BIO2), temperature seasonality (BIO4), annual precipitation, (BIO12) precipitation seasonality (BIO15), precipitation of driest (BIO14) and wettest month (BIO16)] were chosen for this study using the Pearson correlation coefficient test (|r| < 0.70). A strong correlation between the bioclimatic variables in the model may lead to misinterpretations due to the high level of collinearity among variables. Highly correlated variables (r > 0.80) can be excluded from the model based on the Pearson correlation coefficients and the less correlated variables can be taken (r < 0.8) for the MaxEnt analysis [38].
Future Climate: Three GCMs were used with 1 km2 spatial resolution for the years of 2050 and 2070 to predict the future habitat suitability. The GCMS used were CCSM4 (Community Climate System Model, version 4), HadGEM2-ES (Hadley Centre Global Environmental Model 2-Earth System) and MIROCH-H (Model for Interdisciplinary Research on Climate) [39]. It has been reported that MICROC5 has a better simulation of the climatic parameters than its past versions [40] and it has been used for many other studies in the south Asian and Himalayan regions due to its improved capabilities in capturing features well [23,41,42]. As Kenya is one of the study areas in the present study, HadGEM2-ES was used, as previous studies indicated that the model simulations were close to the multimodal ensemble mean over Africa [43]. The CCSM4 has improved El Niño-Southern Oscillation (ENSO) variability with more reasonable frequency distribution [44] and it is anticipated that the rainfall and temperature are better modelled by CCSM4 in the Asian region [45]. The models were run using three RCPs of RCP2.6, RCP6.0 and RCP8.5 in order to investigate how suitable habitats of tea will change under several GCMs, viz., MIROC5, CCSM4 and HadGEM2-ES by 2050 and 2070, respectively, compared to the current climate distribution in all four tea-producing countries. The RCP2.6 and 6.0 have lower (2.6–3.0 W/m2) and medium (6.0 W/m2) radiative forcing levels, respectively, whereas RCP8.5 is considered as the high emission scenario (business as usual) that is based on a radiative forcing level of +8.5 W/m2.
2.6. Evaluation of Model Accuracy
Models were calibrated using 75% of the occurrence points as training data, and the remaining 25% were used for model validation. The area under the receiver operating curve (AUC), Cohen’s kappa, and true skill statistic (TSS) were used to evaluate the model performance [27,46]. AUC is a measure of the overall performance of a model [47]. The AUC ranges from 0.5 (random) to 1.0 (perfect discrimination), and values >0.8 indicate satisfactory performance [48]. TSS and Cohen’s kappa are the threshold-dependent measures of model performances that evaluate their classification accuracy after selecting a threshold value [47]. We used a suitability threshold of 0.5, which has been widely used in species distribution models [49]. The TSS and Cohen’s kappa values >0.8 were suggested as excellent, 0.4–0.8 useful, and <0.4 poor model performance [50]. The confusion matrix, formulas and measures of accuracy indicators are given in the Supplementary tables (Table S3).
Furthermore, we used three methods to estimate the contributions of climate indices to simulated models [51]: (1) percentage contribution, (2) permutation importance and (3) the jack-knife test. We explored the contribution of environmental variables by: (a) assessing their permutation importance, and (b) with jack-knife tests, which indicate the change in model fit when subsequently withholding each predictor and refitting models [49].
2.7. Reclassification and Change Detection
The suitability maps, current and future, produced by the model ranged from 0 (least) to 1 (most). To define habitat versus non-habitat for tea, we used the “maximum training sensitivity plus specificity” threshold that provided very accurate predictions. For further analysis, we classified tea habitat suitability into four classes using the “natural/jenks” option in ArcGIS, i.e., ‘optimal’ (>0.6), ‘medium (0.4–0.6), ‘marginal’ (0.2–0.4), and ‘unsuitable’ (<0.2). The area calculation for the identified classes was carried out in the ArcGIS setting.
Then, the change detection method was used to check for spatial changes in suitability areas from current to future scenarios. The suitability values for the future climate were subtracted from the current climate to see where the changes were high and low. This gave an indication of how the climate will have a spatial impact on the tea suitability of the four countries. Tea suitability is a term used in the present study to highlight those areas that have suitable habitats, in terms of climatic conditions, for successful tea cultivation in the current and/or future scenarios.
3. Results
3.1. Habitat Suitability Model Validation, Parameter Sensitivity
Potentially suitable habitats with optimal suitability thresholds for tea were predicted in the four countries where populations of tea are already known to exist. The average test AUCs for the replicate runs were 0.92 (standard deviation (SD) = 0.009), 0.98 (SD = 0.003), 0.97 (SD = 0.005), and 0.90 (SD = 0.013) for Sri Lanka, Kenya, India and China, respectively for current climate. AUCs for species distribution maps for all four countries showed a high accuracy, indicating the reliability of model predictions (Table 1). The mean TSS values for tea in Sri Lanka, Kenya, India and China were 0.80, 0.91, 0.91, and 0.74, respectively, which indicates very good model performances. The kappa values (k) of the current and future models for all four countries were above 0.40 (0.4 < k < 0.75), showing that the overall model performance was good (Table 1).
3.2. Key Environmental Factors Influencing Habitat Distribution
Table 2 gives permutation importance of the predictor variables to the MaxEnt model of each country. In Sri Lanka, current and future tea habitats are highly influenced by precipitation seasonality (BIO15) and annual mean temperature (BIO1), accounting for almost 80% of the model prediction. For Kenya, annual mean temperature (BIO1) is the significant climatic predictor for current (M = 47%) and future (50%) tea cultivation. For India, annual precipitation (BIO12) and annual mean temperature (BIO1) are the most influential variables, contributing more than 50% to the tea distribution models under current and the future climate. For China, annual mean temperature (BIO1) (M = 46%) and precipitation of the wettest quarter (BIO16) (M = 31%) are the two most important bioclimatic variables influencing the distribution of tea under current as well as future climatic conditions.
The jack-knife analysis of variable importance also resulted in annual mean temperature (BIO1) and precipitation seasonality (BIO15) being the two most important predictors of tea distribution in Sri Lanka while annual precipitation (BIO12) was the most significant contributor to the habitat suitability distribution of tea in Kenya and India. It also showed that annual mean temperature (BIO1) and mean diurnal range (BIO2) were the main variables for the impact on the distribution of suitable habitat for tea in China. The results of jack-knife analysis is given in the supplementary material (Figure S1).
3.3. Importance of Bioclimatic Variables in the Habitat Suitability of Camellia Sinensis
Response curves reflect the quantitative relationship between the MaxEnt predicted probability of tea habitat suitability and bioclimatic variables (Figure 1). The x-axis shows how each bioclimatic variable changes as the cloglog prediction changes between 0 and 1. All bioclimatic variables were set to their average value over the set of presence occurrences. According to the response curves of annual mean temperature (BIO1) (Figure 1a), high probabilities of habitat suitability for tea were skewed sharply towards a specific range (10–25 °C) in both India and China. In Sri Lanka, high probabilities of presence were predicted when BIO1 ranged from 13 to 28 °C, while temperatures around 20 °C are ideal (Figure 1b). The highest habitat suitability for tea shows a symmetric distribution with the BIO1 ranging from 15–20 °C in Kenya. Figure 1b shows that habitat suitability of tea in Sri Lanka, China, and India is associated with areas where the mean diurnal temperature (BIO2) values ranged from 4.5 to 10 °C while the diurnal temperature of Kenya exhibited a range from 13 to 16 °C. The response curve for BIO4 (Figure 1c) showed that the habitat suitability of tea in Sri Lanka and India drastically decreases with a high-temperature variation that is above 40 °C and 48 °C, respectively. The response curve of annual precipitation (BIO12) (Figure 1d) showed that tea preferred high precipitation ranges from 2000 to 5000 mm in Sri Lanka. Its habitat suitability was strongly constrained by BIO12 at 2500 mm in India and 1700 mm in China. The corresponding response curves for precipitation of the driest month (BIO14) show a clear downward trend (Figure 1e), representing positive relationships between increasing values of BIO14 and predicted habitat suitability for tea in all tested tea producing countries. The habitat suitability of tea of four countries changed by varying degrees with increasing precipitation of the wettest quarter (BIO16) (Figure 1g).
3.4. Current Habitat Suitability Distribution
The potential distribution maps show that the suitable habitats of tea will change in the future, compared to the current climate (Figure 2a, Figure 3a, Figure 4a, Figure 5a). In Sri Lanka, the predicted medium and optimal suitability areas for tea under the current climate conditions are 5769 km2 (8.8%) and 6090 km2 (9.3%), respectively (Figure 2a) and (Table 3a). The medium and optimal current habitat for tea in Kenya represent 11,078 km2 (4.5%) and 10,333 km2 (4.2%), respectively (Figure 3a) and (Table 3b). In India, an area of 66,725 km2 (2%) has optimal climate suitability while 131,268 km2 (4%) has medium suitability for tea distribution under the current climate (Figure 4a) and (Table 3c). In China, the simulation output shows that 1,804,999 km2 (19.3%) and 1,003,219 km2 (10.7%) of land have optimal and medium suitability for tea under the current climate, respectively (Figure 5a) and (Table 3d).
3.5. Future Habitat Suitability Distribution and Change Detection
The projected habitat suitability areas for tea for future climate scenarios for both the years 2050 and 2070 (Figure 2a, Figure 3a, Figure 4a, Figure 5a) (Table 3) vary compared with the current distribution in all four tea-producing countries. The details of suitable habitats for tea in Sri Lanka, Kenya, India and China under current and future climate conditions, predicted using the three GCMs separately, are given in supplementary tables (Tables S4–S7).
There will be a decrease in habitat suitability for tea under a future climate compared to the current climate in Sri Lanka (Table 3a). Compared to the mid-and high elevation areas, most of the optimal and medium suitability areas at low elevation (e.g., Galle and Matara) will be lost at a higher rate for all tested RCPs (Figure 2a). In the year 2050, most current optimally suitable areas for tea in the central hills will increase. The change detection maps for Sri Lanka (Figure 2b), clearly show that southern parts of the current tea-growing areas will decrease in climate suitability in the future. By 2050, under average GCMs for RCP2.6, the southern part of Ratnapura district will gain climate suitability.
Compared to current habitat suitability in Kenya, the average optimal and medium suitability will be reduced in the future. In particular, the optimal class around Mt Elgon and Mbeere will be totally absent under all RCPs by 2050 and 2070. Gucha and Kiambu areas will also see drastic reduction in optimal climate suitability for tea under RCP2.6 by 2050 and it will be completely absent under RCP6.0 and 8.5 by 2050, as well as under all RCPs by 2070. It is anticipated that there will be an increase in the suitability areas in Buret, Kericho and southern parts of Nandi in Kenya by 2050 and 2070, while suitability will decrease in some parts of Meru, Gucha and southern parts of Mt Elgon (Figure 3b).
In India, the optimal areas will expand in Sikkim, Manipur, upper Assam and Karnataka regions under projected future climates. However, overall medium suitability for tea will be significantly lost in all GCMs under RCP2.6 by 2070, especially in Meghalaya and Tripura regions. The suitable regions will increase in the future in Karnataka, some parts in Assam, Manipur, Uttarakhand and Himachal Pradesh while they decrease in some parts of Assam and northwest districts of Himachal Pradesh. By the year 2070 northern and eastern of Assam will gain suitability under RCP6.0 and 8.5, respectively (Figure 4b).
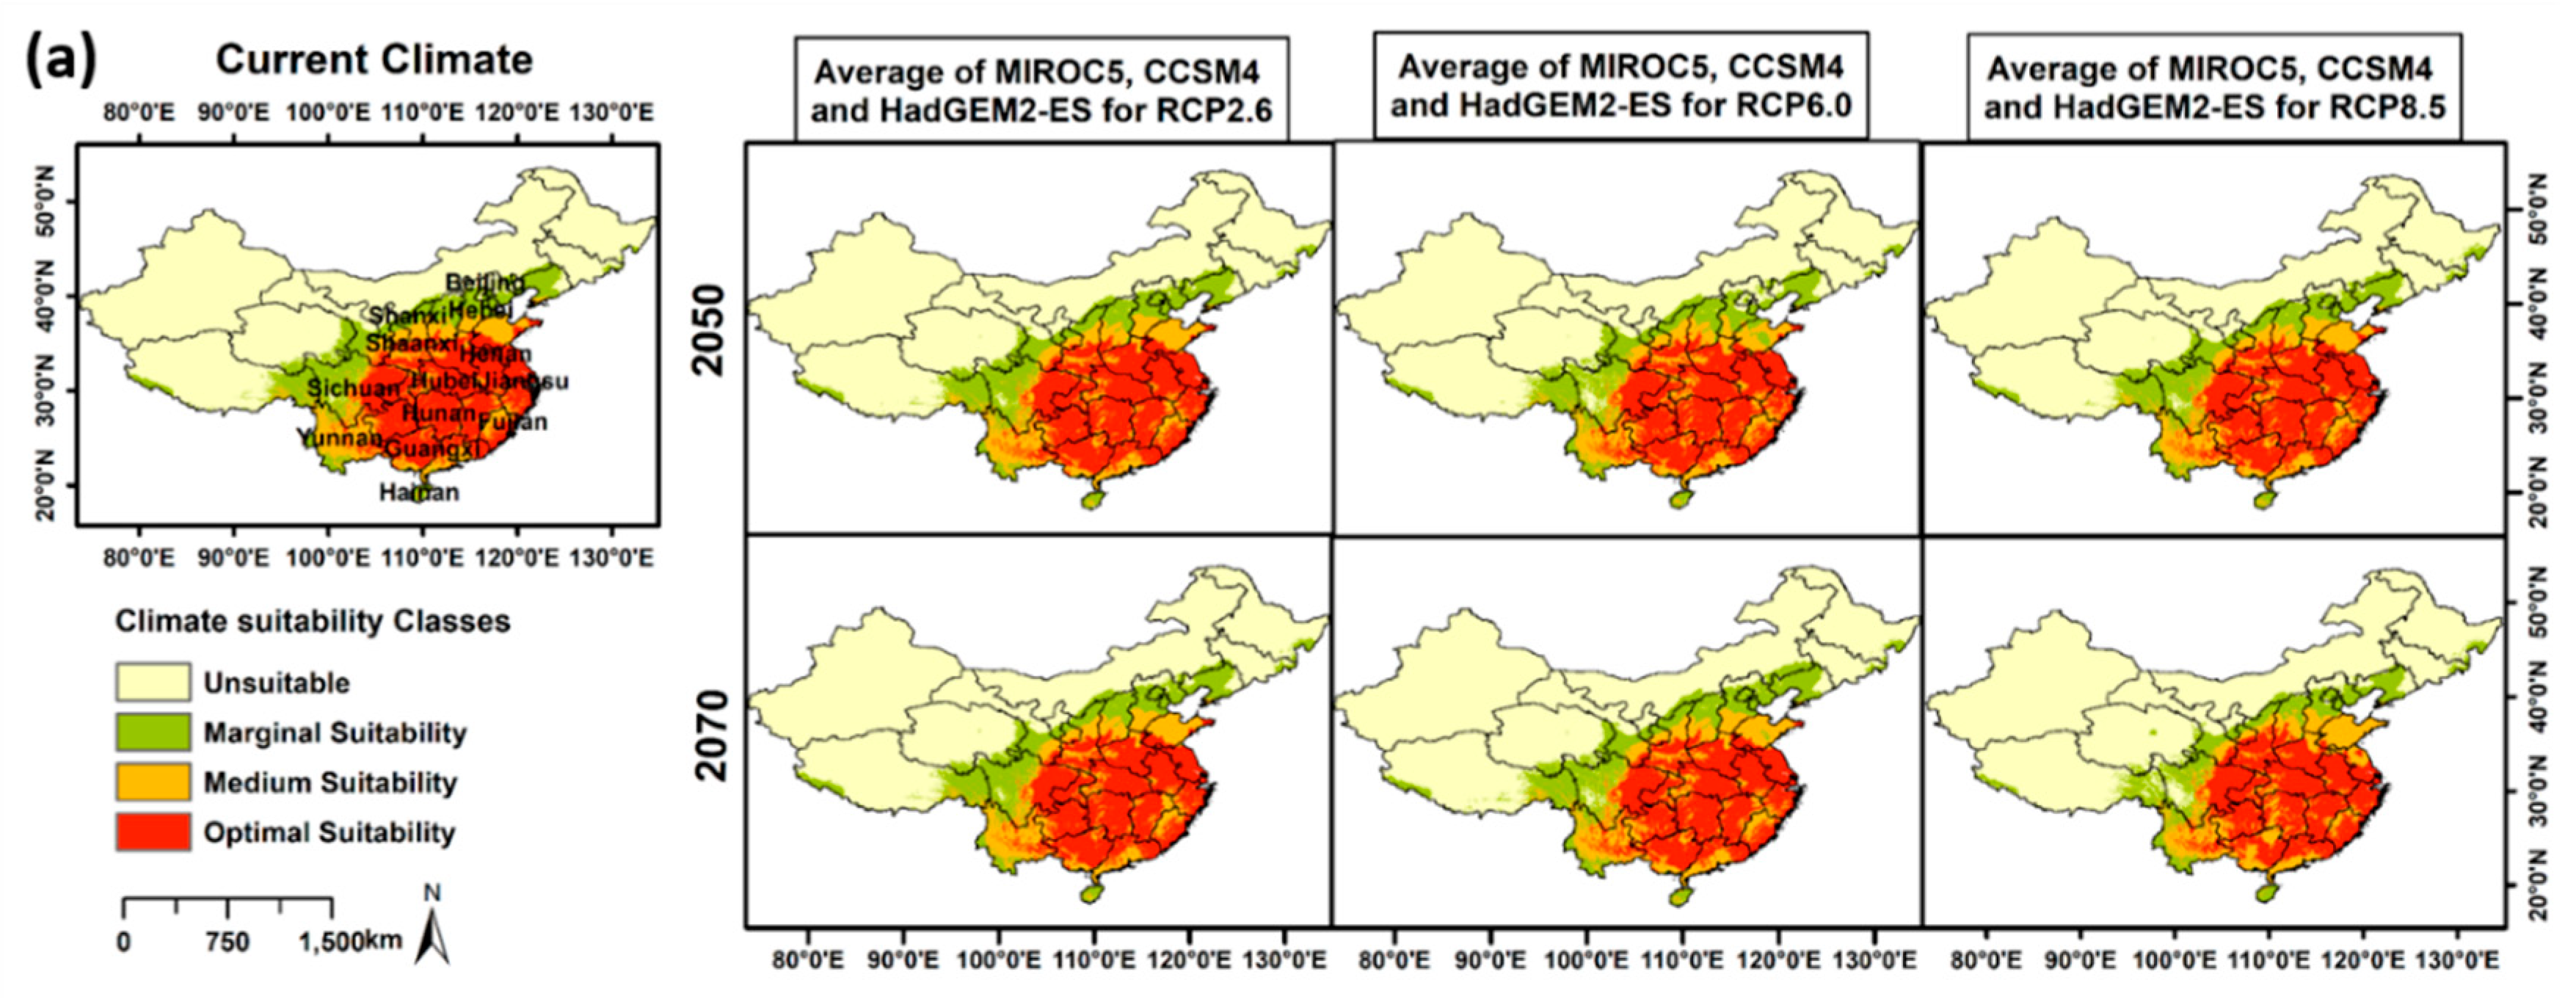
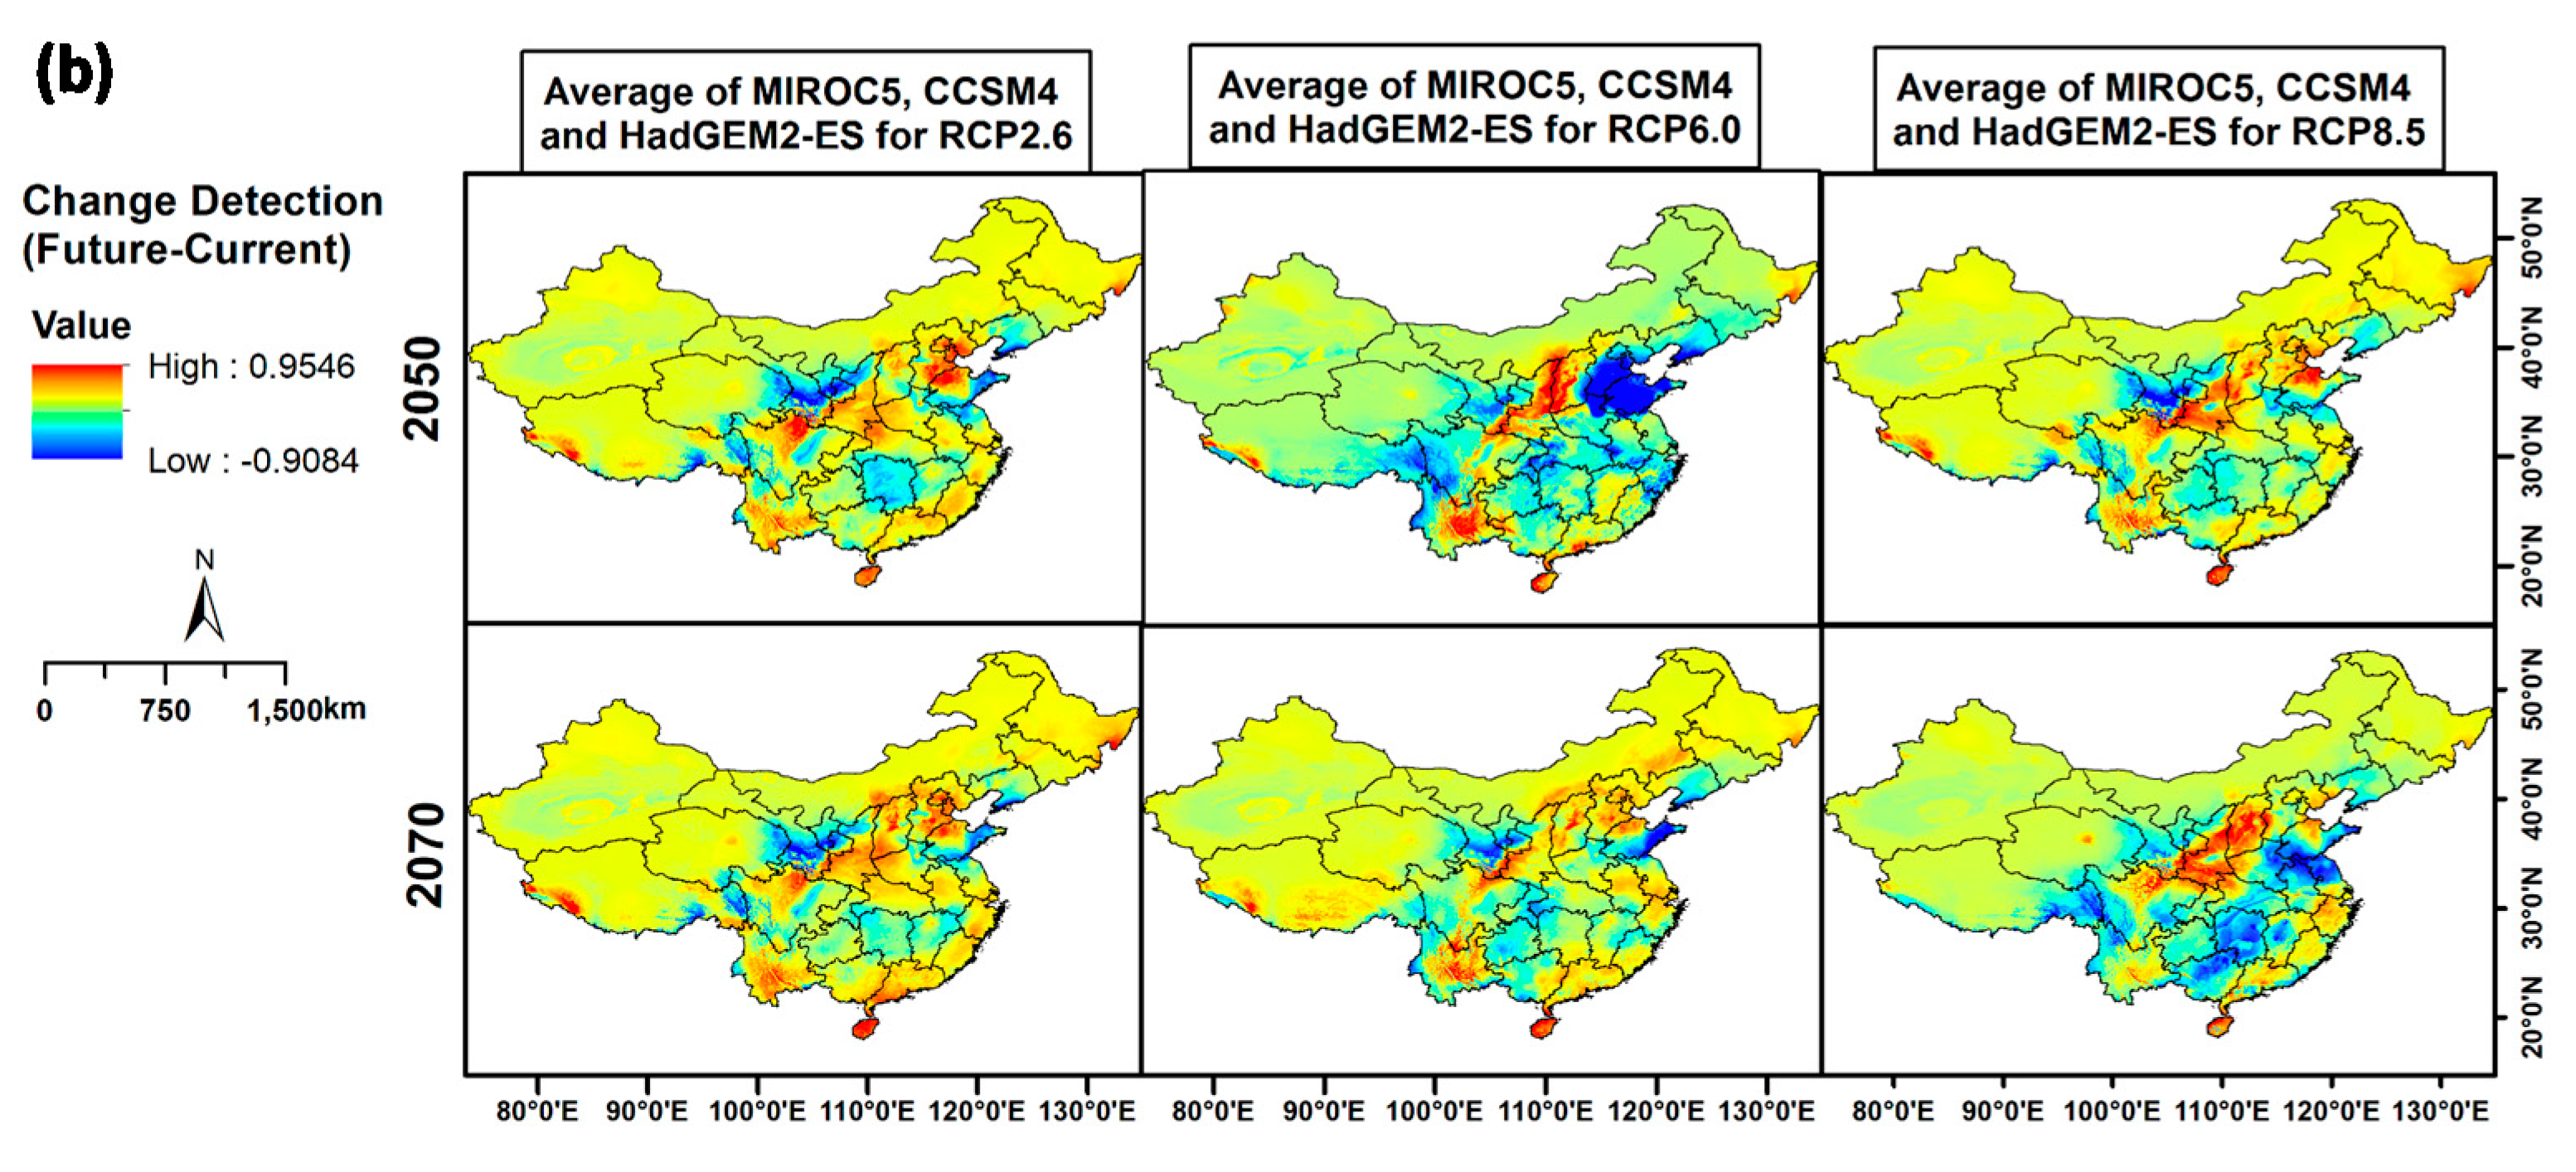
By 2050 and 2070, optimal and medium suitability areas in China show large variations compared to the current climate. It is clear that optimal and medium suitability areas for tea increase in Yunnan region in the future. The range of optimally suitable habitat would decrease in south Guangxi, Jiangsu and Shandong by 2070. The area of optimally suitable habitat that may be lost was 76,398 km2 by 2050 and 55,481 km2 by 2070. By 2050 under the average of three GCMs for RCP2.6, it is projected that the climate will become unsuitable for the currently optimal tea cultivated areas in parts of Hunan, Shandong, Yunnan and Sichuan (Figure 5b) and (Table 3d). Also, current medium and marginal areas in Shandong and Hubei will see a reduction in suitability under RCP6.0 by 2050. By 2070, suitability will be drastically reduced under the average of tested GCMs for RCP8.5, especially in some areas of Jiangsu, Anhui, Hunan, Guangxi, southern parts of Chongqing and the middle part of Jiangxi and Hubei.
3.6. Percentage of Suitability Area Loss/Gain for Camellia Sinensis from the Current to the Future Climate Scenarios in the Four Major Tea-Producing Countries
In Sri Lanka, a high percentage of medium suitability land will be lost under RCP2.6, indicating an overall loss of 21% by the year 2050. Tea will experience loss in areas of optimal suitability at higher percentages under RCP8.5 by 2070 (Table 4a). The greater percentage of loss (22%) in optimal suitability for tea is recorded under HadGEM2-ES under both future climates (Table S8). The average loss of percentage of optimal climate suitability will be 14% and 15% by the years 2050 and 2070, respectively.
Proportionately, medium and optimal habitat suitability categories in Kenya will decline by a high percentages under future climate projections. The reduction of average loss in the medium suitability for tea will be 39% and 38%, respectively, by 2050 and 2070, while the loss in habitat area of optimally suitable land will be 26.2% and 27%, respectively, by 2050 and 2070 (Table 4b). A higher percentage of loss in optimally suitable areas will be seen under HadGEM2-ES and MIROC5 compared to CCSM4 by both years of 2050 and 2070 (Table S9).
In India, projected optimal climate suitability will increase by 12.4% and 21.9% by 2050 and 2070, respectively, under all RCPs (Table 4c). The highest gain in the optimal areas (40.5%) in 2070 will record in RCP6.0 under HadGEM2-ES (Table S10). However, medium suitability areas will decrease by 24.2% by 2050 and 21.6% by 2070 (Table 4c).
For China, the results are explicit that future climate in both 2050 and 2070 can affect the optimal suitability of tea habitats, mainly under RCP6.0 in 2050 and RCP8.5 in 2070. The average percentage gain of medium climate suitability areas will be 5.7% and 7.2%, respectively, by the year 2050 (Table 4d). Climate change may precipitate significant loss in areas of optimal and medium suitability in China at higher percentages under HadGEM2-ES, representing an average percentage loss of 25% and 26% by 2050 and 2070, respectively. Moreover, an average of 5.6% of medium suitability area will be gained under all RCPs under MIROC5 (Table S11).
As per the summary of percentage of loss (−) or gain (+) of optimal suitability areas (%) in the four tea-producing countries in 2050 and 2070 (Table 4), it is clearly seen that Sri Lanka, Kenya and China will lose more optimal suitability areas in the future whereas India will gain an advantage as it gains optimal suitability areas, compared to the current climate.
4. Discussion
Climate change poses enormous challenges for the agriculture sector across the globe [52,53]. Tea is a relatively delicate plant and is especially sensitive to changes in climate [6]. This study shows that MaxEnt models fitted with presence-only data can provide strong estimates of habitat suitability for tea species in four different countries, with the high AUC, TSS and kappa values (Table 1). Our analysis further shows that the impacts of climate change on habitat suitability of tea would be very variable for the four major tea-producing countries. Overall, the impact of future climate in Sri Lanka, Kenya and China is predicted to be negative, while India would gain suitable habitats for tea in the future. The findings highlight that by 2050, a potential future decline of optimal suitability areas of 26.2%, 14%, and 4.7% in Kenya, Sri Lanka and China, respectively. By 2070, the optimal habitat suitability is also projected to decline by 28.6%, 15.1% and 2.6% in Kenya, Sri Lanka and China, respectively. India will benefit from future climate considering the optimal suitability area is likely to expand by 15% and 25% by the years 2050 and 2070, respectively (Table 3 and Table 4). All the four countries would maintain some suitable habitats, although within each country this would vary a lot.
This study projects negative consequences of climate change on tea cultivation in Sri Lanka, as previously suggested by Jayasinghe and Kumar [23]. The potential distribution of tea in the current climate was in line with the existing distribution of tea cultivation in Sri Lanka (Figure 2). The highest percentage of areas having medium and optimally suitable climatic conditions will decrease under HadGEM2-ES and RCP2.6 by 2050 (Figure 2). Since the radiative forcing of RCP2.6 peaks at 3 W/m2 in 2050 and returns to 2.6 W/m2 by 2100, the effect of RCP2.6 will be less in 2070 than in 2050 [54]. Under RCP2.6 using MIROC5 in 2050, a significant expansion occurs in the areas of optimal suitability distribution in Sri Lanka (Figure 2). This may due to the fluctuations in temperature and precipitation seasonality in the future climate under different GCMs (Table S12); tea habitats may shift from marginal to unsuitable, or optimal to medium, or vice versa. The most noticeable effect of climate change is the decrease in those areas that display “optimal” suitability, with approximately 13.7% and 15% of the decline in the field from current to future scenarios. In business as usual scenario (RCP8.5), the tea-producing area further concentrates in the higher elevated areas. As temperature is highly related to elevation, tea habitats having optimal climatic suitability may shift towards the high elevation areas in the future (Figure 2), whereas at lower altitudes the areas will suffer from a warming climate [55] that may decrease their climate suitability for tea.
Our model predicts that tea is unlikely to be established in the areas of Kenya where it had not previously existed. The tea-growing areas in Kenya will decline by 26.2% and 26.7% by 2050 and 2070, respectively (Figure 3) and (Table 3), which may have severe repercussions for the sustainability of tea production. These results are quite similar to the previous study undertaken by Han, Li [56] as they indicated that suitability of tea-growing areas is expected to decline by 22.5% by the year 2075. Our results indicated that the impacts were likely to be more severe on the west side of the Rift Valley in Kenya, a major tea-growing area in the country, as more optimal, medium and marginal suitability habitats convert to unsuitable habitats by 2050, which is comparable to the previous study [57]. These outcomes can be caused by the predicted variations in temperature and rainfall in Kenya under future climate (Table S12). A rise in mean air temperatures beyond the optimal temperature for shoot growth and development (i.e., 23.5 °C) is likely to occur. The uneven distribution of rainfall and prolonged drought could lead to undesirable conditions for tea plants [58]. The result is that the distribution of the suitability of tea growing in the existing tea-growing regions of Kenya will decrease mainly due to the above climate shifts. In Kenya, future optimal habitat suitability will be reserved in high elevations (2000 to 2300 m), especially the higher altitudes around Mount Kenya (Figure 3), which is similar to the previous study conducted by Leshamta [34].
For India, our results revealed that the optimal tea growing areas will expand in Sikkim, Manipur, upper Assam and Karnataka regions under projected future climate (Figure 4). In the current climate, the south bank region which covers parts of Upper Assam and Cachar are optimal suitable regions for tea whereas the north bank region is comparatively less suitable, which is similar to the results obtained from the Indian Tea Association [59]. Our study also predicted some areas in Assam, such as Sikkim, Meghalaya and Mizoram will more suitable by 2050 and 2070. By contrast, the climate change forecasting maps developed by the Ethical Tea Partnership organisation [21] and the Tea Research Association (TRA) demonstrated that much of Assam will become far less suitable for tea farming. One of the reasons for this dissimilarity could be the uneven distribution of occurrence data, or that we considered different GCMs and RCPs and different bioclimatic variables. A clear increase in temperature in the future would allow areas in high and medium elevations (i.e., Assam Manipur, Darjilling, Dooars, Teri and Arunachal Pradesh) to reach the optimal temperature range for tea cultivation, and would allow for expansion of tea-growing areas. Drought and low rainfall in India have been observed since the 1960s and it has had a huge impact on tea cultivation in past [60]. However, rainfall is projected to increase over all the states with very low change in the western part and highest change in the north-eastern and southern regions under RCP8.5 [61]. In the future, areas with unfavourable temperatures and rainfall conditions for tea growth could shift to desirable climate conditions compared to the current scenario. This is the reason why the future habitat distribution of tea in India is not negatively affected compared to other countries.
The modelled current and future optimal suitability habitats are concentrated around existing tea-growing areas in China (Fujian, Yunnan, Zheijiang, Sichuan, Hunan, Hubei and Anhui) (Figure 5). By 2050 and 2070, optimal and medium suitability areas in China show large variations under different GCMs. The reason for this result may be due to the harsh weather conditions in China over past years [10,62]. The results of this study are consistent with previous studies showing that the habitat suitability of the tea plant species is predicted to improve in some regions under climate change conditions [63,64]. It is very clear that optimal and medium suitability areas for tea increase in Yunnan regions under all tested RCPs in the future. In China, the average temperature for the near-term forecast (2020–2050) is similar for both scenarios of RCP6.0 and RCP8.5. Nevertheless, for the long-term forecast (2060–2090), the average temperature for the RCP8.5 scenario is higher than for the RCP6.0 scenario. The temperature has increased in the near term by a median of 1.1 °C and 1.3 °C for RCP scenarios 6.0 and 8.5, respectively, and projected to increase in the long term by a median of 1.7 °C and 2.9 °C for the RCP scenarios 6.0 and 8.5, respectively [65]. This may be the reason for decreasing optimally suitable habitat in south Guangxi, Jiangsu and Shandong in 2070 under the scenario of RCP 8.5. The main tea-production area could gradually shift from south to north, depending on future climate projections in China [33].
According to the relative importance of bioclimatic factors, the most influential variable was precipitation seasonality (BIO15) (Figure 1) and (Table 2) for determining the habitat suitability for tea in Sri Lanka, which is comparable to the present study [23]. Annual mean temperature (BIO1) was the key indicator for determining the suitability of tea habitat in Kenya and China (Figure 1) and (Table 2). Similar to the findings of previous studies, the highest probability of tea occurrence in the four countries was related to areas having a mean annual temperature around 20 °C [16,58]. Annual precipitation (BIO12) emerged as the strongest range predictor to determine current and future suitable habitats for tea in India and Kenya as precipitation is critical and plays an important role in sustaining tea cultivation [16].
Our study provides an indication for each country how their tea cultivation could be affected by future climate, with some countries more severely affected than others. Here, we have only considered climate suitability in the four major tea-producing countries in the world. Future research could expand this study in other major tea-producing countries. It is also important to include other non-climatic factors in assessing tea habitat suitability, as the actual areas available in the future are not only affected by climate factors; however, such data are currently not readily available for many countries or not available at suitable resolutions for modelling exercises. Inclusion of such data is likely to increase model accuracies. It should also be noted that land use was not included in this analysis. While there may be areas where climate is projected to be suitable, those lands may not actually be available for tea cultivation if they are currently being used for other higher-value cultivation or if they are centres of residential or commercial development.
5. Conclusions
We successfully modeled the current and future habitat suitability of tea in Sri Lanka, Kenya, India and China, which allowed us to identify potential distribution and spatial shifts of tea. In this context, the four tea-producing countries mapped for current and future ‘suitability habitat’ provided results that could be helpful in estimating the geographically based impacts of climate change. The predictions suggest that, by the years 2050 and 2070, climate would have an adverse impact on the habitat suitability of tea in Kenya, Sri Lanka and China, while India will gain an advantage. The current and future maps of habitat suitability and identification of suitable bioclimatic variables provides a significant guide for the tea sector across the globe to implement adequate adaptation strategies to circumvent the effects of climate change. Here, our results are based in part on the assumption that the potential area with suitable climatic conditions for tea also comprises other land uses. Thus, the resulting maps should be combined with the knowledge of local authorities of each country to identify potential new suitable habitats in order to expand tea cultivation. Our findings are a harbinger of what could happen in the four major tea-producing countries in general. Further analysis is required to identify land-use changes and decide the effective area of suitable lands using ensemble’ approaches with other GCMs and inclusion of non-climatic factors.
Supplementary Materials
The following are available online at https://www.mdpi.com/2073-4395/10/10/1536/s1, Figure S1: MaxEnt jackknife tests of the relative importance of bioclimatic variables with their regularized training gain for tea species in the four tea producing countries, Table S1: The comprehensive characteristics of each country selected in this study, Table S2: Occurrence data of tea for each country, Table S3: Confusion matrix, measures and formulas of predictive accuracy indicators for the developed model, Tables S4–S7: Areas (km2) of suitable habitats for Camellia sinensis in Sri Lanka (S4), Kenya (S5), India (S6) and China (S7) under current and future climate conditions, Tables S8–S11: Changes in habitat suitability areas in Sri Lanka (S8), Kenya (S9), India (S10), and China (S11) [% of loss (−) or gain (+) ] for Camellia sinensis by 2050 and 2070 under RCP 2.6, 6.0, and 8.5 using GCMs of HadGEM2-ES, CCSM4 and MIROC5, Table S12: Projected average temperature (Avg. Temp.) and rainfall (avg. rainfall) of the three GCMs compared to historical mean.
Author Contributions
Conceptualization, L.K. and S.L.J.; methodology, S.L.J. and L.K.; software, L.K. and S.L.J.; validation, S.L.J. and L.K.; formal analysis, S.L.J.; investigation, L.K. and S.L.J.; resources, L.K. and S.L.J.; data curation, S.L.J. and L.K.; writing—original draft preparation, S.L.J.; writing—review and editing, L.K. and S.L.J.; visualization, S.L.J. and L.K.; supervision, L.K.; project administration, L.K.; proof-reading, L.K. and S.L.J. All authors have read and agreed to the published version of the manuscript.
Funding
This research received no external funding.
Acknowledgments
This research was supported by a postgraduate scholarship provided by the University of New England to the first author.
Conflicts of Interest
The authors declare no conflict of interest.
References
- Statista. Consumer Goods & FMCG›Non-Alcoholic Beverages; Statista GmbH: Hamburg, Germany, 2019. [Google Scholar]
- Bhagat, R.; Ahmed, K.Z.; Gupta, N.; Baruah, R.D.; Wijeratne, M.A.; Bore, J.K.; Nyabundi, D.W.; Han, W.; Li, X.; Yan, P.; et al. Report of the Working Group on Climate Change of the FAO Intergovernmental Group on Tea; Technical Report for Food and Agriculture Organization of the United Nations: Rome, Italy, 2016. [Google Scholar]
- Mukhopadhyay, M.; Mondal, T.K. Cultivation, improvement, and environmental impacts of tea. In Oxford Research Encyclopedia of Environmental Science; Oxford University Press: Oxford, UK, 2017. [Google Scholar]
- Chang, K.; Brattlof, M. Contribution of Tea Production and Exports to Food Security, Rural Development and Smallholder Welfare in Selected Producing Countries; Technical Report for Food and Agriculture Organization of the United Nations: Rome, Italy, 2015. [Google Scholar]
- Ahmed, S.; Stepp, J.R.; Orians, C.; Griffin, T.; Matyas, C.; Robbat, A.; Cash, S.; Xue, D.; Long, C.; Unachukwu, U.; et al. Effects of extreme climate events on tea (Camellia sinensis) functional quality validate indigenous farmer knowledge and sensory preferences in tropical China. PLoS ONE 2014, 9, e109126. [Google Scholar]
- De Costa, W.; Mohotti, A.J.; Wijeratne, M.A. Ecophysiology of tea. Braz. J. Plant Physiol. 2007, 19, 299–332. [Google Scholar] [CrossRef]
- Lemmesa, F. Tea Production and Management; Teaching handout; Department of Plant Sciences, Jimma College of Agriculture: Jimma, Ethiopia, 1996; pp. 1–14. [Google Scholar]
- Jayasinghe, H.; Suriyagoda, L.; Karunaratne, A.; Wijeratne, M. Leaf development and expansion in tea [Camellia sinensis (L.) Kuntze] and their relationships with thermal time: A case study. Trop. Agric. Res. 2015, 25, 450. [Google Scholar] [CrossRef] [Green Version]
- Squire, G.R. Weather, physiology and seasonality of tea (Camellia sinensis) yields in Malawi. Exp. Agric. 1979, 15, 321–330. [Google Scholar] [CrossRef]
- Nowogrodzki, A. How climate change might affect tea. Nature 2019, 566, S10–S11. [Google Scholar] [CrossRef] [Green Version]
- Faostat, F. Agriculture Organization of the United Nations Statistics Division; Economic and Social Development Department: Rome, Italy, 2016; Available online: http://faostat3.fao.org/home/E (accessed on 31 December 2016).
- EDB. Tea sector. In Industry Capability Report; Darshana, P., Ed.; Export Agriculture Division, Sri Lanka Export Development Board: Colombo, Sri Lanka, 2014; p. 10. [Google Scholar]
- Gesimba, R.M.; Langat, M.C.; Liu, G.; Wolukau, J.N. The tea industry in Kenya; The challenges and positive developments. Appl. Sci. 2005, 5, 334–336. [Google Scholar]
- Dutta, R. Climate change and its impact on tea in Northeast India. J. Water Clim. Chang. 2014, 5, 625–632. [Google Scholar] [CrossRef]
- Hicks, A. Current status and future development of global tea production and tea products. Au Jt 2009, 12, 251–264. [Google Scholar]
- Jayasinghe, S.L.; Kumar, L.; Hasan, M.K. Relationship between environmental covariates and ceylon tea cultivation in Sri Lanka. Agronomy 2020, 10, 476. [Google Scholar] [CrossRef] [Green Version]
- Ochieng, J.; Kirimi, L.; Mathenge, M. Effects of climate variability and change on agricultural production: The case of small scale farmers in Kenya. NJAS-Wageningen J. Life Sci. 2016, 77, 71–78. [Google Scholar] [CrossRef]
- Wijeratne, M. Vulnerability of Sri Lanka tea production to global climate change. Water Air Soil Pollut. 1996, 92, 87–94. [Google Scholar]
- Wijeratne, M. Some adaptations of the tea plant to dry environments. In Adapting to Climate Change; Springer: New York, NY, USA, 1996; pp. 174–187. [Google Scholar]
- Han, W.Y.; Huang, J.G.; Li, X.; Li, Z.-X.; Ahammed, G.J.; Yan, P.; Stepp, J.R. Altitudinal effects on the quality of green tea in east China: A climate change perspective. In European Food Research and Technology; Springer: Heidelberg, Germany, 2016; Volume 243, pp. 323–330. [Google Scholar]
- ETP. The Ethical Tea Partnership-Understanding the Difference between ETP and Fairtrade. 2015. Available online: https://www.ethicalteapartnership.org/ (accessed on 11 June 2020).
- Marx, W.; Haunschild, R.; Bornmann, L. Global warming and tea production-the bibliometric view on a newly emerging research topic. Climate 2017, 5, 46. [Google Scholar] [CrossRef]
- Jayasinghe, S.L.; Kumar, L. Modeling the climate suitability of tea [Camellia sinensis (L.) O. Kuntze] in Sri Lanka in response to current and future climate change scenarios. Agric. For. Meteorol. 2019, 272, 102–117. [Google Scholar] [CrossRef]
- AVP. Changing Climate’s Challenges to TATA Tea. Assignment: Climate Change Challenge. 2016. Available online: https://digital.hbs.edu/platform-rctom/category/uncategorized/tea/ (accessed on 15 January 2020).
- Boehm, R.; Cash, S.B.; Anderson, B.T.; Ahmed, S.; Griffin, T.; Robbat, A.J.; Stepp, J.R.; Han, W.-Y.; Hazel, M.; Orians, C.M. Association between empirically estimated monsoon dynamics and other weather factors and historical tea yields in China: Results from a yield response model. Climate 2016, 4, 20. [Google Scholar] [CrossRef] [Green Version]
- Phillips, S.J.; Dudík, M. Modeling of species distributions with Maxent: New extensions and a comprehensive evaluation. Ecography 2008, 31, 161–175. [Google Scholar] [CrossRef]
- Phillips, S.J.; Anderson, R.P.; Schapire, R.E. Maximum entropy modeling of species geographic distributions. Ecol. Model. 2006, 190, 231–259. [Google Scholar] [CrossRef] [Green Version]
- Dubey, S.; Pike, D.A.; Shine, R. Predicting the impacts of climate change on genetic diversity in an endangered lizard species. Clim. Change 2012, 117, 319–327. [Google Scholar] [CrossRef] [Green Version]
- Läderach, P.; Ramirez–Villegas, J.; Navarro-Racines, C.; Zelaya, C.; Martinez–Valle, A.; Jarvis, A. Climate change adaptation of coffee production in space and time. Clim. Chang. 2017, 141, 47–62. [Google Scholar] [CrossRef] [Green Version]
- Tobeña, M.; Prieto, R.; Machete, M.; Silva, M.A. Modeling the potential distribution and richness of cetaceans in the Azores from fisheries observer program data. Front. Mar. Sci. 2016, 3, 202. [Google Scholar] [CrossRef]
- Phillips, S.J.; Dudík, M.; Elith, J.; Graham, C.H.; Lehmann, A.; Leathwick, J.; Ferrier, S. Sample selection bias and presence-only distribution models: Implications for background and pseudo-absence data. Ecol. Appl. 2009, 19, 181–197. [Google Scholar] [CrossRef] [Green Version]
- Bartling, M.; Bunn, C.; Castro, F.; Walz, H. Identification of Suitable Tea Growing Areas in Malawi under Climate Change Scenarios. Semantic Scholar. 2017. Available online: https://www.semanticscholar.org/ (accessed on 11 June 2020).
- Brouder, P.; Eriksson, R.H. Tourism evolution: On the synergies of tourism studies and evolutionary economic geography. Ann. Tour. Res. 2013, 43, 370–389. [Google Scholar] [CrossRef] [Green Version]
- Leshamta, G.T. Assessing the Suitability of Tea Growing Zones of Kenya under Changing Climate and Modeling Less Regret Agrometeorological Options; Department of Meteorology, University of Nairobi: Nairobi, Kenya, 2017. [Google Scholar]
- Adhikari, U.; Nejadhashemi, A.P.; Woznicki, S.A. Climate change and eastern Africa: A review of impact on major crops. Food Energy Secur. 2015, 4, 110–132. [Google Scholar] [CrossRef]
- Jayasinghe, S.L.; Kumar, L.; Sandamali, J. Assessment of potential land suitability for tea (Camellia sinensis (L.) O. Kuntze) in Sri Lanka using a GIS-based multi-criteria approach. Agriculture 2019, 9, 148. [Google Scholar] [CrossRef] [Green Version]
- Chhogyel, N.; Kumar, L.; Bajgai, Y.; Jayasinghe, L.S. Prediction of Bhutan's ecological distribution of rice (Oryza sativa L.) under the impact of climate change through maximum entropy modelling. J. Agric. Sci. 2020, 158, 253–257. [Google Scholar] [CrossRef]
- Benesty, J.; Chen, J.; Huang, Y.; Cohen, I. Pearson correlation coefficient. In Noise Reduction in Speech Processing; Springer: Heidelberg, Germany, 2009; pp. 1–4. [Google Scholar]
- Fick, S.E.; Hijmans, R.J. WorldClim 2: New 1-km spatial resolution climate surfaces for global land areas. Int. J. Clim. 2017, 37, 4302–4315. [Google Scholar] [CrossRef]
- Watanabe, M.; Suzuki, T.; O’Ishi, R.; Komuro, Y.; Watanabe, S.; Emori, S.; Takemura, T.; Chikira, M.; Ogura, T.; Sekiguchi, M.; et al. Improved climate simulation by MIROC5: Mean states, variability, and climate sensitivity. J. Clim. 2010, 23, 6312–6335. [Google Scholar] [CrossRef]
- Mishra, V.; Kumar, D.; Ganguly, A.R.; Sanjay, J.; Mujumdar, M.; Krishnan, R.; Shah, R.D. Reliability of regional and global climate models to simulate precipitation extremes over India. J. Geophys. Res. Atmos. 2014, 119, 9301–9323. [Google Scholar] [CrossRef]
- Sharmila, S.; Joseph, S.; Chattopadhyay, R.; Sahai, A.K.; Goswami, B.N. Asymmetry in space-time characteristics of Indian summer monsoon intraseasonal oscillations during extreme years: Role of seasonal mean state. Int. J. Clim. 2014, 35, 1948–1963. [Google Scholar] [CrossRef]
- Dike, V.N.; Shimizu, M.H.; Diallo, M.; Lin, Z.; Nwofor, O.K.; Chineke, T.C. Modelling present and future African climate using CMIP5 scenarios in HadGEM2-ES. Int. J. Clim. 2014, 35, 1784–1799. [Google Scholar] [CrossRef]
- Gent, P.R.; Danabasoglu, G.; Donner, L.J.; Holland, M.M.; Hunke, E.C.; Jayne, S.R.; Lawrence, D.M.; Neale, R.B.; Rasch, P.J.; Vertenstein, M.; et al. The community climate system model version 4. J. Clim. 2011, 24, 4973–4991. [Google Scholar] [CrossRef]
- Chaturvedi, R.K.; Joshi, J.; Jayaraman, M.; Govindasamy, B.; Ravindranath, N.H. Multi-model climate change projections for India under representative concentration pathways. Curr. Sci. 2012, 103, 791–802. [Google Scholar]
- Elith, J.; Graham, C.H.; Anderson, R.P.; Dudík, M.; Ferrier, S.; Guisan, A.; Hijmans, R.J.; Huettmann, F.; Leathwick, J.R.; Lehmann, A.; et al. Novel methods improve prediction of species’ distributions from occurrence data. Ecography 2006, 29, 129–151. [Google Scholar] [CrossRef] [Green Version]
- Allouche, O.; Tsoar, A.; Kadmon, R. Assessing the accuracy of species distribution models: Prevalence, kappa and the true skill statistic (TSS). J. Appl. Ecol. 2006, 43, 1223–1232. [Google Scholar] [CrossRef]
- Thuiller, W.; Richardson, D.M.; Rouget, M.; Procheş, Ş.; Wilson, J.R.U. Interactions between environment, species traits, and human uses describe patterns of plant invasions. Ecology 2006, 87, 1755–1769. [Google Scholar] [CrossRef]
- Peterson, A.T.; Soberón, J.; Pearson, R.G.; Anderson, R.P.; Martínez-Meyer, E.; Nakamura, M.; Araújo, M.B. Ecological Niches and Geographic Distributions (MPB-49); Monographs in Population Biology 49; Princeton University Press: Princeton, NJ, USA, 2011. [Google Scholar]
- Lantz, C.A.; Nebenzahl, E. Behavior and interpretation of the κ statistic: Resolution of the two paradoxes. J. Clin. Epidemiol. 1996, 49, 431–434. [Google Scholar] [CrossRef]
- Phillips, S.J. A Brief Tutorial on Maxent. AT&T Research, Princeton University, and the Center for Biodiversity and Conservation. 2005. Available online: http://biodiversityinformatics.amnh.org/open_source/maxent/ (accessed on 12 March 2020).
- Vermeulen, S.J.; Campbell, B.M.; Ingram, J.S. Climate change and food systems. Annu. Rev. Environ. Resour. 2012, 37, 195–222. [Google Scholar] [CrossRef] [Green Version]
- Gopalakrishnan, T.; Hasan, K.; Haque, A.T.M.S.; Jayasinghe, S.L.; Kumar, L. Sustainability of coastal agriculture under climate change. Sustainability 2019, 11, 7200. [Google Scholar] [CrossRef] [Green Version]
- Van Vuuren, D.P.; Elzen, M.D.; Lucas, P.L.; Eickhout, B.; Strengers, B.J.; Van Ruijven, B.J.; Wonink, S.; Van Houdt, R. Stabilizing greenhouse gas concentrations at low levels: An assessment of reduction strategies and costs. Clim. Chang. 2007, 81, 119–159. [Google Scholar] [CrossRef] [Green Version]
- Revadekar, J.V.; Hameed, S.; Collins, D.; Manton, M.; Sheikh, M.; Borgaonkar, H.P.; Kothawale, M.A.; Ahmed, A.U.; Ashraf, J.; Baidya, S.; et al. Impact of altitude and latitude on changes in temperature extremes over South Asia during 1971. Int. J. Climatol. 2013, 33, 199–209. [Google Scholar] [CrossRef]
- Han, W.; Li, X.; Yan, P.; Zhang, L.; Ahammed, G.J. Tea Cultivation under Changing Climatic Conditions. Global Tea Science: Current Status and Future Needs; Burleigh Dodds Science Publishing: Cambridge, UK, 2018; pp. 455–472. [Google Scholar]
- Ramírez Villegas, J.; Jarvis, A. Downscaling global circulation model outputs: The delta method decision and policy analysis Working Paper No.1, International Center for Tropical Agriculture (CIAT). Policy Anal. Colomb. 2010, 1, 1–18. [Google Scholar]
- Jayasinghe, H.A.S.L.; Suriyagoda, L.D.B.; Karunarathne, A.S.; Wijeratna, M.A. Modelling shoot growth and yield of Ceylon tea cultivar TRI-2025 (Camellia sinensis (L.) O. Kuntze). J. Agric. Sci. 2018, 156, 200–214. [Google Scholar] [CrossRef]
- Indian Tea Association. India Tea. 2017. Available online: https://www.indiatea.org/ (accessed on 12 June 2020).
- Zhang, X.; Obringer, R.; Wei, C.; Chen, N.; Niyogi, D. Droughts in India from 1981 to 2013 and implications to wheat production. Sci. Rep. 2017, 7, 44552. [Google Scholar] [CrossRef] [PubMed] [Green Version]
- Yaduvanshi, A.; Zaroug, M.; Bendapudi, R.; New, M. Impacts of 1.5 °C and 2 °C global warming on regional rainfall and temperature change across India. Environ. Res. Commun. 2019, 1, 125002. [Google Scholar] [CrossRef]
- Ahmed, S.; Griffin, T.S.; Kraner, D.; Schaffner, M.K.; Sharma, D.; Hazel, M.; Leitch, A.R.; Orians, C.M.; Han, W.; Stepp, J.R.; et al. Environmental factors variably impact tea secondary metabolites in the context of climate change. Front. Plant Sci. 2019, 10, 939. [Google Scholar] [CrossRef] [PubMed] [Green Version]
- Donoghue, M.J.; Edwards, E.J. Biome shifts and niche evolution in plants. Annu. Rev. Ecol. Evol. Syst. 2014, 45, 547–572. [Google Scholar] [CrossRef] [Green Version]
- Petitpierre, B.; Kueffer, C.; Broennimann, O.; Randin, C.; Daehler, C.; Guisan, A. Climatic niche shifts are rare among terrestrial plant invaders. Science 2012, 335, 1344–1348. [Google Scholar] [CrossRef] [Green Version]
- Zhu, R.; Yang, L.; Liu, T.; Wen, X.; Zhang, L.; Chang, Y. Hydrological responses to the future climate change in a data scarce region, northwest China: Application of machine learning models. Water 2019, 11, 1588. [Google Scholar] [CrossRef] [Green Version]
Figure 1.
The marginal response curves of seven selected bioclimatic variables including in tea habitat distribution models of four tea-producing countries. Note. The habitat suitability of tea of four countries changes in varying degrees with (a) annual mean temperature (BIO1), (b) mean diurnal range (BIO2), (c) temperature seasonality (BIO4), (d) annual precipitation (BIO2), (e) precipitation of direst month (BIO14), (f) precipitation seasonality (BIO15), and (g) precipitation of wettest quarter (BIO16).
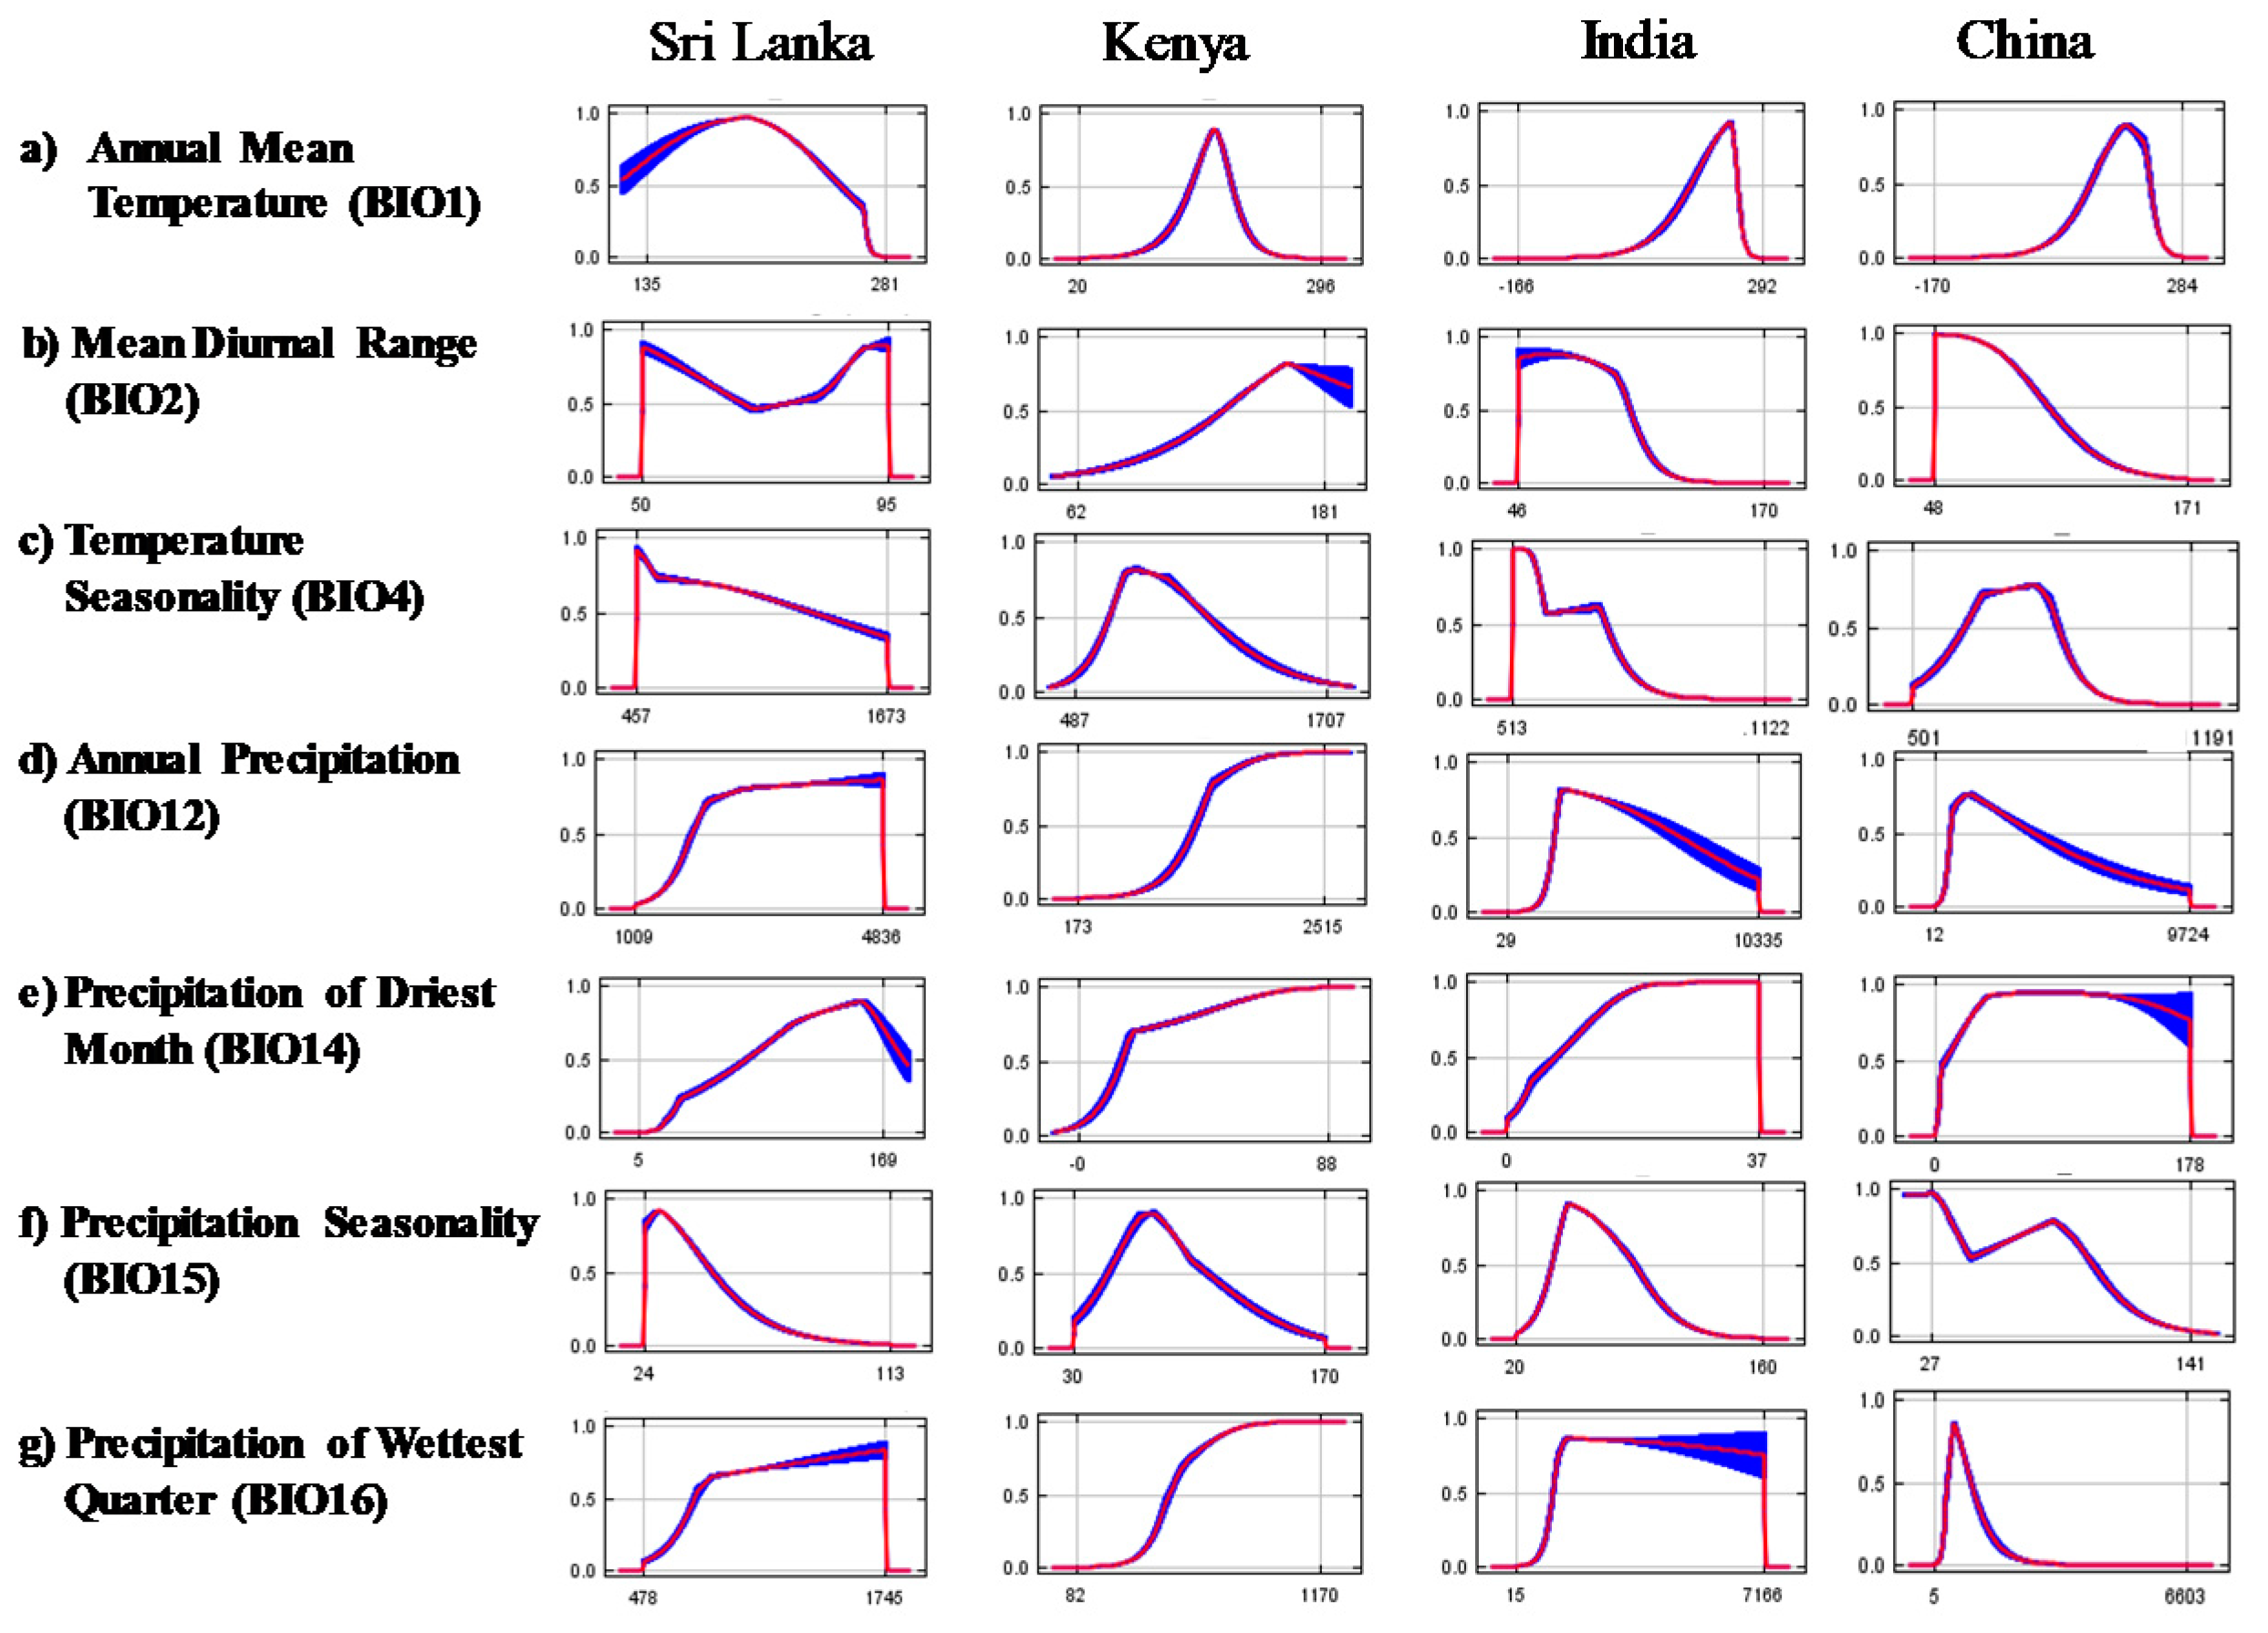
Figure 2.
Current and future habitat suitability for Camellia sinensis in Sri Lanka (a) and change detection (loss or gain of suitability area) (b).
Figure 2.
Current and future habitat suitability for Camellia sinensis in Sri Lanka (a) and change detection (loss or gain of suitability area) (b).
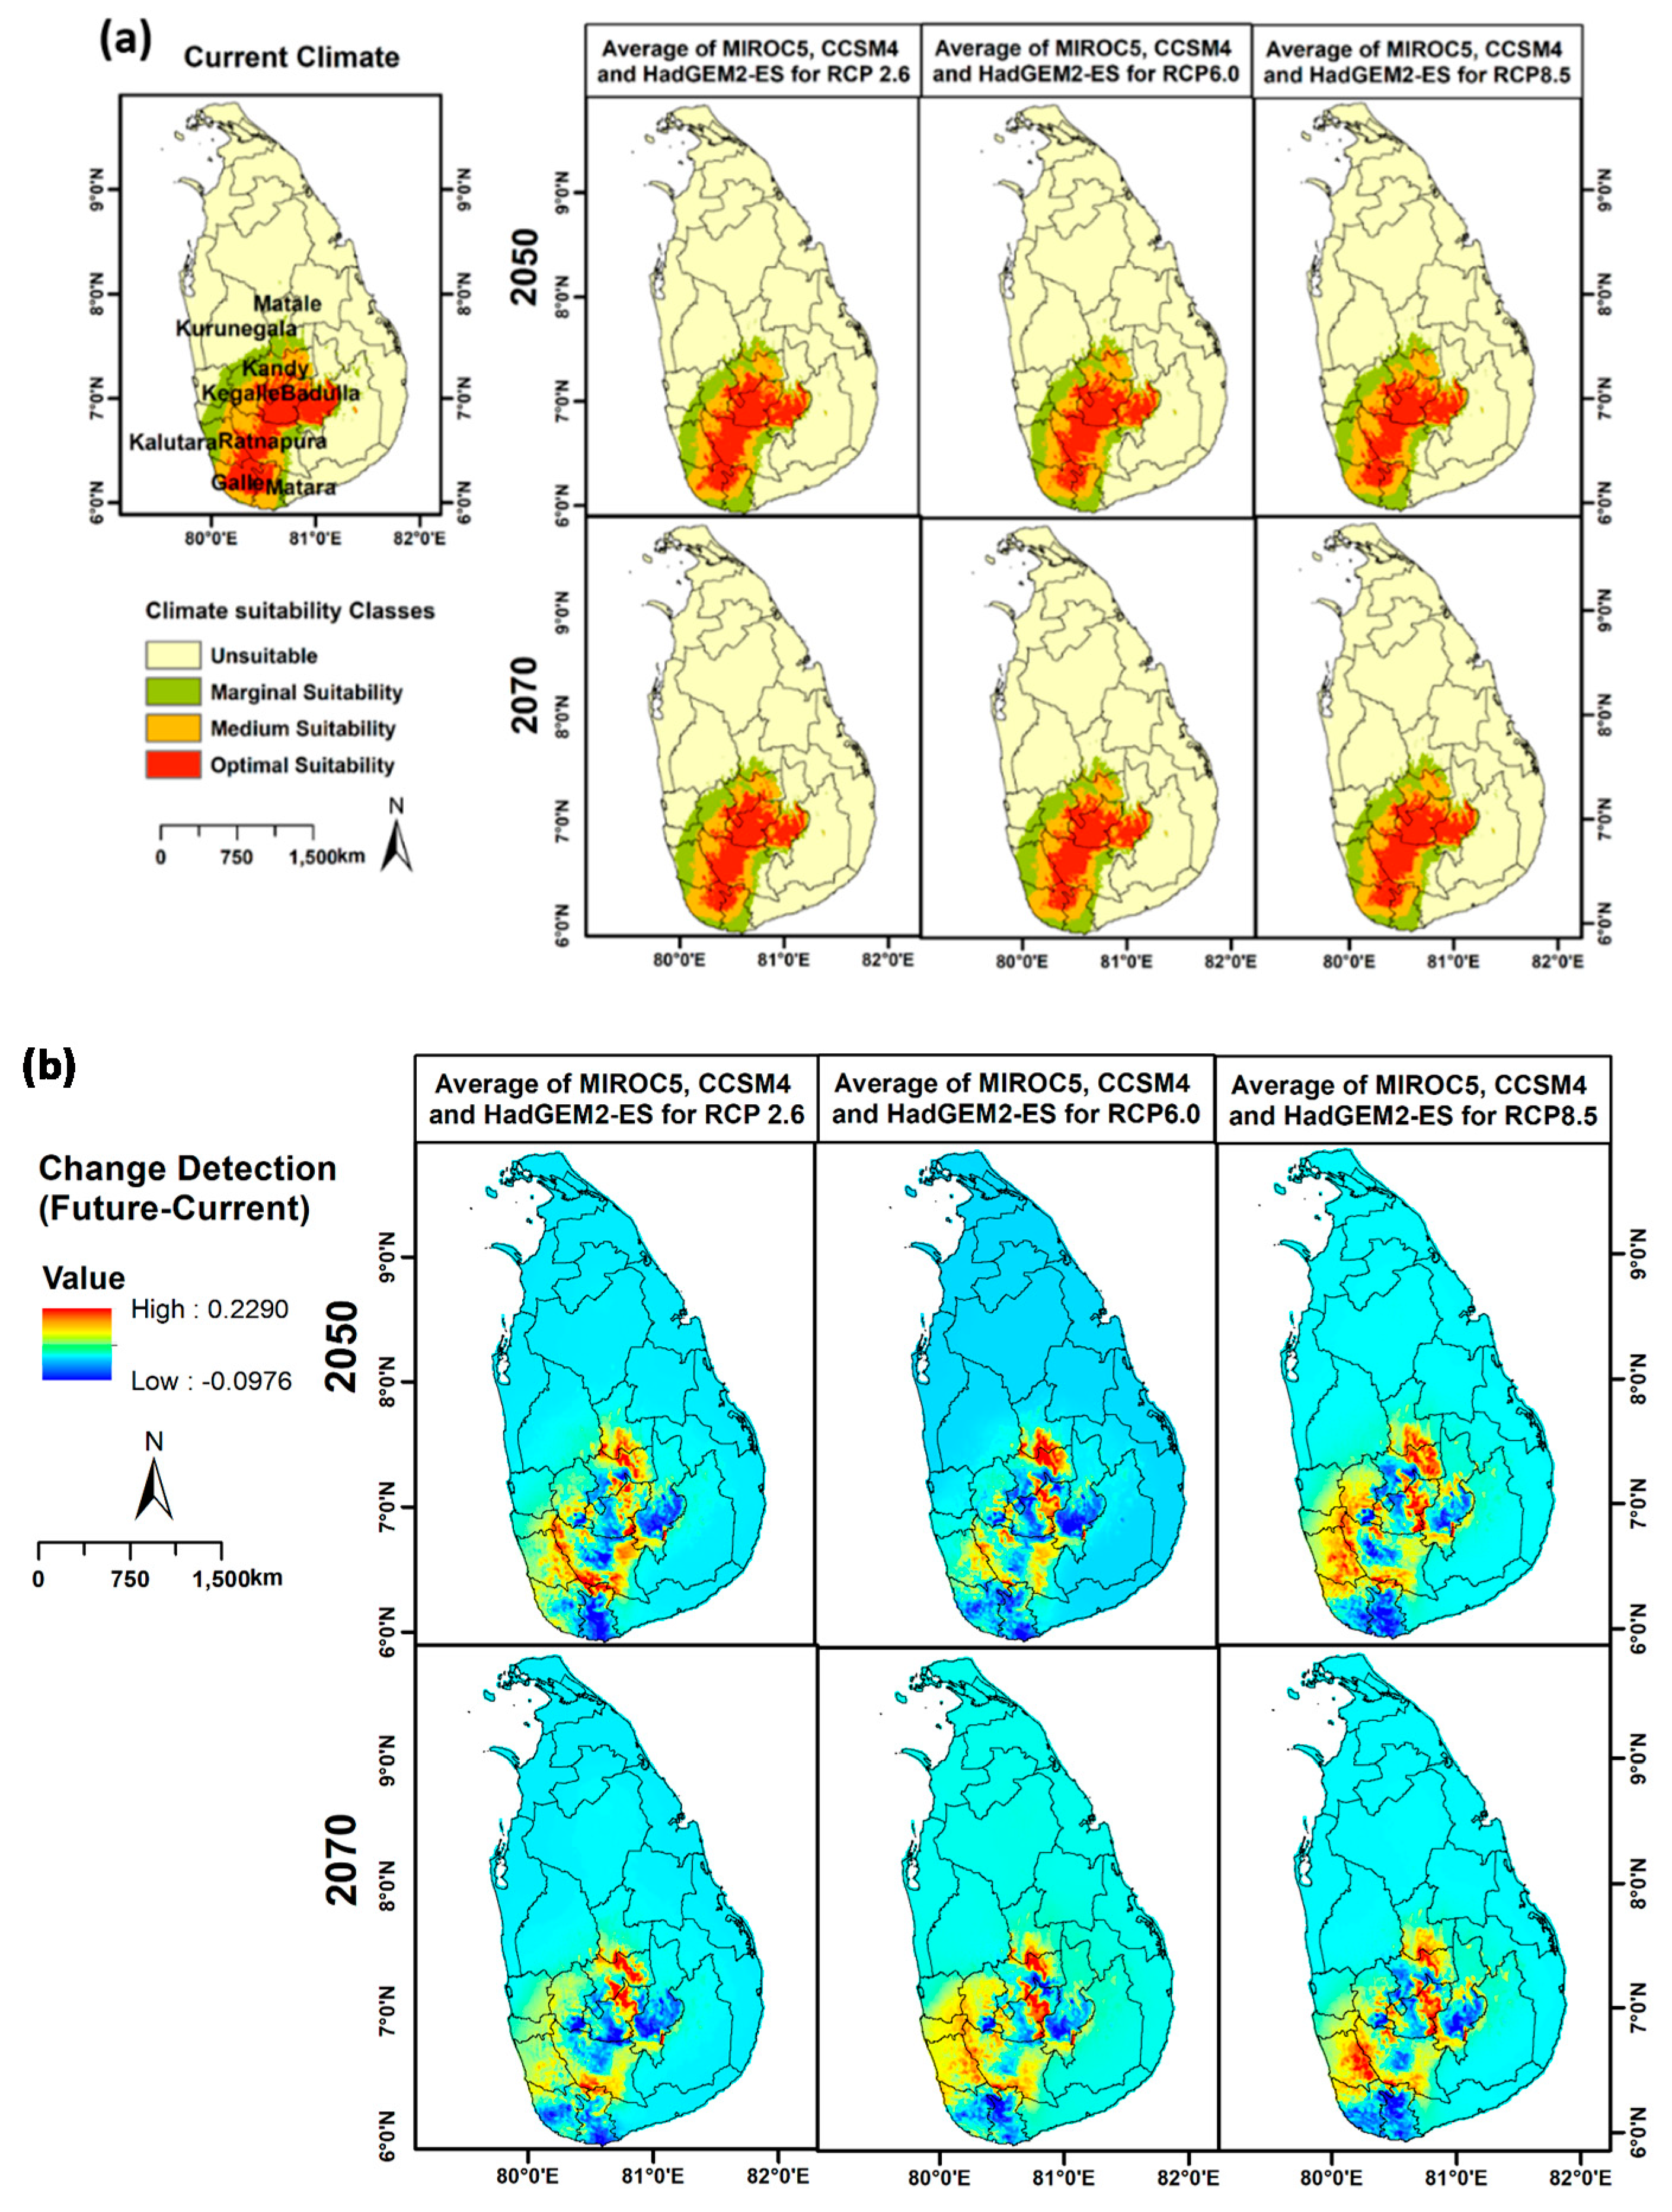
Figure 3.
Current and future habitat suitability for Camellia sinensis in Kenya (a) and change detection (loss or gain of suitability area) (b).
Figure 3.
Current and future habitat suitability for Camellia sinensis in Kenya (a) and change detection (loss or gain of suitability area) (b).
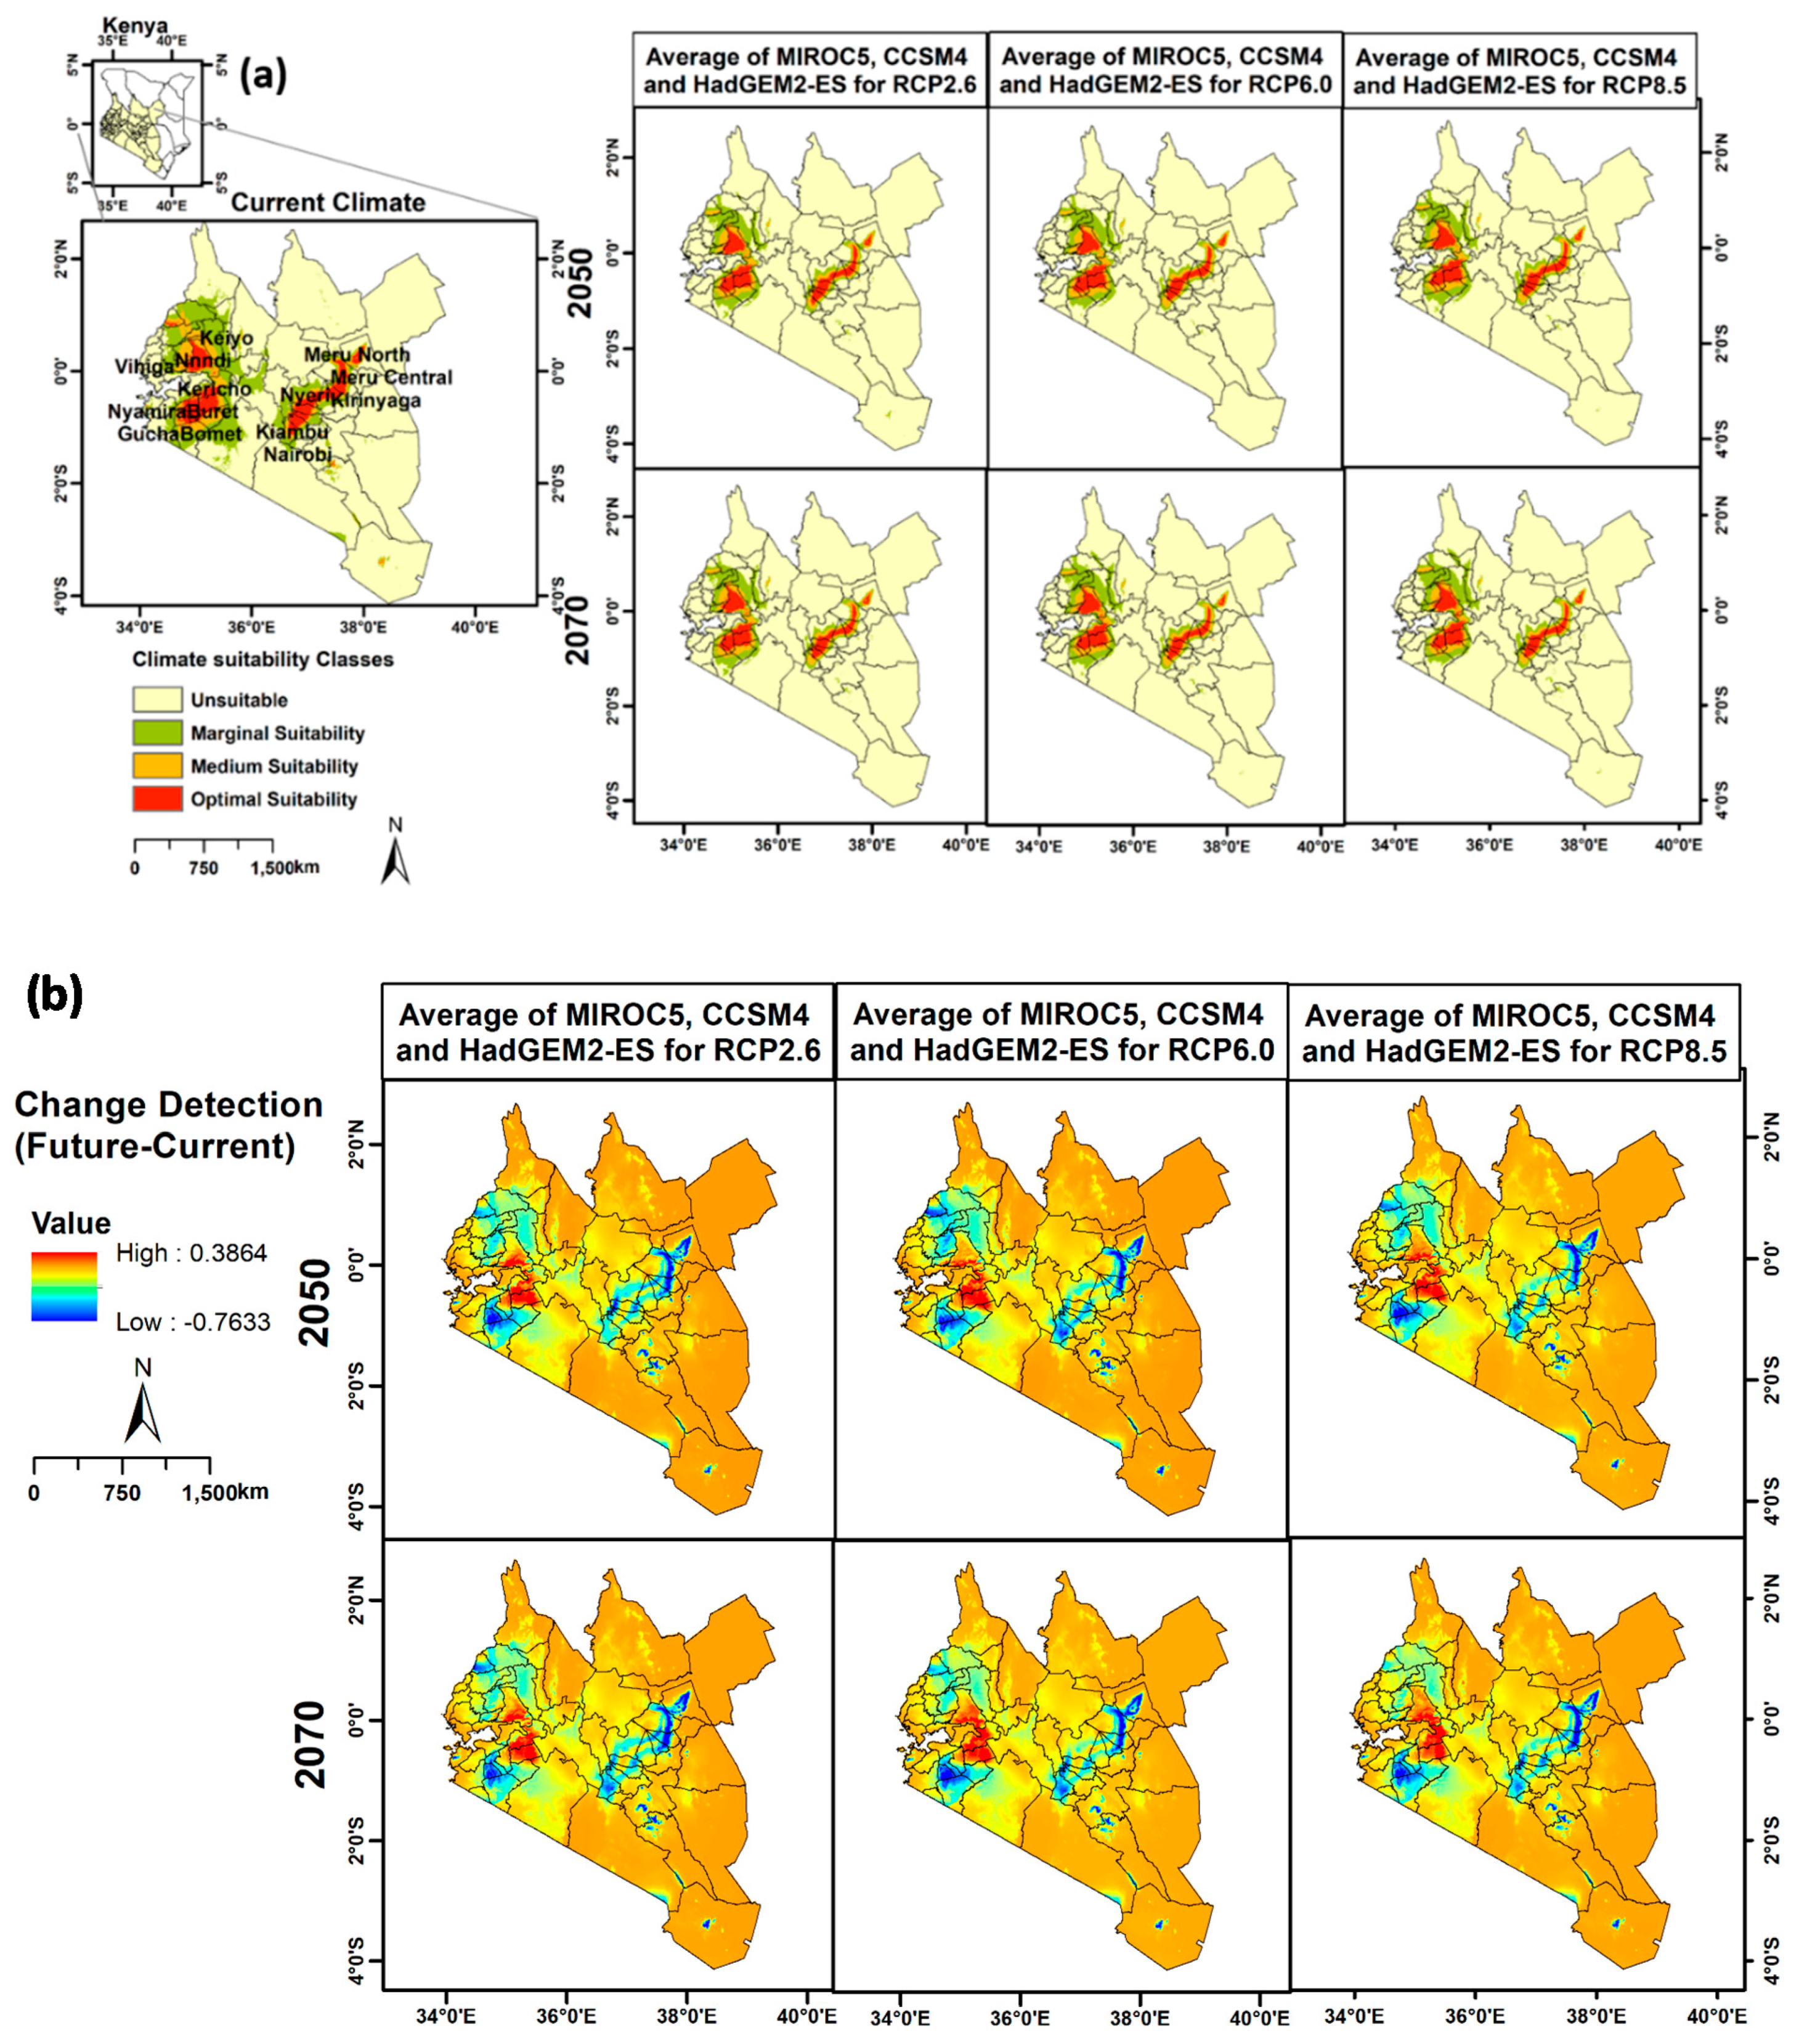
Figure 4.
Current and future habitat suitability for Camellia sinensis in India (a) and change detection (loss or gain of suitability area) (b).
Figure 4.
Current and future habitat suitability for Camellia sinensis in India (a) and change detection (loss or gain of suitability area) (b).

Figure 5.
Current and future habitat suitability for Camellia sinensis in China (a) and change detection (loss or gain of suitability area) (b).
Figure 5.
Current and future habitat suitability for Camellia sinensis in China (a) and change detection (loss or gain of suitability area) (b).

Table 1.
Results of accuracy metrics (area under the receiver operating curve (AUC), true skill statistic (TSS) and kappa tests) for Camellia sinensis tested for the four tea-producing countries (SD: standard deviation, k: maximum kappa).
Table 1.
Results of accuracy metrics (area under the receiver operating curve (AUC), true skill statistic (TSS) and kappa tests) for Camellia sinensis tested for the four tea-producing countries (SD: standard deviation, k: maximum kappa).
| Year | Representative Concentration Pathways (RCPs) | Global Circulation Models (GCM) | Threshold Independent (AUC) | Threshold Dependent | ||||||||||||||||||
|---|---|---|---|---|---|---|---|---|---|---|---|---|---|---|---|---|---|---|---|---|---|---|
| Sri Lanka | Kenya | India | China | Sri Lanka | Kenya | India | China | |||||||||||||||
| Training | Test | SD | Training | Test | SD | Training | Test | SD | Training | Test | SD | TSS | k | TSS | k | TSS | k | TSS | k | |||
| 2050 | RCP2.6 | HadGEM2-ES | 0.93 | 0.92 | 0.01 | 0.99 | 0.98 | 0.003 | 0.98 | 0.98 | 0.004 | 0.92 | 0.92 | 0.01 | 0.83 | 0.45 | 0.91 | 0.47 | 0.93 | 0.48 | 0.84 | 0.45 |
| CCSM4 | 0.93 | 0.92 | 0.01 | 0.98 | 0.99 | 0.002 | 0.98 | 0.98 | 0.003 | 0.92 | 0.90 | 0.01 | 0.78 | 0.44 | 0.94 | 0.48 | 0.94 | 0.48 | 0.72 | 0.41 | ||
| MIROC5 | 0.93 | 0.92 | 0.01 | 0.99 | 0.99 | 0.003 | 0.98 | 0.98 | 0.004 | 0.93 | 0.88 | 0.02 | 0.80 | 0.44 | 0.97 | 0.49 | 0.91 | 0.47 | 0.71 | 0.41 | ||
| RCP6.0 | HadGEM2-ES | 0.93 | 0.93 | 0.01 | 0.99 | 0.99 | 0.002 | 0.98 | 0.97 | 0.006 | 0.93 | 0.89 | 0.02 | 0.82 | 0.45 | 0.95 | 0.48 | 0.85 | 0.46 | 0.68 | 0.40 | |
| CCSM4 | 0.93 | 0.92 | 0.01 | 0.99 | 0.99 | 0.003 | 1.00 | 0.98 | 0.005 | 0.92 | 0.90 | 0.01 | 0.79 | 0.44 | 0.88 | 0.46 | 0.92 | 0.47 | 0.74 | 0.42 | ||
| MIROC5 | 0.93 | 0.91 | 0.01 | 0.99 | 0.99 | 0.001 | 0.98 | 0.97 | 0.005 | 0.92 | 0.97 | 0.01 | 0.78 | 0.43 | 0.96 | 0.49 | 0.92 | 0.47 | 0.83 | 0.45 | ||
| RCP8.5 | HadGEM2-ES | 0.93 | 0.93 | 0.01 | 0.99 | 0.99 | 0.001 | 0.98 | 0.98 | 0.005 | 0.92 | 0.92 | 0.01 | 0.84 | 0.45 | 0.96 | 0.49 | 0.91 | 0.47 | 0.78 | 0.43 | |
| CCSM4 | 0.93 | 0.92 | 0.01 | 0.99 | 0.99 | 0.001 | 0.98 | 0.97 | 0.005 | 0.90 | 0.90 | 0.01 | 0.78 | 0.44 | 0.98 | 0.49 | 0.91 | 0.47 | 0.69 | 0.40 | ||
| MIROC5 | 0.93 | 0.91 | 0.01 | 0.99 | 0.99 | 0.003 | 0.98 | 0.98 | 0.004 | 0.91 | 0.91 | 0.01 | 0.81 | 0.44 | 0.87 | 0.46 | 0.91 | 0.47 | 0.77 | 0.43 | ||
| 2070 | RCP2.6 | HadGEM2-ES | 0.94 | 0.92 | 0.01 | 0.99 | 0.99 | 0.003 | 0.98 | 0.98 | 0.005 | 0.92 | 0.90 | 0.01 | 0.82 | 0.45 | 0.90 | 0.47 | 0.91 | 0.47 | 0.71 | 0.42 |
| CCSM4 | 0.94 | 0.93 | 0.01 | 0.99 | 0.99 | 0.002 | 0.98 | 0.98 | 0.005 | 0.91 | 0.91 | 0.01 | 0.80 | 0.44 | 0.93 | 0.48 | 0.92 | 0.48 | 0.77 | 0.43 | ||
| MIROC5 | 0.93 | 0.91 | 0.01 | 0.99 | 0.99 | 0.005 | 0.98 | 0.98 | 0.005 | 0.92 | 0.91 | 0.01 | 0.78 | 0.43 | 0.85 | 0.45 | 0.92 | 0.47 | 0.70 | 0.41 | ||
| HadGEM2-ES | 0.94 | 0.91 | 0.01 | 0.99 | 0.99 | 0.003 | 0.98 | 0.97 | 0.006 | 0.92 | 0.92 | 0.01 | 0.82 | 0.45 | 0.89 | 0.47 | 0.87 | 0.46 | 0.68 | 0.40 | ||
| RCP6.0 | CCSM4 | 0.93 | 0.93 | 0.01 | 0.99 | 1.00 | 0.003 | 0.98 | 0.98 | 0.006 | 0.92 | 0.92 | 0.01 | 0.79 | 0.44 | 0.91 | 0.47 | 0.89 | 0.47 | 0.78 | 0.43 | |
| MIROC5 | 0.93 | 0.93 | 0.01 | 0.99 | 0.99 | 0.003 | 0.98 | 0.98 | 0.005 | 0.92 | 0.89 | 0.02 | 0.86 | 0.46 | 0.88 | 0.46 | 0.87 | 0.46 | 0.75 | 0.42 | ||
| RCP8.5 | HadGEM2-ES | 0.94 | 0.92 | 0.01 | 0.99 | 0.99 | 0.004 | 0.98 | 0.98 | 0.005 | 0.92 | 0.89 | 0.01 | 0.79 | 0.44 | 0.87 | 0.46 | 0.94 | 0.47 | 0.73 | 0.42 | |
| CCSM4 | 0.93 | 0.93 | 0.01 | 0.99 | 0.99 | 0.003 | 0.98 | 0.98 | 0.005 | 0.93 | 0.88 | 0.02 | 0.78 | 0.43 | 0.87 | 0.46 | 0.91 | 0.47 | 0.66 | 0.39 | ||
| MIROC5 | 0.93 | 0.91 | 0.01 | 0.99 | 0.99 | 0.004 | 0.98 | 0.98 | 0.004 | 0.92 | 0.90 | 0.01 | 0.79 | 0.44 | 0.87 | 0.46 | 0.93 | 0.48 | 0.72 | 0.41 | ||
| Current | 0.93 | 0.93 | 0.01 | 0.98 | 0.99 | 0.00 | 0.97 | 0.98 | 0.00 | 0.92 | 0.88 | 0.01 | 0.82 | 0.45 | 0.92 | 0.47 | 0.93 | 0.48 | 0.68 | 0.41 | ||
Table 2.
Contribution of bioclimatic variables that affect current and future suitability habitats of tea in the four tea-producing countries.
Table 2.
Contribution of bioclimatic variables that affect current and future suitability habitats of tea in the four tea-producing countries.
| Year | RCPs | GCMs | % Permutation Importance to Tea Suitability | |||||||||||||||||||
|---|---|---|---|---|---|---|---|---|---|---|---|---|---|---|---|---|---|---|---|---|---|---|
| Sri Lanka | Kenya | India | China | |||||||||||||||||||
| Bio15 | Bio1 | Bio14 | Bio4 | Bio2 | Bio1 | Bio16 | Bio12 | Bio4 | Bio2 | Bio12 | Bio1 | Bio2 | Bio15 | Bio4 | Bio1 | Bio16 | Bio4 | Bio15 | Bio14 | |||
| 2050 | RCP2.6 | HadGEM2-ES | 46.6 | 30.0 | 8.0 | 6.5 | 3.9 | 47.4 | 2.8 | 26.8 | 9.6 | 6.2 | 43.2 | 26.5 | 14.7 | 4.3 | 2.2 | 43.2 | 38.4 | 6.0 | 8.6 | 3.1 |
| CCSM4 | 58.2 | 20.8 | 8.0 | 3.7 | 6.0 | 40.4 | 19.5 | 1.2 | 0.6 | 1.7 | 10.2 | 34.2 | 30.1 | 7.6 | 10.7 | 54.2 | 27.4 | 6.9 | 6.8 | 4.6 | ||
| MIROC5 | 56.2 | 24.6 | 13.8 | 0.3 | 4.6 | 28.7 | 41.1 | 8.2 | 0.9 | 12.8 | 28.7 | 28.0 | 15.4 | 15.2 | 8.7 | 48.2 | 39.4 | 7.2 | 3.0 | 0.1 | ||
| Average | 53.7 | 25.1 | 9.9 | 3.5 | 4.8 | 38.8 | 21.1 | 12.1 | 3.7 | 6.9 | 27.4 | 29.6 | 20.1 | 9.0 | 7.2 | 48.5 | 35.1 | 6.7 | 6.1 | 2.6 | ||
| RCP6.0 | HadGEM2-ES | 62.9 | 18.0 | 7.9 | 4.7 | 3.9 | 55.4 | 1.2 | 9.1 | 8.1 | 15.9 | 53.9 | 20.9 | 6.2 | 6.9 | 5.4 | 57.8 | 28.8 | 3.6 | 8.9 | 0.7 | |
| CCSM4 | 50.2 | 28.9 | 14.6 | 1.2 | 4.7 | 45.3 | 19.9 | 12.8 | 8.0 | 9.2 | 12.3 | 38.8 | 27.3 | 5.6 | 11.0 | 46.6 | 37.1 | 5.7 | 5.9 | 1.5 | ||
| MIROC5 | 16.4 | 34.6 | 7.8 | 30.6 | 8.8 | 54.3 | 16.0 | 2.5 | 5.9 | 12.3 | 25.2 | 27.1 | 31.3 | 8.3 | 5.6 | 38.9 | 44.3 | 5.5 | 8.3 | 3.1 | ||
| Average | 43.2 | 27.2 | 10.1 | 12.2 | 5.8 | 51.7 | 12.4 | 8.1 | 7.3 | 12.5 | 30.5 | 28.9 | 21.6 | 6.9 | 7.3 | 47.8 | 36.7 | 4.9 | 7.7 | 1.8 | ||
| RCP8.5 | HadGEM2-ES | 58.0 | 17.0 | 7.4 | 3.5 | 7.3 | 56.9 | 3.1 | 20.8 | 2.0 | 8.2 | 56.1 | 22.8 | 4.1 | 4.7 | 5.0 | 35.0 | 44.8 | 15.9 | 3.0 | 1.3 | |
| CCSM4 | 74.2 | 12.6 | 6.2 | 0.3 | 2.2 | 51.7 | 7.3 | 23.6 | 4.9 | 8.1 | 23.5 | 30.7 | 25.2 | 7.6 | 8.4 | 45.4 | 35.1 | 5.0 | 5.6 | 8.0 | ||
| MIROC5 | 33.2 | 20.0 | 10.3 | 19.3 | 8.8 | 52.4 | 11.2 | 5.3 | 8.0 | 13.3 | 31.1 | 23.9 | 20.3 | 10.6 | 8.5 | 46.4 | 16.5 | 21.3 | 0.0 | 15.8 | ||
| Average | 55.1 | 16.5 | 8.0 | 7.7 | 6.1 | 53.7 | 7.2 | 16.6 | 5.0 | 9.9 | 36.9 | 25.8 | 16.5 | 7.6 | 7.3 | 42.3 | 32.1 | 14.1 | 2.9 | 8.4 | ||
| 2070 | RCP2.6 | HadGEM2-ES | 64.3 | 16.9 | 8.0 | 2.5 | 3.6 | 54.3 | 22.0 | 4.0 | 5.6 | 10.2 | 49.9 | 28.6 | 7.7 | 5.3 | 3.4 | 53.0 | 36.8 | 4.5 | 5.7 | 0.0 |
| CCSM4 | 63.3 | 21.3 | 8.2 | 0.8 | 4.5 | 66.7 | 7.2 | 7.2 | 6.0 | 9.5 | 7.3 | 47.9 | 28.1 | 5.3 | 7.5 | 68.8 | 18.4 | 7.7 | 3.9 | 0.5 | ||
| MIROC5 | 62.2 | 14.8 | 8.7 | 3.1 | 3.1 | 48.0 | 15.7 | 11.6 | 6.1 | 3.8 | 21.9 | 32.0 | 27.2 | 10.6 | 4.8 | 26.3 | 26.3 | 23.2 | 3.3 | 7.5 | ||
| Average | 63.3 | 17.7 | 8.3 | 2.1 | 3.7 | 56.3 | 15.0 | 7.6 | 5.9 | 7.8 | 26.4 | 36.2 | 21.0 | 7.1 | 5.2 | 49.4 | 27.2 | 11.8 | 4.3 | 2.7 | ||
| RCP6.0 | HadGEM2-ES | 75.2 | 10.1 | 5.6 | 1.6 | 4.4 | 43.9 | 6.3 | 14.5 | 9.1 | 8.4 | 54.6 | 23.5 | 6.3 | 5.9 | 3.3 | 43.3 | 30.3 | 11.4 | 11.5 | 1.9 | |
| CCSM4 | 56.9 | 19.3 | 9.5 | 0.9 | 5.5 | 72.1 | 1.9 | 14.9 | 2.1 | 5.7 | 12.9 | 37.9 | 30.8 | 6.8 | 8.4 | 36.0 | 39.5 | 7.7 | 9.0 | 6.4 | ||
| MIROC5 | 29.1 | 29.0 | 3.5 | 22.7 | 4.0 | 44.7 | 5.3 | 22.0 | 9.6 | 12.9 | 12.9 | 36.1 | 33.4 | 7.4 | 4.3 | 49.1 | 36.1 | 3.9 | 1.6 | 8.9 | ||
| Average | 53.7 | 19.5 | 6.2 | 8.4 | 4.6 | 53.6 | 4.5 | 17.1 | 6.9 | 9.0 | 26.8 | 32.5 | 23.5 | 6.7 | 5.3 | 42.8 | 35.3 | 7.7 | 7.4 | 5.7 | ||
| RCP8.5 | HadGEM2-ES | 62.9 | 15.5 | 8.8 | 2.0 | 6.1 | 44.7 | 16.2 | 23.1 | 2.2 | 6.8 | 67.5 | 12.8 | 2.1 | 4.1 | 1.9 | 47.6 | 30.9 | 10.5 | 7.2 | 3.8 | |
| CCSM4 | 44.4 | 30.7 | 10.7 | 4.7 | 6.8 | 59.9 | 10.4 | 5.9 | 13.3 | 4.3 | 13.1 | 34.2 | 20.3 | 14.7 | 11.4 | 21.1 | 43.0 | 16.2 | 7.6 | 6.7 | ||
| MIROC5 | 65.2 | 23.5 | 4.6 | 0.6 | 5.8 | 34.4 | 3.7 | 27.6 | 9.2 | 13.2 | 19.8 | 36.2 | 22.3 | 10.2 | 8.1 | 40.9 | 13.5 | 24.1 | 3.6 | 12.3 | ||
| Average | 57.5 | 23.2 | 8.0 | 2.4 | 6.2 | 46.3 | 10.1 | 18.9 | 8.2 | 8.1 | 33.5 | 27.7 | 14.9 | 9.7 | 7.1 | 36.5 | 29.1 | 16.9 | 6.1 | 7.6 | ||
| Current Climate | 68.9 | 15.0 | 9.2 | 2.6 | 3.8 | 46.7 | 31.4 | 0.9 | 6.1 | 8.3 | 58.9 | 20.7 | 3.2 | 3.3 | 8.3 | 51.1 | 33.7 | 5.6 | 6.5 | 0.9 | ||
Table 3.
Areas (km2) of suitable habitats for Camellia sinensis in (a) Sri Lanka, (b) Kenya, (c) India and (d) China under current and future climate conditions.
Table 3.
Areas (km2) of suitable habitats for Camellia sinensis in (a) Sri Lanka, (b) Kenya, (c) India and (d) China under current and future climate conditions.
| Country | Year | Average of Three GCMs | Unsuitable | Marginal | Medium | Optimal | ||||
|---|---|---|---|---|---|---|---|---|---|---|
| Area | % | Area | % | Area | % | Area | % | |||
| (a) Sri Lanka | 2050 | RCP2.6 | 50781.8 | 77.5 | 4719.2 | 7.2 | 4550.7 | 6.9 | 5487.4 | 8.3 |
| RCP6.0 | 51050.3 | 77.9 | 4445.3 | 6.8 | 4885.5 | 7.4 | 5158.0 | 7.8 | ||
| RCP8.5 | 50904.0 | 77.7 | 4678.8 | 7.1 | 4832.1 | 7.4 | 5124.1 | 7.8 | ||
| 2070 | RCP2.6 | 50853.5 | 77.6 | 4724.0 | 7.2 | 4776.3 | 7.3 | 5185.3 | 7.9 | |
| RCP6.0 | 50823.1 | 77.6 | 4857.0 | 7.4 | 4907.2 | 7.5 | 4951.8 | 7.5 | ||
| RCP8.5 | 50897.1 | 77.6 | 4722.3 | 7.2 | 4597.5 | 7.0 | 5388.8 | 8.2 | ||
| Current | 48594.0 | 74.1 | 5086.0 | 7.8 | 5769.0 | 8.8 | 6090.0 | 9.3 | ||
| (b) Kenya | 2050 | RCP2.6 | 220496.3 | 88.6 | 13941.6 | 5.6 | 6800.5 | 2.7 | 7502.1 | 3.0 |
| RCP6.0 | 220457.2 | 88.6 | 13871.4 | 5.6 | 6699.8 | 2.7 | 7712.0 | 3.1 | ||
| RCP8.5 | 219723.4 | 88.3 | 14530.5 | 5.8 | 6837.6 | 2.7 | 7649.0 | 3.1 | ||
| 2070 | RCP2.6 | 220247.0 | 88.5 | 13914.7 | 5.6 | 6914.3 | 2.8 | 7664.4 | 3.1 | |
| RCP6.0 | 219200.3 | 88.1 | 15404.7 | 6.2 | 6694.7 | 2.7 | 7440.8 | 3.0 | ||
| RCP8.5 | 219596.4 | 88.3 | 14642.3 | 5.9 | 6895.8 | 2.8 | 7605.9 | 3.1 | ||
| Current | 198806.2 | 79.9 | 28523.1 | 11.5 | 11078.6 | 4.5 | 10,332.5 | 4.2 | ||
| (c) India | 2050 | RCP2.6 | 2861118.4 | 87.6 | 179210.2 | 5.5 | 104991.0 | 3.2 | 119,679.5 | 3.7 |
| RCP6.0 | 2868920.3 | 87.9 | 170957.0 | 5.2 | 103379.4 | 3.2 | 121,742.4 | 3.7 | ||
| RCP8.5 | 2875232.6 | 88.1 | 160488.6 | 4.9 | 104414.5 | 3.2 | 124,863.3 | 3.8 | ||
| 2070 | RCP2.6 | 2886936.8 | 88.4 | 159060.2 | 4.9 | 108548.3 | 3.3 | 110,453.8 | 3.4 | |
| RCP6.0 | 2901247.1 | 88.9 | 142434.1 | 4.4 | 106483.0 | 3.3 | 114,834.8 | 3.5 | ||
| RCP8.5 | 2857334.6 | 87.5 | 183818.3 | 5.6 | 111490.4 | 3.4 | 112,355.7 | 3.4 | ||
| Current | 2945186.5 | 90.2 | 121331.8 | 3.7 | 131295.0 | 4.0 | 67,185.7 | 2.1 | ||
| (d) China | 2050 | RCP2.6 | 5377177.4 | 57.4 | 1102303.9 | 11.8 | 1068413.9 | 11.4 | 1,824,387.9 | 19.5 |
| RCP6.0 | 5410695.3 | 57.7 | 1126743.3 | 12.0 | 1011211.8 | 10.8 | 1,823,632.7 | 19.5 | ||
| RCP8.5 | 5385041.4 | 57.5 | 1110481.1 | 11.8 | 1047701.7 | 11.2 | 1,829,059.0 | 19.5 | ||
| 2070 | RCP2.6 | 5356141.0 | 57.1 | 1110356.0 | 11.8 | 1049321.0 | 11.2 | 1,856,465.0 | 19.8 | |
| RCP6.0 | 5315201.2 | 56.7 | 1172110.8 | 12.5 | 1091489.1 | 11.6 | 1,793,482.1 | 19.1 | ||
| RCP8.5 | 5604752.3 | 59.8 | 951361.0 | 10.2 | 1119706.3 | 11.9 | 1,696,463.5 | 18.1 | ||
| Current | 5713983.8 | 61.0 | 850069.6 | 9.1 | 1003218.9 | 10.7 | 1,804,999.1 | 19.3 | ||
Table 4.
Changes in habitat suitability areas [% of loss (−) or gain (+)] for Camellia sinensis by 2050 and 2070.
Table 4.
Changes in habitat suitability areas [% of loss (−) or gain (+)] for Camellia sinensis by 2050 and 2070.
| Country | Year | Average of MIROC5, CCSM4 and HadGEM2-ES for RCPs | % of Loss (−) or Gain (+) of Suitability Area (%) | Optimal Climate Suitability Area for Tea (km2) and % of Loss (−) or Gain (+) | |||
|---|---|---|---|---|---|---|---|
| Unsuitable | Marginal | Medium | Optimal | ||||
| (a) Sri Lanka | 2050 | RCP2.6 | 4.5 | −7.2 | −21.1 | −9.9 | 5226 (−14%) |
| RCP6.0 | 5.1 | −12.6 | −15.3 | −15.3 | |||
| RCP8.5 | 4.8 | −8.0 | −16.2 | −15.9 | |||
| 2070 | RCP2.6 | 4.6 | −7.1 | −17.2 | −14.9 | 5175 (−15.1) | |
| RCP6.0 | 4.6 | −4.5 | −14.9 | −18.7 | |||
| RCP8.5 | 4.7 | −7.2 | −20.3 | −11.5 | |||
| (b) Kenya | 2050 | RCP2.6 | 10.9 | −51.1 | −38.6 | −27.4 | 7621 (−26.2%) |
| RCP6.0 | 10.9 | −51.4 | −39.5 | −25.4 | |||
| RCP8.5 | 10.5 | −49.1 | −38.3 | −26.0 | |||
| 2070 | RCP2.6 | 10.8 | −51.2 | −37.6 | −25.8 | 7570 (−28.6) | |
| RCP6.0 | 10.3 | −46.0 | −39.6 | −28.0 | |||
| RCP8.5 | 10.5 | −48.7 | −37.8 | −26.4 | |||
| (c) India | 2050 | RCP2.6 | -0.3 | 18.6 | −21.6 | 21.5 | 74,999 (15%) |
| RCP6.0 | 0.8 | 5.7 | −28.1 | 9.4 | |||
| RCP8.5 | 1.1 | −5.0 | −22.8 | 6.3 | |||
| 2070 | RCP2.6 | 0.1 | 11.3 | −19.6 | 12.4 | 81,358 (25%) | |
| RCP6.0 | −0.1 | 14.8 | −24.9 | 28.6 | |||
| RCP8.5 | −0.3 | 16.7 | −20.4 | 24.8 | |||
| (d) China | 2050 | RCP2.6 | −1.0 | 5.7 | 6.3 | −3.0 | 172,860 (−4.7%) |
| RCP6.0 | 0.3 | 7.1 | 3.7 | −6.2 | |||
| RCP8.5 | −1.1 | 6.4 | 7.2 | −3.5 | |||
| 2070 | RCP2.6 | −1.0 | 7.0 | 4.9 | −2.7 | 1,749,517 (−2.6%) | |
| RCP6.0 | −1.7 | 8.2 | 6.8 | −2.3 | |||
| RCP8.5 | 0.2 | −3.8 | 9.8 | −4.2 | |||
Note: A summary of average area (km2) of optimal suitability with the percentage of loss (−) or gain (+) is given in the last column compared to current climate.
© 2020 by the authors. Licensee MDPI, Basel, Switzerland. This article is an open access article distributed under the terms and conditions of the Creative Commons Attribution (CC BY) license (http://creativecommons.org/licenses/by/4.0/).
Share and Cite
MDPI and ACS Style
Jayasinghe, S.L.; Kumar, L. Climate Change May Imperil Tea Production in the Four Major Tea Producers According to Climate Prediction Models. Agronomy 2020, 10, 1536. https://doi.org/10.3390/agronomy10101536
AMA Style
Jayasinghe SL, Kumar L. Climate Change May Imperil Tea Production in the Four Major Tea Producers According to Climate Prediction Models. Agronomy. 2020; 10(10):1536. https://doi.org/10.3390/agronomy10101536
Chicago/Turabian StyleJayasinghe, Sadeeka Layomi, and Lalit Kumar. 2020. "Climate Change May Imperil Tea Production in the Four Major Tea Producers According to Climate Prediction Models" Agronomy 10, no. 10: 1536. https://doi.org/10.3390/agronomy10101536
Note that from the first issue of 2016, this journal uses article numbers instead of page numbers. See further details here.