Article

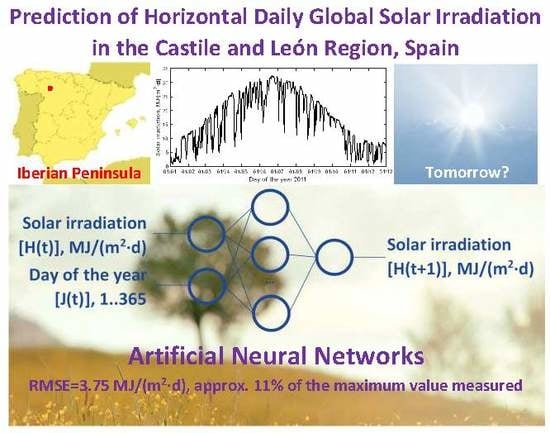
Prediction of Horizontal Daily Global Solar Irradiation Using Artificial Neural Networks (ANNs) in the Castile and León Region, Spain

by
Francisco J. Diez
1,*,
Luis M. Navas-Gracia
1,
Leticia Chico-Santamarta
2,
Adriana Correa-Guimaraes
1 and
Andrés Martínez-Rodríguez
1
1
Department of Agricultural and Forestry Engineering, University of Valladolid, Campus La Yutera, 34004 Palencia, Spain
2
International Department, Harper Adams University, Newport TF10 8NB, Shropshire, UK
*
Author to whom correspondence should be addressed.
Agronomy 2020, 10(1), 96; https://doi.org/10.3390/agronomy10010096
Submission received: 26 November 2019 / Revised: 30 December 2019 / Accepted: 5 January 2020 / Published: 9 January 2020
(This article belongs to the Special Issue Selected Papers from 10th Iberian Agroengineering Congress)

Abstract

:
This article evaluates horizontal daily global solar irradiation predictive modelling using artificial neural networks (ANNs) for its application in agricultural sciences and technologies. An eight year data series (i.e., training networks period between 2004–2010, with 2011 as the validation year) was measured at an agrometeorological station located in Castile and León, Spain, owned by the irrigation advisory system SIAR. ANN models were designed and evaluated with different neuron numbers in the input and hidden layers. The only neuron used in the outlet layer was the global solar irradiation simulated the day after. Evaluated values of the input data were the horizontal daily global irradiation of the current day [H(t)] and two days before [H(t−1), H(t−2)], the day of the year [J(t)], and the daily clearness index [Kt(t)]. Validated results showed that best adjustment models are the ANN 7 model (RMSE = 3.76 MJ/(m2·d), with two inputs ([H(t), Kt(t)]) and four neurons in the hidden layer) and the ANN 4 model (RMSE = 3.75 MJ/(m2·d), with two inputs ([H(t), J(t)]) and two neurons in the hidden layer). Thus, the studied ANN models had better results compared to classic methods (CENSOLAR typical year, weighted moving mean, linear regression, Fourier and Markov analysis) and are practically easier as they need less input variables.

Graphical Abstract

1. Introduction

Solar radiation affects all the Earth’s processes related to plant growing and the environment, and it plays a fundamental role in the development of human activities. Among these processes, solar radiation influences the primary production of plants by means of the photosynthesis process and the temperature and water evaporation into the atmosphere and, consequently, also humidity of ground and air [1]. Therefore, solar radiation data at ground level are important for a wide range of applications in agricultural sciences [2], particularly for agricultural hydrology, soil physics, monitoring plant growth and disease control, and estimating crop evapotranspiration for irrigation, as well as in meteorology, engineering, and research in the natural sciences.
Many computer simulation models, which predict growth, development, and yield of agronomic and horticultural crops, require daily weather data as input. Evapotranspiration, which is very important for applications in agriculture and environment, can be calculated as a function of several meteorological data including solar radiation [3,4].
Solar radiation is a function of multiple variables. Iqbal [5] details perfectly how to determine quantitatively the amount of solar radiation incident on a surface of the Earth. Existing solar irradiation models can be classified according to different criteria [1]: (1) Output data (direct, diffuse, or global radiation); (2) input data (used predicted variables, which can be meteorological or geographical); (3) model spatial resolution (for a particular location or for large areas); (4) model temporal resolution (according to the application: short term predictions, for example every each minute, used in solar position monitoring devices in concentrated solar installations; time predictions, used for simulations of the solar thermal systems behavior at low temperature; and daily predictions, commonly used in agricultural meteorology); (5) solar radiation wavelength, which is herein of interest; (6) modelling algorithm type (deterministic or algorithm); (7) simulation model type (physical or formal; statistical or empiric); (8) caption surface geometry (horizontal, leaning surfaces or with solar position monitoring); (9) sky types (clear sky, partly cloudy, or cloud cover, based on the cloud presence influence).
On the other hand, different artificial intelligence techniques—such as artificial neuronal networks (ANNs), genetic algorithms, fuzzy logic, or hybrid techniques generated as a result of the previous ones—have been used in different ways to estimate solar irradiation [6], considering different time scales (monthly, daily, and hourly), using different meteorological variables (for example, temperature and air relative humidity, wind speed, cloudiness, daytime period duration, clarity index, and atmospheric pressure), or including geographical coordinates (latitude, longitude, and altitude) from the locations where the predictions are applied. Qazi et al. [7] reviewed different articles that apply ANNs for solar irradiation simulation and they concluded that this technique results in good precision prediction, with errors smaller than 20% based on the input data used and the architecture of the selected ANN. Further, they concluded that it is necessary to do more research into ANN solar modelling in order to provide better adjusted predictions.
Furthermore, results on the ANNs solar irradiation modelling have been compared with those obtained applying other statistical modelling techniques, such as atmospheric sciences [8], which allowed for the identification of ANNs, mainly when the meteorological conditions are complex [9], concluding that ANN models obtained better prediction results. On this matter, Yadav and Chandel [10] verified the best predicted ANN behavior compared with conventional methods, reporting that ANN models adjustment depends on the input parameters combinations (they use sunshine hour and air temperature), training algorithm, and ANN architecture (they used a model with learning machine algorithm).
For their part, Ghimire et al. [11], for the global solar irradiation estimation, used machine learning models based on ANNs, obtaining better results that when other models are used, such as support vector regression (SVR), gaussian process machine learning (GPML), and genetic programming (GP).
The influence of the input variables is an important aspect which was already mentioned in the ANNs solar radiation modelling, in which, explicitly or implicitly, the geographical location factor appears when the simulation is applied. Thus, Shah et al. [12] estimated the diffuse solar radiation monthly average, daily and hourly, under different meteorological conditions measured in India, providing data of nine variables to the input neuronal layer (latitude, longitude, month of the year, temperature and air humidity, rainfall, air speed, and long wavelength solar radiation). However, in the same country, Rao et al. [13] estimated the daily global solar irradiation, monthly average, and found that the best input combination was the difference between the maximum and minimum daily temperatures and the extra-terrestrial solar radiation, obtaining with them a very small prediction error (RMSE = 3.96%). Furthermore, the same authors concluded that ANN models presented better prediction statistic than conventional classical models of simulation, also employing a generally smaller input variable number. Seme et al. [14], for the Slovenian meteorological conditions, estimated the global solar irradiation every 30 min, using five input variables in their ANN model (i.e., extra-terrestrial solar radiation, solar zenith angle, day of the year, temperature, and relative atmospheric pressure), obtaining good prediction results but only for those days when the cloudiness was low.
Mentioning other applications, ANNs have also been used to obtain solar irradiation maps in large territorial surfaces through the generation of solar irradiation data synthetic series, when the quantity and quality of the available measures is not the appropriate one, such as is the case of Sözen et al. [15] in Turkey, Hontoria et al. [16,17] in Spain, or Siqueira et al. [18] in Brazil.
On the other hand, despite the use of ANNs, other modelling techniques, based on artificial intelligence, have also been used to predict solar radiation, its components, and related phenomena associated to solar influence. In this way, the Ångström regression equation has been improved through fuzzy logic techniques working with data from Turkey [19] and ANNs with data from Cyprus [20] or Iran [21,22]. Using meteorological data of Algeria, Mellit et al. [23] presented an application of the adaptive network-fuzzy inference system (ANFIS) and Markov’s matrix to estimate the sequences of the monthly average clearness index and the daily global solar irradiation, on the basis of the geographical coordinates of the evaluated positions (i.e., latitude, longitude, and altitude). In the same line of research, López et al. [24] used the bayesian method to evaluate the relative importance of atmospheric variables and radiometric as an input to an ANNs model, which resulted in the finding that the clearness index and the relative air mass as the most important variables to estimate the hourly direct solar irradiation. Equally, for the meteorological conditions of Thailand, Pattanasethanon et al. [25] studied the available solar irradiation in a tropical climate with different sky cloudiness scenarios.
The use of solar radiation data measured in previous days (delay days) highly improves the precision of any simulation model, amongst which we find ANNs. Thus, Mellit and Pavan [26] predicted solar irradiation the day after, in Italian meteorological conditions, with the last 24 h of data collection (using as input data the daily irradiance and the average daily air temperature), proving that the model works perfectly in sunny days but reduces the efficiency in cloudy days. Based on Corsica (France) conditions, Paoli et al. [27], in their ANN model, used daily solar irradiation values from 1 to 15 delay days, as well as a normalization of solar irradiation data in the Earth surfaced in relation to extra-terrestrial solar radiation data, thus improving the measured and predicted data correlation. In Greece, Zervas et al. [28] used six different clearness index levels and previously measured solar irradiance values (based in 10 min test) to predict hourly solar global irradiance and the solar midday. Mellit et al. [29,30] used an ANN hybrid model and Markov matrixes to predict daily global solar irradiation in Algeria, using solar irradiation values with some delay days. For Chinese meteorological conditions, Cao et al. [31,32,33,34] used different wavelength setting neuronal networks to predict solar irradiance, analysing the importance of different influential values, amongst which we can find air mass, clouds, and the wavelength of the incidental solar radiation (atmospheric influence).
Recently, Caldas and Alonso-Suárez [35] studied the prediction of solar irradiance in the short term (1–10 min), combined with all-sky images and irradiance measurements. Paulescu and Paulescu [36] evaluated five statistical models for the immediate prediction of solar irradiance in Romania, without classifying any of the models as the best one. Heydari et al. [37] developed a method based on various sections (wavelet transform, hybrid feature selection, group method of data handling neural network, and modified multi-objective fruit fly optimization algorithm) for the short term prediction of wind speed and solar radiation, with the objective of analyzing the energy consumption in the Favignana island microgrid, in the south of Italy.
In this article, the horizontal daily global solar irradiation for the day after (i.e., [H(t+1)]) is studied though models based on ANNs and using data measured from Mansilla Mayor (León, Spain). The main objective of this work was to achieve improved solar radiation daily predictors with agricultural purposes in order to obtain a better prediction of the [H(t+1)], using the least possible number of inputs, with the aim of facilitating its practical application in irrigation needs processes and evaluation systems or to predict plant growth or disease control. With that purpose, different ANNs were evaluated with solar radiation data with delay days (between 1 to 3), resulting in a similar simulation adjustment to that achieved with classical models, which were significantly improved by adding the year and day number as a predictor, and/or the daily clearness index, which considers the randomness of the cloud’s presence event.

2. Materials and Methods

2.1. Horizontal Daily Global Solar Irradiation Data

Data on the horizontal daily global solar irradiation used in this study (i.e., an eight years period, from 2004 to 2011), were collected at the agrometeorological station that belongs to the SIAR system (Agroclimatic Information System for Irrigation, in Spanish) located in the Mansilla Mayor (León, Castile and León region, center-north of Spain), with geographical coordinates 42°30′43″ N and 5°26′46′′ O, altitude 791 MAMsl and local time GMT-21.725555. The SIAR system is a project from the Ministry of Environment and Rural Areas and Maritime of Spain, which is managed by ITACyL (Agricultural Technological Institute in Castile and León, in Spanish), through the weather information service InfoRiego, by which farmers obtain advice on irrigation water doses with the objective of its rationalization [38]. Global solar irradiation at the agrometeorological reference station is measured with a Skye SP1110 pyranometer (Campbell Scientific, Inc., North Logan, UT, USA), in which the silica photocell measures the incident solar radiation in the spectrum band between 350–1000 nm. The electronic circuit for the linearization and the amplification of that sensor is situated next to the Vaisala HMP45C probe (Campbell Scientific, Inc., North Logan, UT, USA), to measure temperature and ambient relative humidity, in the ranges of −40 to 60 °C, and 0 to 100%, respectively. Climate classification of the location of the agrometeorological station is Csb [39], according to Koppen–Geiger climate classification, with the following average yearly values (data from 1981–2010):
Mean of means temperature = 11.1 °C.
Maximum mean temperature = 16.7 °C.
Minimum mean temperature = 5.5 °C.
Average rainfall = 515 mm.
Average number of days with rainfall same or above 1 mm = 75.
Average number of clear days = 83.
Average yearly number of sun hours = 2673 h.

2.2. The Prediction of Horizontal Daily Global Solar Irradiation Using ANNs

Prediction of horizontal daily global solar irradiation of the day after ([H(t+1)], MJ/(m2·d)) was carried out with different empirical models similar to the black-box, implemented ANNs that used data corresponding to the seven year period from 2004 to 2010. The automatic data preprocessing and postprocessing has done with the GUI (graphical user interface) neural network fitting toolbox ‘nftool’ in MATLAB [40].
To achieve the proposed objective, eight ANNs architectural models were designed (i.e., from ANN 1 to ANN 8), with different input data combinations:
[H(t)], horizontal daily global solar irradiation of the current day MJ/(m2·d).
[H(t−1)], horizontal daily global solar irradiation a day delayed, MJ/(m2·d).
[H(t−2)], horizontal daily global solar irradiation two days delayed, MJ/(m2·d).
[J(t)], number of the day of the year (1…365), adimensional.
[Kt(t)], daily clearness index, adimensional, which is calculated as the relation between the incident global solar irradiation over the earth surface (H), and the extraterrestrial solar irradiation (H0), which is calculated for each particular day as a function of the latitude [3].
In the hidden layer of the different evaluated ANNs, a different number of neurons was used (i.e., 1–10, 20, 30, 40, and 50) with the purpose of knowing their influence in the simulation precision. The output layer in all the tested ANN models has only one neuron that corresponds to the [H(t+1)] prediction during a whole year (year 2011), by calculating the root mean square error (RMSE, MJ/(m2·d)), which was obtained in those predictions regarding the measured data, with the objective of selecting a better predictive behavior ANN model. The evaluated ANNs architectures are shown in Figure 1.
ANNs are created with the feedforwardnet function, fed with the input and output data vectors, which determines the size of the respective layers, generating a multilayer feed-forward perceptron (MLP) ANN with just one hidden layer, where the selected transference function between neurons in the hidden layer is the hyperbolic tangent sigmoid (tansig), whilst the selected transference function for the output layer neuron is lineal (purelin) [41,42].
The back-propagation Levenberg–Marquardt (BP-LM) algorithm is applied to achieve a quick optimization (trainlm), as well as the following options: bias learning function and weight moment with descendent gradient (learngdm); normalized function of squared error (mse); and functions of the processing of input matrix elements, such as data processing to recoding unknown data rows (fixunknowns), repeated data vectors at the inlet, which do not provide useful information (removeconstantrows), and the matrixes processing to normalized vectors with minimum and maximum values in the range of [−1, 1] (mapminmax) [41,42].
ANN training was done with the train function, with input and output data vector matrixes over a period of seven years (i.e., from 2004 to 2010, without the consideration of 2011, as it was the year of verification), registering the whole training period (epoch and performance functions). Finally, sim function was used, with previously trained ANNs, to do the prediction of [H(t+1)], with the vector matrix of input data from 2011.

2.3. The Prediction of Horizontal Daily Global Solar Irradiation Using Classic Models

Classic models for the daily global solar irradiation prediction over the horizontal surface, which has been considered in this work, are: (1) CENSOLAR typical year; (2) weighted moving mean with partial autocorrelation; (3) linear regression; (4) Fourier analysis; and (5) Markov analysis. Model building was done by taking the horizontal daily global solar irradiation corresponding to the seven year period (i.e., 2004–2010) that was considered for the construction of the models.

2.3.1. CENSOLAR Typical Year

The horizontal global solar irradiation values included in the tables CENSOLAR [43] table characterize an average day of each month in a typical year. This is why this model is mainly applicable to large geographical areas and for long periods of time. The information is available for each of the Spanish provinces.

2.3.2. Weighted Moving Mean with Partial Autocorrelation

Partial autocorrelation makes reference to variable value dependency with the same variable values precedents in time. For that reason, the weighted moving mean (WMM) model with partial autocorrelation is applied, giving more weight to the values closer to the simulation day and less weight to the ones furthest, with the objective that the average value behaves more flexible than when a simple mobile mean model is used.
In this current work, partial autocorrelation coefficients obtained over a seven year period was used, which were calculated with the parcorr MATLAB function, defining the weighted mobile mean with 2 to 20 days’ time delays, in 2011. The partial autocorrelation coefficients are applied to the solar irradiation value corresponding to its delay day, doing the summation of those products and dividing by the sum of those coefficients.

2.3.3. Linear Regression

Global solar radiation prediction can be done through a lineal regression, that models the relation between a dependent variable, in this case the global solar irradiance the day after H(t+1), and an independent variable, in this case the global solar irradiance of the current day H(t), together with a calculated random term using MATLAB curve fitting toolbox ‘cftool’.

2.3.4. Fourier Analysis

Fourier analysis is applied to the variables that show significant frequencies, such as it occurs with the horizontal daily global solar irradiation. In this case, MATLAB Curve Fitting Toolbox ‘cftool’ was used to calculate the first eight harmonic coefficients.

2.3.5. Markov Analysis

A Markov chain is a situation or states chain that is generated with a random process in which a series of state change amongst different states of a finite group of possible states.
In this current work, for the data series between 2004 and 2010, states were defined, one per each horizontal daily solar irradiance integer value (MJ), according to the following process:
All data series were rounded and a corresponding state was assigned making use of MATLAB ‘round’ function.
Maximum and minimum value of the data series was found for the horizontal daily global solar irradiance by using MATLAB ‘max’ and ‘min’ functions, resulting in 33 possible states.
A probability matrix was created using the transitions or change of state of the existing data series.
A Markov transition matrix (MTM) probability matrix was created with a transitions number for each data series state.
MTM is normalized by dividing each element by the value of the sum of all the elements in a line, which results in the normalized Markov transition matrix (NMTM), where the sum of all the line element has 1 as a value.
The state change probability has been calculated for the day after based on the state of the current day, multiplying the state vector of the current day by NMTM vector, ending with a vector in which the position where the highest value is located, will be the state with the highest probability to occur the day after.

3. Results

In this section, the obtained results of the application of horizontal daily global irradiation prediction models of the day after [H(t+1)] are shown, based on the measurements taken at the agrometeorological station, located in Mansilla Mayor (León, Spain), which belongs to the SIAR network, between 2004 and 2010.
In 2011, measured data at the same station was used in the model validation phase. In order to do the validation and be able to compare the predictive models behavior, the following statistical tools were used: Root mean square error (RMSE, MJ/(m2·d)), with Equation (1a); determination coefficient (R2), model adjustment level indicator, with Equation (1b); Durbin–Watson (DW) coefficient, used to detect the first order autocorrection between the data, with Equation (1c); mean percentage error (MPE), which allows the interpretation the prediction error bias, with Equation (1d); forecast accuracy (FA), used to make a measurement available for the precision of prediction models at short term, with Equation (1e); and Akaike information criterion (AIC), used to select the most adequate model taking into account the number of used variables, penalizing the most complex models, with Equation (1f).
R M S E = i = 1 n ( Y i Y ^ i ) 2 n
R 2 = 1 i = 1 n ( Y i Y ^ i ) 2 i = 1 n ( Y i Y ¯ i ) 2
D W = i = 1 n ( ( Y i Y ^ i ) ( Y i + 1 Y ^ i + 1 ) ) 2 i = 1 n ( Y i + 1 Y ^ i + 1 ) 2
M P E = i = 1 n ( ( Y i Y ^ i ) Y i ) n
F A = i = 1 n ( 1 | ( Y i Y ^ i ) Y i | ) n
A I C = i = 1 n ( Y i Y ^ i ) 2 n · e ( 2 k n )
where k is the number of variables.

3.1. Results of Simulations with the Artificial Neural Networks Models

First of all, the research was focused in ANN models to identify the network architecture that simulates with more precision [H(t+1)], as a function of the neuron number (i.e., 1–10, 20, 30, 40, and 50) that forms the hidden layer. The statistics used for this validation is the RMSE of the simulated outlet based on the data measured for the same variable.
Obtained results for the ANN 1, ANN 2, and ANN 3 models are shown in Figure 2. The best results for the prediction done for the ANN 1 model were achieved with the (1-1-1) architecture, with RMSE = 4.26 MJ/(m2·d), whilst for ANN 2 model the best results were achieved with the (2-7-1) architecture, with RMSE = 4.12 MJ/(m2·d). Finally, the best behavior for ANN 3 model was obtained with the (3-20-1) architecture, with a RMSE = 3.96 MJ/(m2·d).
Furthermore, the results were obtained with the simulation by using ANN 4, ANN 5, and ANN 6 models (Figure 3). It can be seen that best results of the prediction done obtained with ANN 4 model were those for the (2-2-1) architecture, RMSE = 3.75 MJ/(m2·d), whilst for ANN 5 and ANN 6 models were achieved with the (3-4-1), RMSE = 3.78 MJ/(m2·d), and (4-4-1), RMSE = 3.80 MJ/(m2·d) architectures, respectively.
Finally, simulations done for the ANN 7 and ANN 8 models are shown in Figure 4. The best results for the prediction done with the ANN 7 model were obtained with the (2-4-1) architecture, RMSE = 3.76 MJ/(m2·d), whilst for ANN 8 model best results were achieved with the (3-7-1) model, RMSE = 3.80 MJ/(m2·d).
Figure 5 and Table 1 show the results of the simulation and the behavior of the studied ANN models, considering the neuron architecture of the hidden layer with which the best prediction results were obtained, for each of the days of the evaluated year.

3.2. Results of the Classic Models

The behavior of the prediction models based on ANNs was compared with the behavior of simulation models that use classic simulation techniques of global solar irradiation. The classical simulation models that were analyzed are: CENSOLAR typical year, weighted moving mean, linear regression, Fourier analysis, and Markov analysis. In every case, the base of the analysis was the same, corresponding to the horizontal daily global solar irradiation of the day after during 2011 and its comparison with the same variable measurements done by the agrometeorological station located in Mansilla Mayor (León, Spain), which belongs to SIAR. Figure 6 shows the results for the predictions for each day of each year. Table 2 summarizes the adjustment analysis between simulated and measured values. In the following sections, the results obtained with each of the simulation classical models are analyzed.

3.2.1. CENSOLAR Typical Year

Values for the horizontal daily global solar irradiation of a typical year in the province of León (Spain), where the agrometeorological station at Mansilla Mayor is located, are include in the CENSOLAR tables [43], which are shown in Figure 6. Values simulated with this model show a RMSE of 5.1829 MJ/(m2·d) in relation to the measured values.

3.2.2. Weighted Moving Mean (WMM) with Partial Autocorrelation

Figure 7 shows the partial correlation coefficients that were the result of using the solar radiation data studied over seven years, with delays between 1 and 20 days. It can be observed that the dependency of the daily global solar irradiance [H(t+1)] in a particular day is maximum (partial autocorrelation coefficient of 0.8747) the day after [H(t)], decreasing the dependency very quickly with the received solar irradiation the days before: 0.2622 for two days [H(t−1), H(t)], 0.1777 for three days [H(t−2), H(t−1), H(t)], 0.0843 for four days [H(t−3), H(t−2), H(t−1), H(t)], without going above 0.1500 with any of the considered delays up to 20 days.
Subsequently, the WMM model with the partial autocorrelation coefficients that corresponded to the period between 2 and 20 days delay was used for the [H(t+1)] prediction during 2011, obtaining the simulation errors shown in Figure 8. It can be seen that the best simulation result was achieved for the 11 day delay [H(t−10), H(t)], with a prediction error of 3.9810 MJ/(m2·d). Thus, the model of the weighted mobile mean model was selected with 11 days delay, which is shown in Equation (2):
H t + 1 = 0.874 H t + 0.262 H t 1 + 0.177 H t 2 + 0.084 H t 3 + 0.115 H t 4 + 0.112 H t 5 + 0.088 H t 6 + 0.058 H t 7 + 0.057 H t 8 + 0.101 H t 9 + 0.030 H t 10 0.874 + 0.262 + 0.177 + 0.084 + 0.115 + 0.112 + 0.088 + 0.058 + 0.057 + 0.101 + 0.030

3.2.3. Linear Regression

The model obtained with a lineal regression with one day of delay is shown in Figure 9 and Equation (3), with an adjustment error of 4.32 MJ/(m2·d). Using this model for the horizontal daily global solar irradiation simulation in 2011, a prediction error RMSE of 4.2434 MJ/(m2·d) was obtained (Table 2).
H ( t + 1 ) = 0.8748   H ( t ) + 2.048

3.2.4. Fourier Analysis

The application of the Fourier analysis model with the solar radiation measured data over seven years (2004–2010) has allowed us to get typical annual functions, shown in Table 3, that consider the first to the eighth harmonics; the produced error for each function decreases very slightly with the number of harmonics. Figure 10 shows the achieved adjustment considering the first harmonic, with RMSE error of 4.417 MJ/(m2·d). Prediction of the horizontal daily global solar irradiation the day after [H(t+1)], with date from 2011, gives us a prediction error RMSE which varies from 4.2747 MJ/(m2·d) with the first harmonic only, to 4.2557 MJ/(m2·d) with the first eight harmonics (Table 2).

3.2.5. Markov Analysis

Markov analysis carried out with the procedure described in Section 2.3.5 for the prediction of horizontal daily global solar irradiation the day after in 2011, results in a RMSE prediction error of 4.3653 MJ/(m2·d) (Table 2).

4. Discussion

The prediction precision of the horizontal daily global solar irradiation using the tested ANN models, can be rated as high. Prediction errors varied in the year that the validation was done, from 3.7703 MJ/(m2·d) for the model with the best adjustment achieved (i.e., ANN 7), to 4.2609 MJ/(m2·d) for the model with the worst behavior (i.e., ANN 1). These errors are in the range of 11.4% to 12.9% of the maximum value of the incident solar radiation measured.
On the other hand, the adjustment of the prediction using the tested models improved when the number of delay days increased; these numbers were considered in the horizontal daily global solar irradiation during the process of modelling the day after [H(t+1)]. Indeed, when ANN models were involved, the adjustment error obtained with the ANN 3 model, which added two delay days was, 2.7% and 5.9%, respectively, smaller than the errors obtained with models that only considered a day of delay (i.e., ANN 2) or the radiation of the current day (i.e., ANN 1). The same behavior is confirmed with classic models, specifically with the WMM model, in which the smallest prediction error is obtained considering 11 days of delay, and it is 6.9% smaller when two delay days are considered.
However, the performance of ANN 4, ANN 5, and ANN 6 models, which included the dependency of the solar radiation with the time of the year through the variable day of the year [J(t)], did not vary significantly when a higher number of delay days was considered. The prediction error of ANN 5 and ANN 6 models that considered one and two delay days, respectively, were higher than the error from model ANN 4, which only considered the solar radiation measured on the current day, although the difference was small (i.e., prediction error of 1.1% in both cases). Furthermore, the incorporation of the variable [J(t)] meant that the adjustment achieved with these models was better than the one obtained with ANN 1, ANN 2, and ANN 3 models (difference between 5.7% to 12.1%, compared with ANN 4 model). This also showed that it was better than the behavior of the classic methods tested. Therefore, the use of the variable day of the year as a predictor significantly improved the performance of ANN model simulation, because it included the time and season of the year when the prediction was done and, with that, the variation of the incident solar radiation throughout the year, because the extra-terrestrial solar irradiation at the limit of the atmosphere varied annually in a senoidal way. This great influence of the time of year in the incident solar radiation value over the Earth’s surface, when thinking about the simulation, was also mentioned by different authors. Citakoglu [4] worked at a monthly temporary scale for the average solar irradiation estimation in Turkey, finding that the most significant explanatory variable was the month, and thus, the ANN model that included this variable behaved better than the multiple linear regression model, the adaptive network-fuzzy inference system model, and the tested empirical equations (Abdalla, Ångström, Bahel, and Hargreaves–Samani).
Modelling performance with ANNs improved when the daily clearness index (ANN 7) was considered, but it did not improve as much when the day of the year and the clearness index were used together as predictors (ANN 8), with which the results obtained were similar. As the use of the variable day of the year was easier than the clearness index and the predictive performance was similar, it is advised to use only the day of the year variable.
Table 1 shows that ANN 3, ANN 6, and ANN 7 models have the lowest autocorrelation degree, which have been evaluated with the DW statistical method, showing that the autocorrelation degree between the past measured values and the future simulated values for all ANN models is close to value 2 (i.e., autocorrelation nil).
The effectiveness of the simulation was higher for the ANN 7, ANN 6, and ANN 4 models (Table 1) because in them a better result of the statistical MPE was achieved (i.e., values −0.2022, −0.2032, and −0.2154, respectively) and the bias prediction error was valued through the FA statistical method (0.6324, 0.6277, and 0.6196, respectively), which values the prediction in the short term.
Similar conclusions can be made with the RMSE statistic. Indeed, the best efficiency in the simulation was achieved with the ANN 7 and ANN 4 models, obtaining RMSE values of 3.7703 and 3.8012 MJ/(m2d), respectively, and AIC values of 3.8118 and 3.8427, respectively. The AIC statistical method was an indicator of the complexity of the prediction because the low values obtained with these two models meant that a smaller number of predictive variables (two inputs for both models) achieved better results for the simulation, which is backed up by the Law of Parsimony or Occam’s razor, or by which models were used to obtain better results in the predictions.
The ANN 7 and ANN 4 models did not use the information available in the delay days but only the corresponding information for the clearness index and the day of the year. Thus, it was confirmed that the ANN models offered the best conditions with the least number of necessary inputs, for its use in the horizontal daily global solar irradiation in Castile and León region, Spain. This conclusion agrees with the work of Rao et al. [13] for the election of a smaller number of ANNs input variables and also with the work of Yadav and Chandel, [10] for the appropriate selection of these variables with the aim of predicting solar irradiation more accurately. Furthermore, similar results were obtained by Paoli et al. [27], in which conditions in Corsica (France), using an ANN with a few days of delay with data from 1988–1989, significantly improved the model by using the clearness index, (RMSE = 3.59 MJ/m2 and R2 = 0.80). The obtained results presented in this work are similar (worse RMSE but better R2) to those obtained by these authors, but with the advantage that a smaller number of inputs help practical application. In Saudi Arabia conditions, Almaraashi [44] showed the importance of selecting appropriately the most important explicit variables for the predictive modelling of solar radiation, using for that purpose four different algorithms.
The best predictive behavior found that the best classic models of the solar radiation simulation was the WMM model, which achieved an 11 day delay. The worst response was achieved with the CENSOLAR typical year. The strongest partial autocorrelation was produced with the models with a delay day (WMM, linear regression, and Markov analysis), which confirms the solar radiative persistence from one day to the following, where the autocorrelation decreases dramatically for the following days. Table 2 shows that the linear regression models and WMM have two days delay and an average adjustment in the prediction, but a high potential for practical application due to its simplicity and daily solar radiative persistence. However, these models obtained worse results for the other indicators (DW, MPE, and FA). In China, Sun et al. [45] showed strong heteroscedastic persistence for the daily global solar irradiation and its influence in the solar radiation prediction.
The achieved adjustment with the Fourier analysis model was similar to the one obtained with the WMM models and with the two days delay and linear regression. The use of more than one harmonic does not provide a significant improvement in the prediction, making it more complicated for its use and making the results worse (i.e., DW, MPE, and FA).
The obtained adjustment with the Markov analysis model was similar to the one achieved with the Fourier analysis model, except it had better values with the FA indicator (0.6497), which analyzes short term prediction. This obtained the best result of all the classic models after the WMM model with 2 days delay (0.6589), caused by the solar radiative persistence effect from one day to the other (0.8747 as the maximum partial autocorrelation coefficient in the data series of horizontal global solar irradiation for the first delay day and 0.2622 for the second delay day; Figure 7).
As mentioned previously, the model with the best predictive adjustment was the WMM with 11 days delay, because it used partial autocorrelation coefficients that corresponded to the 11 days previous to the prediction, with the smallest RMSE (3.9810 MJ/(m2·d)) error, the highest R2 (0.8134) coefficient, and the smallest statistical value AIC (4.2283). These results indicate that, although this model used the highest number of predictive variables, they are used effectively, and it is the best classic model.
In summary, comparing prediction results for the horizontal daily global solar irradiance, performed with ANN models (Figure 5 and Table 1) and classic models (Figure 6 and Table 2) that considered a seven years learning phase (i.e., 2004–2010) and a one year series for validation (i.e., 2011), and for the meteorological conditions of Castile and León (Spain), it was concluded that ANN models have better simulation adjustments than classical models. Moreover, using a smaller number of predictive variables obtained similar results to the best, but more complex, models available in the literature.

5. Conclusions

One of the most interesting characteristics of ANNs is the ability to model a process and learn as the process transference function varies with time. In order to benefit from them while predicting incident solar radiation, a number of fixed variables, of which the previous values of the simulated variable are found, are established as ANN inputs, which is the output of the simulated future value of the objective variable.
Predictions regarding global solar irradiation in the terrestrial horizontal surface the day after ([H(t+1)]) is relevant for all sorts of farming applications, particularly for estimating crop evapotranspiration for irrigation and monitoring plant growth and disease control. In this article, a prediction of [H(t+1)] was done using ANNs. We tried to design networks with the simplest architecture and the smallest possible number of inputs to facilitate practical technological application. The only requirement was to have a consistent series of horizontal global solar irradiation data, which could be measured in place or estimated after satellite measurement, or even through other environmental variables (ambient temperature and isolation hours, mainly).
In our predictions, data for the global solar irradiation of the current day and two days delay was used. We obtained models with which the predictive performance improved when compared to the classic models (CENSOLAR typical year, weighted moving mean with two days delay, linear regression, and Fourier and Markov analysis). However, the weighted moving mean model with an 11 day delay obtained a better adjustment. Still, the predictive improvement of ANN models is achieved when the input variable is the day of the year, because the simulation references the time of year when it occurs. In this situation, it can be seen that using solar radiation data with more delay days does not allow for the improvement of predictive behavior models. Furthermore, another way to improve ANN models is to use the daily clearness index, which is an indicator of the daily solar radiation proportion that is absorbed and dispersed to the atmosphere, with which the best simulation adjustments are obtained as compared with the classical models.
In order to continue working in the predictive capacity and the applicability of the daily global solar irradiation over the horizontal surface, the following future work is proposed:
(1)
Use of other explicative variables, such as humidity, temperature, atmospheric pressure, or cloudiness, which contribute to changes in the evolution of solar radiation, mainly the days in which sudden changes in the weather occurs, and moments when ANN models present their worst results.
(2)
Division of input data for the different times/seasons of the year that have similar characteristics and the generation of models for each of them.
(3)
Use of predictions from the national meteorological services as input data for the ANN models, instead of the historic data registered in the area.

Author Contributions

Conceptualization, F.J.D., L.M.N.-G., and L.C.-S.; Methodology, F.J.D., L.M.N.-G., and A.M.-R.; Software, F.J.D. and A.M.-R.; Validation, F.J.D., L.C.-S., and A.C.-G.; Formal analysis, L.M.N.-G. and A.M.-R.; Investigation, F.J.D., L.M.N.-G., and L.C.-S.; Resources, L.M.N.-G. and A.C.-G.; Writing—original draft preparation, F.J.D. and A.M.-R.; Writing—review and editing, L.M.N.-G., L.C.-S., and A.C.-G.; Visualization, F.J.D. and A.M.-R.; Supervision, F.J.D. and A.C.-G.; Project administration, L.M.N.-G. and A.M.-R.; Funding acquisition, L.M.N.-G. All authors have read and agreed to the published version of the manuscript.

Funding

This research received no external funding. L.M.N.-G. would like to thank the Ministry of Science, Innovation and Universities, Spain, for the “Estancias de Movilidad de Profesores e Investigadores en Centros Extranjeros de Enseñanza Superior e Investigación.” grant program.

Acknowledgments

L.M.N.-G. wishes to acknowledge to Harper Adams University (United Kingdom) and Laura Vickers for supporting the development of this work.

Conflicts of Interest

The authors declare no conflict of interest. The funders had no role in the design of the study; in the collection, analyses, or interpretation of data; in the writing of the manuscript, and in the decision to publish the results.

Nomenclature

AICAkaike information criterion, adimensional.
ANNArtificial neural networks.
BP-LMBack-propagation Levenberg-Marquardt algorithm.
CENSOLARCentro de Estudios de la Energía Solar (Spain).
dDay
DWDurbin-Watson coefficient, adimensional.
FAForecast accuracy, adimensional.
GPGenetic programming.
GPMLGaussian process machine learning.
GUIGraphical User Interface.
HIncident global solar irradiation over the earth surface, MJ/(m2·d).
H0Extraterrestrial solar irradiation, MJ/(m2·d).
[H(t+1)]Horizontal daily global solar irradiation of the day after, MJ/(m2·d).
[H(t)]Horizontal daily global solar irradiation of the current day, MJ/(m2·d).
[H(t−1)]Horizontal daily global solar irradiation a day delayed, MJ/(m2·d).
[H(t−2)]Horizontal daily global solar irradiation two days delayed, MJ/(m2·d).
[H(t−10)]Horizontal daily global solar irradiation ten days delayed, MJ/(m2·d).
ITACyLAgricultural Technological Institute in Castile and León (in Spanish),
[J(t)]Number of the day of the year, adimensional.
[Kt(t)]Daily clearness index, adimensional.
LRLinear regression model.
MLPMultilayer feed-forward perceptron.
MPEMean percentage error, adimensional.
MTMMarkov transition matrix.
NMTMNormalized Markov transition matrix.
RMSERoot mean square error, MJ/(m2·d).
R2Coefficient of determination, adimensional.
SIARAgroclimatic Information System for Irrigation (in Spanish).
SVRSupport vector regression.
WMMWeighted moving mean model.

References

  1. Gueymard, C.A.; Myers, D.R. Validation and ranking methodologies for solar radiation models. In Modeling Solar Radiation at the Earth’s Surface; Badescu, V., Ed.; Springer: Berlin, Germany, 2008; pp. 479–481. [Google Scholar]
  2. Abraha, M.G.; Savage, M.J. Comparison of estimates of daily solar radiation from air temperature range for application in crop simulations. Agric. For. Meteorol. 2008, 148, 401–416. [Google Scholar] [CrossRef]
  3. Allen, R.G.; Pereira, L.S.; Raes, D.; Smith, M. Crop evapotranspiration: Guidelines for computing crop water requirements. In FAO Irrigation and Drainage Paper No. 56; FAO: Rome, Italy, 1998; pp. 45–47. [Google Scholar]
  4. Citakoglu, H. Comparison of artificial intelligence techniques via empirical equations for prediction of solar radiation. Comput. Electron. Agric. 2015, 118, 28–37. [Google Scholar] [CrossRef]
  5. Iqbal, M. An Introduction to Solar Radiation; Academic Press: Toronto, ON, Canada, 1983. [Google Scholar]
  6. Camacho, E.F.; Berenguel, M.; Rubio, F.R.; Martínez, D. Control of Solar Energy Systems; Springer: London, UK, 2012; pp. 34–45. [Google Scholar]
  7. Qazi, A.; Fayaz, H.; Wadi, A.; Raj, R.G.; Rahim, N.A.; Khan, W.A. The artificial neural network for solar radiation prediction and designing solar systems: A systematic literature review. J. Clean. Prod. 2015, 104, 1–12. [Google Scholar] [CrossRef]
  8. Gardner, M.W.; Dorling, S.R. Artificial neural networks (the multilayer perceptron)—A review of applications in the atmospheric sciences. Atmos. Environ. 1998, 32, 2627–2636. [Google Scholar] [CrossRef]
  9. Aitkenhead, M.J.; McDonald, A.J.S.; Dawson, J.J.; Couper, G.; Smart, R.P.; Billett, M.; Hope, D.; Palmer, S. A novel method for training neural networks for time-series prediction in environmental systems. Ecol. Model. 2003, 162, 87–95. [Google Scholar] [CrossRef]
  10. Yadav, A.K.; Chandel, S.S. Solar radiation prediction using Artificial Neural Network techniques: A review. Renew. Sustain. Energy Rev. 2014, 33, 772–781. [Google Scholar] [CrossRef]
  11. Ghimire, S.; Deo, R.C.; Downs, N.J.; Raj, N. Global solar radiation prediction by ANN integrated with European Centre for medium range weather forecast fields in solar rich cities of Queensland Australia. J. Clean. Prod. 2019, 216, 288–310. [Google Scholar] [CrossRef]
  12. Shah, A.; Kaushik, S.C.; Garg, S.N. Assessment of diffuse solar energy under general sky condition using artificial neural network. Appl. Energy 2009, 86, 554–564. [Google Scholar]
  13. Rao, D.V.S.K.; Premalatha, M.; Naveen, C. Analysis of different combinations of meteorological parameters in predicting the horizontal global solar radiation with ANN approach: A case study. Renew. Sustain. Energy Rev. 2018, 91, 248–258. [Google Scholar] [CrossRef]
  14. Seme, S.; Štumberger, G.; Pihler, J. Predicting daily distribution of solar irradiation by neural networks. In Proceedings of the International Conference on Renewable Energies and Power Quality (ICREPQ’09), Valencia, Spain, 15–17 April 2009; pp. 275–276. [Google Scholar]
  15. Sözen, A.; Arcaklioglu, E.; Özalp, M. Estimation of solar potential in Turkey by artificial neural networks using meteorological and geographical data. Energy Convers. Manag. 2004, 45, 3033–3052. [Google Scholar] [CrossRef]
  16. Hontoria, L.; Aguilera, J.; Zufiria, P. An application of the multilayer perceptron: Solar radiation maps in Spain. Sol. Energy 2005, 79, 523–530. [Google Scholar] [CrossRef] [Green Version]
  17. Hontoria, L.; Aguilera, J.; Zufiria, P. Generation of hourly irradiation synthetic series using the neural network multilayer perceptron. Sol. Energy 2002, 72, 441–446. [Google Scholar] [CrossRef]
  18. Siqueira, A.N.; Tiba, C.; Fraidenraich, N. Generation of daily solar irradiation by means of artificial neural networks. Renew. Energy 2010, 35, 2406–2414. [Google Scholar] [CrossRef]
  19. Sen, Z. Fuzzy algorithm for estimation of solar irradiation from sunshine duration. Sol. Energy 1998, 63, 39–49. [Google Scholar] [CrossRef]
  20. Tymvios, F.S.; Jacovides, C.P.; Michaelides, S.C.; Scouteli, C. Comparative study of Ångström’s and artificial neural networks’ methodologies in estimating global solar radiation. Sol. Energy 2005, 78, 752–762. [Google Scholar] [CrossRef]
  21. Azadeh, A.; Maghsoudi, A.; Sohrabkhani, S. An integrated artificial neural networks approach for predicting global radiation. Energy Convers. Manag. 2009, 50, 1497–1505. [Google Scholar] [CrossRef]
  22. Behrang, M.A.; Assareh, E.; Ghanbarzadeh, A.; Noghrehabadi, A.R. The potential of different artificial neural network (ANN) techniques in daily global solar radiation modeling based on meteorological data. Sol. Energy 2010, 84, 1468–1480. [Google Scholar] [CrossRef]
  23. Mellit, A.; Kalogirou, S.A.; Shaari, S.; Salhi, H.; Arab, A.H. Methodology for predicting sequences of mean monthly clearness index and daily solar radiation data in remote areas: Application for sizing a stand-alone PV system. Renew. Energy 2008, 33, 1570–1590. [Google Scholar] [CrossRef]
  24. López, G.; Batlles, F.J.; Tovar-Pescador, J. Selection of input parameters to model direct solar irradiance by using artificial neural networks. Energy 2005, 30, 1675–1684. [Google Scholar] [CrossRef]
  25. Pattanasethanon, S.; Lertsatitthanakorn, C.; Atthajariyakul, S.; Soponronnarit, S. An accuracy assessment of an empirical sine model, a novel sine model and an artificial neural network model for forecasting illuminance/irradiance on horizontal plane of all sky types at Mahasarakham, Thailand. Energy Convers. Manag. 2008, 49, 1999–2005. [Google Scholar] [CrossRef]
  26. Mellit, A.; Pavan, A.M. A 24-h forecast of solar irradiance using artificial neural network: Application for performance prediction of a grid-connected PV plant at Trieste, Italy. Sol. Energy 2010, 84, 807–821. [Google Scholar] [CrossRef]
  27. Paoli, C.; Voyant, C.; Muselli, M.; Nivet, M. Forecasting of preprocessed daily solar radiation time series using neural networks. Sol. Energy 2010, 84, 2146–2160. [Google Scholar] [CrossRef] [Green Version]
  28. Zervas, P.L.; Sarimveis, H.; Palyvos, J.A.; Markatos, N.C.G. Prediction of daily global solar irradiance on horizontal surfaces based on neural-network techniques. Renew. Energy 2008, 33, 1796–1803. [Google Scholar] [CrossRef]
  29. Mellit, A.; Benghanem, M.; Kalogirou, S.A. An adaptive wavelet-network model for forecasting daily total solar-radiation. Appl. Energy 2006, 83, 705–722. [Google Scholar] [CrossRef]
  30. Mellit, A.; Benghanem, M.; Arab, A.H.; Guessoum, A. A simplified model for generating sequences of global solar radiation data for isolated sites: Using artificial neural network and a library of Markov transition matrices approach. Sol. Energy 2005, 79, 469–482. [Google Scholar] [CrossRef]
  31. Cao, S.; Cao, J. Forecast of solar irradiance using recurrent neural networks combined with wavelet analysis. Appl. Therm. Eng. 2005, 25, 161–172. [Google Scholar] [CrossRef]
  32. Cao, J.; Lin, X. Application of the diagonal recurrent wavelet neural network to solar irradiation forecast assisted with fuzzy technique. Eng. Appl. Artif. Intell. 2008, 21, 1255–1263. [Google Scholar] [CrossRef]
  33. Cao, J.; Lin, X. Study of hourly and daily solar irradiation forecast using diagonal recurrent wavelet neural networks. Energy Convers. Manag. 2008, 49, 1396–1406. [Google Scholar] [CrossRef]
  34. Cao, J.C.; Cao, S.H. Study of forecasting solar irradiance using neural networks with preprocessing sample data by wavelet analysis. Energy 2006, 31, 3435–3445. [Google Scholar] [CrossRef]
  35. Caldas, M.; Alonso-Suárez, R. Very short-term solar irradiance forecast using all-sky imaging and real-time irradiance measurements. Renew. Energy 2019, 143, 1643–1658. [Google Scholar] [CrossRef]
  36. Paulescu, M.; Paulescu, E. Short-term forecasting of solar irradiance. Renew. Energy 2019, 143, 985–994. [Google Scholar] [CrossRef]
  37. Heydari, A.; Astiaso Garcia, D.; Keynia, F.; Bisegna, F.; Santoli, L.D. A novel composite neural network based method for wind and solar power forecasting in microgrids. Appl. Energy 2019, 251, 113353. [Google Scholar] [CrossRef]
  38. InfoRiego. Información Meteorológica. Available online: http://www.inforiego.org (accessed on 16 September 2019).
  39. Chazarra, A.; Flórez, E.; Peraza, B.; Tohá, T.; Lorenzo, B.; Criado, E.; Moreno, J.V.; Romero, R.; Botey, R. Mapas Climáticos de España (1981–2010) y ETo (1996–2016); Agencia Estatal de Meteorología (AEMET), Ministerio Para la Transición Ecológica: Madrid, Spain, 2018; p. 13. Available online: https//www.aemet.es/documentos/es/conocermas/recursos_en_linea/publicaciones_y_estudios/publicaciones/MapasclimaticosdeEspana19812010/MapasclimaticosdeEspana19812010.pdf (accessed on 20 December 2019).
  40. Demuth, H.B.; Beale, M.H.; Hagan, M.T. Neural Network Toolbox: User’s Guide MATLAB; The MathWorks: Natick, MA, USA, 2017. [Google Scholar]
  41. Diez, F.J.; Navas-Gracia, L.M.; Martínez-Rodríguez, A.; Correa-Guimaraes, A.; Chico-Santamarta, L. Modelling of a flat-plate solar collector using artificial neural networks for different working fluid (water) flow rates. Sol. Energy 2019, 188, 1320–1331. [Google Scholar] [CrossRef]
  42. Diez, F.J.; Navas, L.M.; Martínez, A. Prediction and identification of the evolution of solar-heated hot water temperature in a stratified tank in static mode using artificial neural networks. Appl. Sol. Energy 2016, 52, 183–192. [Google Scholar] [CrossRef]
  43. Centro de Estudios de la Energía Solar (CENSOLAR). Pliego de Condiciones Técnicas de Instalaciones de Baja Temperatura: Instalaciones de Energía Solar Térmica; Instituto Para la Diversificación y Ahorro de la Energía (IDAE): Madrid, Spain, 2009; p. 100. Available online: https://www.idae.es/publicaciones/instalaciones-de-energia-solar-termica-pliego-de-condiciones-tecnicas-de-instalaciones-de-baja (accessed on 16 September 2019).
  44. Almaraashi, M. Investigating the impact of feature selection on the prediction of solar radiation in different locations in Saudi Arabia. Appl. Soft Comput. 2018, 66, 250–263. [Google Scholar] [CrossRef]
  45. Sun, H.; Zhao, N.; Zeng, X.; Yan, D. Study of solar radiation prediction and modeling of relationships between solar radiation and meteorological variables. Energy Convers. Manag. 2015, 105, 880–890. [Google Scholar] [CrossRef]
Figure 1. Evaluated artificial neural network (ANN) architectural models based on input variables.
Agronomy 10 00096 g001
Figure 2. Horizontal daily global solar irradiation effectiveness of prediction the day after simulated with the ANN 1, ANN 2, and ANN 3 models, compared with the variable measured values, in 2011, as a function of the neurons number in the hidden layer. RMSE: root mean square error (MJ/(m2·d)).
Agronomy 10 00096 g002
Figure 3. Horizontal daily global solar irradiation effectiveness of prediction the day after simulated with the ANN 4, ANN 5, and ANN 6 models, compared with the variable measured values, in 2011, as a function of the neurons number in the hidden layer.
Agronomy 10 00096 g003
Figure 4. Horizontal daily global solar irradiation effectiveness of prediction the day after simulated with the ANN 7 and ANN 8 models, compared with the variable measured values, in 2011, as a function of the neurons number in the hidden layer.
Agronomy 10 00096 g004
Figure 5. Simulations results of horizontal daily global solar irradiation the day after (MJ/(m2·d)), with the eight ANN evaluated models, compared with the variable values measured during 2011 (SIAR: agrometeorological station located in Mansilla Mayor, León, Spain).
Agronomy 10 00096 g005
Figure 6. Results corresponding to the horizontal daily global solar irradiation simulation the day after (MJ/(m2·d)), with the classical models evaluated, together with the variable values measured in 2011 (SIAR, agrometeorological station at Mansilla Mayor, León, Spain). CENSOLAR, CENSOLAR typical year; WMM, weighted moving mean; LR, linear regression; Fourier 1st, Fourier analysis with the 1st harmonic; and Markov, Markov analysis.
Agronomy 10 00096 g006
Figure 7. Partial autocorrelation coefficients of the weighted moving mean model, for time delays of 1–20 days with the data of seven years of horizontal daily global solar irradiation.
Agronomy 10 00096 g007
Figure 8. Effectiveness of prediction of the horizontal daily global solar irradiation the day after, simulated with the weighted moving mean model, together with the variable measured values in 2011, as a function of the considered number of delay (from 2 to 20 days). RMSE, root mean square error (MJ/(m2·d)).
Agronomy 10 00096 g008
Figure 9. Linear regression model with a day of delay, between the global solar irradiation the day after [H(t+1), MJ/(m2·d)] and the global solar irradiation of the current day [H(t), MJ/(m2·d)]. Data from the agrometeorological station SIAR located in Mansilla Mayor, León, Spain, for a seven years series. RMSE, root mean square error (MJ/(m2·d)).
Agronomy 10 00096 g009
Figure 10. Typical annual Fourier model with the first harmonic for the horizontal daily global solar irradiation [H(t), MJ/(m2·d)]. Data for the SIAR agrometeorological station at Mansilla Mayor, León, Spain, for seven years series.
Agronomy 10 00096 g010
Table 1. Fitting achieved with the eight evaluated ANN models, between simulated values of horizontal daily solar irradiation the day after and measured values during 2011 at the agrometeorological station in Mansilla Mayor (León, Spain), considering in each model the hidden layer architecture that achieved the best predictions.
ModelInputsModel’s Architecture (1)RMSER2DWMPEFAAIC
ANN 1[H(t)](1-1-1)4.26090.78622.2632−0.25230.58844.2835
ANN 2[H(t−1), H(t)](2-6-1)4.12920.79881.9703−0.25170.59404.1733
ANN 3[H(t−2), H(t−1), H(t)](3-8-1)4.02040.80881.8543−0.25070.59384.0830
ANN 4[H(t), J(t)](2-5-1)3.80120.82991.9263−0.21540.61963.8427
ANN 5[H(t−1), H(t), J(t)](3-10-1)3.84670.82531.9061−0.22320.61603.9106
ANN 6[H(t−2), H(t−1), H(t), J(t)](4-7-1)3.84310.82531.8007−0.20320.62773.9261
ANN 7[H(t), Kt(t)](2-6-1)3.77030.83261.9183−0.20220.63243.8118
ANN 8[H(t), Kt(t), J(t)](3-7-1)3.80430.82971.8716−0.22730.60983.8662
(1) Model´s Architecture as a function of neurons number in each layer (Input-Hidden-Output). RMSE, root mean square error (MJ/(m2·d)); R2, coefficient of determination; DW, Durbin–Watson coefficient; MPE, mean percentage error; FA, forecast accuracy; and AIC, Akaike information criterion.
Table 2. Fitting achieved with the evaluated simulation classical models of solar radiation, between the simulated values of the horizontal daily global solar irradiation the day after and the values measured in 2011 at the agrometeorological station in Mansilla Mayor (León, Spain).
ModelRMSER2DWMPEFAAIC
CENSOLAR5.18290.68370.7092−0.13420.52865.2105
Weighted Moving Mean [H(t−1), H(t)]4.25820.78652.0952−0.13660.65894.3048
Weighted Moving Mean [H(t−10), H(t)]3.98100.81341.7265−0.16820.64934.2283
Linear Regression [H(t)]4.24340.78802.2880−0.22340.61034.2666
Fourier 1st Harmonic4.27470.78481.0439−0.26920.52944.2974
Fourier 2nd Harmonic4.26260.78611.0498−0.26290.53814.3086
Fourier 3rd Harmonic4.26750.78561.0474−0.26170.53884.3374
Fourier 4th Harmonic4.26180.78611.0499−0.25600.54664.3562
Fourier 5th Harmonic4.24650.78771.0575−0.25800.54394.3642
Fourier 6th Harmonic4.25520.78681.0532−0.25770.54444.3971
Fourier 7th Harmonic4.25370.78691.0539−0.25470.54904.4199
Fourier 8th Harmonic4.25570.78671.0529−0.25430.54954.4463
Markov [H(t)]4.36530.77562.4099−0.15250.64974.3892
RMSE, root mean square error (MJ/(m2·d)); R2, determination coefficient; DW, Durbin–Watson coefficient; MPE, mean percentage error; FA, forecast accuracy; and AIC, Akaike information criterion.
Table 3. Typical annual Fourier models for the horizontal daily global solar irradiation [H(t), MJ/(m2·d)], from the first to the eighth harmonic. Data from the SIAR agrometeorological station at Mansilla Mayor, León, Spain, for the period between 2004 and 2010.
HarmonicsTypical Annual Fourier FunctionRMSE
1st H ( t )   =   16.31 10.9 cos ( 0.01712   t ) + 1.383 s e n ( 0.01712   t ) 4.417
2nd H ( t )   =   16.79 10.75   c o s ( 0.01792   t ) 0.1918   s e n   ( 0.01792   t ) 0.4302   c o s ( 2 · 0.01792   t ) + 0.9119   s e n ( 2 · 0.01792   t ) 4.372
3rd H ( t )   =   16.82 10.72   c o s ( 0.01795   t ) 0.2652   s e n ( 0.01795   t ) 0.4444   c o s ( 2 · 0.01795   t ) + 0.9129   s e n   ( 2 · 0.01795   t ) 0.1614   c o s ( 3 · 0.01795   t ) 0.2203   s e n ( 3 · 0.01795   t ) 4.370
4th H ( t )   =   14 8.82 cos ( 0.01374   t ) + 7.663   s e n ( 0.01374   t ) + 0.4119 · cos ( 2 · 0.01374   t ) 1.859   s e n ( 2 · 0.01374   t ) 1.071 cos ( 3 · 0.01374   t ) + 0.2203   s e n ( 3 · 0.01374   t ) 0.1655 cos ( 4 · 0.01374   t ) + 0.1346   s e n ( 4 · 0.01374   t ) 4.365
5th H ( t )   =   15.95 10.9 cos ( 0.01659   t ) + 2.442   s e n ( 0.01659   t ) + 0.4894 cos ( 2 · 0.01659   t ) + 0.62   s e n ( 2 · 0.01659   t ) 0.2298 cos ( 3 · 0.01659   t ) 0.438   s e n ( 3 · 0.01659   t ) 0.08166 cos ( 4 · 0.01659   t ) 0.2479   s e n ( 4 · 0.01659   t ) 0.4204 cos ( 5 · 0.01659   t ) 0.1472   s e n ( 5 · 0.01659   t ) 4.360
6th H ( t )   =   15.59 10.71 cos ( 0.01601   t ) + 3.58 sen ( 0.01601   t ) + 0.8222 cos ( 2 · 0.01601   t ) + 0.2469 sen ( 2 · 0.01601   t ) 0.3552 cos ( 3 · 0.01601   t ) 0.5187 sen ( 3 · 0.01601   t ) 0.1731 cos ( 4 · 0.01601   t ) 0.2608 sen ( 4 · 0.01601   t ) 0.3646 cos ( 5 · 0.01601   t ) + 0.01903 sen ( 5 · 0.01601   t ) + 0.1542 cos ( 6 · 0.01601   t ) 0.2483 sen ( 6 · 0.01601   t ) 4.358
7th H ( t )   =   15.62 10.77 cos ( 0.01608   t ) + 3.439 sen ( 0.01608   t ) + 0.7548 cos ( 2 · 0.01608   t ) + 0.3084 · sen ( 2 · 0.01608   t ) 0.3652 cos ( 3 · 0.01608   t ) 0.502 · sen ( 3 · 0.01608   t ) 0.1898 cos ( 4 · 0.01608   t ) 0.2505 sen ( 4 · 0.01608   t ) 0.4033 cos ( 5 · 0.01608   t ) + 0.0155 sen ( 5 · 0.01608   t ) + 0.1429 cos ( 6 · 0.01608   t ) 0.2134 sen ( 6 · 0.01608   t ) 0.2898 cos ( 7 · 0.01608   t ) + 0.05327 sen ( 7 · 0.01608   t ) 4.355
8th H ( t )   =   15.9 10.88 cos ( 0.01608   t ) + 2.604 sen ( 0.01608   t ) + 0.5436 cos ( 2 · 0.01608   t ) + 0.5728 sen ( 2 · 0.01608   t ) 0.243 cos ( 3 · 0.01608   t ) 0.4557 sen ( 3 · 0.01608   t ) 0.09469 cos ( 4 · 0.01608   t ) 0.2583 sen ( 4 · 0.01608   t ) 0.4202 cos ( 5 · 0.01608   t ) 0.1266 sen ( 5 · 0.01608   t ) + 0.2067 cos ( 6 · 0.01608   t ) 0.1177 sen ( 6 · 0.01608   t ) 0.2595 cos ( 7 · 0.01608   t ) 0.1288 sen ( 7 · 0.01608   t ) 0.1798 cos ( 8 · 0.01608   t ) 0.04178 sen ( 8 · 0.01608   t ) 4.355

