Abstract
We recently proposed a simple method for estimating total nitrogen content in paddy soil. In this method, soil is extracted with a commercial 3% hydrogen peroxide (H2O2) solution at 25 °C for 40 h, and electrical conductivity (EC (H2O2)) of the extract is measured. This study aimed to further evaluate the method’s applicability to soil samples collected at the farm scale by using the original and six additional H2O2 solutions that are locally and commercially available. The results obtained with the original solution indicated that the determination coefficients between EC (H2O2) and total N were statistically significant at all farms examined: Moka, 0.78 (n = 13); Kyoto, 0.50 (n = 16); Kizu, 0.43 (n = 89); and Kawatabi, 0.25 (n = 18). The EC of the tested H2O2 solutions varied from less than 0.05 to 1.4 mS cm−1 because of the addition of different stabilizers. EC (H2O2) values obtained with the less stabilized H2O2 solutions (one from Japan, one from USA, and the analytical grade 6% solution) agreed well with those obtained with the original solution. Thus, the proposed method can be useful for estimating the farm-scale variation in soil total N, provided a H2O2 solution with a low EC (<0.2 mS cm−1) is used for the extraction.
1. Introduction
In irrigated paddy fields, mineralization of organic nitrogen (N) in soil during a cropping period often limits rice growth and yield. Nutrient omission trials conducted in more than a thousand paddy fields throughout Japan have demonstrated that lowland rice responds to the application of N to a greater extent than to the application of phosphorus or potassium [1]. To optimize the rate of application of N fertilizer, many researchers have proposed laboratory methods to evaluate soil N availability suitable for routine use, and some of them have been validated by comparing the results with the content of potentially mineralizable organic N estimated by the long-term laboratory incubation [2]. Several biological and chemical methods such as short-term anaerobic incubation and extraction with hot KCl have proved useful for rapid estimation of soil N availability [2,3].
In addition to analysis of the labile fraction of N in soil, analysis of total N is also a widely accepted method for estimating soil N availability [2,4]. For example, in 31 surface paddy soils in Japan classified as non-volcanic ash soils, the content of potentially mineralizable organic N evaluated by long-term aerobic incubation was significantly correlated (r = 0.53, p < 0.05) with the total N content [5]. By reviewing previous papers, Sahrawat [6] also reported that the total N content in paddy soil usually showed a significant positive correlation with the amount of ammonium ion (NH4+) produced under anaerobic incubation.
The total N content in soil has been measured by two methods: the Kjeldahl method which is a wet oxidation procedure, and the Dumas method which is fundamentally a dry oxidation (combustion) procedure [7]. These methods were originally developed during the 19th century and the revised versions are still in use. Total N and total carbon (C) contents can be measured simultaneously by the dry combustion method. However, both methods require laboratory facilities, so total N analysis are typically carried out by specialists in well-equipped laboratories.
To reduce the time and cost for measurement, Sharifi et al. [4] proposed the sodium hydroxide direct distillation method. In this method, the digestion step was fully eliminated, and the amount of N liberated by steam distillation of soil with a strong alkaline reagent for about 10 min was determined. The amount of N obtained from this method had a significant positive correlation with the content of soil total N measured by the dry combustion method. Christianson and Holt [8] also proposed a rapid digestion procedure with H2SO4 and H2O2 (the peroxy reagent) without addition of metal catalysts such as Se, Hg, and Cu. The total time for digestion was only 38 min, and the rate of N recovery from six soils ranged from 89% to 98% compared to Kjeldahl digestion. However, these methods are still limited to the laboratory use, as they require hazardous reagents.
To develop a simple method for estimating soil total N usable by non-specialists, we recently proposed a method in which a dilute hydrogen peroxide (H2O2) solution is used as the soil extractant [9]. In this method, surface paddy soil is extracted with a commercially available 3% H2O2 solution at 25 °C for 40 h. Then, the electrical conductivity (EC (H2O2)) of the soil extract is measured with an EC electrode. Because 3% H2O2 commercially available in Japan is called “oxydol” (a Japanese pharmacopoeia term), this method was called the oxydol method in the previous paper [9].
The concept of this method is based on previous findings on the decomposition of soil organic matter with H2O2 and the detection of NH4+ by EC. Robinson [10] first introduced H2O2 digestion as a pretreatment of soil texture analysis. Considering the volatile nature of both H2O2 and CO2 produced by the reaction of soil organic matter with H2O2, another Robinson [11] proposed a gravimetric method for determining the content of soil organic matter by the loss in weight caused by H2O2 digestion. Robinson [11] also reported that practically all of the soil nitrogen was transformed to NH4+ during H2O2 digestion. This finding was confirmed by Harada and Inoko [12], who reported that, for the eight soil samples tested, 59–100% of the total N in the original soil was present in the digested solution and that most of the water-soluble N was present as NH4+. Guan et al. [13] also reported that, for the eight samples including six volcanic ash soils, more than 90% of organic C and less than 11% of N in the original soil were lost by H2O2 treatment. The concentration of NH4+ in a solution can be measured quantitatively by non-selective EC detection after its separation from other cations by ion chromatography [14]. If NH4+ is the dominant cation in a sample solution, the NH4+ concentration can be roughly estimated from the solution EC without a separation pretreatment.
To validate the oxydol method, we applied it to 83 surface soils collected from paddy fields throughout Japan [9]. Then, there was a significant positive correlation between EC (H2O2) and total N content (r2 = 0.70, p < 0.01) when 11 volcanic ash soils were excluded from the analysis. When we applied the method to two sets of paddy soil samples collected at farm scale, the correlation between EC (H2O2) and total N became different between the two farms (r2 = 0.23 and 0.68). The low accuracy of the estimation for volcanic ash soils and some farm-scale samples was mainly due to the low rate of mineralization of soil organic N by the H2O2 treatment. This means that the estimation accuracy was decreased by the uneven decomposability of soil N within a sample set. The variations in both soil total N content and its decomposability at farm scale were smaller than those observed at national scale [9]. At any scale of investigation, the estimation accuracy is expected to increase with an increase of the variation in total N content and also with a decrease of the variation in its decomposability. However, the number of sample sets collected at farm scale was too small to evaluate whether or not the oxydol method can be useful for estimating the farm-scale variation in soil total N.
Moreover, only one type of H2O2 sold in Japan was used in previous experiments [9]. It is uncertain whether other types of H2O2 solutions can produce results comparable to those obtained previously. This is because commercial H2O2 solutions contain various stabilizers to minimize decomposition of H2O2 into water and oxygen under normal storage conditions. For example, the H2O2 used in the original method [9] contained phenacetin as a stabilizer. Other stabilizers typically used in commercial H2O2 are colloidal stannate, sodium pyrophosphate, organo-phosphates, and colloidal silica [15]. These stabilizers are expected to increase the EC of the commercial H2O2 solution and consequently the EC (H2O2) value; the estimation accuracy of soil total N from EC (H2O2) might be significantly affected.
The objective of this study was to further evaluate the oxydol method in terms of (1) the applicability to farm-scale samples and (2) the possibility of using different types of commercially available H2O2 solutions.
2. Materials and Methods
2.1. Soil Samples
We used 136 surface paddy soils collected from four university farms in Japan; 89 samples from Kizu (Kyoto University), 16 samples from Kyoto (Kyoto University), 18 samples from Kawatabi (Tohoku University), and 13 samples from Moka (Utsunomiya University). Kizu and Kyoto were located on non-volcanic ash soils, and Kawatabi and Moka were located on volcanic ash soils (Andosols) (Figure 1). According to the World Reference Base for Soil Resources, the soils were classified as Fluvisols at Kizu and Kyoto, Aluandic Andosol at Kawatabi, and Silandic Andosol at Moka.
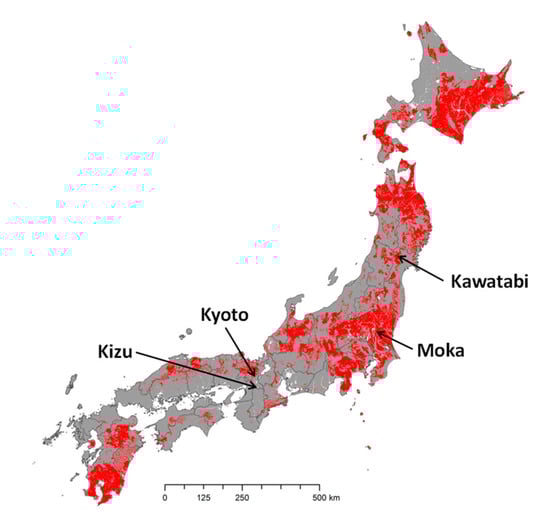
Figure 1.
Map of the Japan mainland showing the distribution of Andosols (red) and the locations of the sampled farms. The distribution of Andosols is based on map data in the Digital Soil Map of Japan [16], available at the website of the National Agriculture and Food Research Organization (NARO).
The areas of the fields from which the samples were collected was approximately 2.9, 0.75, 7.5, and 7.9 ha at Kizu, Kyoto, Kawatabi, and Moka, respectively. All fields had a rectangular shape, and many of them were contiguous. At all farms except Kizu, soil samples were collected from individual fields. One representative soil sample was obtained from each field by mixing surface (<15 cm) soil samples collected from five points: the center and each of the four corners of the field. At Kizu, a more systematic grid sampling was carried out by dividing the five contiguous fields, each with an area of about 50 × 100 m, into 89 plots, each with an area of 16.7 × 16.7 m. Then, a representative soil sample was obtained from each plot by mixing surface (<10 cm) soil samples collected from five points; the center and four additional points, each located about 5 m from the center. Soil sampling was carried out in April and May, 2017, before puddling and transplanting of rice (Oryza sativa L.) seedlings. The samples were air-dried and passed through a 2-mm sieve before analyses. Selected properties of the soil samples used in this study are listed in Table 1.

Table 1.
Selected properties of the samples used in this study.
2.2. Measurement of EC (H2O2) by the Oxydol Method
Figure 2 shows the procedures of the original oxydol method [9]. Prior to the experiment, 180-mL glass bottles with an inner diameter of 51 mm and a depth of 101 mm were washed with tap water. Then, 5.00 g of air-dried, 2-mm sieved soil was placed in each bottle, 100 mL of oxydol (Showa) was added to the sample, and the bottle was left standing at 25 °C for 40 h. After extraction, the supernatant was gently swirled by hand, and the EC of the soil extract (EC (H2O2)) was measured with a stick-type EC sensor (HI98331 Soil Test, Hanna Instruments, Woonsocket, RI, USA). An incubator was used to keep the temperature at 25 °C during the extraction. The extraction period of 40 h was set rather arbitrarily by measuring the increase of EC of six different paddy soils every 30 min after adding oxydol and then evaluating the time at which the EC reached a plateau [9].
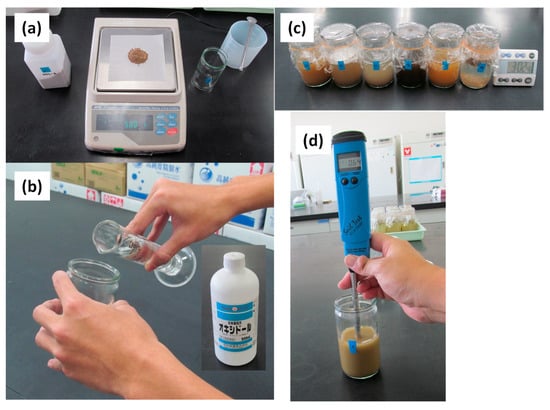
Figure 2.
The original oxydol method procedure: (a) sub-sample measurement, (b) addition of 3% H2O2 solution (Showa), (c) extraction at 25 °C for 40 h, and (d) measurement of EC (H2O2), reproduced from [9] with permission from the Japanese Society of Soil Science and Plant Nutrition.
In this study, we modified the original method slightly by using the Showa oxydol and six additional types of H2O2 solution (Figure 3). Except for one analytical grade reagent (Wako), the other H2O2 solutions are locally and commercially available (Table 2). The analytical grade solution contained H2O2 at about 30%, and was diluted with distilled water to 3% or 6% before use. The other solutions were used without dilution because the H2O2 concentration of each was about 3%. In addition, EC (H2O2) was measured with a stick-type EC sensor (HI98331 Gro Line Soil Test, Hanna Instruments, Woonsocket, RI, USA), which was an updated model of the EC sensor that we had used in the original method.
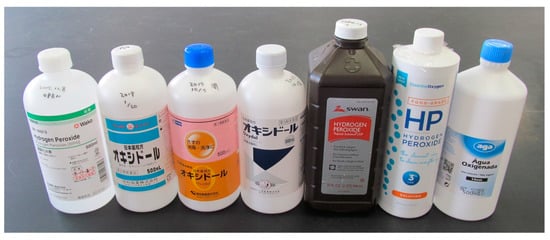
Figure 3.
The analytical grade (Wako) and commercially available H2O2 solutions used in this study. From left to right, Wako, Showa, Kenei, Kozakai, Swan, Essential Oxygen, and Álcool e Géneros Alimentares (AGA).
Table 2.
Hydrogen peroxide solutions used in this study.
2.3. Other Analyses
The EC of the H2O2 solutions used as extractants was measured with an EC sensor attached with a graphite electrode (Handy SC meter TCX-999i attached with CX90CS, Toko Chemical Laboratories, Co., Ltd., Tokyo, Japan). The concentration of sodium (Na) was also measured by atomic absorption spectrometry (AA-7000, Shimadzu Corporation, Kyoto, Japan) because Na+ was the only cation detected in any of the solutions by ion chromatography (PIA-1000, Shimadzu Corporation, Kyoto, Japan).
For the soil samples, the total N content was measured by the dry combustion method (Sumigraph NC-95A, Sumika Chem. Anal. Service, Osaka, Japan) using the finely ground samples [7].
The amount of soil organic N that was mineralized by H2O2 extraction was evaluated by measuring the NH4+ concentration in the soil extracts with the Showa solution. The NH4+ concentration was determined by filtering the extracts, converting NH4+ to NH3 by steam distillation of the extracts with 10 mol L−1 NaOH, collecting the liberated NH3 with 2% H3BO3, and measuring the NH4+ concentration colorimetrically by the indophenol method [19]. Because the NH4+ in the H2O2 extracts was recovered by steam distillation with strong alkali, the recovered NH4+ would include inorganic NH4+ present before the H2O2 treatment as well as soluble organic N hydrolyzed with alkali during the steam distillation.
The oxydol method was compared with two other simple methods that may allow estimation of soil total N; measurement of sample lightness (L* value) based on the CIE 1976 (L*, a*, b*) color system and of the 0.02 mol L−1 potassium permanganate-oxidizable organic C (POXC) content. The L* value of the finely ground samples was measured with a Soil Color Reader (SPAD-503, Konica Minolta, Tokyo, Japan) according to the method described by Moritsuka et al. [20]. Sample lightness was measured because soil lightness, evaluated visually by using a Munsell soil color chart, has been used for estimating the organic matter content [21,22]. The POXC concentration was measured according to the method described by Weil et al. [23] and Culman et al. [24]. The POXC method proposed by Weil et al. [23] is based on the oxidation reaction of soil organic C with potassium permanganate. As the reaction proceeds with time, the intensity of the purple permanganate color decreases in proportion to the amount of organic C oxidized. To determine the content of biologically active C in soil, the period of sample reaction was set at 12 min (shaking for 2 min and settling for 10 min) [24]. Then, after diluting the supernatant, the change in permanganate color was measured by the absorbance at 550 nm, and the amount of POXC was calculated as described by Weil et al. [23].
2.4. Statistical Analysis
The accuracy of estimation of soil total N was evaluated by the magnitude of determination coefficient obtained by linear regression analysis. The regression line obtained from each farm was compared with that obtained from the nationwide analysis [9] by the analysis of covariance (ANCOVA). Comparability of EC (H2O2) with the original method using the Showa oxydol was evaluated by the Student’s t-test and the correlation analysis using the data of all samples (n = 136). These statistical analyses were performed using Microsoft Office Excel 2010 and Ekuseru–Toukei 2012 (Social Survey Research Information Co., Ltd., Tokyo, Japan).
3. Results
3.1. Farm-Scale Variations in Total N in Surface Paddy Soils
Table 3 shows the descriptive statistics of the total N content in surface paddy soils. Compared to the national averages in Japan (about 2.3 g kg−1 [9,25]), the average total N content was lower at farms on non-volcanic ash soils (Kizu and Kyoto) and higher at farms on volcanic ash soils (Kawatabi and Moka). The content at Kizu was lowest, probably because the paddy fields in Kizu were constructed in 2016 and had not been used for rice production before we collected samples in April 2017. On the other hand, the high total N contents in Kawatabi and Moka would be due to the predominance of dark-colored organic matter stabilized by active Al and Fe. This is one of the most striking features of volcanic ash soils, by which the content of organic matter in volcanic ash soils has been estimated visually from the Munsell value (lightness) and chroma (vividness) [20]. The coefficients of variation (CV) observed at farm scale were smaller than the national-scale CV values reported previously (45–50% in Table 3). Nevertheless, farm-scale variations in soil total N were detectable at all sites, suggesting that farm-scale evaluation of soil total N may be useful for site-specific fertilizer management [26].
Table 3.
Descriptive statistics of the soil total N content (g kg−1) at each farm.
3.2. Accuracy of Estimation of Total N Content
Figure 4 shows the relationship between EC (H2O2) and total N content at farm scale. The determination coefficient was statistically significant when all farm-scale samples were included (r2 = 0.70). However, the Kizu samples were plotted below the regression line fitted to the nationwide data, whereas the samples from the other three farms, especially Moka, were plotted above the regression line. The Moka samples were plotted outside of the prediction interval at 95% for non-volcanic ash soils at national scale. Thus, the y-intercept of the regression line fitted to the data from each farm, especially Moka, differed significantly from that obtained for the non-volcanic ash soils at national scale (Table 4). The slope of the regression line also varied considerably from 2.28 (Kizu) to 4.51 (Moka) (Table 4). Within each farm, however, the relationship was significantly positive at all sites, including Kawatabi and Moka that were classified as volcanic ash soils (Figure 4). This result was contrasting to our previous results, where we found no relationship for 11 volcanic ash soils collected from different farms (r2 = 0.00; Moritsuka et al. [9]).
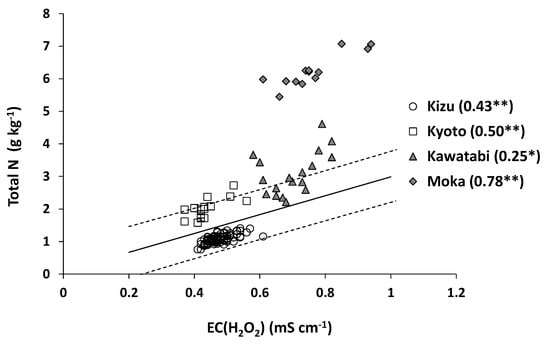
Figure 4.
Relationship between EC (H2O2) and total N content at farm scale. The solid line in the figure shows the regression line obtained from the nationwide samples excluding volcanic ash soils (n = 72), and the broken lines indicate the prediction interval at 95% confidence [9]. ** and * indicate statistical significance of the determination coefficients at p < 0.01 and p < 0.05, respectively.
Table 4.
Slope and y-intercept of the regression lines obtained for the relationship between EC (H2O2) and total N content at each farm and at national scale (Figure 4).
These results suggest that the relationship between EC (H2O2) and total N content is influenced by several factors, including the presence of cations other than NH4+ in the H2O2 extracts and the degree of mineralization of soil organic N during H2O2 extraction. We therefore evaluated the NH4+ concentration in the H2O2 extracts and calculated the H2O2-mineralizable organic N content in the samples. Then, EC (H2O2) values were significantly and positively correlated with the H2O2-mineralizable organic N content at all farms (Figure 5), suggesting that NH4+ was the dominant cation in the H2O2 extracts.
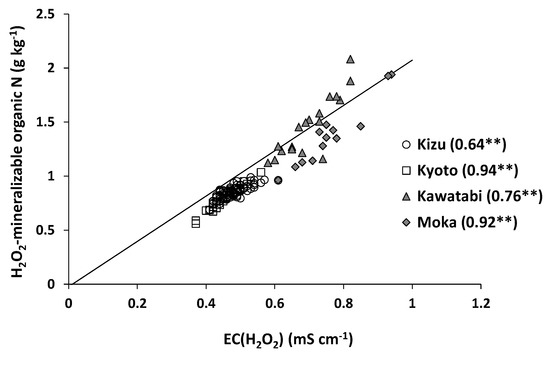
Figure 5.
Relationship between EC (H2O2) and H2O2-mineralizable organic N at farm scale. The line in the figure shows the regression line obtained from the nationwide samples (n = 83) [9]. ** indicates statistical significance of the determination coefficients at p < 0.01.
On the other hand, the proportion of H2O2-mineralizable organic N in total N varied considerably among the farms (Figure 6). The average percentage was 78.8% at Kizu but was less than 50% at the other farms (Kawatabi, 48.1%; Kyoto, 37.9%; and Moka, 22.0%). Compared to the percentages obtained from the nationwide samples, the average percentage of Kizu was similar to the average of the non-volcanic ash soils, whereas the average percentages of the other farms were similar to the average of the volcanic ash soils. Although the percentages differed across farms, within each farm, CV values were less than 20% and lower than the CV for nationwide samples. Thus, the proportion of soil organic N mineralized was relatively constant within each farm. This within-farm consistency must have contributed to the significant positive relationships between EC (H2O2) and total N content as well as to the different slopes of the regression line at farm scale (Figure 4, Table 4).
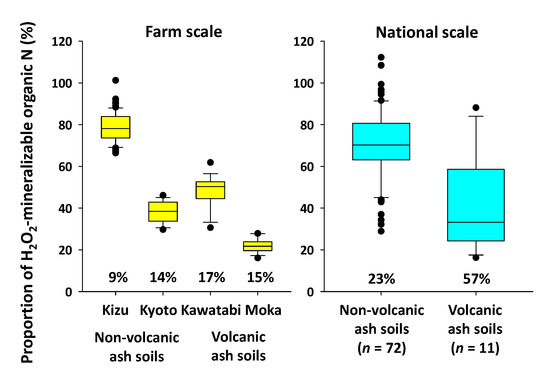
Figure 6.
Box plot of the proportion of H2O2-mineralizable organic N in total N. Data for the national-scale samples are cited from [9]. The horizontal line in each box represents the median. The lower and upper limits of each box are the 25th and 75th percentiles, and the lower and upper whiskers represent the 10th and 90th percentiles. The values below the box plot indicate the CV values for each group.
3.3. Comparability of Commercially Available H2O2 Solutions
The data reported in the above sections were obtained with the original method using the Showa oxydol containing phenacetin as a stabilizer (Table 2). The EC values of the tested H2O2 solutions varied widely (Table 5). EC of the analytical grade H2O2 (Wako, 30%) was very low (0.007 mS cm−1), close to that of distilled water, whereas the EC values of the six commercial H2O2 ranged from less than 0.05 to 1.4 mS cm−1. The Na concentration of the solutions was positively correlated with EC, suggesting that Na-bearing stabilizers such as sodium benzoate (AGA, Table 2) and sodium phosphate increased the EC values of some commercial products.
Table 5.
EC values and Na concentrations of the different H2O2 solutions used.
Table 6 summarizes the comparability of EC (H2O2) values obtained with the H2O2 solutions tested. The average EC (H2O2) values of soil extracts obtained with Kozakai, Swan, and Wako (6%) did not differ significantly from the Showa value. On the other hand, the average EC (H2O2) values obtained with Essential Oxygen and AGA were much higher than the Showa value, reflecting the high EC of the original solutions (Table 5). The average EC (H2O2) obtained with Essential Oxygen was lower than the EC of the solution before soil extraction (Table 5 and Table 6). The correlation coefficients with Showa were significantly positive for all the H2O2 solutions except Essential Oxygen.
Table 6.
Comparability of EC (H2O2) values obtained by using different H2O2 solutions.
Taken together, the results obtained with Kozakai, Swan, and Wako (6%) were considered most comparable to the Showa results. The results obtained with Kenei and Wako (3%) were also close to the Showa results, although their average EC (H2O2) values were slightly lower than that of Showa.
3.4. Comparing the Estimation Accuracy between the Oxydol Method and Other Methods
Figure 7 shows the relationship between the L* value (lightness) of finely-ground samples and total N content at farm scale. Almost all samples (132 out of 136) were within the prediction interval of non-volcanic ash soils at national scale, and the determination coefficient obtained from all samples was high (r2 = 0.82). At farm scale, however, the relationship was statistically significant only at Kizu.
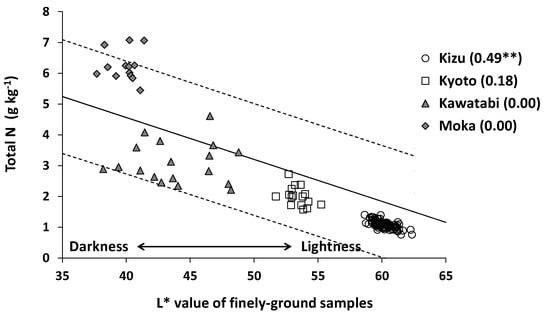
Figure 7.
Relationship between the L* value of finely-ground samples and total N content at farm scale. The solid line in the figure shows the regression line obtained from the nationwide samples (n = 147) [20], and the broken lines indicate the prediction interval at 95% confidence. ** indicates statistical significance of the determination coefficient at p < 0.01.
Similar results were obtained in the relationship between POXC content and total N content. The determination coefficient was very high when all samples were included (r2 = 0.90), whereas it ranged from 0.25 to 0.62 at farm scale (Figure 8). The percentage of POXC in total C ranged from 1.2% to 5.1%, suggesting that the amount of soil organic matter decomposed by the POXC method was much smaller than the amount decomposed by the oxydol method (Figure 6). These results imply that measurements of soil lightness (L* value) and POXC can be useful for estimating the total N content at national scale but not so much at farm scale.
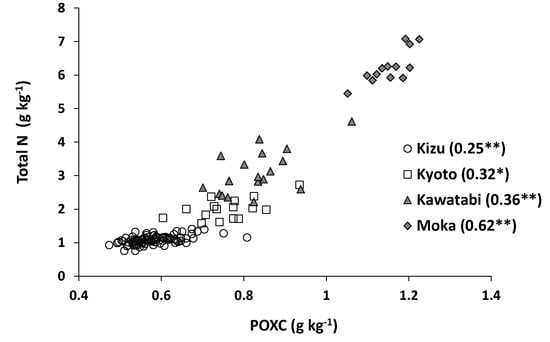
Figure 8.
Relationship between POXC (potassium permanganate-oxidizable organic C) content and total N content at farm scale. ** and * indicate statistical significance of the determination coefficients at p < 0.01 and p < 0.05, respectively.
4. Discussion
4.1. Merits and Limitations of the Oxydol Method
The overall merit of the oxydol method lies in its simplicity because it was designed for non-specialists having no access to laboratory facilities. For example, it is easy to purchase a 3% H2O2 solution used for disinfecting minor cuts and abrasions. Filtration of the soil extracts prior to their measurement is not necessary. A stick-type EC sensor (HI98331 Gro Line Soil Test, Hanna Instruments) costs less than 200 USD. Except the commercial H2O2 solution, reagents and distilled water are not necessary for any part of the procedure. It takes only 1–2 min per sample to measure EC (H2O2) [9], and many samples (e.g., 136 samples in this study) can be handled in a single batch by one person. The soil extracts can be safely disposed of without special treatment. These features are advantages over the conventional methods such as the POXC method. Thus, the oxydol method can be used by farmers as one of the effective decision-support tools for site-specific application of N fertilizer to paddy fields. Moreover, the method is potentially useful for scientific investigation, especially for an initial screening of samples to identify appropriate samples prior to detailed analysis by a conventional method.
On the other hand, the biggest weakness of the oxydol method lies in its limited applicability to some soils. Mikutta et al. [27] reviewed previous publications and reported that H2O2 is less effective than sodium hypochlorite and disodium peroxodisulfate for decomposition of soil organic matter. For example, according to Leifeld and Kögel-Knabner [28], the H2O2 treatment used for soil texture analysis could not remove 15–30% of the N from the solid phase of 20-µm sieved agricultural soils due to the presence of organic C resistant to the H2O2 treatment (6–17%) as well as NH4+ fixed strongly in 2:1 type clay minerals. In our case, the percentage of H2O2-mineralizable organic N in total N was relatively low for volcanic ash soils (Figure 6), and this is probably because of the stabilization of soil organic matter with active Al derived from non-crystalline clay minerals, such as allophane and imogolite, in volcanic ash soil. Furthermore, for soils containing manganese oxides and alkaline soils containing carbonates, less than 30% of the organic matter might be decomposed because the H2O2 itself would be rapidly decomposed to water and oxygen [27]. Thus, the applicability of the oxydol method is limited to neutral to acidic soils that are not rich in manganese oxides and highly stabilized organic matter.
The EC (H2O2) value can also be influenced by the presence of cations other than NH4+. In a previous study, we measured the concentration of cations in the H2O2 extracts of 83 samples collected at national scale. Then, the determination coefficient between EC (H2O2) and NH4+ (r2 = 0.83) was much higher than that between EC (H2O2) and other cations (Ca2+, Mg2+, K+, or Na+) (r2 < 0.4) [9]. For the samples analyzed in this study, the EC (1:5 w/v) values of the Kizu samples were relatively high (Table 1), but the EC (1:20 w/v) measured at the beginning of the H2O2 extraction (0.04 mS cm−1 on average) was much lower than the EC (H2O2) value (0.48 mS cm−1 on average). These results suggest that, as far as surface paddy soils in Japan are concerned, the NH4+ produced by the H2O2 extraction is a primary factor affecting EC (H2O2) (Figure 5).
From a technical aspect, the oxydol method requires an incubator or an air conditioner to keep the temperature at 25 °C during soil extraction, and the extraction period (40 h) is much longer than the POXC method [24]. In addition, it is important to select a suitable EC electrode. The EC sensors used in this study (HI98331 Soil Test EC tester; Handy SC meter TCX-999i with CX90CS) did not cause the H2O2 to decompose. In contrast, a platinum-black electrode attached to a conventional EC sensor causes rapid decomposition of H2O2 into water and oxygen, and the oxygen bubbles on the electrode surface may decrease the measured EC (H2O2) values. In this study, when the EC of the H2O2 solutions was measured with a conventional EC sensor (ES-51, Horiba, Ltd., Kyoto, Japan), the EC values were decreased by the presence of oxygen bubbles to 52–86% of those listed in Table 5.
4.2. Applicability of the Method to Farm-Scale Samples
By examining the similarities and differences between scientists’ and farmers’ evaluation of soil fertility, Yageta et al. [29] pointed out that scientists and farmers observe soil at different spatial scales, reflecting different direction of interests. Scientists tend to evaluate soil fertility at regional, national and global scales based on quantitative soil data, whereas farmers tend to evaluate soil fertility at farm, field and plot scales based on their local soil experience [29]. As the oxydol method was designed for non-specialists including farmers, we evaluated the method’s applicability to soil samples collected at the farm scale.
At all farms examined, soil total N content varied considerably (Table 3), and the EC (H2O2) was positively correlated with the total N content (Figure 4). These results suggested that the oxydol method is useful for estimating farm-scale variations in soil total N. The slopes and intercepts of the regression lines fitted to the farm-scale data were different from those fitted to nationwide data (Table 4). Thus, site-specific calibration is desirable to improve the estimation accuracy at a particular farm, especially at farms having volcanic ash soil such as Moka. The POXC method was equally effective at farm scale (Figure 8), whereas soil lightness (L* value) was significantly correlated with the total N content only at Kizu (Figure 7). At Kizu, the maximum difference of the L* value among the samples was only 3.7, which is less than half of the L* value difference between the neighboring color chips in a Munsell color chart (about 10). Thus, the soil color variations at Kizu were too small to evaluate visually by using a Munsell color chart.
At farm scale, the determination coefficients between EC (H2O2) and mineralized N were 0.23, 0.40, 0.18, and 0.53 at Kizu, Kyoto, Kawatabi, and Moka, respectively. Although these values were statistically significant at p < 0.01 except Kawatabi, they were consistently lower than the corresponding values between EC (H2O2) and total N (Figure 4). This result suggests that the oxydol method is most suitable for estimating the total N content in soil. Similar results were observed for the samples collected at national scale. Some of the soil samples analyzed by Moritsuka et al. [9] were also analyzed by Sano et al. [5]. For such samples collected throughout Japan (n = 31), the determination coefficient between the EC (H2O2) and soil N properties decreased from 0.64 (for total N) to 0.57 (for 0.33 mol L−1 potassium permanganate-oxidizable organic N) and 0.20 (for 0.067 mol L−1 phosphate buffer-extractable organic N). Among the various forms of soil N, total N showed the highest correlation with EC (H2O2).
4.3. Possibility of Using Different Types of H2O2 Solutions
The sensitivity of the oxydol method depends on how much soil EC increases during the extraction with 3% H2O2. The minimum scale of the EC sensor used in this study was 0.01 mS cm−1, and the soil to extractant ratio for oxydol method was set at 1:20 (w/v). Because the EC of ammonium sulfate or ammonium chloride containing NH4+ at 100 mgN L−1 is slightly greater than 1 mS cm−1, the minimum scale for detecting the total N content is estimated to be larger than 0.02 g kg−1, under the assumption that soil N is fully mineralized to NH4+ by the H2O2 treatment. In the case of surface paddy soils in Japan, only 5 of the 83 samples had EC (H2O2) values higher than 1 mS cm−1 [9]. EC (H2O2) values of the samples analyzed in this study were always lower than 1 mS cm−1. In contrast, the EC of the 3% H2O2 tested was higher than 0.2 mS cm−1 for Essential Oxygen and AGA (Table 5). Accordingly, EC (H2O2) may not reflect the concentration of NH4+ in the extracts, if the background EC is increased by the H2O2 stabilizer (Table 6).
The accuracy of estimation of soil total N is another important issue to consider. The color of soil extracts differed among the type of H2O2 solution used (Figure S1). In particular, the soil extracts obtained with Essential Oxygen were much darker than the others, which implies that more soil organic matter remained undecomposed in the extracts with Essential Oxygen. Except for Essential Oxygen, EC (H2O2), values obtained with other different solutions were relatively comparable with each other (Table 6).
Overall, these results suggest that an H2O2 solution with a relatively low EC (<0.2 mS cm−1) can be effectively used for the oxydol method.
5. Conclusions
The oxydol method was designed to be as simple as possible, so it can be used by non-specialists having no access to laboratory facilities. In this study, we demonstrated that the EC of commercially available 3% H2O2 solutions varied widely with the amount and type of stabilizers added, and that the oxydol method can be useful for estimating the farm-scale variation in soil total N, provided a less stabilized H2O2 is used for soil extraction. We have so far evaluated the method’s applicability to paddy soils sampled from Japan, and it would be worth evaluating its applicability to paddy soils in other countries and to soils under different land use.
Supplementary Materials
The following are available online at https://www.mdpi.com/2073-4395/10/1/40/s1, Figure S1: Color differences among extracts of the same soil sample treated with different H2O2 solutions. From left to right, Wako, Showa, Kozakai, Kenei, Swan, Essential Oxygen, and AGA.
Author Contributions
N.M. designed and carried out the experiments, and wrote the initial draft; H.S., R.T., Y.T., and H.H. managed their farm resources, supported soil sampling, and reviewed the manuscript. All authors have read and agreed to the published version of the manuscript.
Funding
This work was supported by JSPS KAKENHI Grant No. JP15K00634 and SATREPS (JST/JICA) Grant No. JPMJSA1608.
Acknowledgments
We are grateful to the staff of Laboratory of Soil Chemistry, Kyoto Prefectural University, and the staff of Laboratory of Soil Science, Kyoto University, for allowing us to use an NC analyzer and an atomic absorption spectrometer, respectively, and to Hisashi Kagata, Kyoto University Farm, for providing us the information of land reclamation and field management at Kizu.
Conflicts of Interest
The authors declare that there is no conflict of interest.
References
- Yoshida, S. Fundamentals of Rice Crop Science; The International Rice Research Institute: Los Baños, Philippines, 1981. [Google Scholar]
- Griffin, T.S. Nitrogen Availability. In Nitrogen in Agricultural Systems, Agronomy Monograph; no. 49; Schepers, J.S., Raun, W.R., Eds.; ASA-CSSA-SSSA: Madison, WI, USA, 2008; pp. 613–646. [Google Scholar]
- Gianello, C.; Bremner, J.M. Comparison of chemical methods of assessing potentially available organic nitrogen in soil. Commun. Soil Sci. Plant Anal. 1986, 17, 215–236. [Google Scholar] [CrossRef]
- Sharifi, M.; Zebarth, B.J.; Burton, D.L.; Grant, C.A.; Hajabbasi, M.A.; Abbassi-Kalo, G. Sodium hydroxide direct distillation: A method for estimating total nitrogen in soil. Commun. Soil Sci. Plant Anal. 2009, 40, 2505–2520. [Google Scholar] [CrossRef]
- Sano, S.; Yanai, J.; Kosaki, T. Relationships between labile organic matter and nitrogen mineralization in Japanese agricultural soils with reference to land use and soil type. Soil Sci. Plant Nutr. 2006, 52, 49–60. [Google Scholar] [CrossRef]
- Sahrawat, K.L. Nitrogen mineralization in lowland rice soils: The role of organic matter quantity and quality. Arch. Agron. Soil Sci. 2010, 56, 337–353. [Google Scholar] [CrossRef]
- Bremner, J.M. Nitrogen-Total (Chapter 37). In Methods of Soil Analysis, Part 3, Chemical Methods; SSSA Book Series no. 5; Sparks, D.L., Ed.; SSSA-ASA: Madison, WI, USA, 1996; pp. 1085–1121. [Google Scholar]
- Christianson, C.B.; Holt, L.S. Rapid digestion procedure for the determination of total nitrogen and nitrogen-15 content of soils. Soil Sci. Soc. Am. J. 1989, 53, 1917–1919. [Google Scholar] [CrossRef]
- Moritsuka, N.; Matsuoka, K.; Katsura, K.; Sano, S.; Yanai, J. Estimation of total nitrogen content in surface paddy soils by measuring their electrical conductivity after hydrogen peroxide treatment. Jpn. J. Soil Sci. Plant Nutr. 2017, 88, 327–335. (In Japanese) [Google Scholar]
- Robinson, G.W. Note on the mechanical analysis of humus soils. J. Agric. Sci. 1922, 12, 287–291. [Google Scholar] [CrossRef]
- Robinson, W.O. The determination of organic matter in soils by means of hydrogen peroxide. J. Agric. Res. 1927, 34, 339–356. [Google Scholar]
- Harada, Y.; Inoko, A. The oxidation products formed from soil organic matter by hydrogen peroxide treatment. Soil Sci. Plant Nutr. 1977, 23, 513–521. [Google Scholar] [CrossRef]
- Guan, G.; Marumoto, T.; Nishiyama, M. Influence of iron and aluminium oxide on the amount of microbial biomass and decomposition of rice straw in H2O2-treated soil. Jpn. J. Soil Sci. Plant Nutr. 1999, 70, 171–176. (In Japanese) [Google Scholar]
- Eith, C.; Kolb, M.; Seubert, A.; Viehweger, K.H. Practical Ion Chromatography. An Introduction; Metrohm Monograph, Metrohm Ltd.: Herisau, Switzerland, 2001. [Google Scholar]
- Schmucker-Castner, J.; Desai, D. Rheology modification of hydrogen peroxide-based applications using cross-linked polyacrylic acid polymers. Int. J. Cosmet. Sci. 1999, 21, 313–325. [Google Scholar] [CrossRef] [PubMed]
- NARO. Digital Soil Map of Japan. 2019. Available online: https://soil-inventory.dc.affrc.go.jp/ (accessed on 15 November 2019). (In Japanese)
- Bundy, L.G.; Meisinger, J.J. Nitrogen Availability Indices (Chapter 41). In Methods of Soil Analysis, Part 2, Microbiological and Biochemical Properties; SSSA Book Series no. 5; Weaver, R.W., Ed.; SSSA: Madison, WI, USA, 1994; pp. 951–984. [Google Scholar]
- Moritsuka, N.; Izawa, G.; Katsura, K.; Matsui, N. Simple method for measuring soil sand content by nylon mesh sieving. Soil Sci. Plant Nutr. 2015, 61, 501–505. [Google Scholar] [CrossRef][Green Version]
- Mulvaney, R.L. Nitrogen—Inorganic forms (Chapter 38). In Methods of Soil Analysis, Part 3, Chemical Methods; SSSA Book Series no. 5; Sparks, D.L., Ed.; SSSA-ASA: Madison, WI, USA, 1996; pp. 1123–1184. [Google Scholar]
- Moritsuka, N.; Matsuoka, K.; Katsura, K.; Sano, S.; Yanai, J. Soil color analysis for statistically estimating—Total carbon, total nitrogen and active iron contents in Japanese agricultural soils. Soil Sci. Plant Nutr. 2014, 60, 475–485. [Google Scholar] [CrossRef]
- Japanese Society of Pedology. A Handbook for Soil Survey. Revised Edition; Japanese Society of Pedology: Hakuyusha, Tokyo, 1997; p. 169. (In Japanese) [Google Scholar]
- van Leeuwen, M.M.W.J.; Heuvelink, G.B.M.; Wallinga, J.; de Boer, I.J.M.; van Dam, J.C.; van Essen, E.A.; Moolenaar, S.W.; Verhoeven, F.P.M.; Stoorvogel, J.J.; Stoof, C.R. Visual soil evaluation: Reproducibility and correlation with standard measurements. Soil Tillage Res. 2018, 178, 167–178. [Google Scholar] [CrossRef]
- Weil, R.R.; Islam, K.R.; Stine, M.A.; Gruver, J.B.; Samson-Liebig, S.E. Estimating active carbon for soil quality assessment: A simplified method for laboratory and field use. Am. J. Altern. Agric. 2003, 18, 3–17. [Google Scholar] [CrossRef]
- Culman, S.W.; Freeman, M.; Snapp, S. Procedure for the Determination of Permanganate Oxidizable Carbon; Kellogg Biological Station, Michigan State University: Hickory Corners, MI, USA, 2014; Available online: https://lter.kbs.msu.edu/protocols/133 (accessed on 5 June 2019).
- MAFF Agricultural Production Bureau. Summary on the National Soil Survey Programs in Japanese Agricultural Land from 1979 to 2003; Agricultural Production Bureau, Ministry of Agriculture, Forestry and Fisheries: Tokyo, Japan, 2008; p. 485. (In Japanese)
- Moritsuka, N.; Matsuoka, K.; Katsura, K.; Yanai, J. Farm-scale variations in soil color as influenced by organic matter and iron oxides in Japanese paddy fields. Soil Sci. Plant Nutr. 2019, 65, 166–175. [Google Scholar] [CrossRef]
- Mikutta, R.; Kleber, M.; Kaiser, K.; Jahn, R. Organic matter removal from soils using hydrogen peroxide, sodium hypochlorite, and disodium peroxodisulfate. Soil Sci. Soc. Am. J. 2005, 69, 120–135. [Google Scholar] [CrossRef]
- Leifeld, J.; Kögel-Knabner, I. Organic carbon and nitrogen in fine soil fractions after treatment with hydrogen peroxide. Soil Biol. Biochem. 2001, 33, 2155–2158. [Google Scholar] [CrossRef]
- Yageta, Y.; Osbahr, H.; Morimoto, Y.; Clark, J. Comparing farmers’ qualitative evaluation of soil fertility with quantitative soil fertility indicators in Kitui County, Kenya. Geoderma 2019, 344, 153–163. [Google Scholar] [CrossRef]
© 2019 by the authors. Licensee MDPI, Basel, Switzerland. This article is an open access article distributed under the terms and conditions of the Creative Commons Attribution (CC BY) license (http://creativecommons.org/licenses/by/4.0/).