1. Introduction
Citrus is one of the most important crops in the world. According to data from the United Nations Food and Agriculture Organization (FAO), in 2017 there were a total of 148 citrus-producing countries [
1] and the world production reached almost 50 million tonnes for oranges [
2] and almost 30 million for mandarins, tangerines and satsumas [
3]. Spain leads the world ranking of citrus exports for consumption as fresh fruit and is the sixth-largest producer worldwide [
4].
Information about quality and production in the citrus sector is one of the most important factors affecting the commercial value of fruit, but the generation of maps representing spatial variability has been not widely developed due to the fact that the harvest is mainly carried out manually. Therefore, only the data for yield per orchard is obtained [
5]. Just a few systems and techniques have been developed to monitor data and generate maps of citrus crops. Specifically, Schueller et al. [
6] developed and evaluated a low-cost yield mapping system for citrus and Molin et al. [
7] generated productivity maps by weighing the bags of harvested fruit in the field.
Both methods used the data obtained from the manual harvesting of the fruit, which is currently the predominant system for harvesting in the case of fruit destined for the fresh fruit market. This harvesting method accounts for between 30% and 50% of the total costs of production, depending on the species and method of cultivation [
8]. In order to reduce costs and ensure profitable production for farmers, a number of solutions have been proposed to allow for the mechanisation of harvesting, such as harvest-assist platforms for citrus to be commercialised for consumption as fresh fruit [
9,
10,
11] and trunk and canopy shakers for citrus to be used for industry [
12].
Mechanised harvesting offers a great advantage when it comes to calculating citrus production, as it allows technology to be incorporated into harvest-assist machines together with sensors for carrying out complementary tasks, such as fruit counting, weighing, classification or the extraction of quality parameters. The development of field inspection systems makes it possible to characterise the quality (colour, size, rot) and the production during harvesting. This information, together with the location data obtained with a global navigation satellite system (GNSS), makes it easier to georeference each fruit and associate it with its properties [
13]. The joint generation of yield and fruit quality maps, together with information on conditioning factors that may affect the crop, such as crop health, soil properties, the presence of diseases and pests or climatic data, allow farms to be managed more efficiently.
The use of information and communication technologies (ICT) in precision agriculture makes it possible to optimise the management of farms. One of the main tools used in precision agriculture to present information to farmers is the creation of maps to evaluate the spatial variability present in the field [
14]. Such maps are a key tool due to their usefulness both in the development and in the evaluation of precision management strategies [
15]. The spatial representation of crop data through maps is one of the most effective techniques for offering farmers information in a useful and understandable way.
The maps are generated from the georeferencing information obtained in the field using geographic information systems (GIS). These systems are specific computer tools that, by means of spatially-referenced information, make it possible to import, georeference, manipulate and display a large amount of data in various forms (graphs, figures, maps, etc.) [
16]. At present, there are many GIS and also agricultural management applications with built-in GIS modules (i.e. QGIS, AFS, ArcGIS, Trimble Ag) for the management of spatial data. These applications are used to provide precision agriculture information to agricultural producers [
17]. However, the basic visualisation functions they provide may not be sufficient for later decision-making, which makes it necessary to create new tools with more advanced functions for converting the data obtained by the sensors into information that is useful and practical to the farmer in an easy and accessible way. For this reason, some researchers have started to develop custom tools with integrated GIS modules for precision agriculture [
18,
19,
20,
21].
In the specific case of calculating and mapping citrus production, there are very few tools available that are dedicated to the explicit processing of this information. The existing commercial GIS tools mentioned above do not have algorithms for calculating production, classifying by quality-related categories, georeferencing the categorised information on maps and the statistical analysis of information for delimited areas within the crop itself, which prevents immediate differential management of the orchard. Some researchers have developed tools for calculating production, but their market penetration is still relatively low. For example, the Crop Auditor program developed by Ampatzidis et al. [
22] processes the information obtained based on the weight of each of the boxes of fruit harvested manually and the georeferences according to the location of the boxes.
The aim of this work was the generation of a new smart tool to create yield and fruit quality maps through a new dashboard called CitrusYield. This tool converts agricultural data into information that is useful for farm management. To demonstrate the performance of this tool, tests were carried out using a citrus harvest-assist platform. The sensors installed on the platform captured information about both the crop and the machine performance during the mechanised harvesting of orange and tangerine. The information was analysed by this tool through specific algorithms and statistical analyses and converted into graphs and practical maps.
2. Materials and Methods
2.1. Data Acquisition
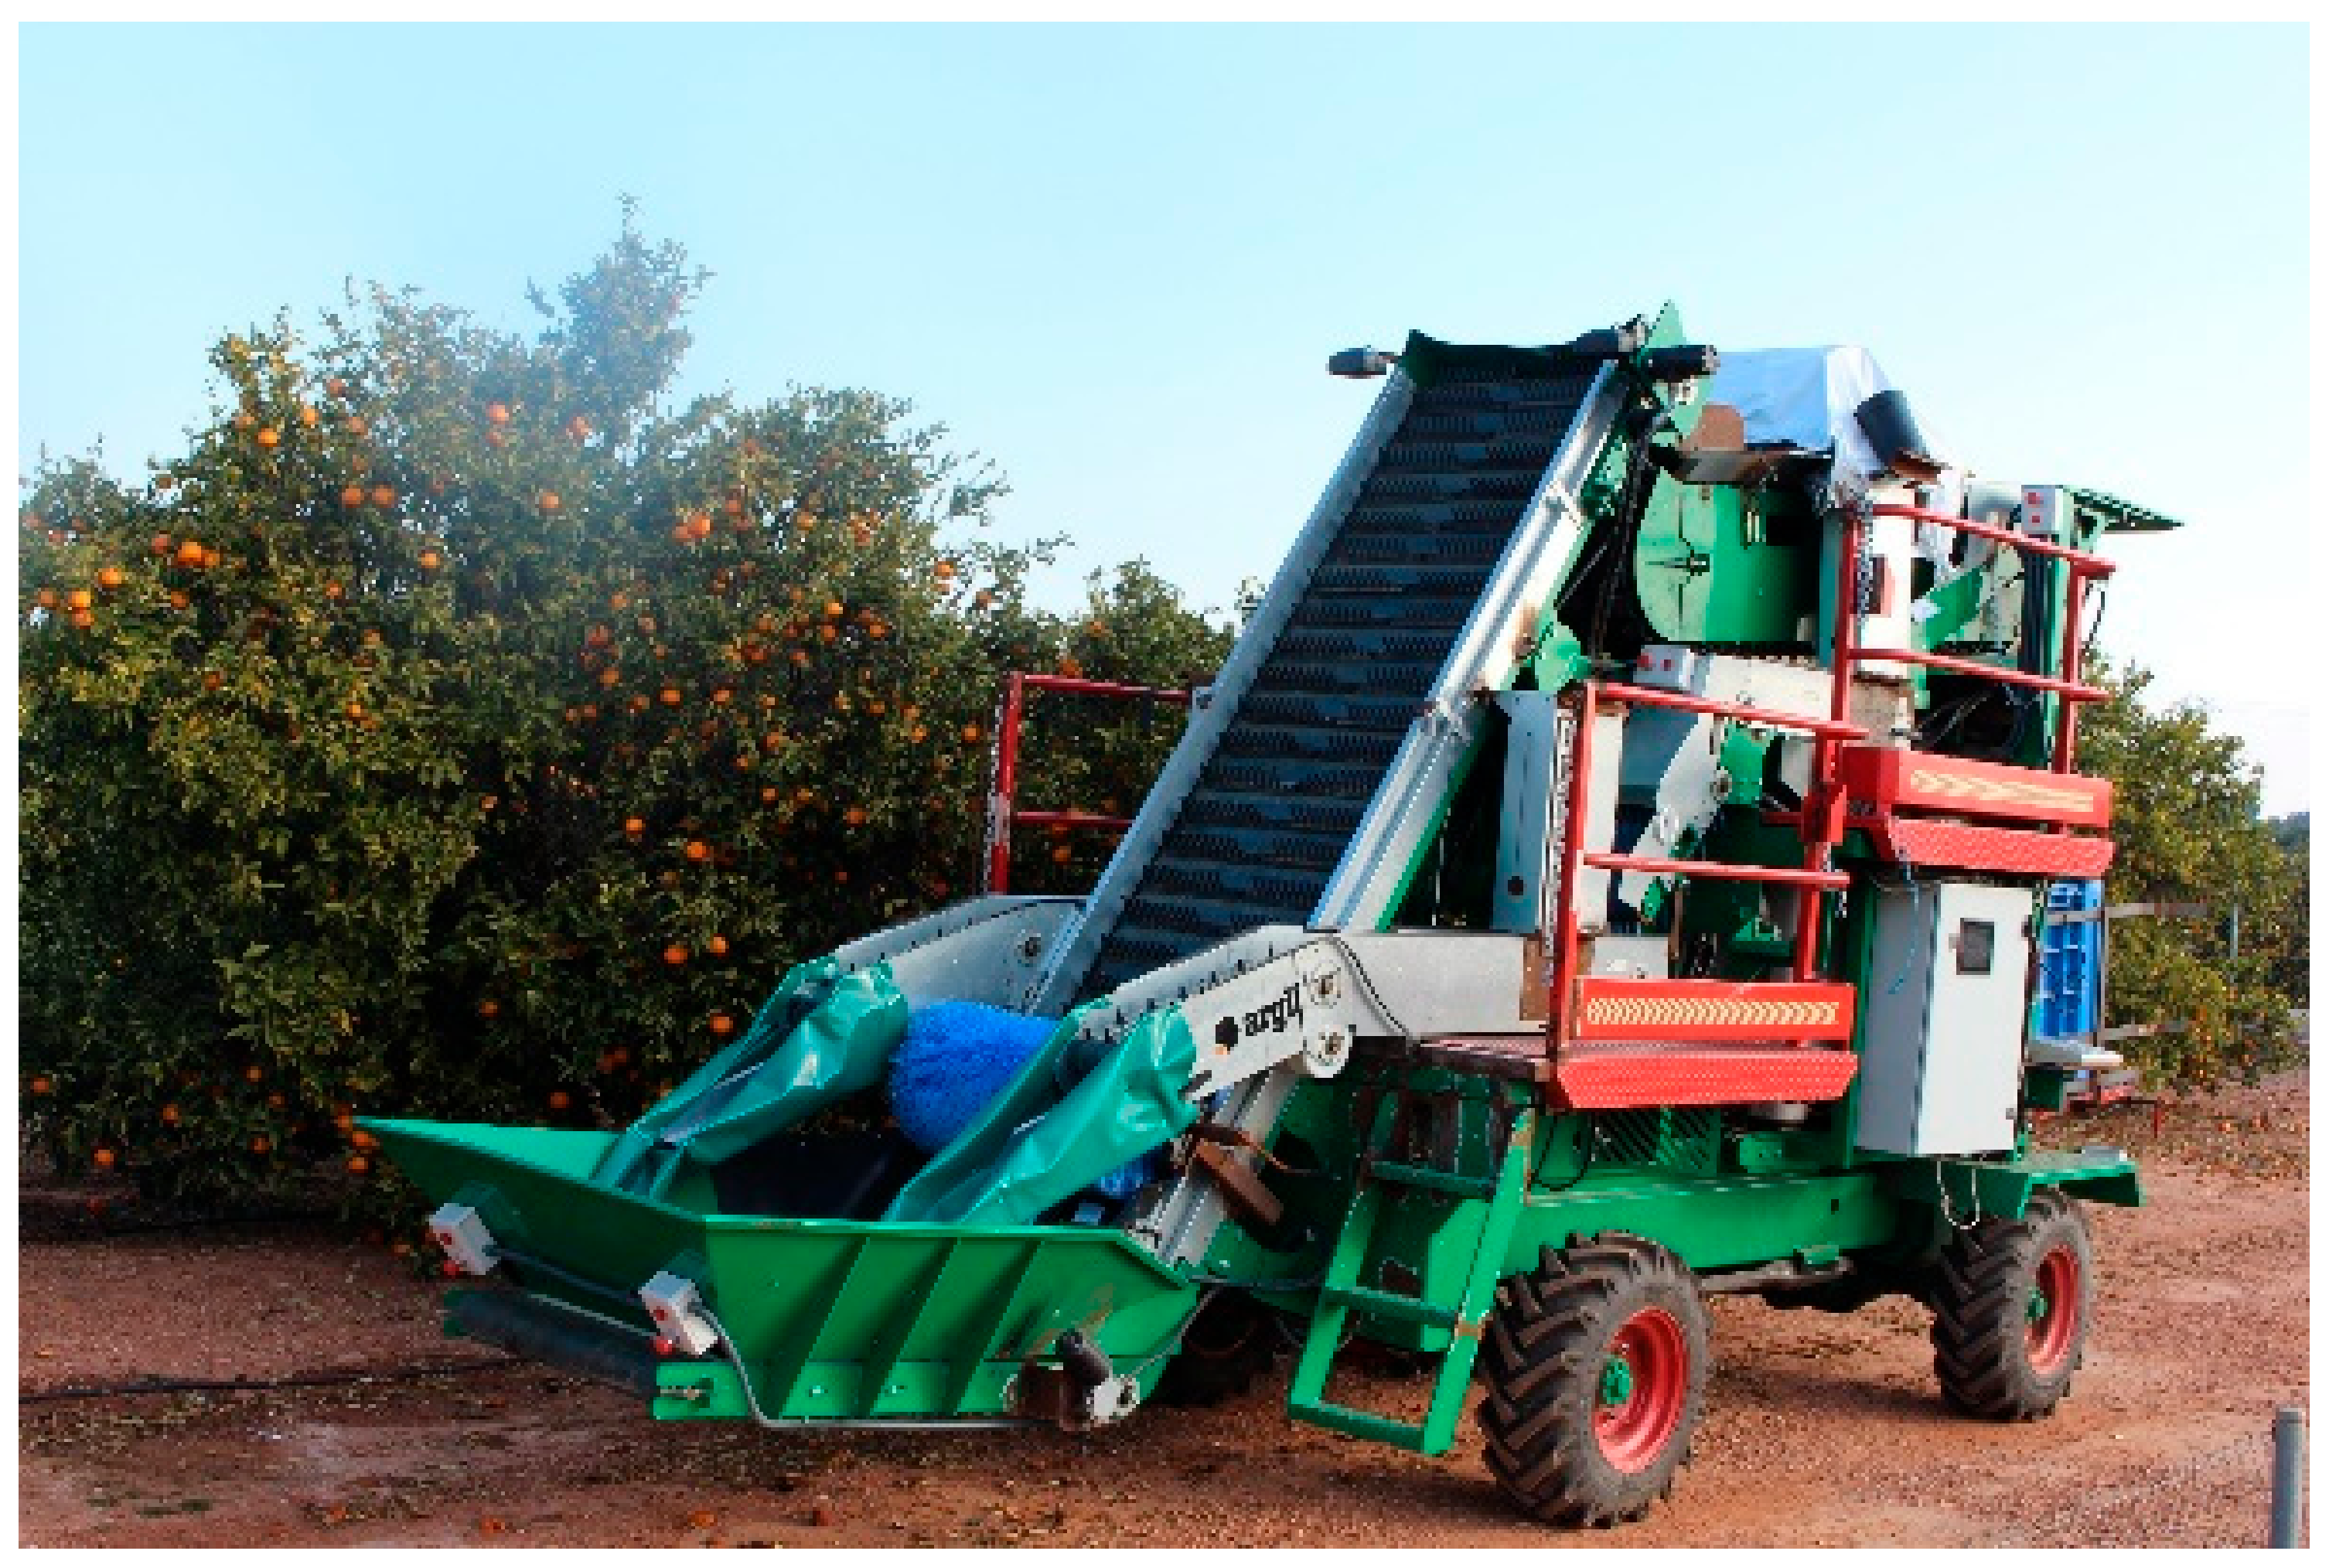
The data were acquired from a prototype harvest-assist platform created at the Valencian Institute of Agricultural Research (IVIA), Moncada (Valencia), Spain (
Figure 1).
This prototype allows for the individualisation of all collected fruit as they move through the conveyor belts and incorporates an artificial vision system for inspecting the external quality of all of the produce while it is harvested. The features inspected by the vision system are size, shape and colour [
23]. In addition, this prototype has two outlets to separate the fruit into two commercial categories (output bin 1 and output bin 2). Those fruits that did not achieve a commercial category because they did not reach the minimum size were sent to the output bin 2, while the rest were delivered to the output bin 1.
The computer vision is composed of bi-conic rollers to transport the fruit so that they rotate under the cameras in order to capture the complete surface of the fruits, two colour cameras, and an encoder to identify and track the exact position of every individual fruit.
The computer vision system captured four views of each fruit while the fruit rotated under the cameras. To separate the fruit from the background in the images, a green and blue (G/B) band ratio based on the red-green-blue (RGB) value of each pixel was used. Only those pixels with a value greater than the threshold are considered to belong to the fruit. This ratio was chosen due to the relatively low blue and high green values of the fruit at all stages of maturity.
The citrus colour index (CCI) [
24] was used to estimate the standard colour of the fruit, calculated according to Equation (1), where L, a and b are the coordinates of the Hunter Lab colour space. The average RGB value of each partial view of the fruit was calculated during the previous segmentation process. Then, it was converted into HunterLab coordinates to obtain the partial CCI. The CCI of the fruit is calculated as the average of the four images of the fruit [
25].
where
L,
a, and
b are colour coordinates in the HunterLab colour space.
To optimize and speed up the process, the fruit size was estimated from the sum of all the pixels, considered as belonging to the fruit when the image was segmented. Then, the diameter was calculated using Equation (2) for the area:
where d is the estimated fruit diameter (size) and
A is the area calculated as the number of pixels in the fruit. Finally, the fruit size was calculated as the average of the partial sizes of each image acquired from the same fruit [
13].
The system was calibrated to measure colour and diameter using 225 oranges cv. ’Navelina’ covering all range of colours and sizes. The colour of each fruit was measured in two different locations using a colorimeter (Minolta C400, Konica Minolta Opto Inc., Tokyo, Japan) and the equatorial diameter of each fruit was measured using a digital calliper. The coefficient of determination (R2) between the references and the measurements given by the vision system were calculated, achieving values of 0.918 and 0.993 for the CCI and the size, respectively.
In order to be able to georeference each fruit for this work, a GNSS was installed on the prototype (Hiper SR, Topcon Positioning Systems, Tokyo, Japan). The geolocation frequency was set to 1 Hz. The exact time was also recorded with a precision of milliseconds to synchronise the geographical information and the acquisition of the images using a timestamp method. The GNSS receiver used real-time kinematic (RTK) positioning to enhance the precision of the location data obtained. This was achieved using a real-time communication between this receiver (rover station) and a base station through the mobile telephone network. This way, a precision of 10 mm (H) and 15 mm (V) was achieved. The measurements captured can be seen in
Table 1.
2.2. Field Tests
Field tests were carried out using the prototype of a mobile harvest-assist platform. For the trials, a citrus plot with a spatially varied production in harvest, size and colour was required. Thus, an experimental plot producing different varieties of orange was selected in Moncada (Valencia), Spain (World Geodetic System 1984 (WGS84) [
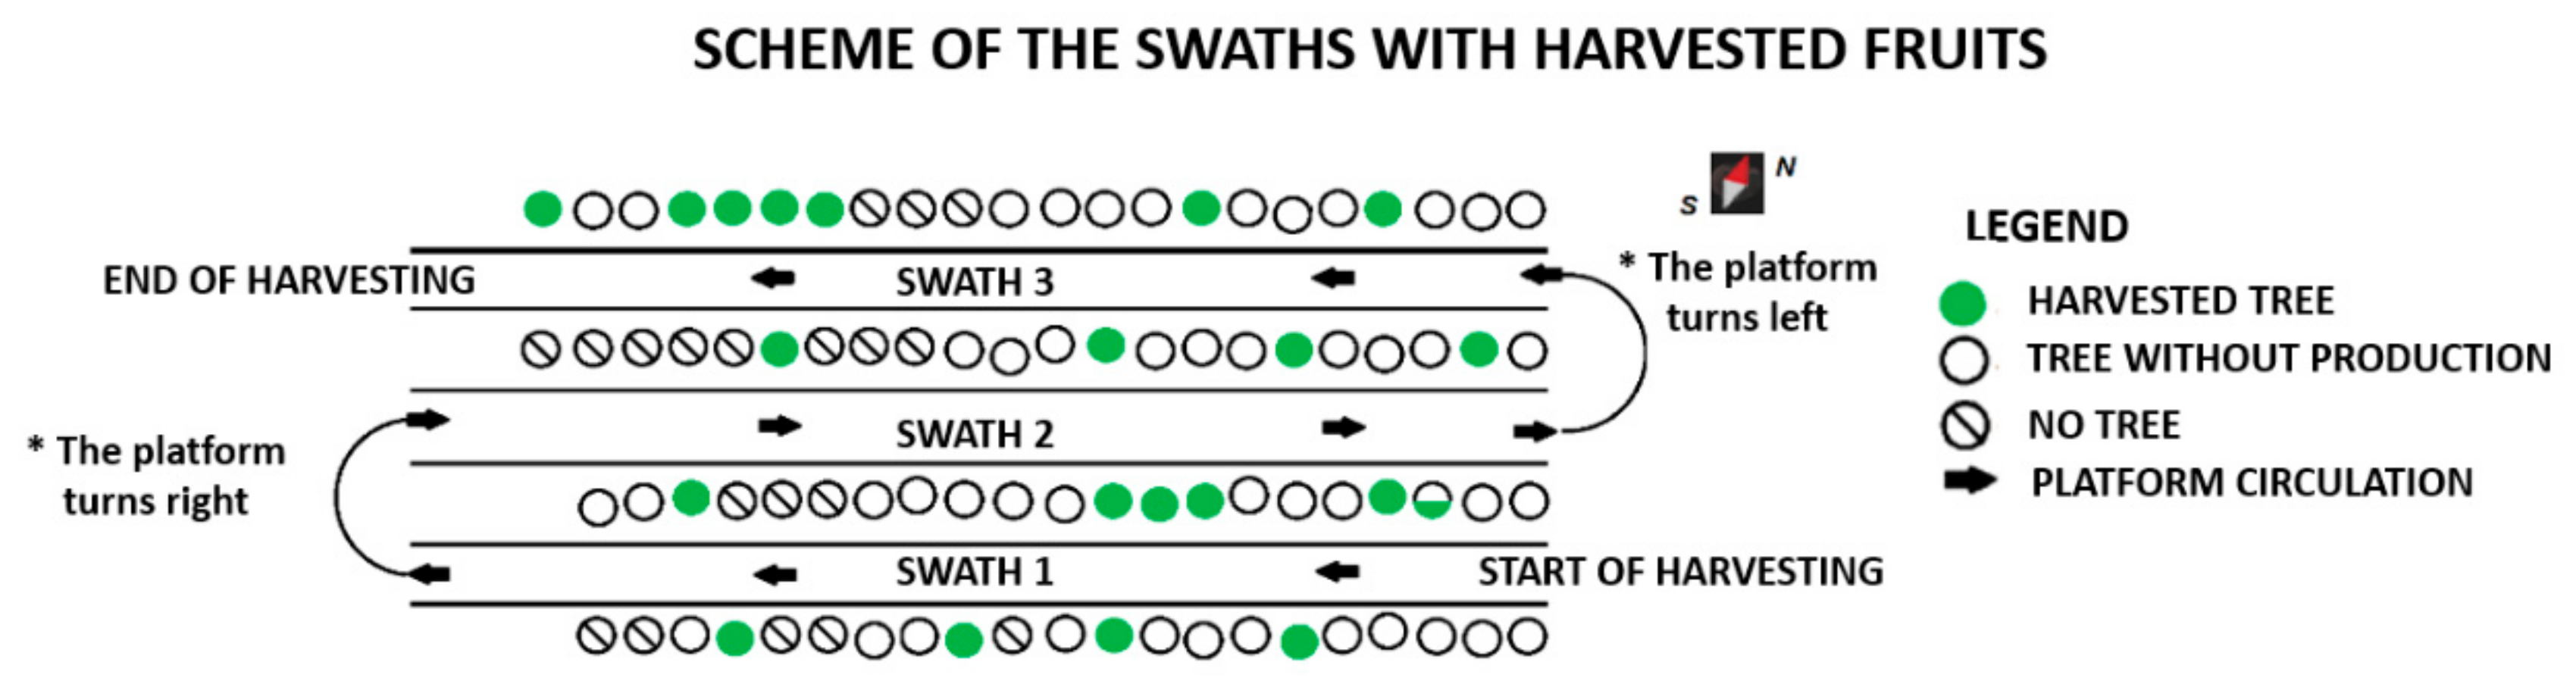
26]: W: 39.585186, N: −0.397901). This plot had a distance of 6 m between crop lines and 4 m between trees within the same crop line. During the tests, a set of trees belonging to three adjacent swaths was harvested. In each swath, the fruits located on the sides facing the prototype movement were harvested.
Figure 2 shows the harvesting scheme in the plot.
After the field tests, the file with the location data recorded by the Global Positioning System (GPS) and the files created by the vision system of the prototype were obtained and analysed.
For the data analysis and display, a dashboard called CitrusYield was developed using the open source R software [
27]. CitrusYield was developed to allow the introduction and processing of different quantitative input variables, producing information about the crop and the harvesting process. The information was processed and analysed by CitrusYield (
Figure 3), which provides (1) a spatial database where each fruit is linked to its location and characteristics; (2) maps of the production and features of the production; (3) an exploratory data analysis (EDA) representing the information analysed in plots, box diagrams and histograms with density curves; and (4) the calculation of a series of parameters for the spatial analysis of the yield of the harvest process and the prototype performance, as a quality indicator of the inspected fruit, the performance of the prototype vision system, a productivity indicator and the working capacity of the prototype.
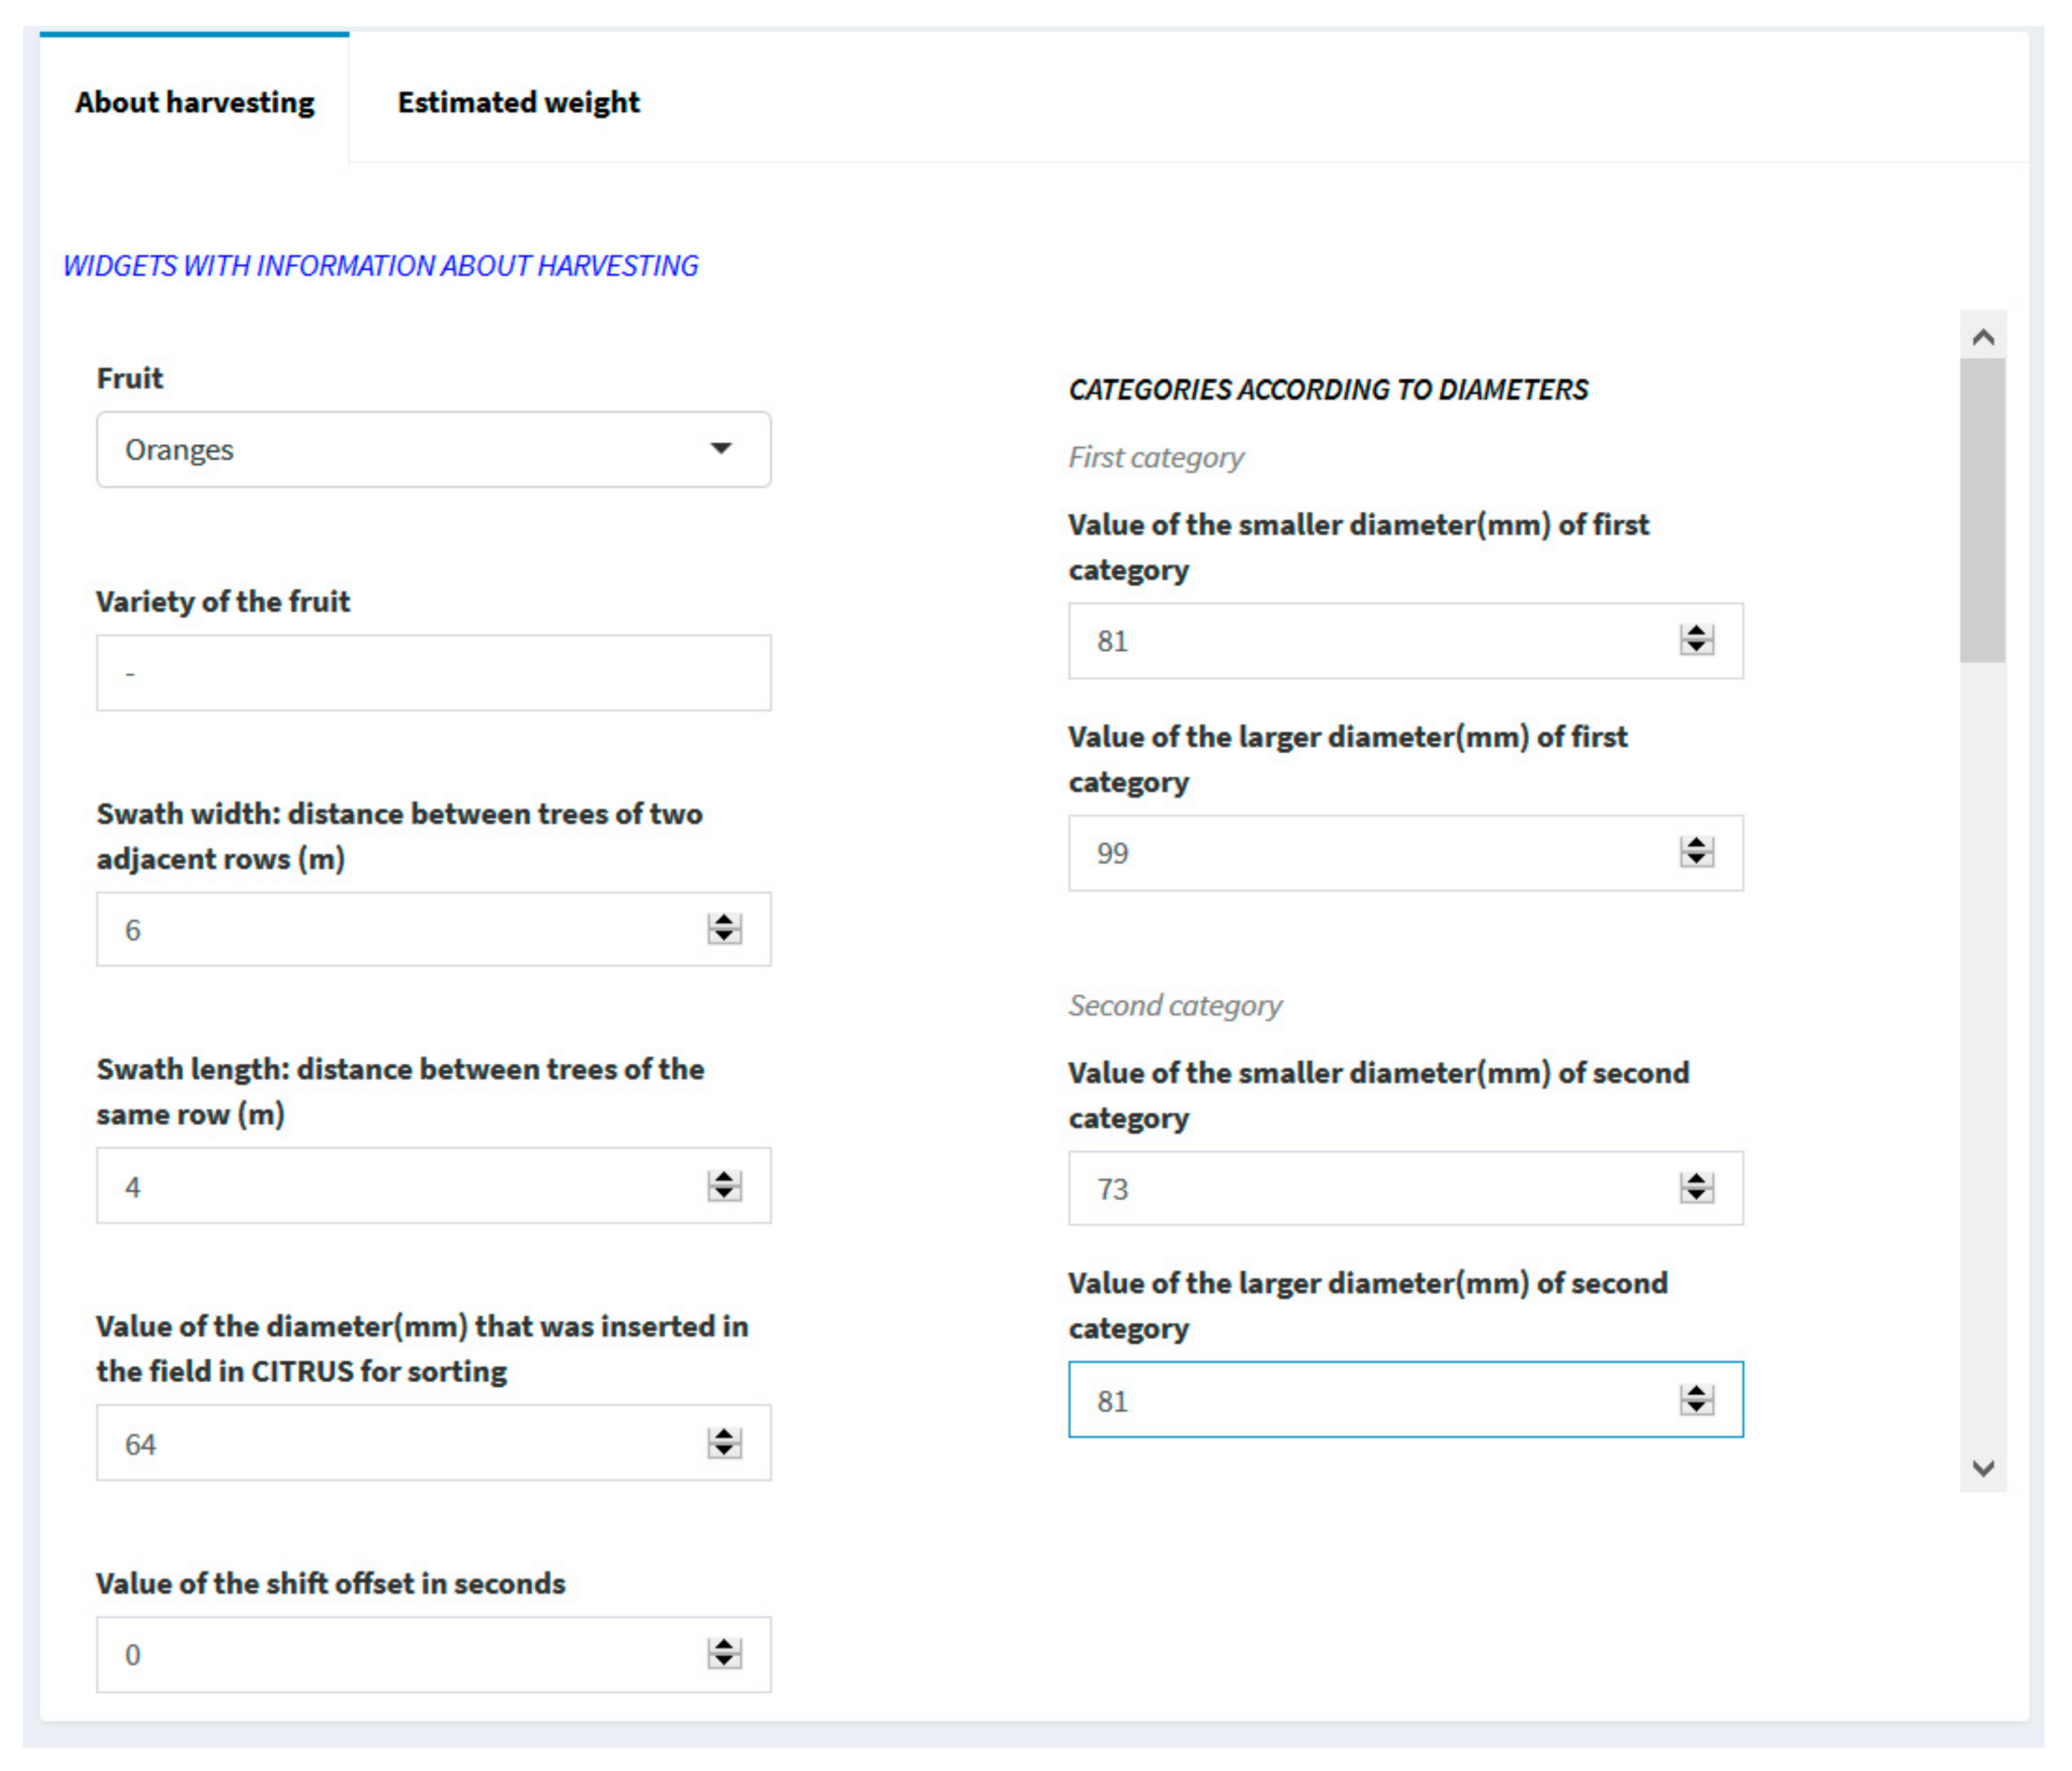
2.3. Inputs in the CitrusYield Dashboard
Information about the crop and the harvesting process was inserted in the dashboard (
Figure 4).
The size categories were established according to the Commission Delegated Regulation (EU) 2019/428, which are shown in
Table 2.
In addition, the estimation of the weight of the fruit as a function of the diameter was included. The weight was calculated based on a linear regression equation depending on the type of citrus being harvested (oranges or mandarins). In order to obtain the coefficients of the variables, a test was carried out using 200 fruits for each cultivar. In this test, the diameter of the equatorial section of each fruit was measured and the fruits were weighed. For oranges, Equation (3) was obtained with oranges cv. ‘Navelfoios’ (R
2 = 0.94) and Equation (4) was obtained for mandarins based on a trial conducted with mandarins cv. ‘Clemenules’ (R
2 = 0.94). However, CitrusYield leaves it open to the user to introduce different coefficients to adapt the dashboard to other cultivars.
2.4. Agricultural Maps
A spatial database was created by CitrusYield, linking the time stamps created by the GPS and the vision system. In the tests carried out, the spatial database that was created related each fruit to the number assigned to the swath where it was collected, the date and time of linking, the location (longitude, latitude and altitude), the variables related to the prototype (channel, camera and output bin), the variables measured in the images of the fruit (diameter and colour index) and, finally, the ‘estimated weight’ variable created in the dashboard. The longitude and latitude variables are displayed in the WGS84. Quantitative variables were measured using the International System of Units (SI). This way, it was possible to locate the amount of fruit collected in each point of the field or assign the quality of any fruit to its exact harvest location. The creation of this database offered a record of the fruits, which ensured traceability from the early stages of production.
Using this information, maps were created within CitrusYield using the leaflet package for R [
28]. This open source library makes it easy to create customised maps. One of the advantages of using this package is that it is not necessary to pre-load the maps. For each location data obtained by the GNSS, the latitude and longitude were extracted. With this geographical information, the functions programmed in the dashboard superimposed a marker for each fruit on the crop map. Among the map options offered for the projection of the markers, the orographic map was selected, therefore, the point for each fruit is projected directly on the map by means of its location information.
The dashboard was programmed to generate three types of maps: one according to three ranges for the ‘colour index’ variable, where the limits for each range were pre-set at the CCI values (−80, −3), (−2, 7), (8, 50); another showing the size distribution according to the seven categories defined; and, finally, one map showing the fruits sent to output bins 1 and 2, representing where those fruit not achieving commercial quality were harvested.
Each fruit was georeferenced as a point on the orographic map. If there were many points in the same category that overlapped in one area, the colour related to this category intensified there. Therefore, the greater the intensity of the colour for a category in an area, the greater the amount of fruits collected from that category in that area.
2.5. Exploratory Data Analysis (EDA)
A main advantage of this new tool is the possibility of performing analyses from the data shown in the maps. These analyses were shown to the grower through easy-to-understand graphs and plots. For this purpose, the plotly package for R [
29] was chosen as it can be used to generate interactive graphs. Data collected during the tests were shown through diagrams for the quantitative variables.
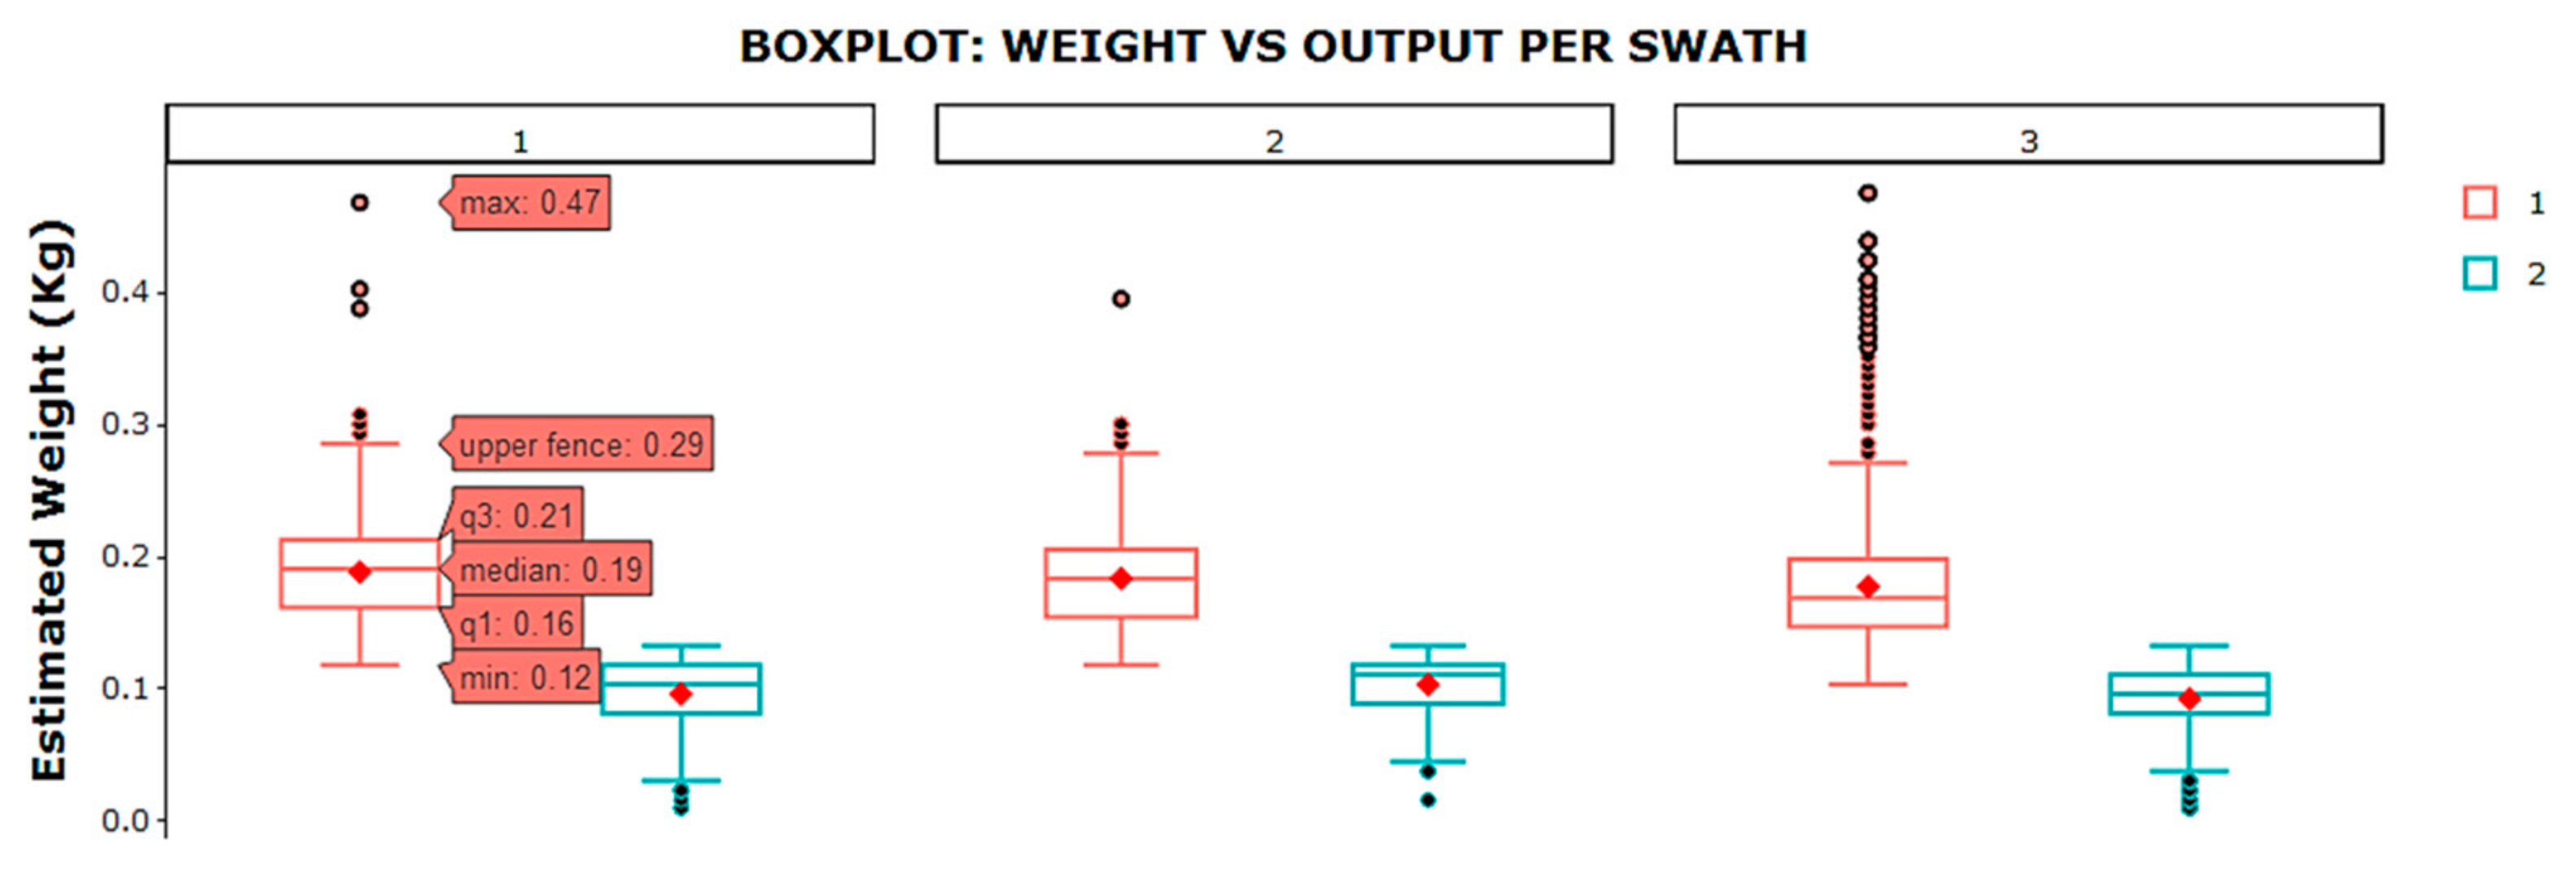
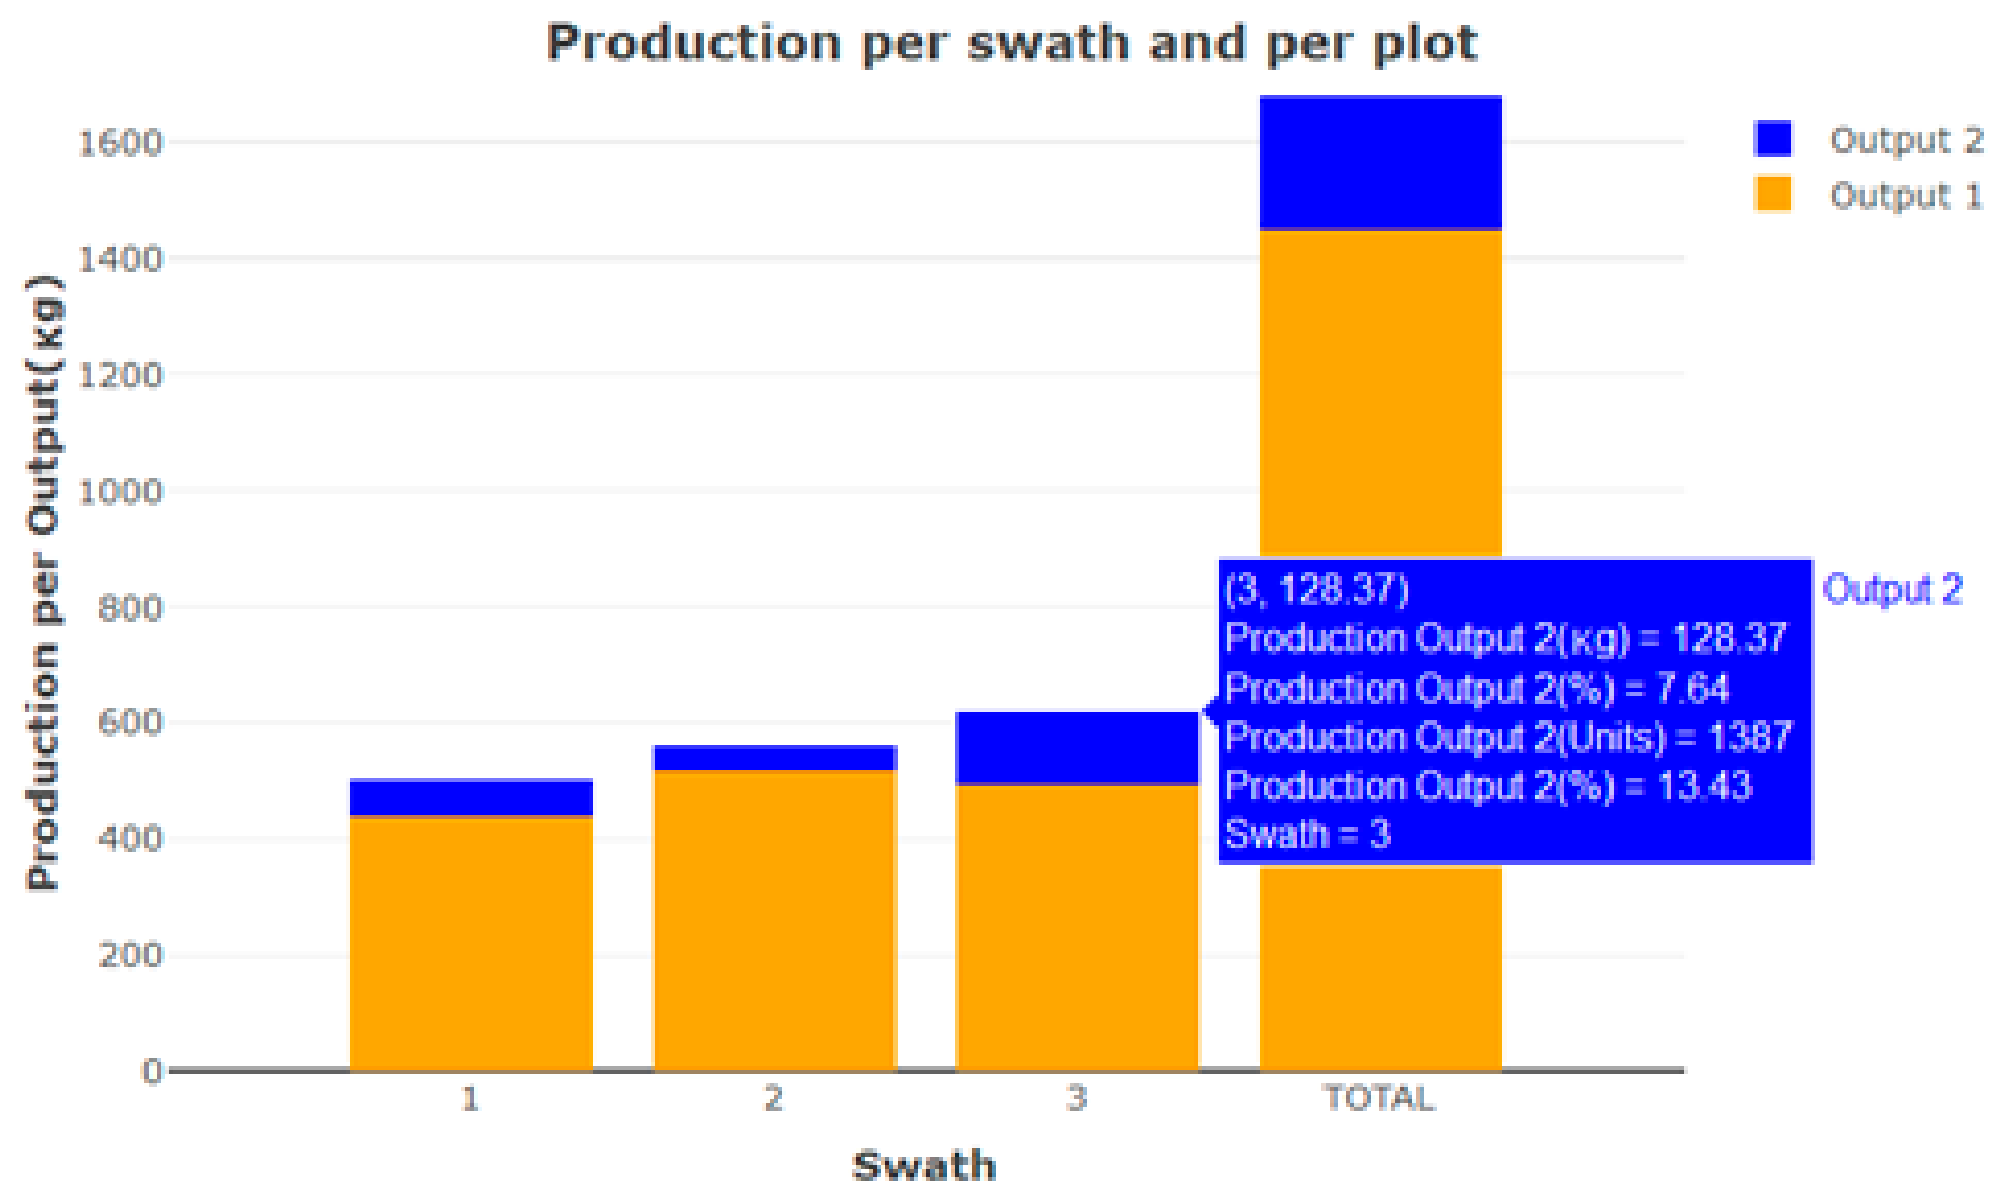
Figure 5 shows graphs representing the estimated weight per output bin of the fruit harvested in the three swaths.
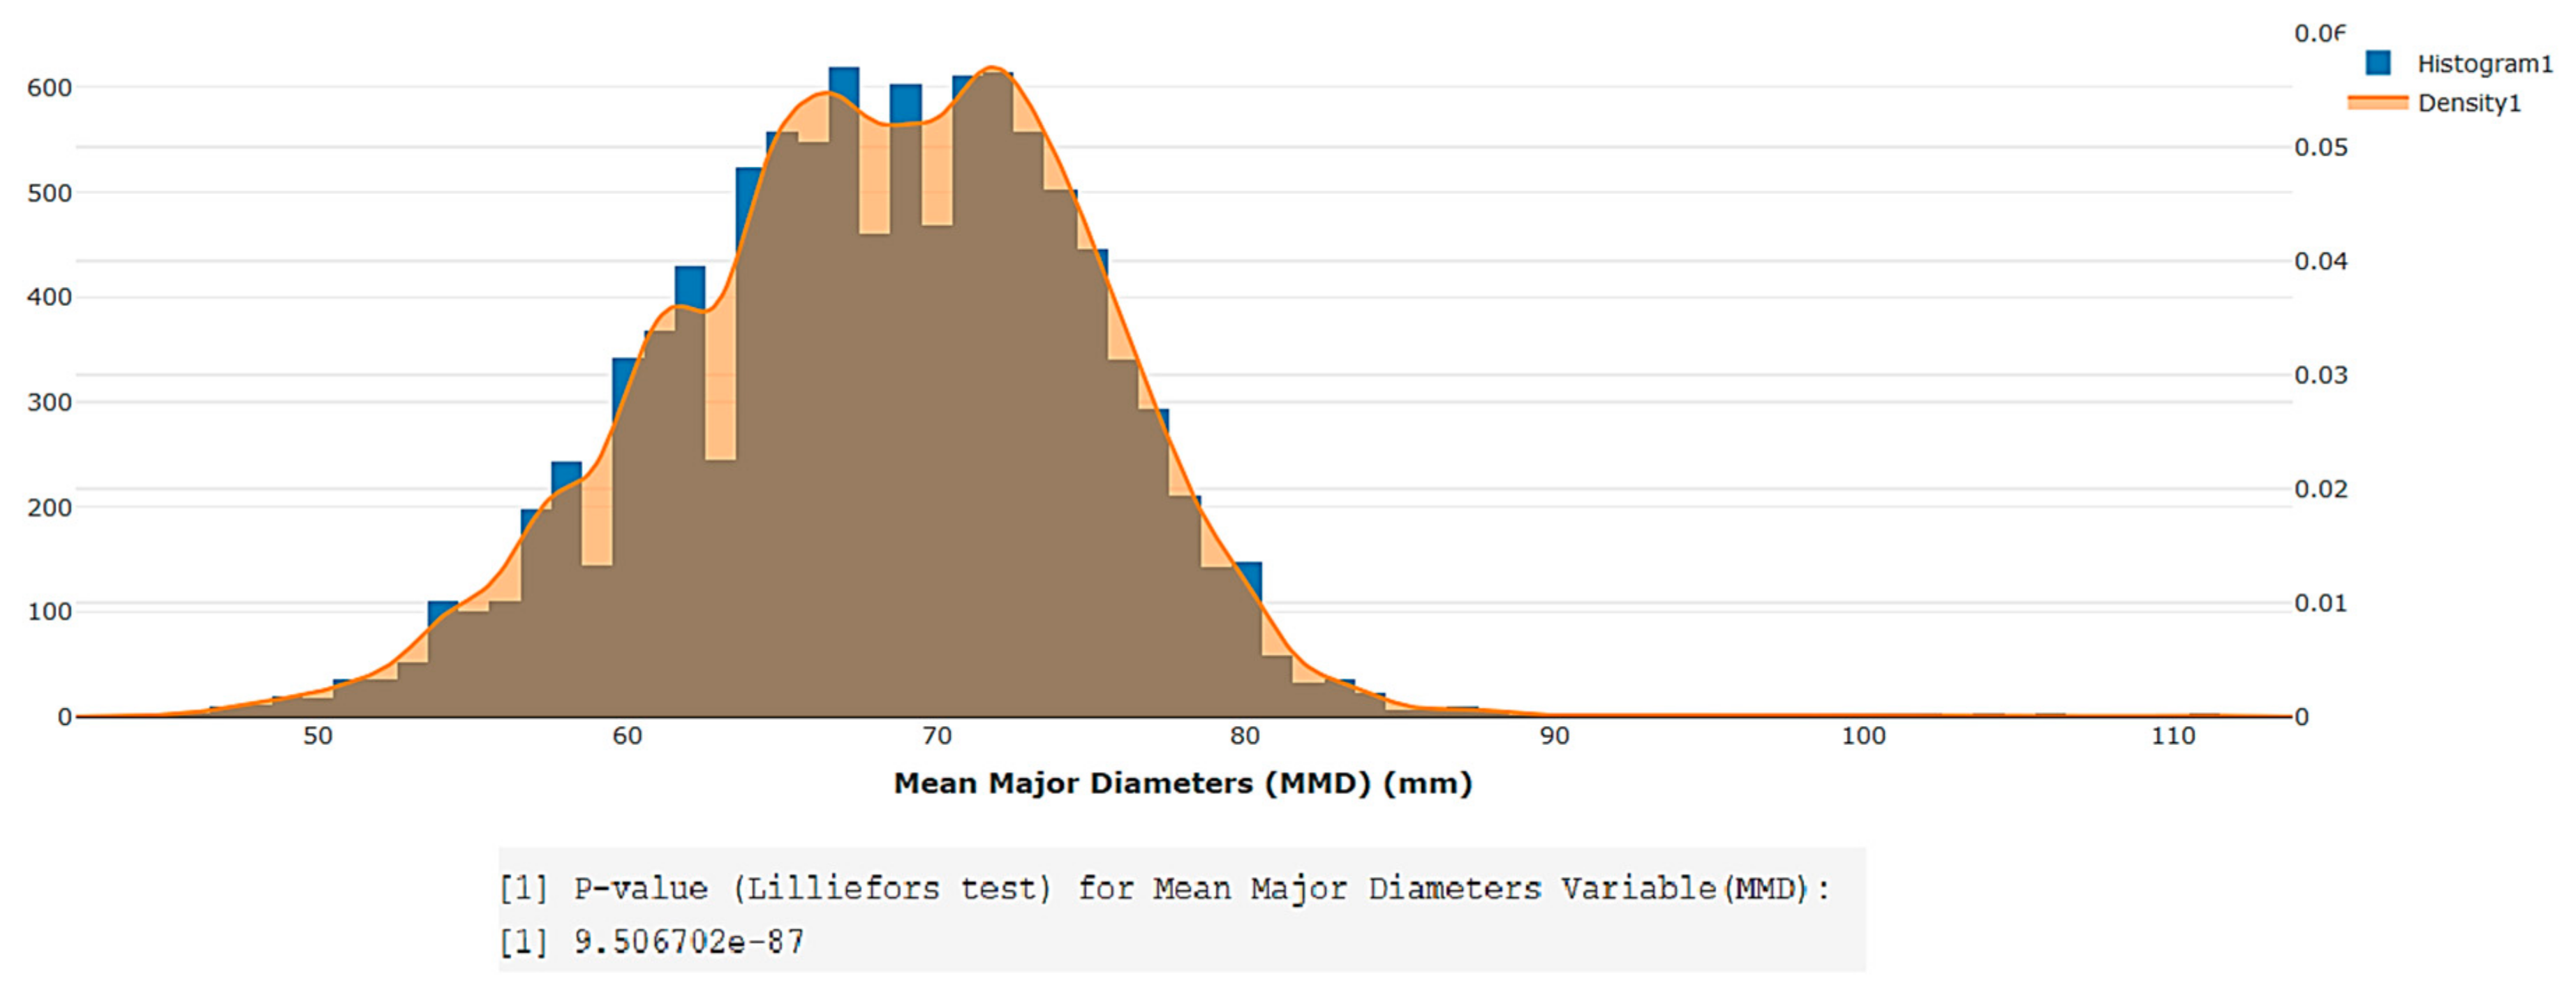
A Kolmogorov–Smirnov test with Lilliefors correction was also programmed in order to conduct analyses of data normality (it was assumed that the mean and variance were unknown in order to make the result more robust) since the size of the dataset acquired during the use of this citrus harvest-assist prototype in the field was always greater than 50 units. This feature is very useful for comparative statistical analyses between different harvesting campaigns. An example histogram with a density curve is shown in
Figure 6, which was created using the plotly package for R.
3. Results
The yield and fruit quality maps were generated automatically by CitrusYield. The maps showed an irregular spacing within the plot that matched the variable characteristics of the varieties and production of the experimental plot. In
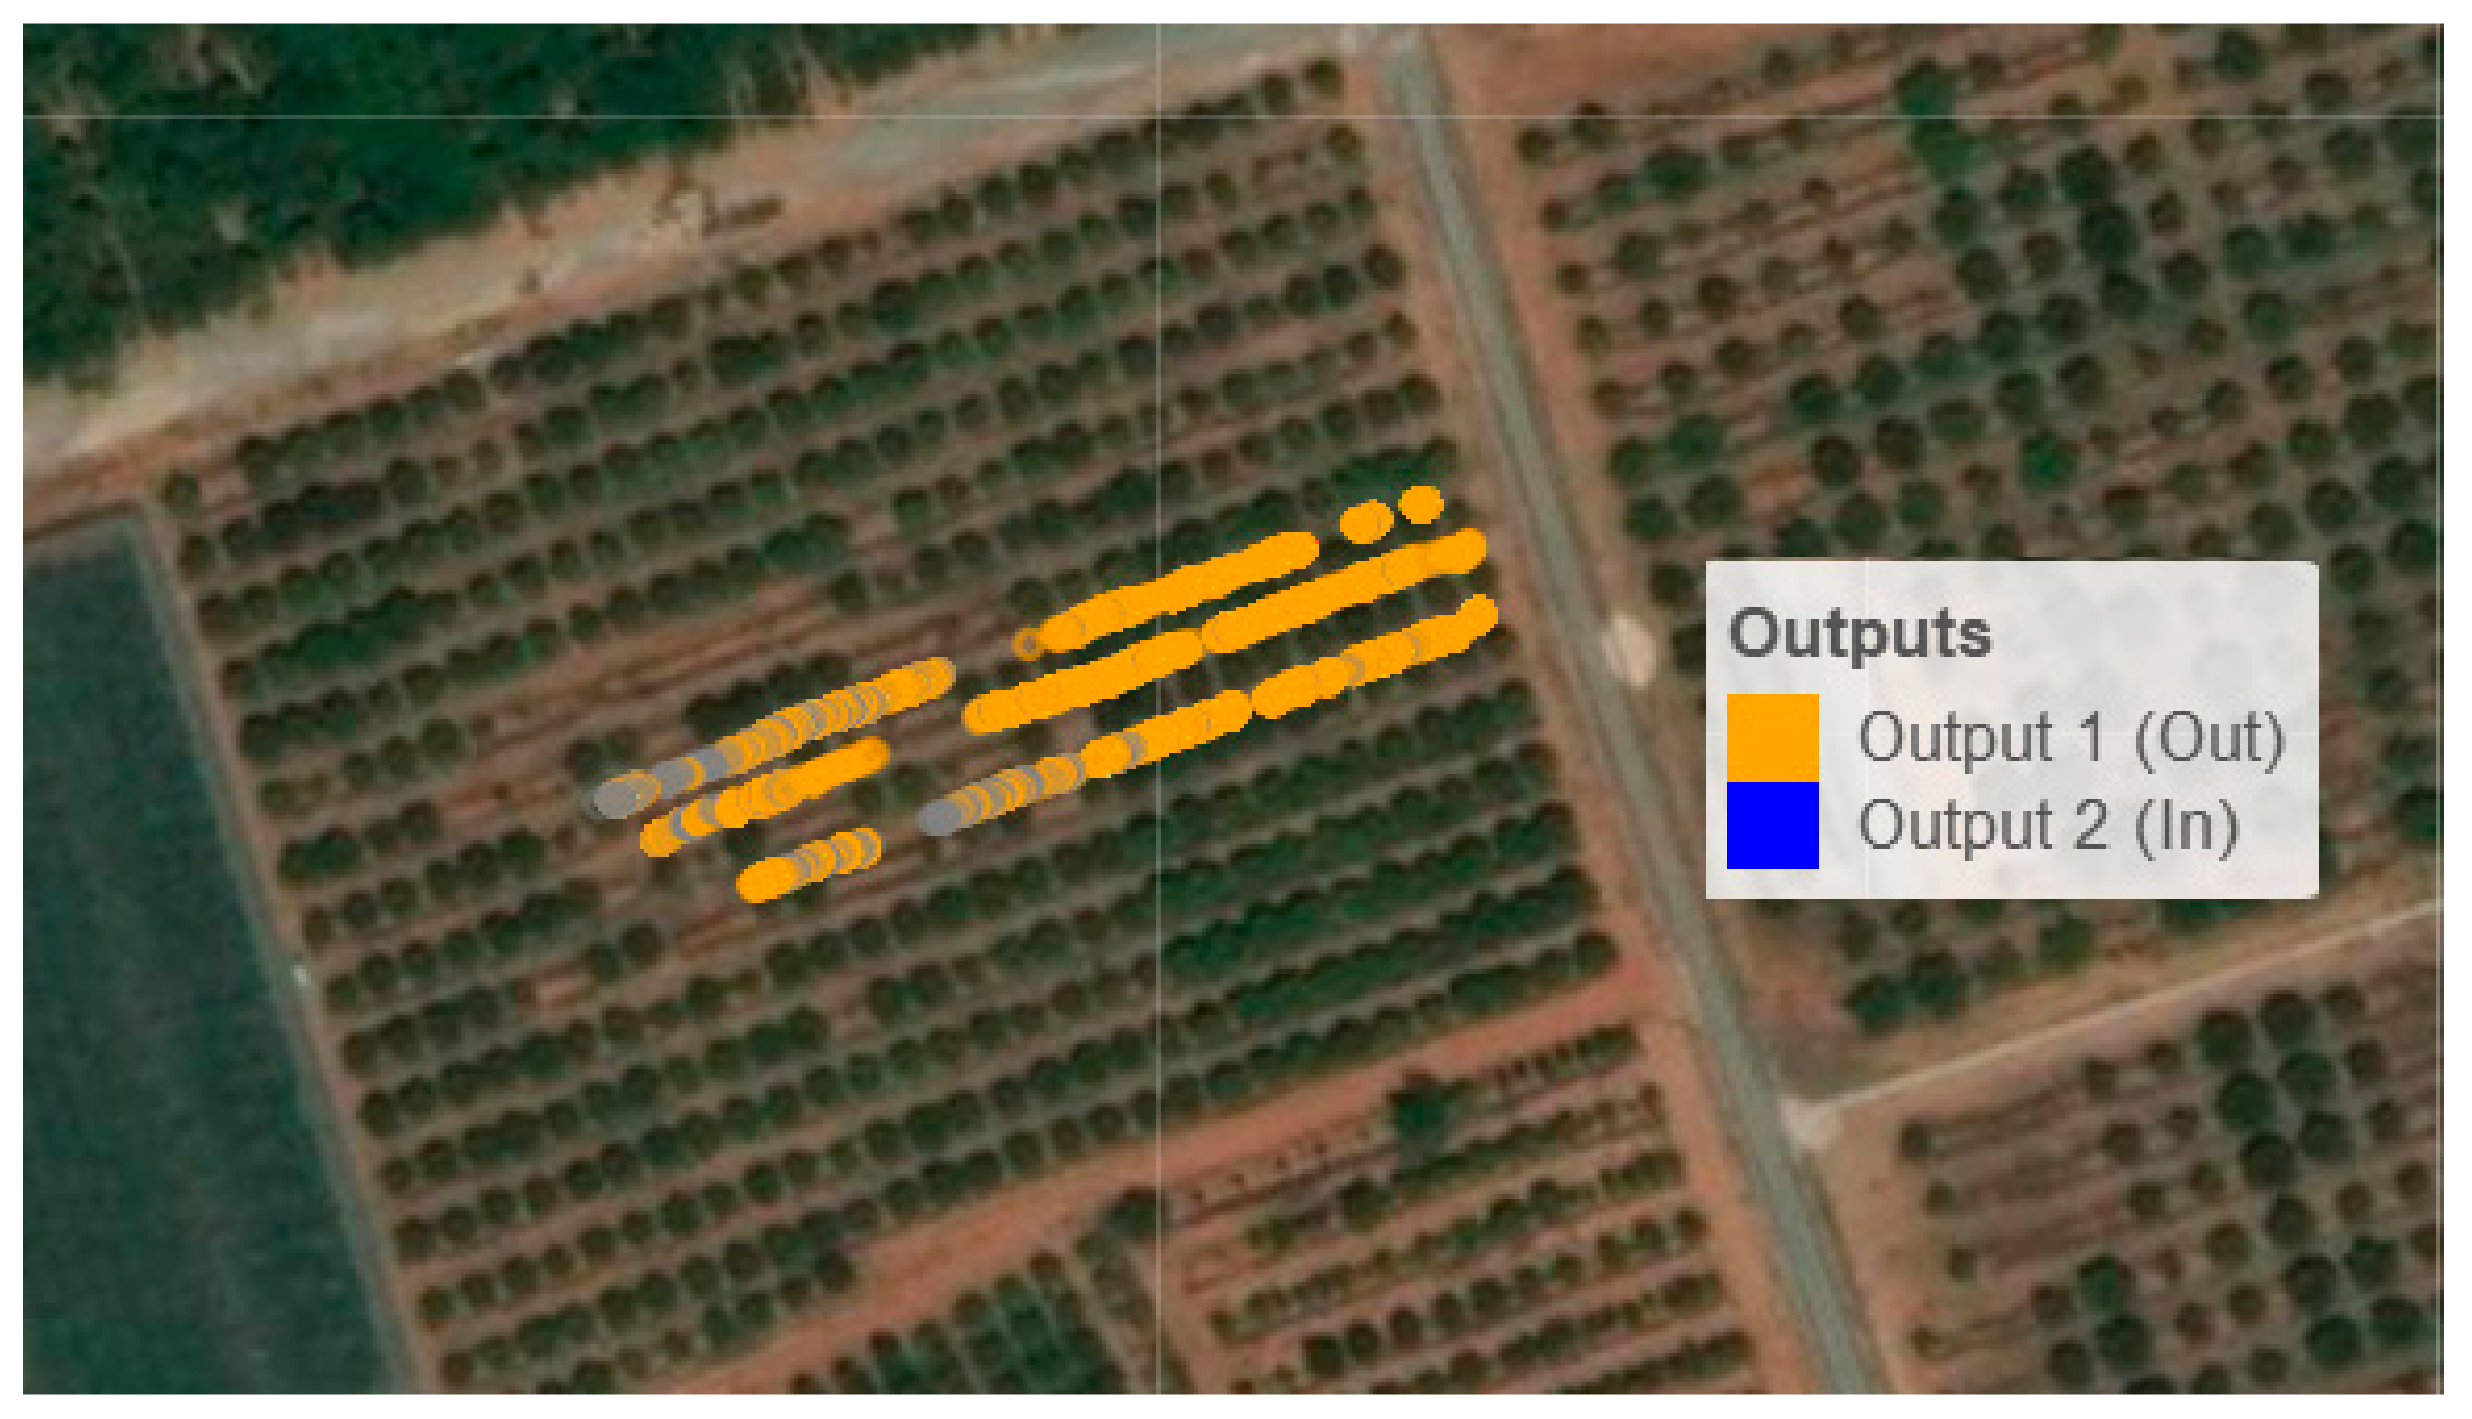
Figure 7, the fruit on the map was georeferenced according to the two factors of the ‘output bin’ variable. This map was called Output Map. Here, a predominant orange colour is observed, which indicates that most of the fruits were deposited in output bin 1, that is to say, they were fruits of sufficient size for the fresh market. In
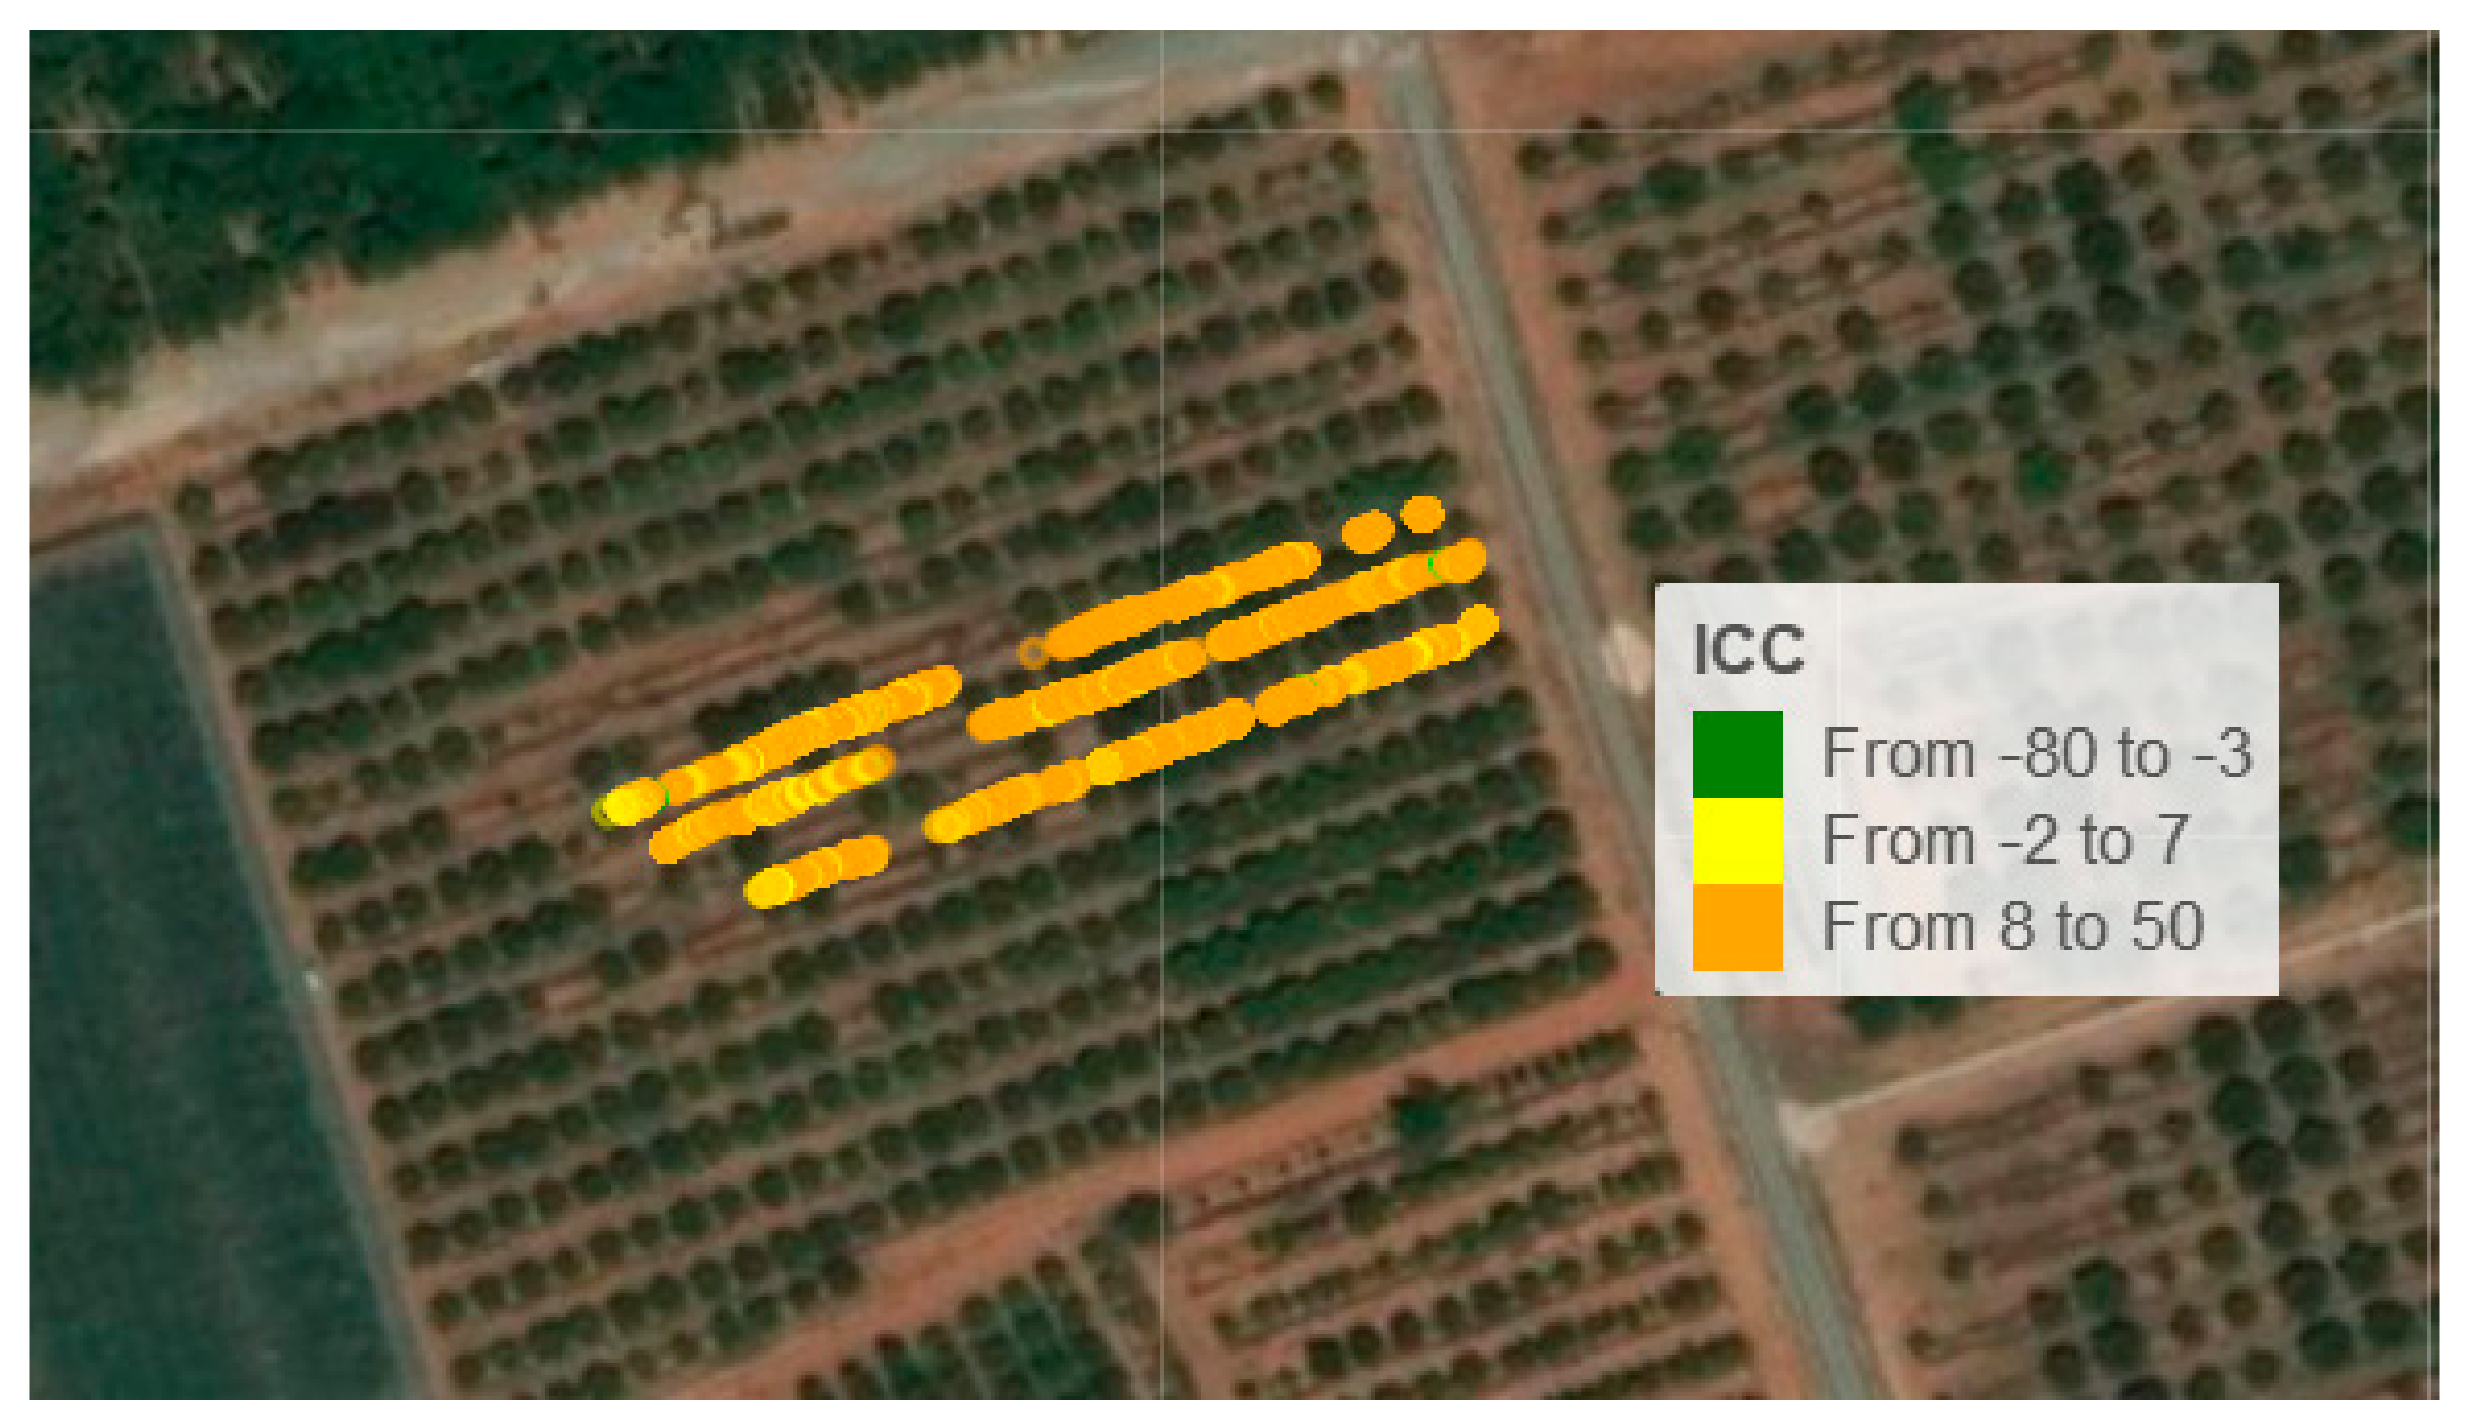
Figure 8, the fruit was georeferenced according to three ranges according to the ‘colour index’ variable. This map was called Colour Map. In this map, as expected, it was observed that most of the fruit had a CCI higher than 8, so that none of the fruit needed any subsequent degreening treatment. In
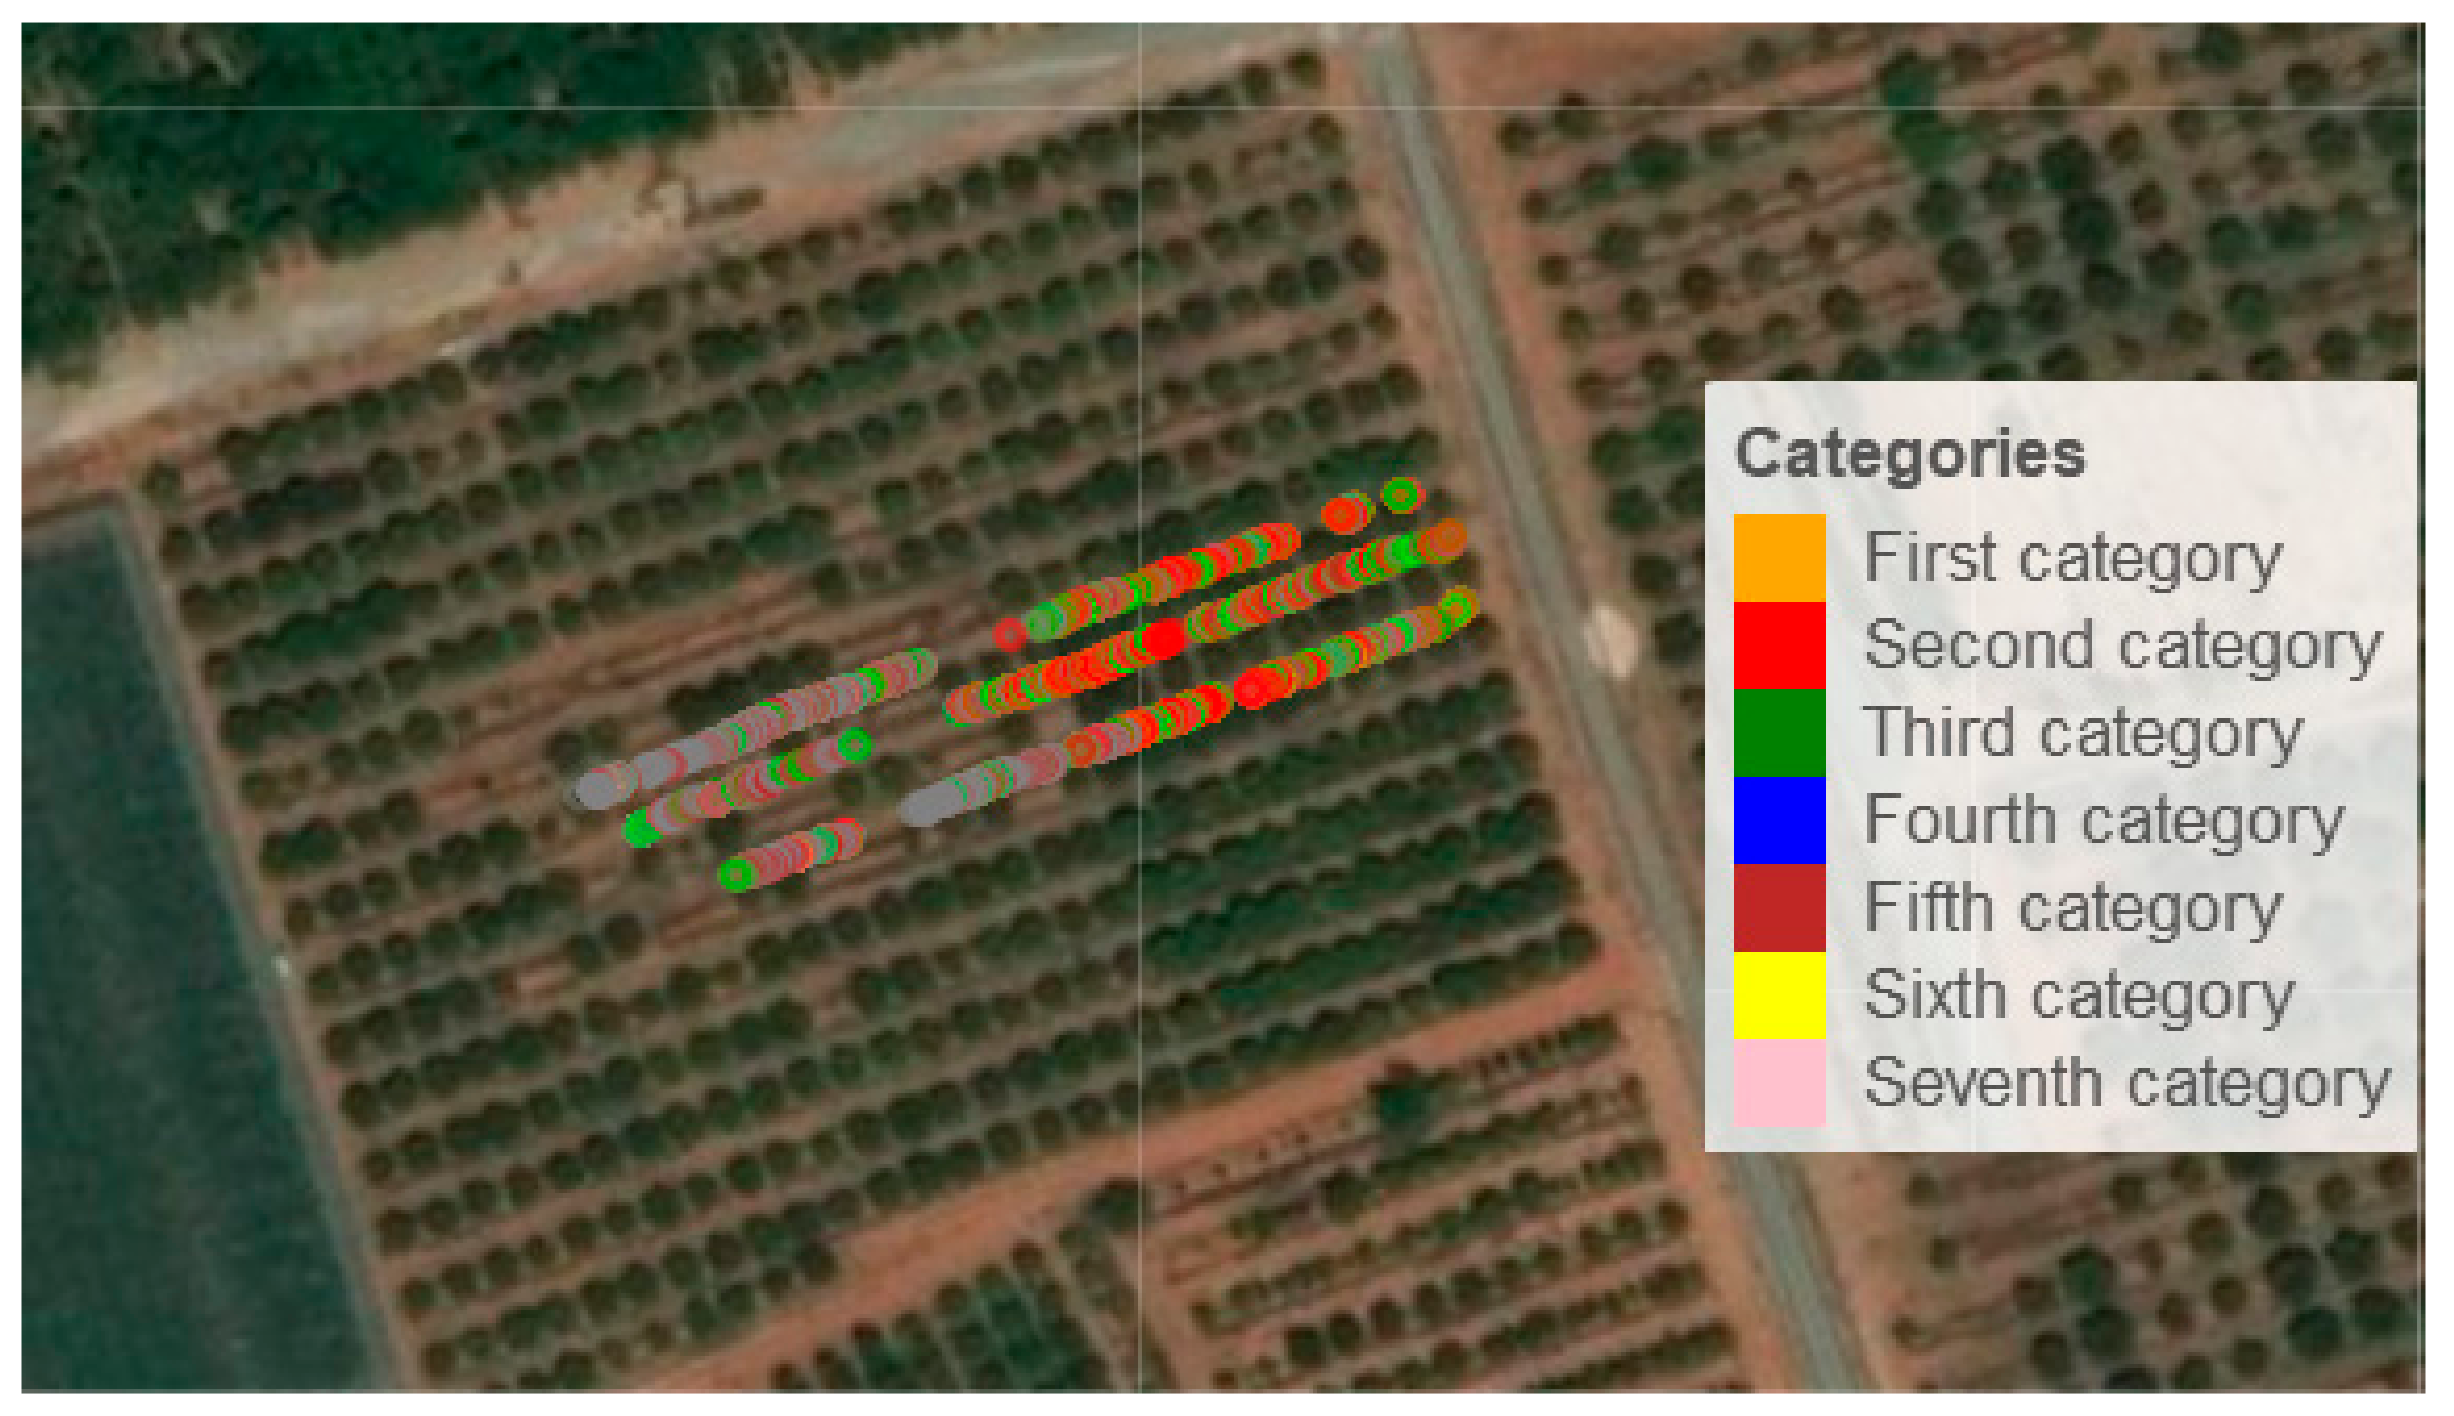
Figure 9, georeferencing was performed on the map according to the seven categories defined for the ‘diameter’ variable. This map was called Calibre Map. This map shows that most of the oranges had a size between the second and fifth categories.
Descriptive information was also provided along with the maps. For instance,
Figure 10 shows the stacked bar diagram associated with the ‘output bin’ variable, where the dashboard presents the information associated with the maps in a more visual manner. It can be seen here that the percentage of fruits classified in output bin 2 for swath 3 (7.64%) was higher than for the rest of the swaths. From
Figure 7, it can be deduced from the orange colour of the dots and their intensity that the largest amount of fruit harvested for output bin 1 was in the first half of the third swath, while all the harvested fruit with lower quality was located in the second half of the swath, which may indicate that there was some problem with the crop in that area. Comparing this with the harvesting scheme in
Figure 2, it can be seen that this area was the one with the largest number of trees with harvested fruits and, hence, the information shown in the dashboard allowed us to deduce that the relatively smaller size of these oranges in the final section of the third swath depended on factors affecting that specific area, such as irrigation, nutrients, state of the soil, etc.
Hence, the information provided allows the farmer to know detailed information about the production for each swath and plot. Those areas where production is deficient can be located so that the farmer can find out in the location in the field and fix the problems that affect production in that area.
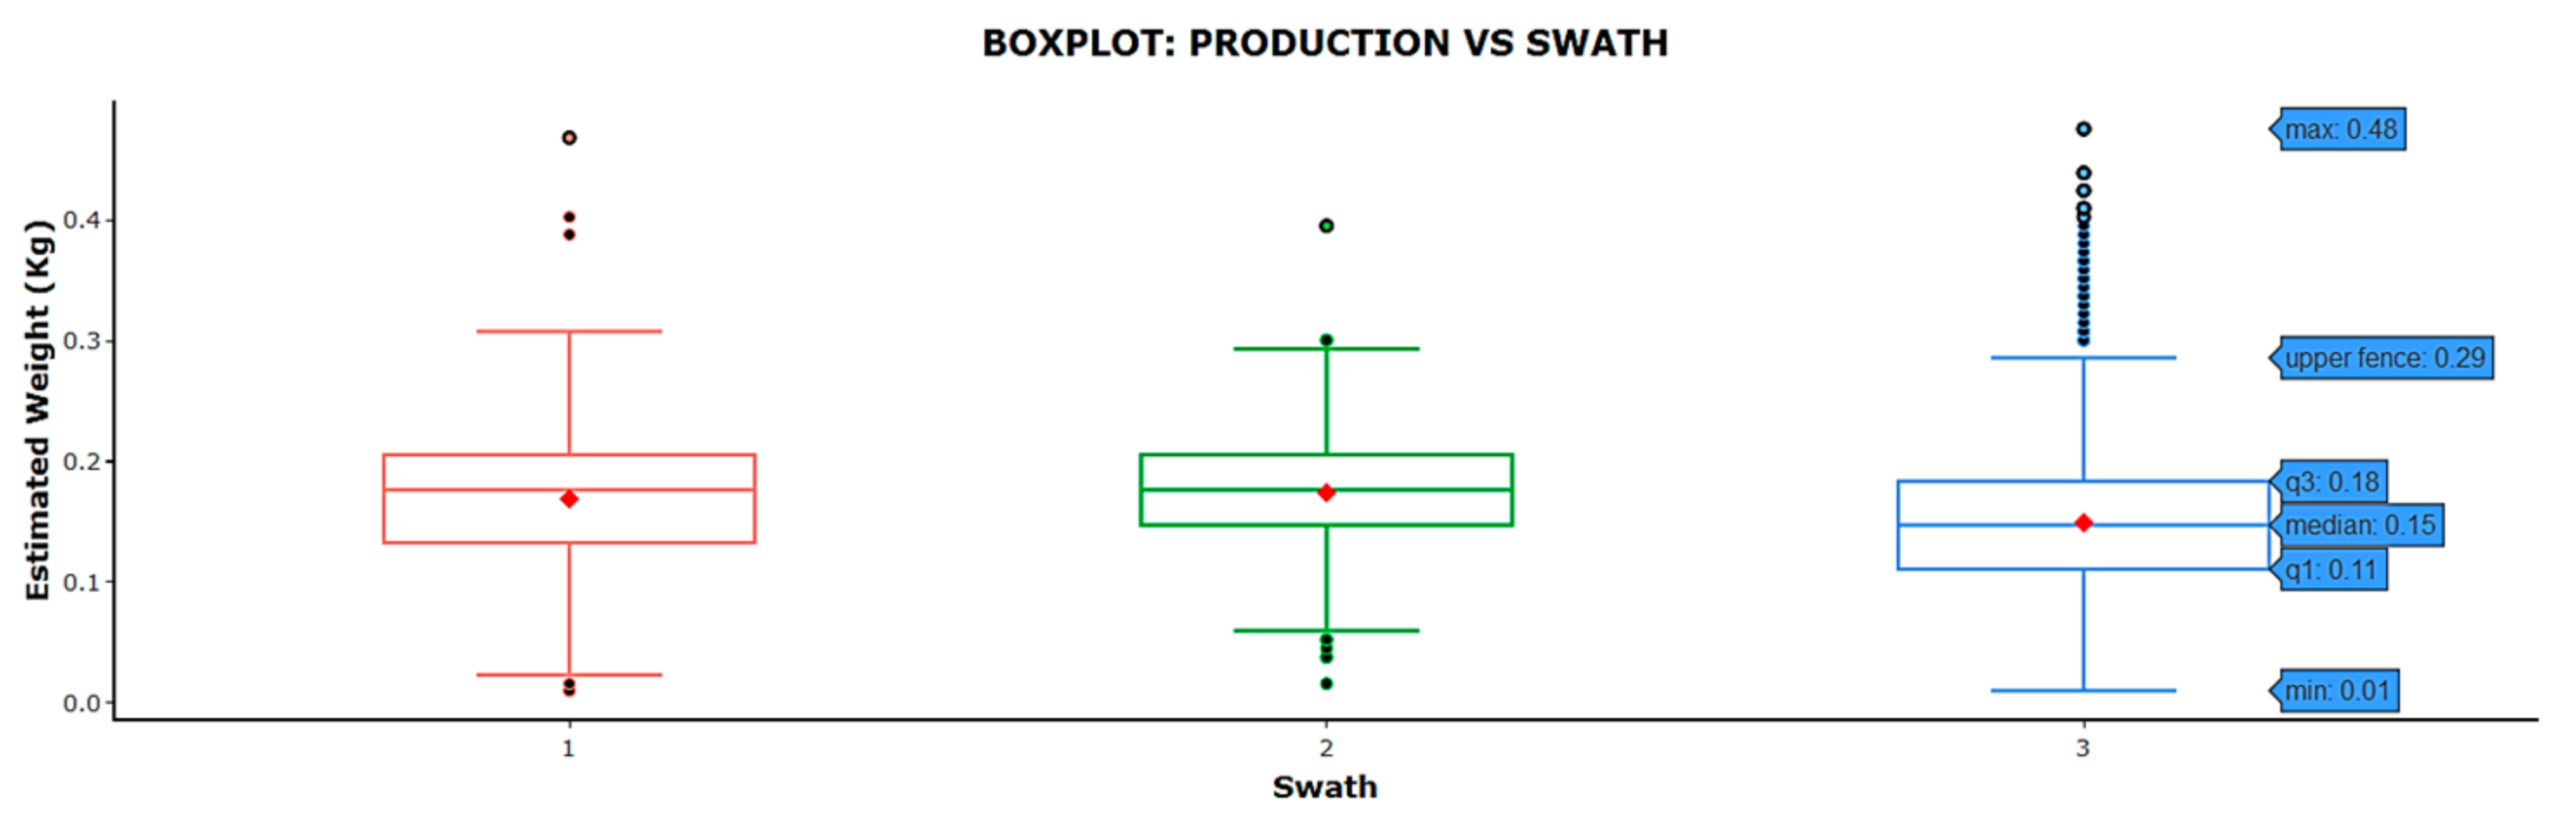
Other useful information that was generated was the variability of the data obtained for each swath with respect to the ‘estimated weight’ variable (
Figure 11). Swath 3 had a greater number of fruits harvested with lower weights, which was reflected in the graph where the median (0.15 kg) and the mean (0.1492 kg) were the lowest of the three. The high number of atypical data from 0.29 kg onwards in swath 3 indicated that there was a clear difference in production in that swath, which corroborated what has been outlined above. Through this information, the farmer can take into account the differences in production among the different swaths for further crop handling.
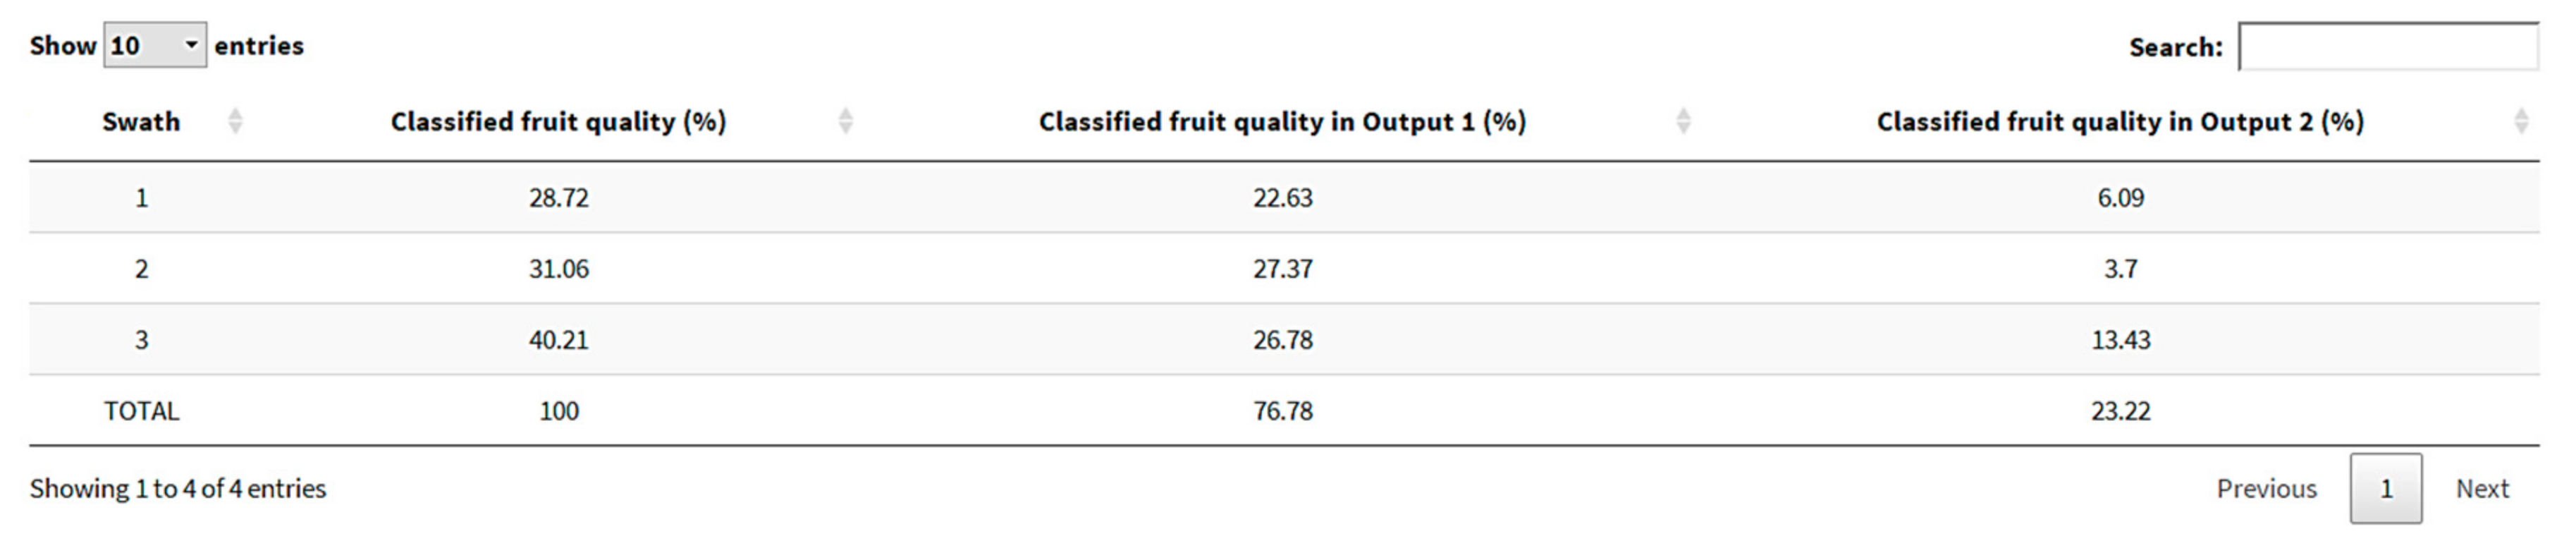
The quality indicators of the classified fruit are shown in tables (
Figure 12). In all, 76.78% of the harvested oranges were deposited in output bin 1, which indicated that more than three quarters of the harvested produce had that quality and that there were differences between swaths as the third swath had the highest percentage of oranges deposited in output bin 2 (13.43%).
Other important information provided was related to the performance of the harvesting (productivity) and inspection process.
Figure 13 shows a table generated by CitrusYield that reflects the performance of the vision system. The field experience showed an average performance lower than 17% for each of the swaths, with an overall mean of 13.8%. This means that the fruit was harvested very slowly and that the computer vision system was working well below its capacity. In the case of the tests carried out, this result was expected due to the low number of day labourers who carried out the harvesting. A low value indicates to the farmer that there is potential for improvement in the harvesting process.
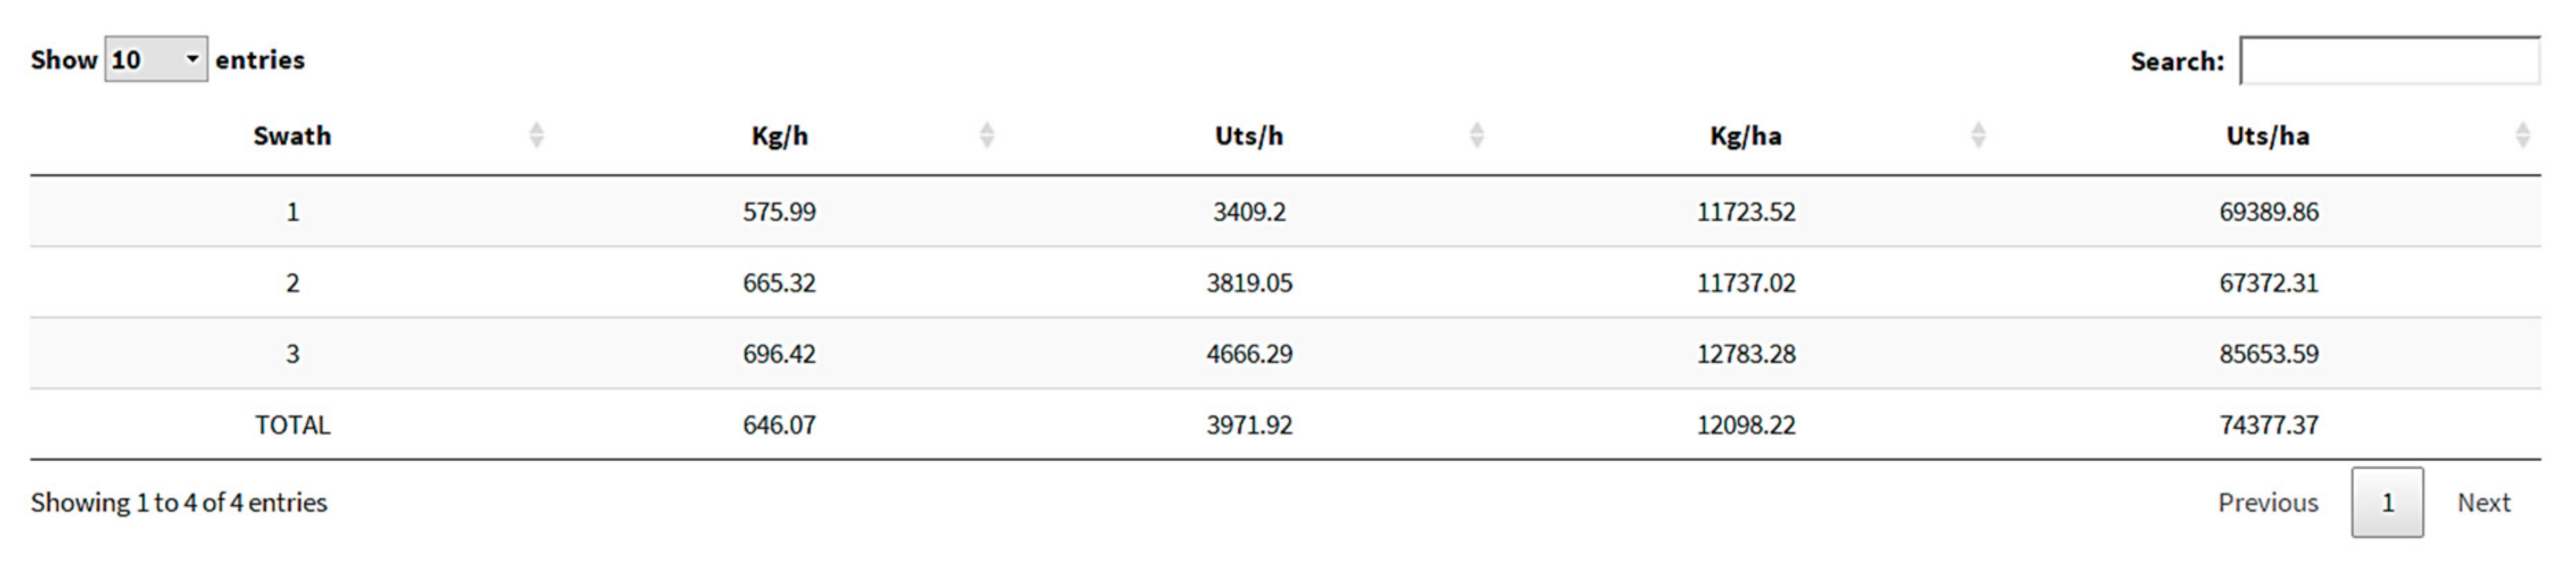
The productivity indicators obtained are shown in
Figure 14. The results showed that the swath with the highest number of harvested oranges per hour of operation was the third (696.42 kg h
−1). The data offer an estimation of the performance per ha and also reflect and allow the user to make an estimation of the quality of the fruit in each swath when the ratio between units and kg is calculated. In this way, the farmer can know the exact degree of effectiveness and efficiency of the harvesting process.
4. Discussion
From an overall perspective, the use of CitrusYield facilitates the access to useful information about the farm operation to the farmer. CitrusYield presents a number of advantages and novelties with respect to previous similar works or applications. For instance, the main differences between the maps created by Schueller et al. [
6] or Molin et al. [
7] and those generated automatically by CitrusYield are the way to obtain the information in the field and the automation of the processing of the data collected. The use of the harvest-assist machines with sensors allows the extraction of fruit quality parameters during the harvest process and, with the use of this dashboard, the useful information is automatically obtained without the need of computer skills. Unlike the rest of the commercial and non-commercial GIS software, CitrusYield has the ability to calculate production, classify fruits by categories in terms of their quality, georeference the categorised information in maps and perform statistical analyses automatically for each swath and for the orchard, showing the data using statistical graphs. This facilitates intra-crop and different season comparisons. The main advantage of knowing the differences in production between the swaths and areas inside the crop is to provide the grower with information to make accurate decisions for localised crop handling.
The Crop Auditor program, for instance, does not make it possible to know how much of the fruit meets the requirements for fresh consumption, as the production is not classified during harvesting. Neither does this program carry out georeferencing on orographic maps, which makes it difficult for the farmer to visualise the information captured graphically on the map, nor does it perform a statistical analysis of the data to find differences in the production of the different boxes or areas of the plot. In contrast, CitrusYield has been proved to be a relevant tool in industry 4.0 for (1) representing the spatial distribution of citrus in each swath, (2) automating the development of maps and calculating the production and quality of the fruits, (3) performing the exploratory data analysis to detect differences and anomalies, and (4) also for calculating yields in the plot of interest. This dashboard can process, analyse and visualise information in an intuitive and easily manageable setting. This automation process is effective and practical for the immediate study of the spatial variability in production and quality in a field. It also provides accurate information, analyses data and creates maps, tables and graphs of spatial yield, which will increase the efficiency of field management and traceability of the fruit. As a consequence, it can contribute to a more precise management of other tasks, such as fertilisation, irrigation, pest and disease control, etc. This work has been carried out and tested on citrus, but the tool developed is easily configurable to collect and process diverse data from other different crops.

 ,
, 


