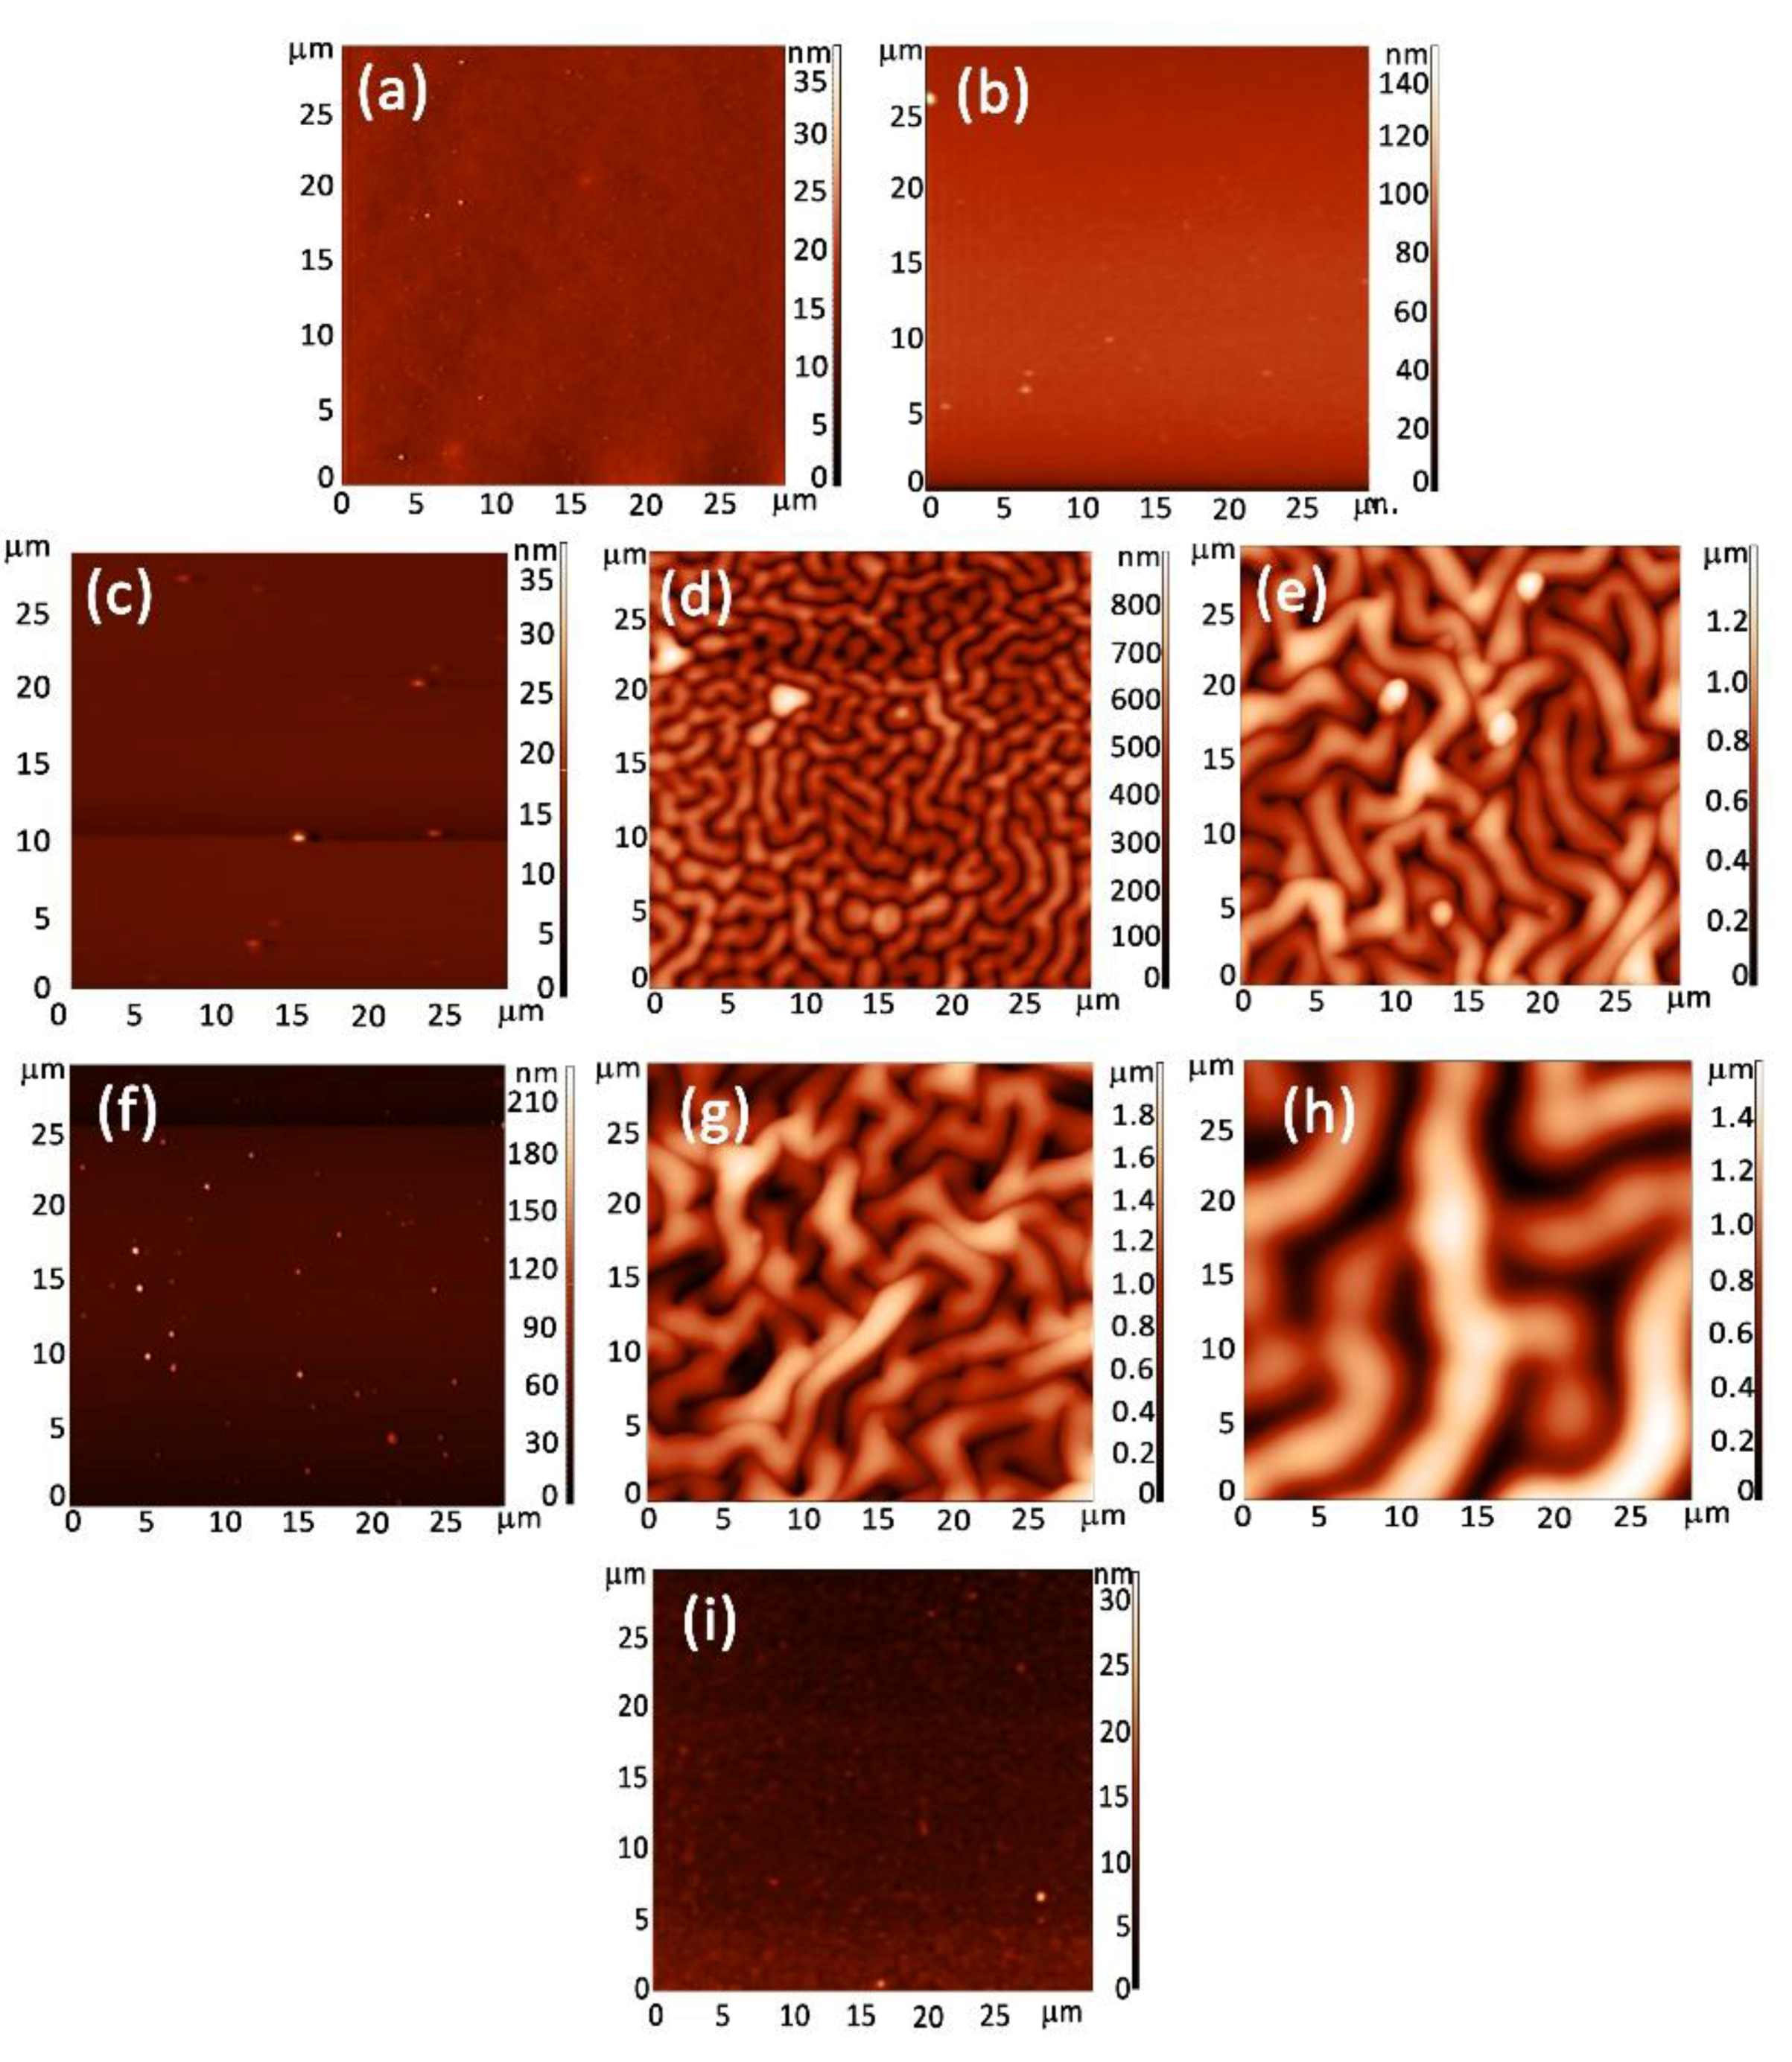
3.1. AFM Analysis
Atomic force microscopy allowed the investigation of the morphological surface features of PANI and POA layers deposited on Si optically-polished surfaces, as a function of the experimental deposition conditions presented above in
Table 1. The polymeric layers have been obtained at a pressure of about 5 × 10
−2 torr inside the vacuum chamber.
In
Figure 2 and
Figure 3 are presented the 2D and 3D images of the PANI and POA layers. The PANI layers form worm-like interlinked structures that change their characteristics as a function of the experimental deposition conditions (
Table 1). In
Figure 2a,b it can be observed that, for PANI 1 and PANI 2 layers, an increase in the substrate inclination angle to the anode does not affect the surface morphology. By increasing the monomer injection temperature up to 50 °C and the substrate inclination angle to the anode up to 90°, (
Figure 2c–e), it can be observed that worm like interlinked structures begin to form. The maximum dimension of a worm-like structure is about 1.8 μm for a 90° inclination angle.
As the experimental conditions for the polymeric layers pattering were established, the role of the anode substrate distance was investigated.
The role of the anode substrate distance on the polymeric layers networking, (
Figure 2f–h) was studied and it was observed that by decreasing from 10 to 5 cm, for an inclination angle of 90° and 50 °C monomer injection temperature, the dimension of the worm-like structures attain a value of about 5 μm.
The analysis of the AFM images of the poly(
o-anisidine) layers indicate that no kind of structures form on their surfaces even when the substrate inclination angle to the anode and the monomer injection temperature were varied. In
Figure 2i an AFM image of a POA layer is presented, obtained for the experimental conditions mentioned in
Table 1.
Recently [
10], it was shown that polyaniline synthesized in emeraldine salt formed in strong acidic medium present a wrinkled structures on their surfaces. These structures are similar with those presented in
Figure 2.
Thus, we assume that the DC glow discharge ignited in the vapors of the aniline monomers can act as a strong oxidizing medium for the polymerization of aniline.
In the polymerization process of aniline, the oxidation of monomers takes place due to oxidizing agents and, consecutively, the generated aniline cation radicals initiate the process. The nitrogen atoms usually act as oxidation centers [
11].
In comparison, the free electrons of the DC glow discharge which interact with the monomer vapors produce fragmentation of the monomer. The most probable reactions inside the plasma are the detaching of the hydrogen atoms by fragmentation of N–H/C–H molecules and oxidation of Nitrogen atoms. These fragments consisting in cations, anions, and reactive species that reach the substrate holder can initiate the chain polymerization process. The recombination of the cation radicals or the electrophilic substitution (oxidizing nitrogen-containing structure attacks the phenyl ring of an aniline molecule and substitutes one proton of the ring) can promote the polymeric chain growth. During the chain growth polymerization, the monomer units are continuously added to the polymer chain bearing active end groups. The chain growth implies a continuous oxidation/reduction of the polymer chain during the glow discharge.
The increase of the monomer injection temperature up to 50 °C, of the holder inclination angle to the anode up to 90° and the decrease of the anode-holder distance to 5 cm (
Table 1) support the generation of an increased amount of oxidizing agents on the substrate holder which enhanced polymer chain growth during the DC plasma. In this way, the patterning of the polymer layer surfaces is slightly changed, the dimension of the worm-like structure increasing (
Figure 2). Thus, it can be explained that the formation and the evolution of the worm-like interlinked structure of the PANI layers as a function of deposition plasma conditions.
In the same time, it must be consider that as the substrate holder is at a floating potential, its superficial electrostatic charging and, consecutively, the charge distribution on the polymer growing layer surface during the deposition process assist the worm-like interlinked structure formation and evolution.
Previously, the formation of similar structures due to the building of a charge density on the free surface of a polymeric layer in the initial phase of the polymerization process was reported [
12,
13].
The roughnesses of the PANI and POA layers were calculated from the 2D AFM images presented in
Figure 2 using image processing software. The results are shown in
Table 2.
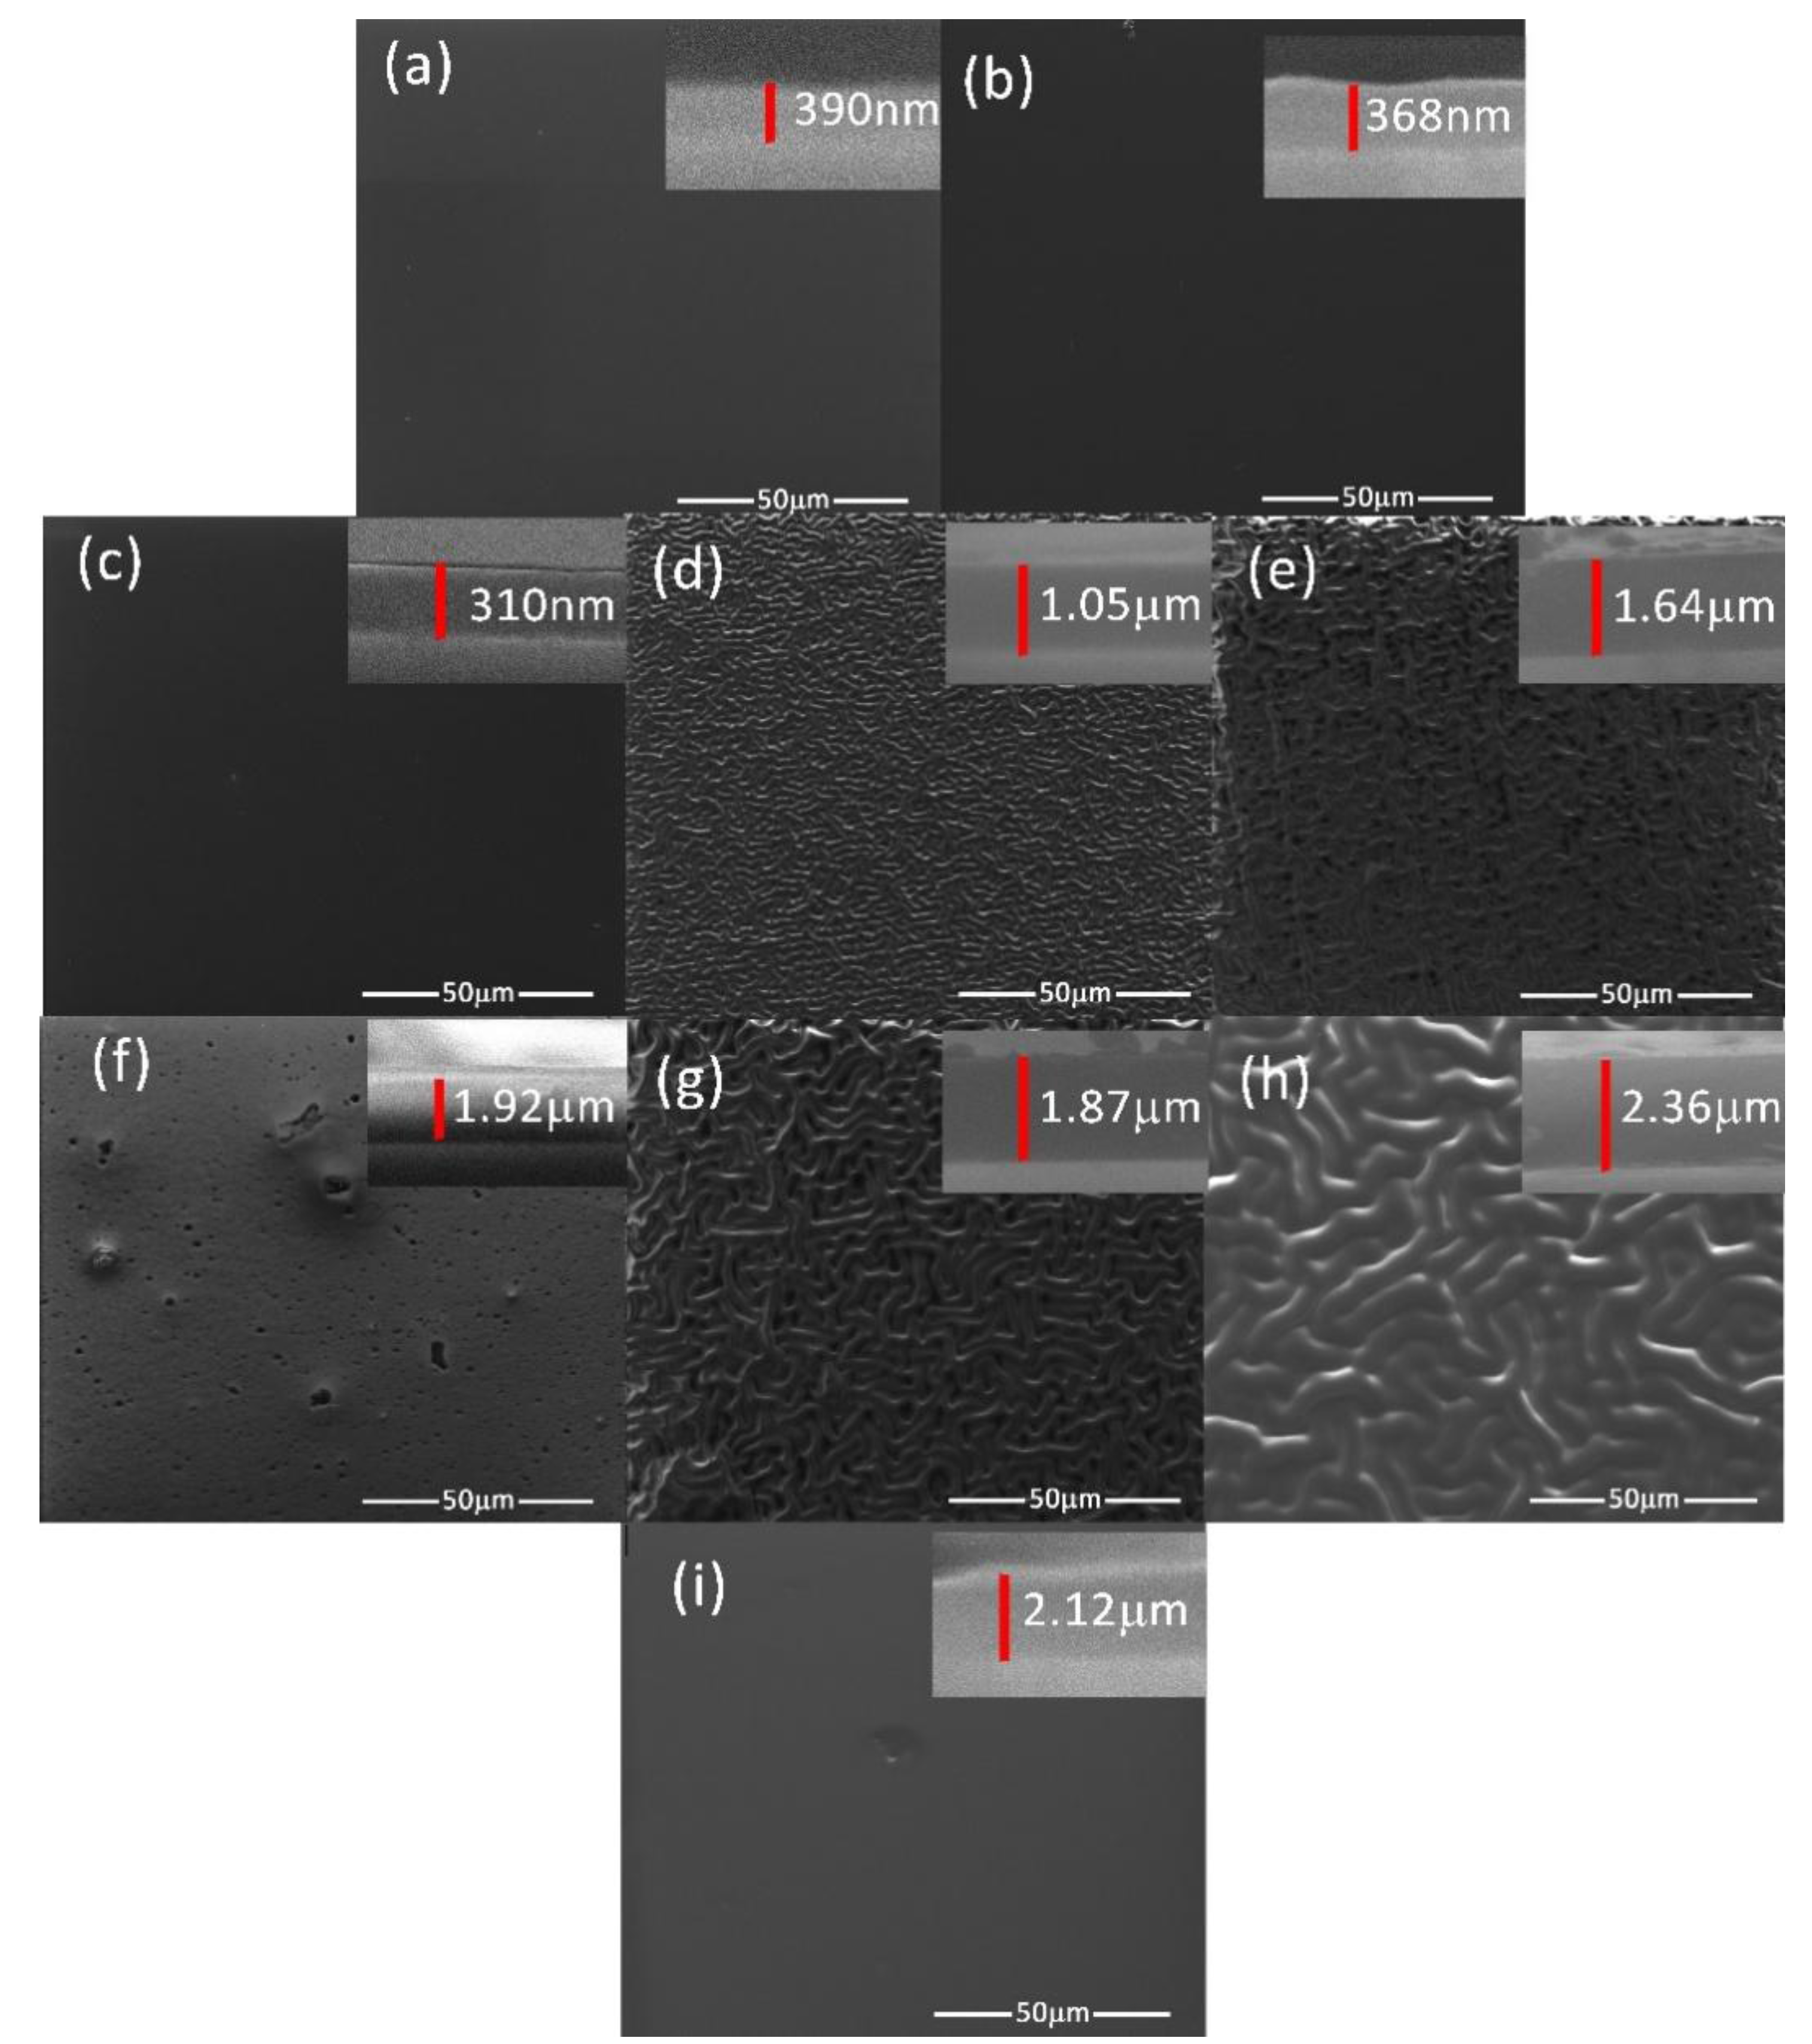
3.2. SEM Analysis
The topology of generated PANI and POA layers on Si substrates with optically-polished surfaces in a DC glow discharge plasma using an oblique angle substrate configuration, in the experimental deposition conditions presented in
Table 1, were analyzed by scanning electron microscopy.
Figure 4a–h presents the SEM images of the PANI polymeric layers and the worm-like structures’ pattering evolution function of the experimental conditions presented in
Table 1. The layers do not present any cracking on their surfaces.
In
Figure 4i it can be observed that the POA layer generated in experimental conditions similar to those used for synthesis of the PANI 8 layer do not present any worm-like interlinked structures on its surface.
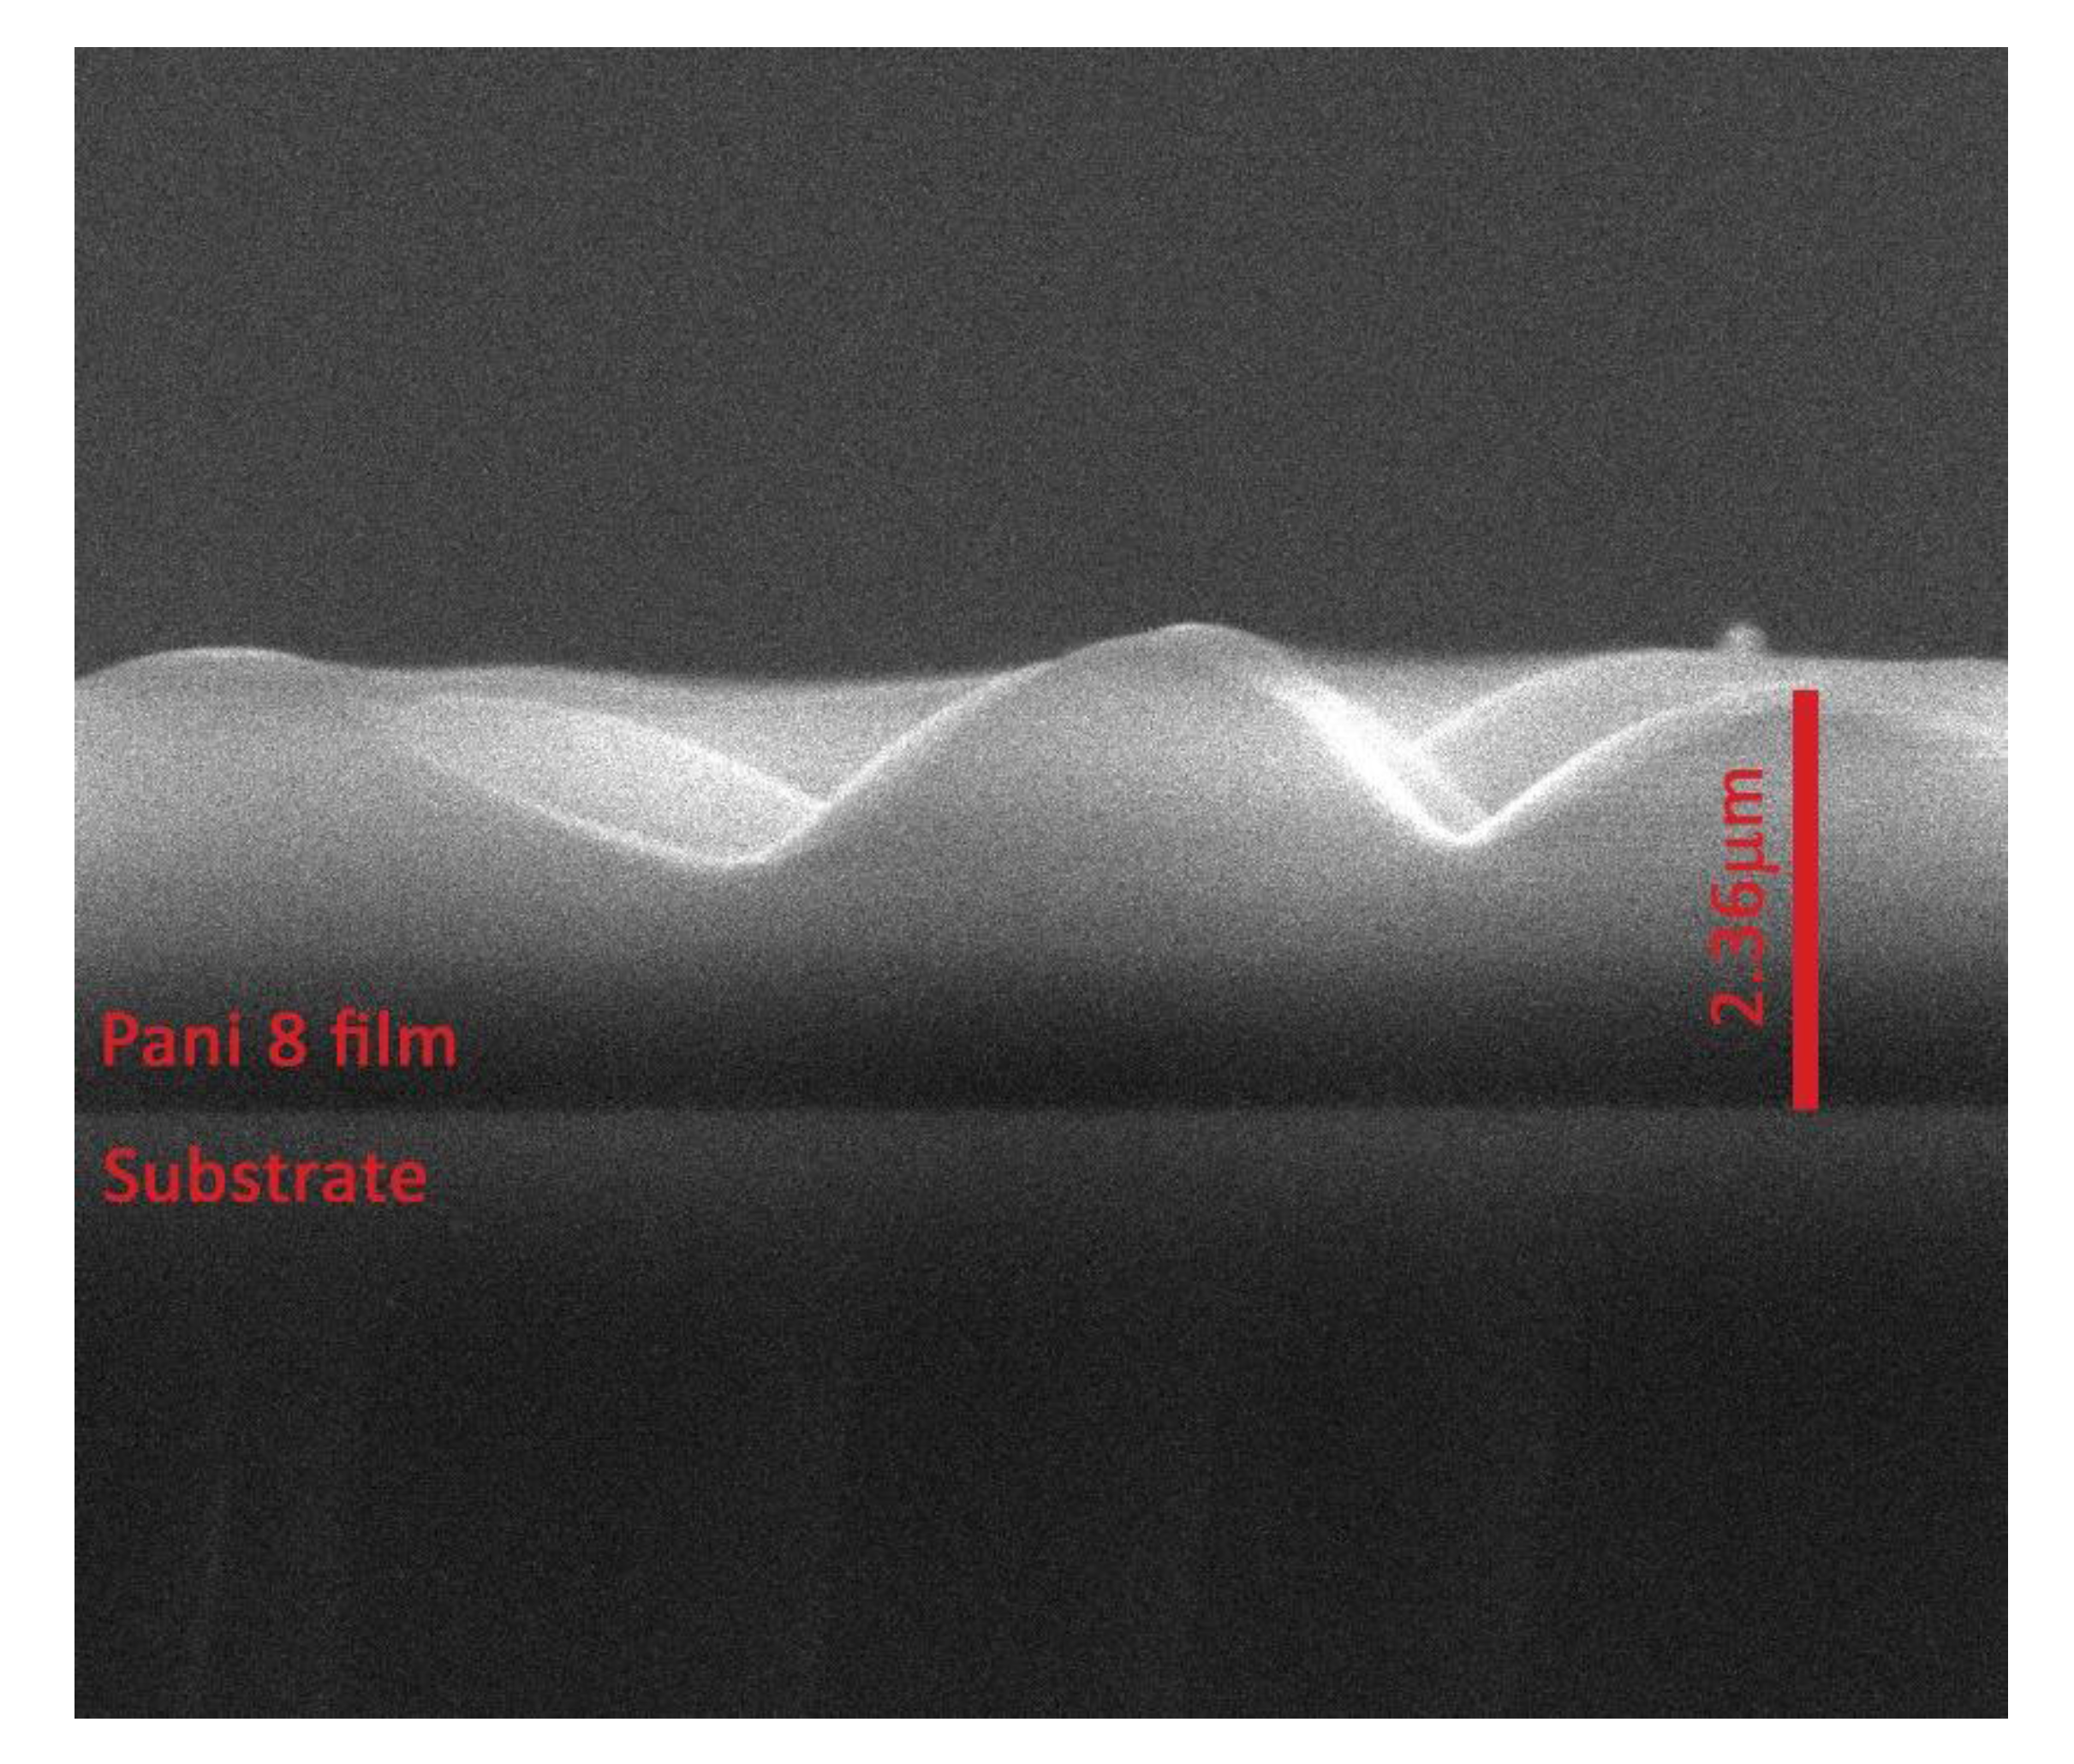
The layer thicknesses were established by analyzing with the SEM technique, the transversal cross section of each polymer (the right corner inset image from
Figure 4). The polymers are compact in their bulks, the worm-like interlinked structures being formed only on the layer surfaces. The sample PANI 1 and PANI 2 generated for a monomer temperature of 20 °C and inclination angles of 0° and 45° (
Table 1) have thicknesses of about 390 and 368 nm and flat surfaces. The increase in the monomer temperature up to 50 °C for an inclination angle of 0° do not affect the structuring of the PANI 3 sample surface, it thickness being of 310 nm. There are no structures on the surface of PANI 6 sample obtained in the deposition condition presented in
Table 1. The increase of the thickness can be due to the increase of the current intensity and to the decrease of the anode-substrate distance.
The deposition conditions (
Table 1) used for the generation of samples PANI 4, 5, 7, and 8 are proper for the pattering of the polymer surfaces, which can be associated to the increase of the layer thicknesses. The thickness of the sample PANI 5 is higher than the one corresponding to PANI 4 (
Figure 4d,e) as the inclination angle of the substrate holder to the anode has been increased from 45° to 90°. The AFM pictures in
Figure 3d,e indicate also the increasing of the dimension of the worm-like structure with the inclination angle.
In comparison with the deposition conditions of PANI 5 sample (
Figure 4e), maintaining the deposition time of 10 min, the inclination angle of the substrate holder to the anode of 90°, and decreasing the anode substrate distance to 5 cm, PANI 7 sample was obtained, with the surface features presented in
Figure 4g. The thickness of the polymeric layer (PANI 8) has further increased up to 2.36 μm (
Figure 4h) as the current intensity was set to 30 mA.
For all the PANI samples, the differences in their pattering were also analyzed by AFM measurements.
A high-resolution SEM image of the transversal cross-section of the PANI 8 sample is presented in
Figure 5. This is an indication of a surface effect that appear during the growing process of the polyaniline layer on Si substrate in a DC glow discharge plasma produced in the absence of a buffer gas, in the vapors of the monomers, using an oblique angle-positioned electrode configuration. Previously [
14,
15], worm-like interlinked structures in plasma polymers volume due to the buckling effect have been reported.
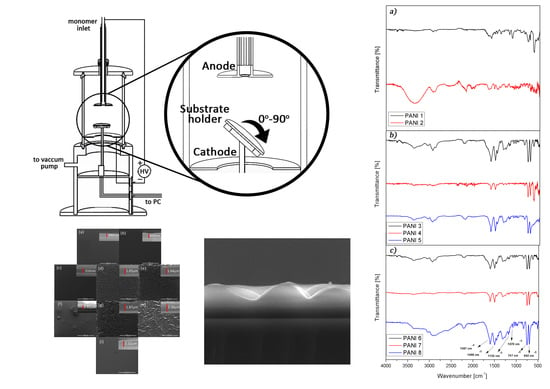
3.3. FTIR Analysis
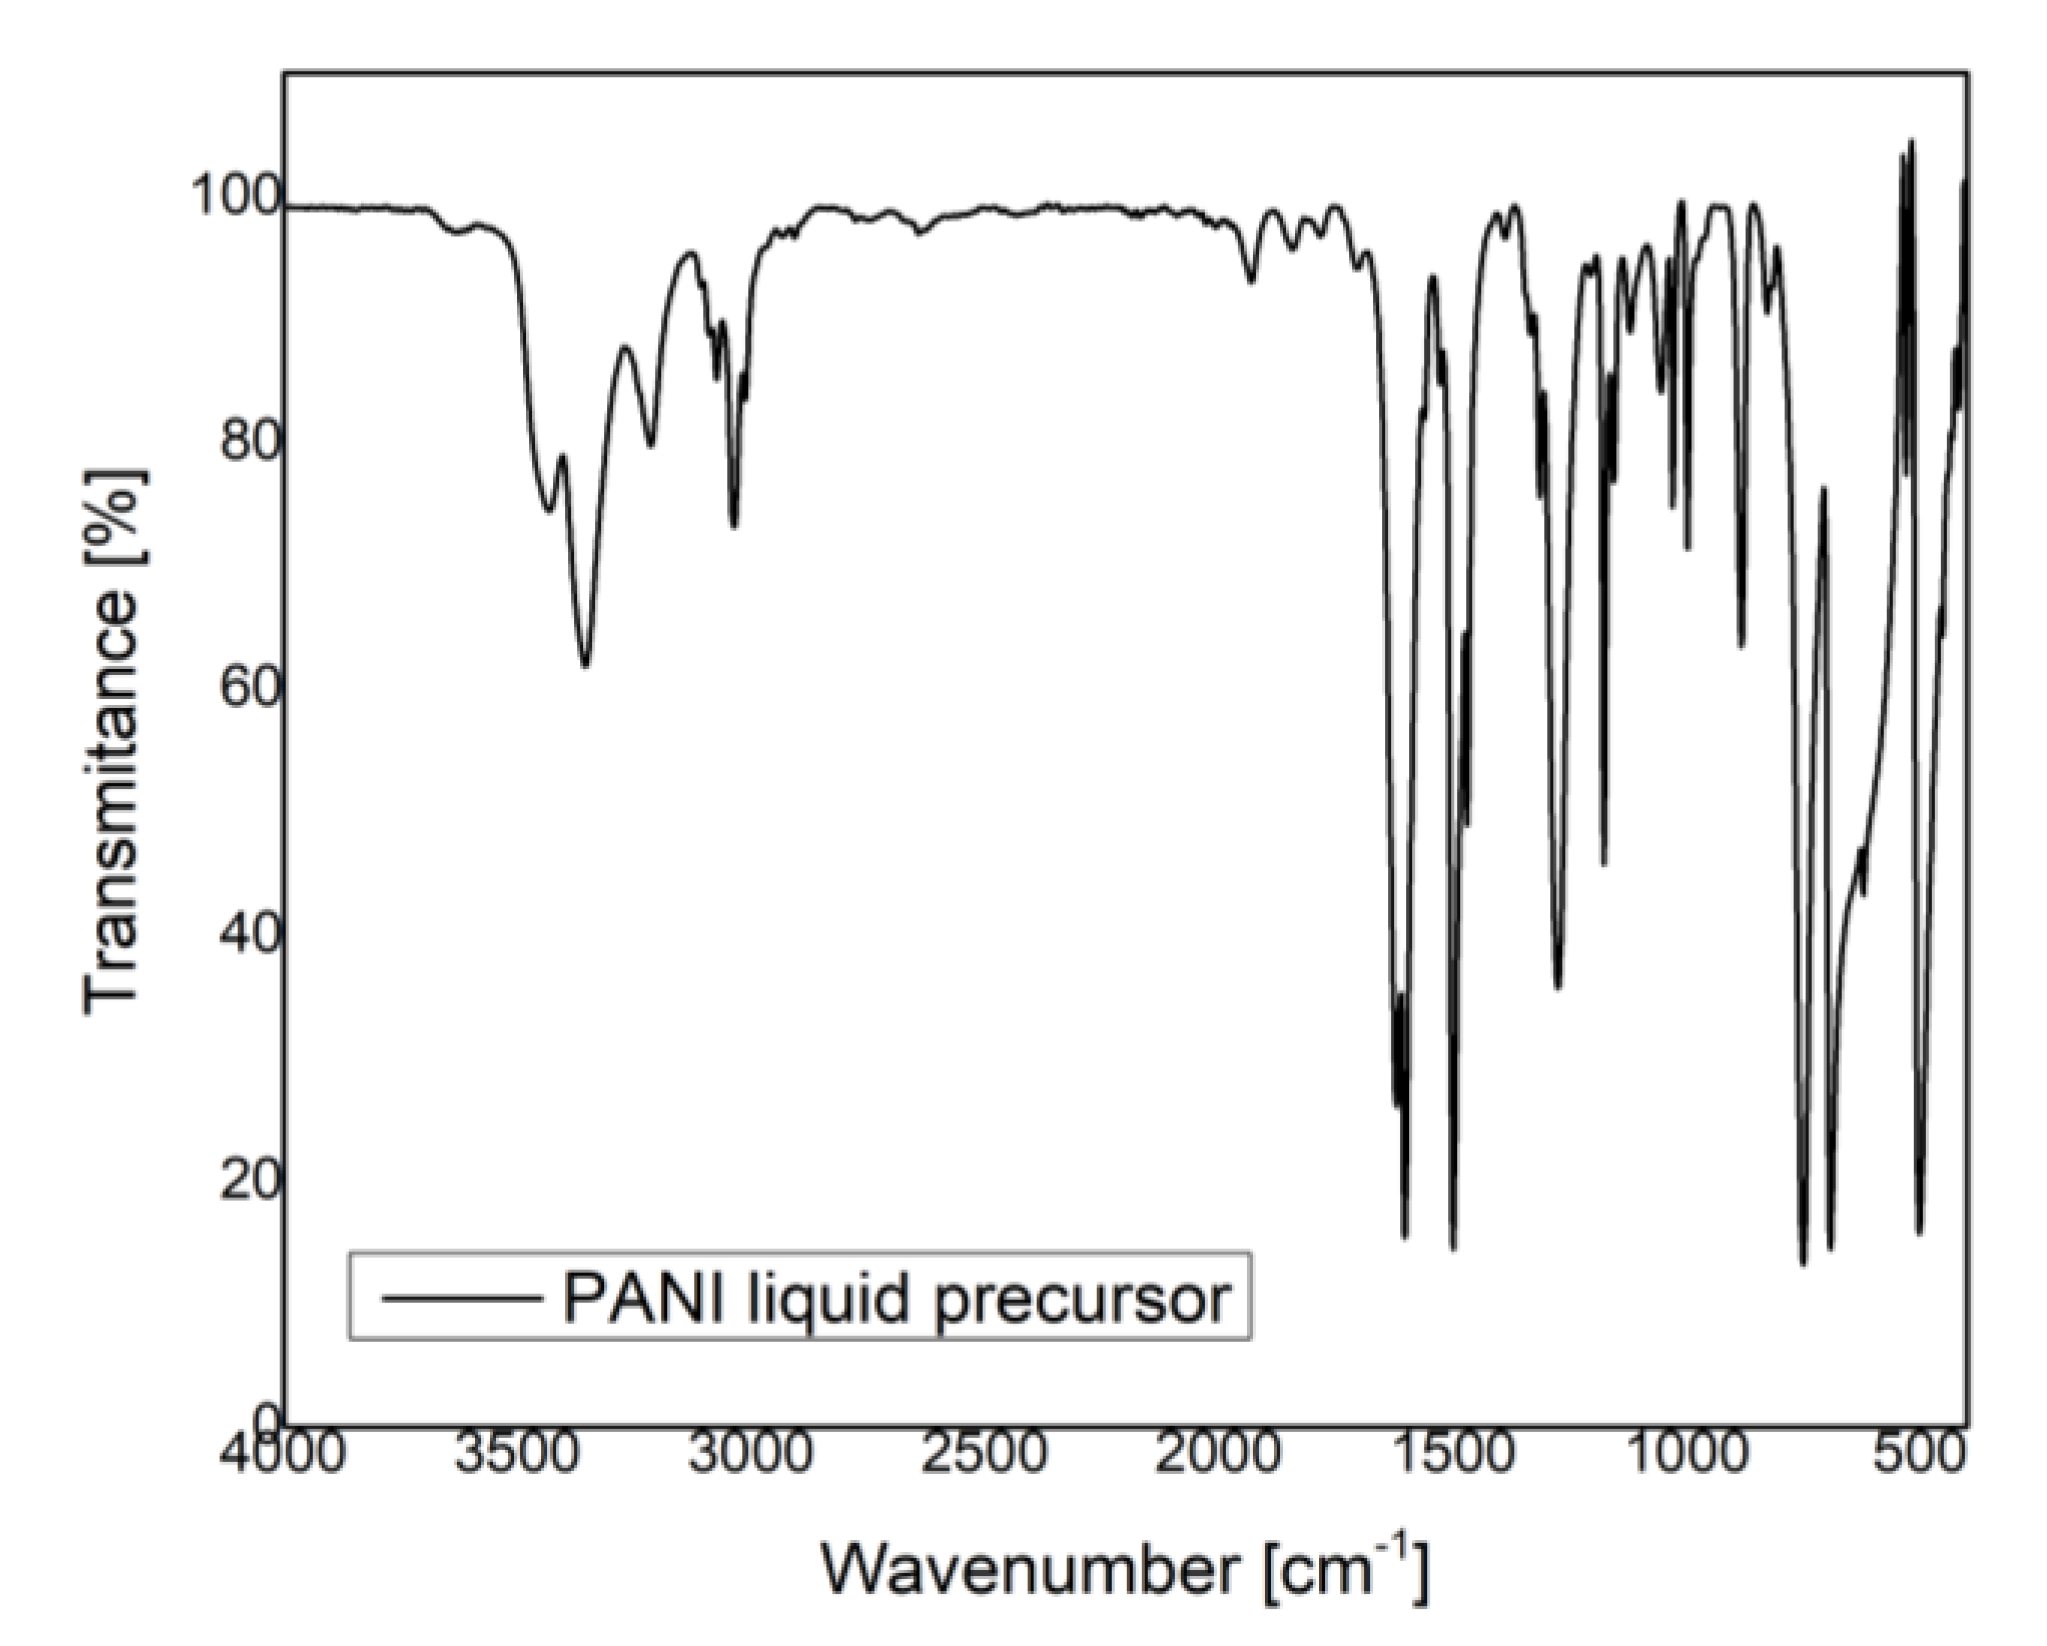
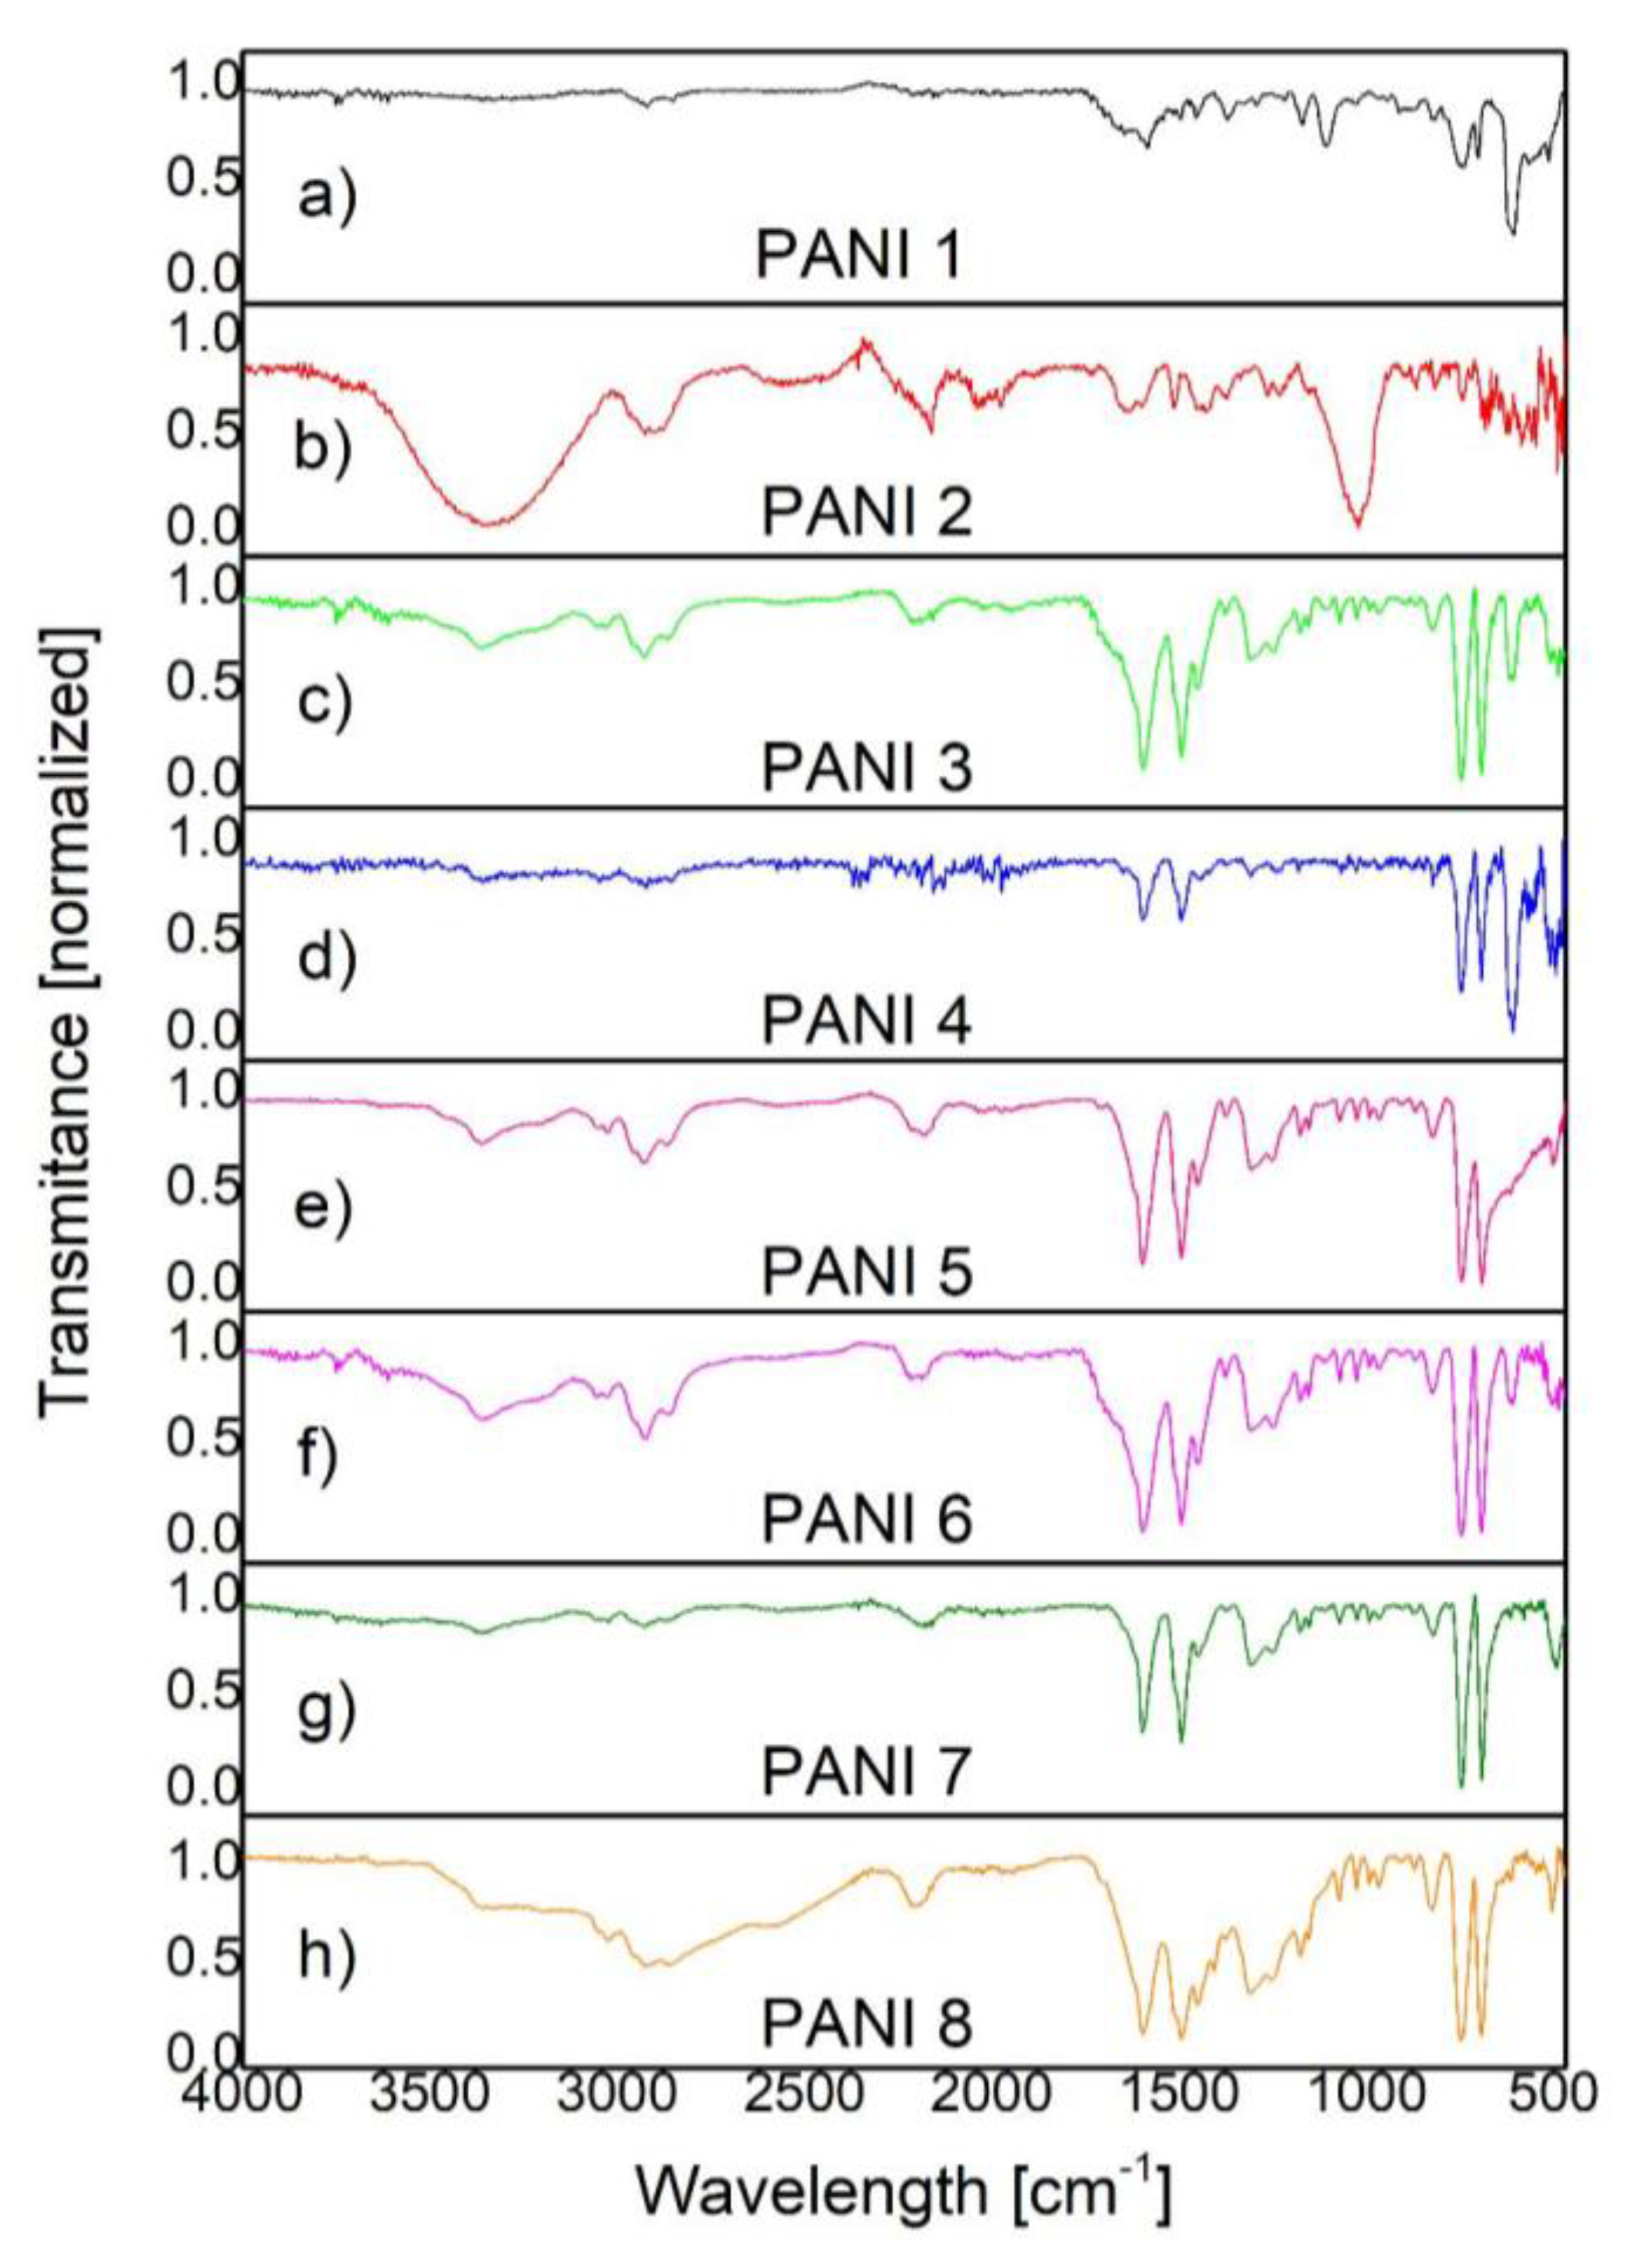
The structural analysis of the two types of conducting polymers produced by plasma polymerization processes was performed by infrared spectroscopy.
In
Figure 6 and
Figure 7 are presented the IR spectra of PANI liquid precursor and PANI layers obtained by plasma polymerization.
In the case of both liquid and polyaniline layers, (
Figure 6 and
Figure 7), the IR bands specific to N–H bond vibrations (3370, 3200, 3023 cm
−1), C–H vibrations (2961, 2921, 2862, 1373, 995, 971, 909 cm
−1), C=N bond vibrations (1650 cm
−1), C–N bond vibrations (1310, 1255 cm
−1), and C=C bond vibrations (1597, 1515, 1496, 1450 cm
−1) are observed [
16,
17,
18,
19,
20].
By comparing the IR bands identified in the polymer spectra with those observed in the liquid precursor spectrum, one can obtain information about the molecular bond arrangements.
The IR bands assigned to N–H bond vibrations (3370, 3200, 3023 cm−1) and C–H vibrations (2961, 2921, 2862, 1373, 995, 971, 909 cm−1) are broader in the polymer spectra than in the liquid one.
As the inclination angle between the substrate and the anode is varied from 0° to 45°, (
Figure 7a,b;
Table 1), for a monomer injection temperature of 20 °C, in the 3400–2500 cm
−1 range of the PANI 2 IR spectrum, it can be observed that the intensities of the vibrational bands of N–H groups are higher than those specific to C–H groups. Contrarily, as the monomer injection temperature is increased up to 50 °C, in the IR spectra of PANI 3, 4, 5, 6, 7, and 8 samples, (
Figure 7c–h) the intensities of the C–H IR bands from 2961, 2921, and 2862 cm
−1 are comparatively higher than those specific to N–H IR bands from 3370, 3200, and 3023 cm
−1. Thus, it is possible that the number of N–H broken bonds inside the plasma can be enhanced with the increase of the monomer injection temperature. In the same time, the ratio between the intensities of C–H and N–H IR bands is higher as the inclination angle between the anode and the substrate holder is increased up to 90° and the anode–substrate distance is decreased to 5 cm (
Figure 7f–h,
Table 1).
The IR band from 1650 cm−1 assigned to C=N bond vibrations and IR bands characteristic to C=C bond vibrations (1597, 1515, 1496, 1450 cm−1) are broader in the polymer spectra than in the liquid one, for all the PANI samples. The IR bands from 1597 and 1496 cm−1 are characteristic to protonated polyaniline and attributed to C=C stretching vibrations of quinoid and benzoid rings.
The broadening of the IR bands observed in the polymer spectra suggests the cross-linking formation of the PANI samples as a result of their synthesis in a DC glow discharge plasma.
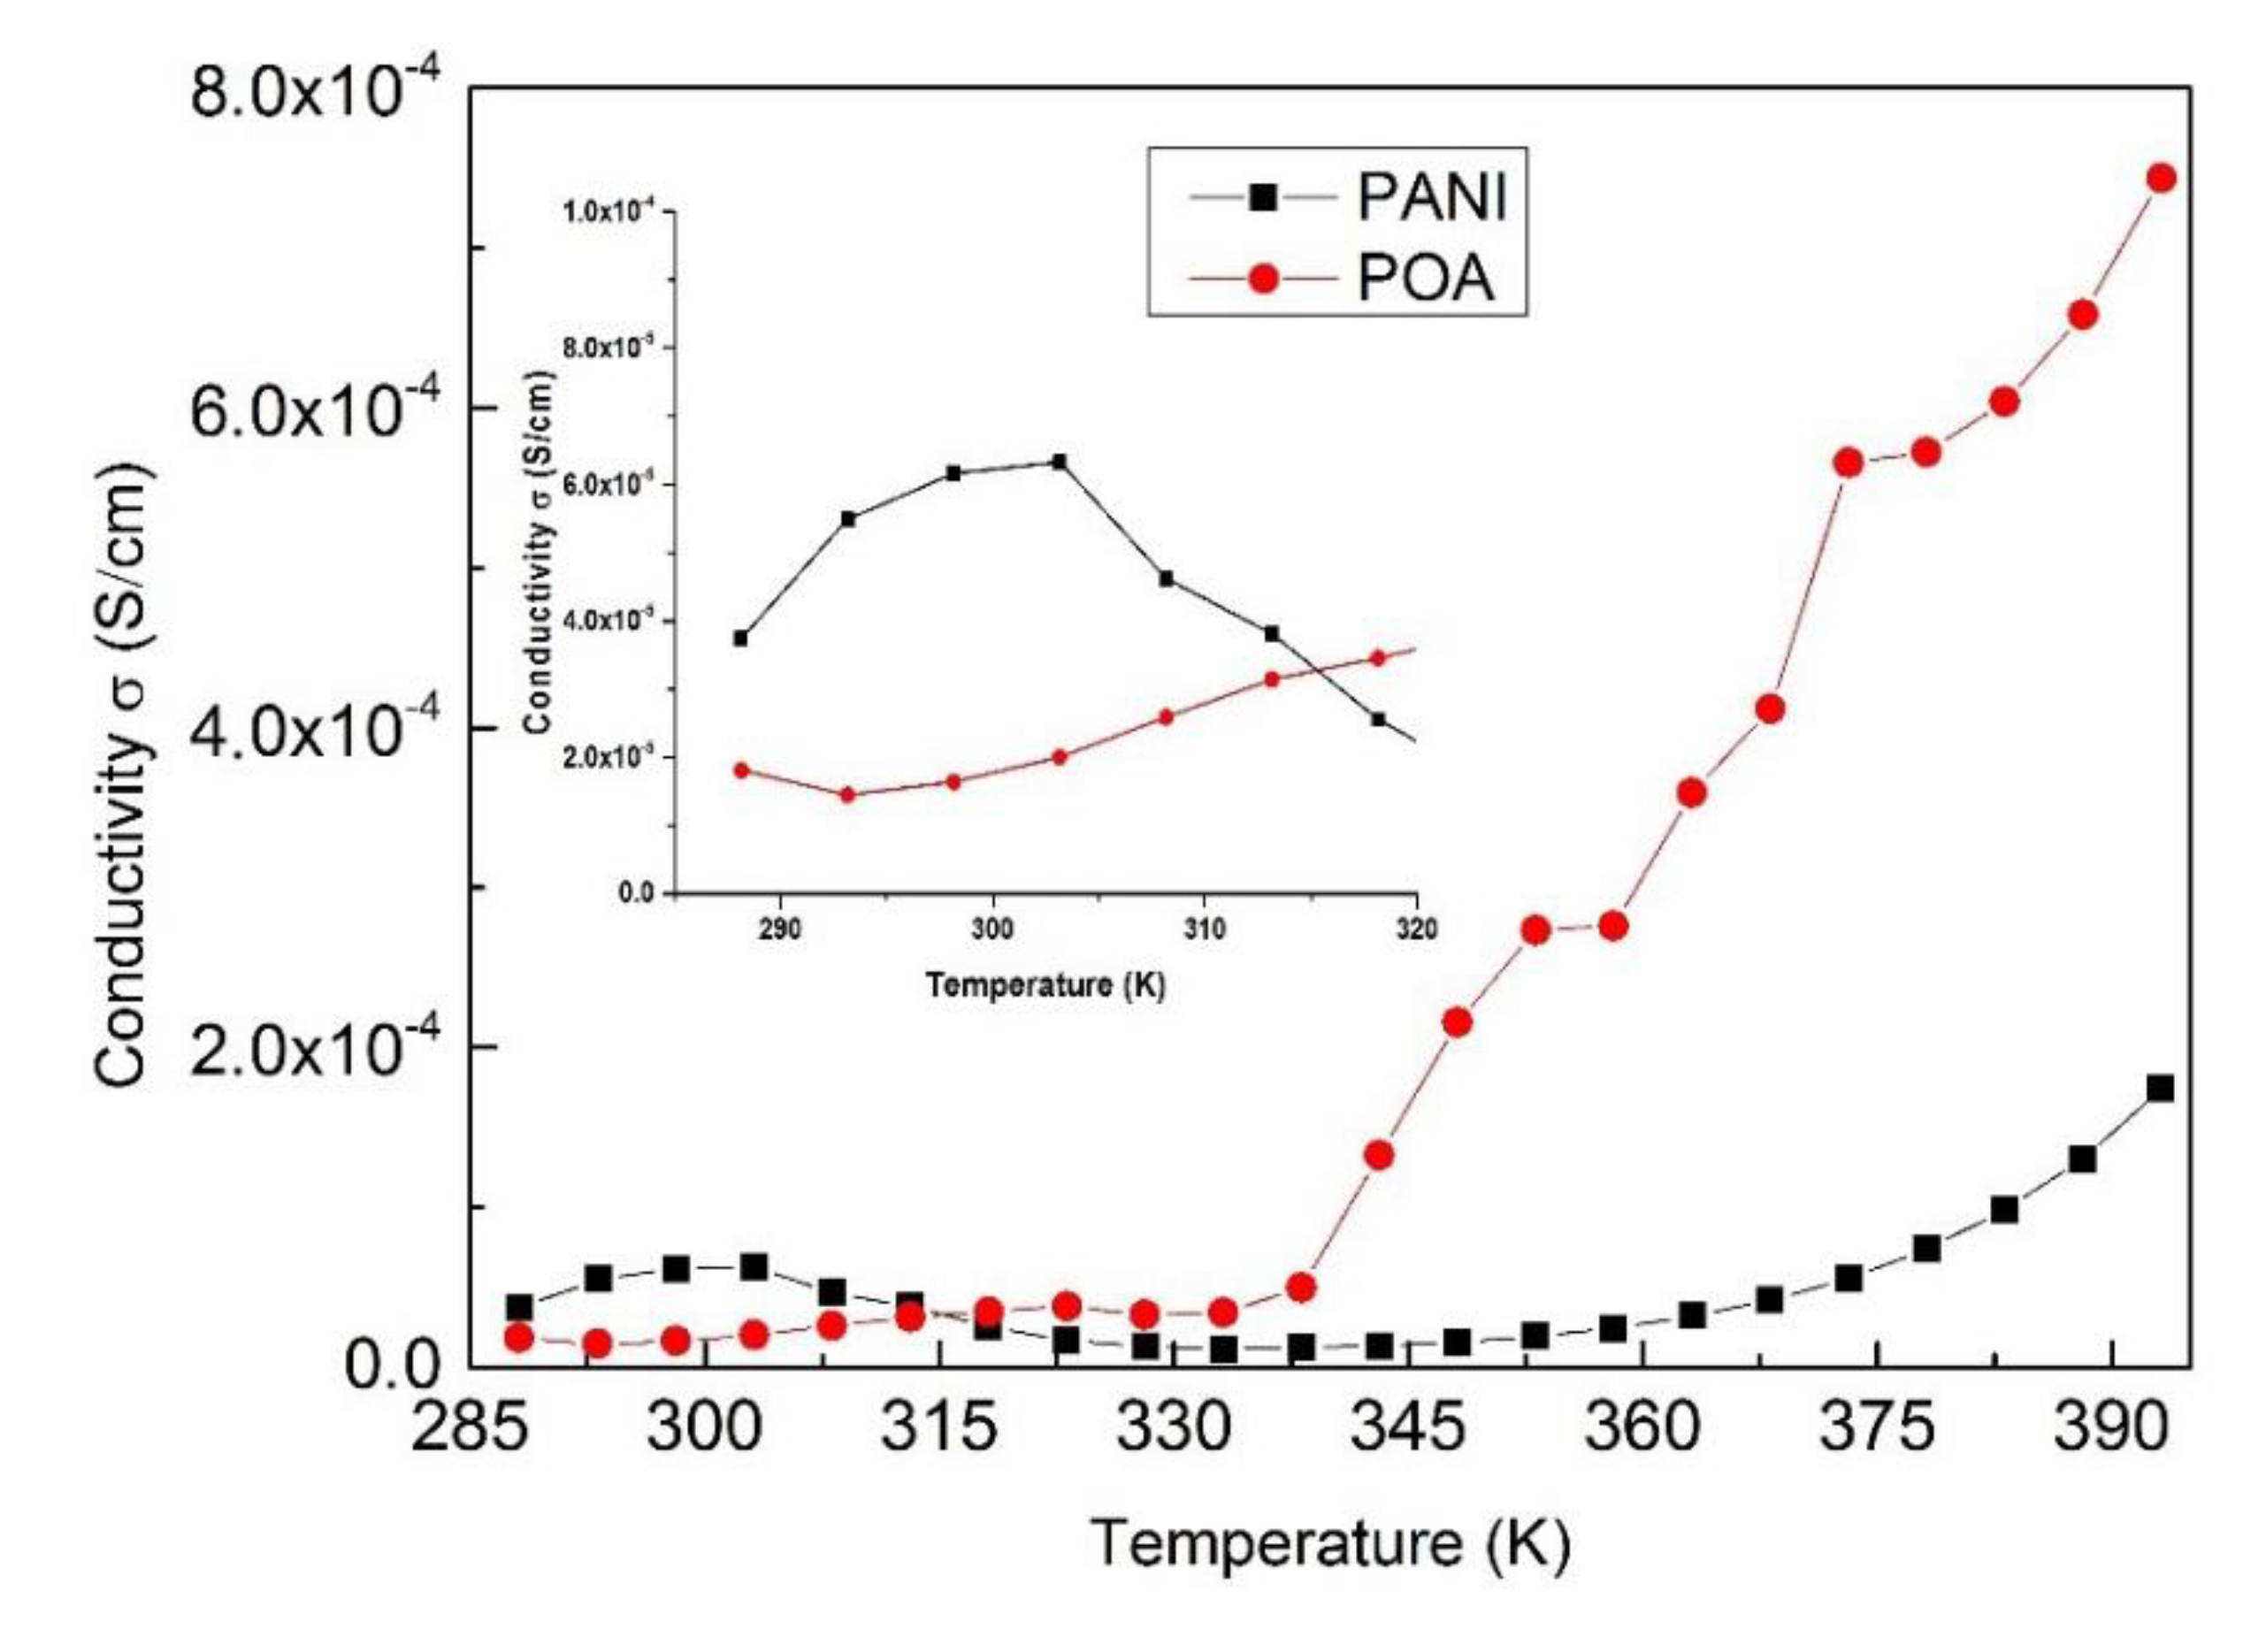
The intensities of the IR bands specific to vibrations of quinoid and benzoid units allow the estimation of their ratio in the polymeric layer. As their intensities are almost the same, these groups are formed in the polymer in approximately equal proportions. This could be an indication of the PANI polymerization in an emeraldine form [
16]. Moreover, it is shown that the 1070 cm
−1 band is a characteristic band for emeraldine salt, being attributed to the doping of PANI with H
+. By this process an excitation band between the valence and conduction band can be formed, having an important role in the electrical conduction of PANI samples. At the same time, the IR band from 1155 cm
−1 also indicates the conducting protonated process of PANI [
17]. As can be observed in IR spectra from
Figure 7 the 1070 and 1155 cm
−1 IR bands characteristic to emeraldine salt form of PANI are formed in all the analyzed samples, having the smallest intensity in the PANI 2 sample and the higher one in the PANI 8 sample. At the same time, it can be noticed that the intensity of the 1070 and 1155 cm
−1 IR bands increase with the monomer injection temperature and anode-substrate inclination angle, attaining a maximum value identified in the PANI 8 IR spectrum, (
Figure 7h). These results, related to the intensities of molecular vibrational bands of the PANI samples, can be correlated with the variation in thickness of the polymeric layers in agreement with the data presented in
Section 3.2. The thickness of PANI 1 sample is about 390 nm and that of PANI 8 sample attains a value of 2.36 μm.
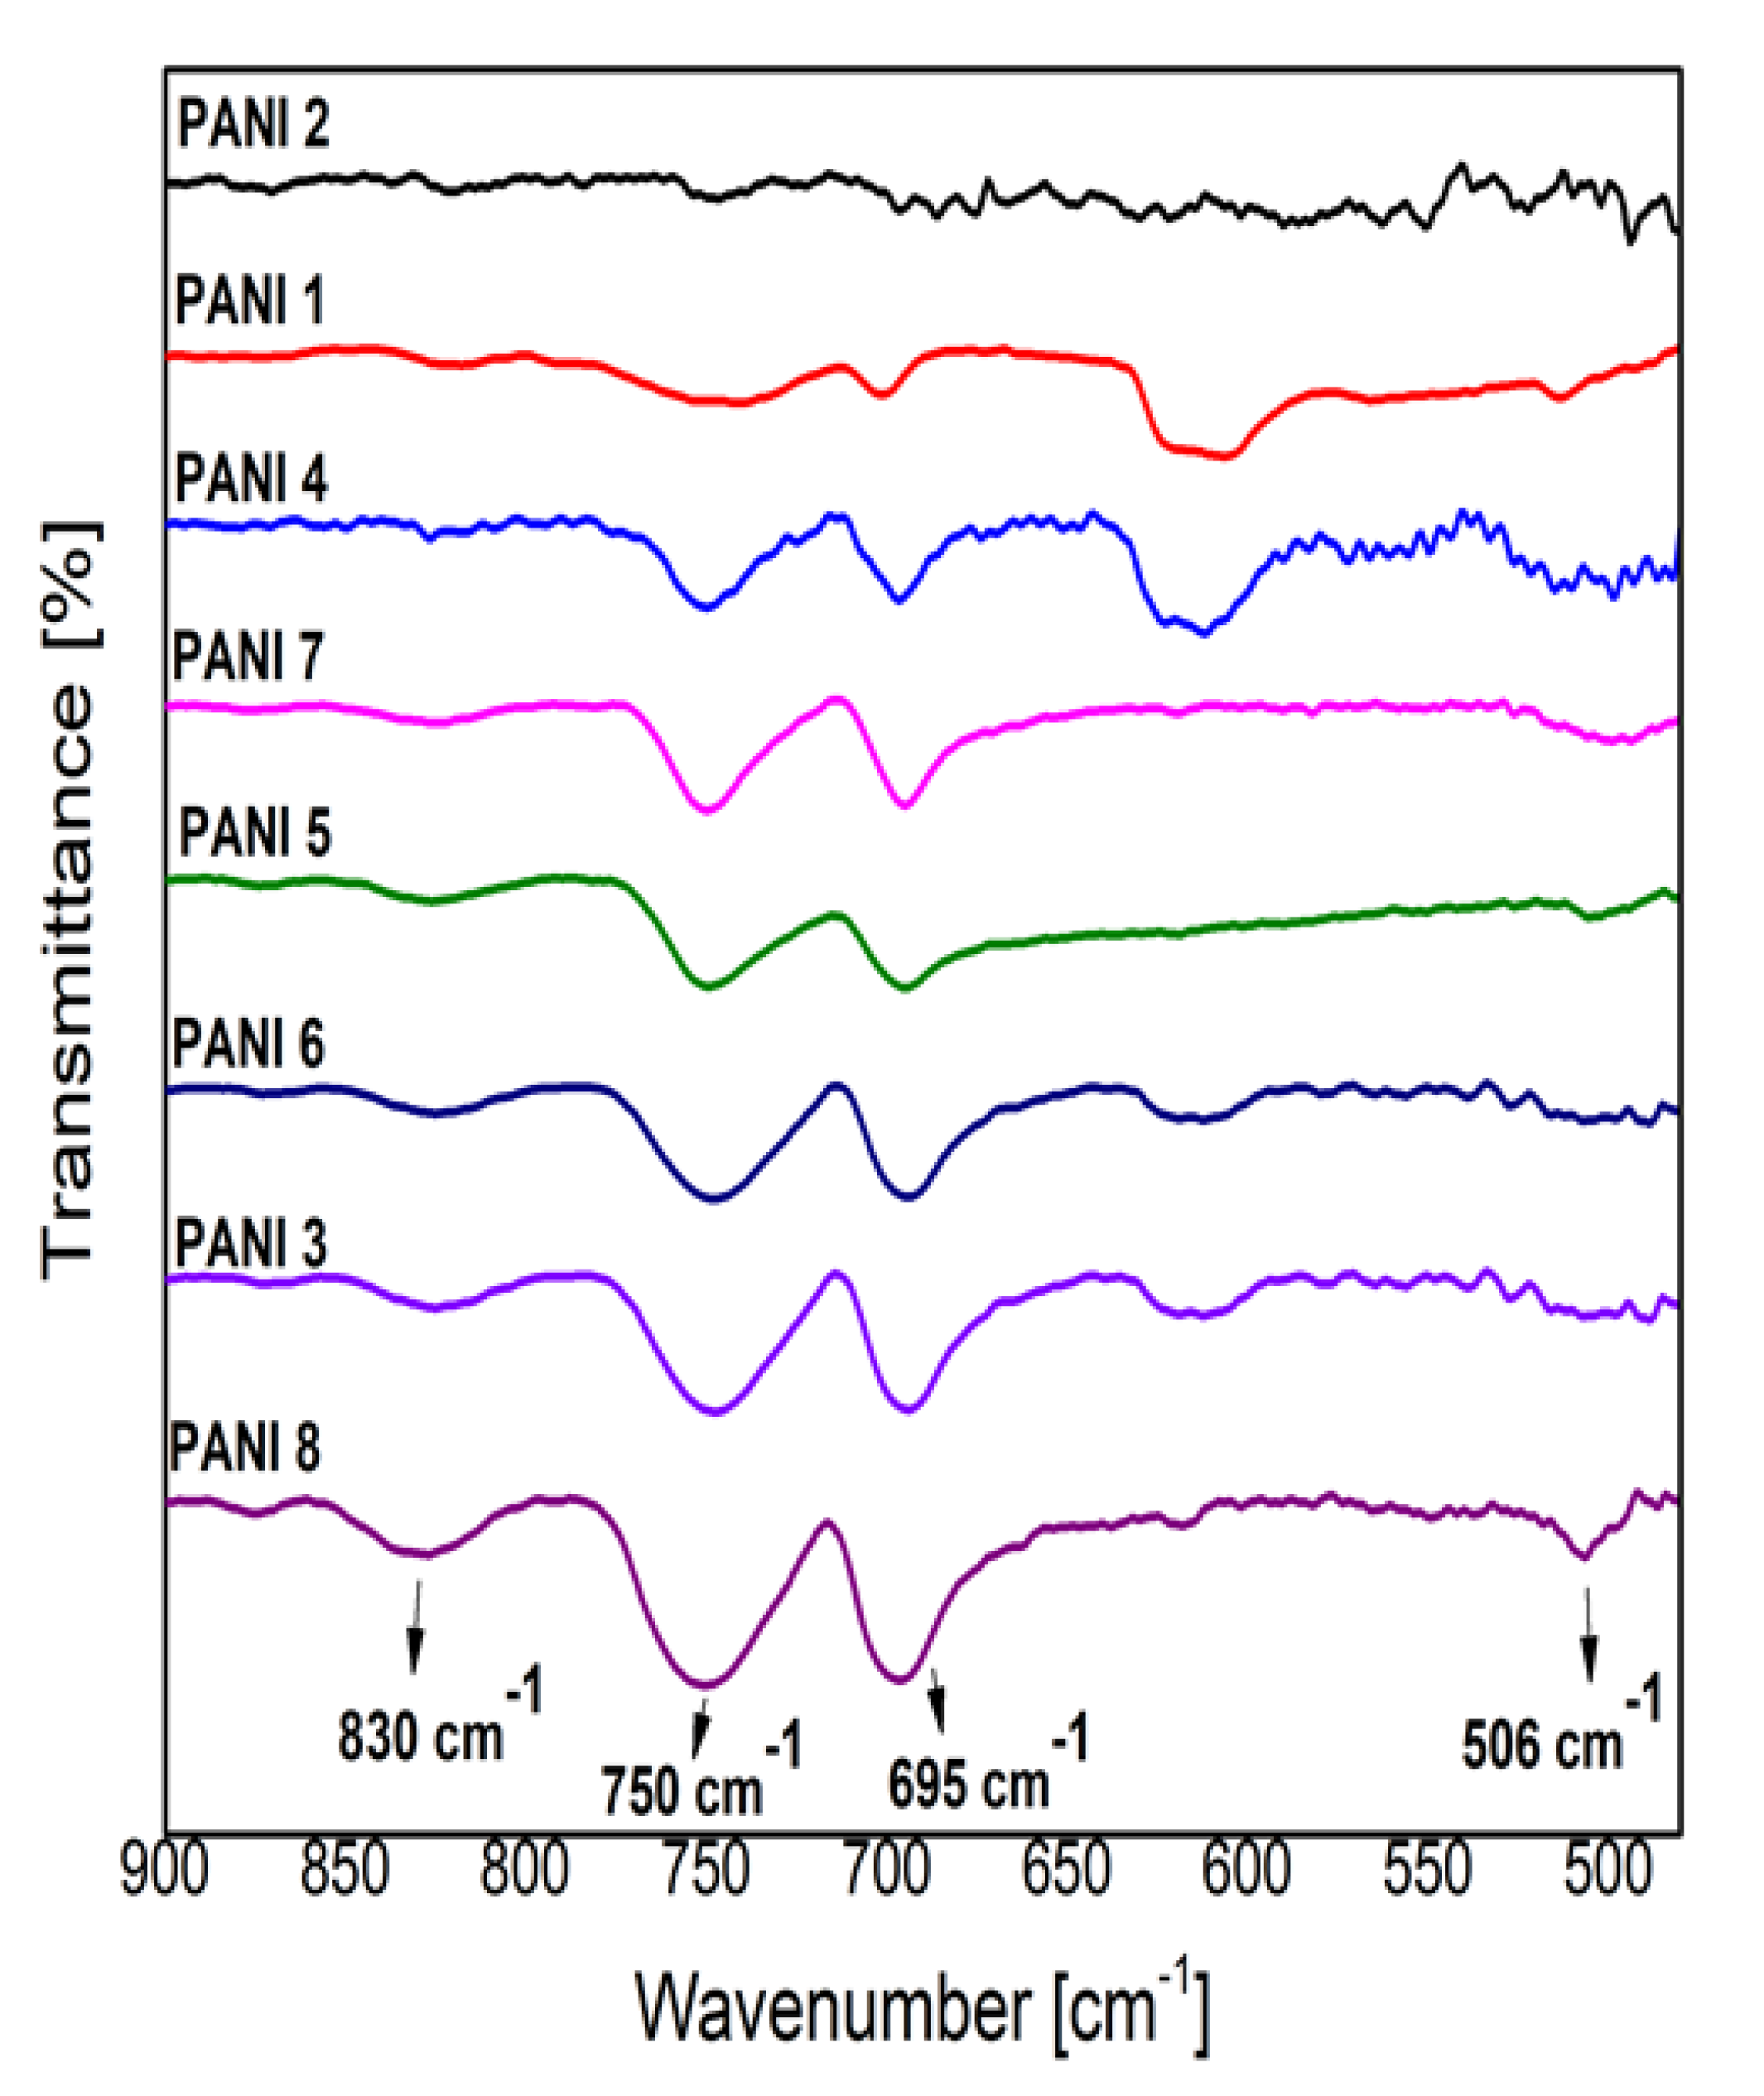
The IR bands observed in the PANI sample spectra in the 1200–500 cm−1 range are similar with those observed in the liquid precursor spectrum.
The C–H out of plane bending modes in the 1000–400 cm
−1 spectral region indicate all the substitutions present in the benzene ring as a result of the polymerization process, (
Figure 8) [
16,
17,
18,
19,
20]. The intensity of the IR bands observed at 747 cm
−1 (ortho substitutions in benzene ring) and 692 cm
−1 (meta substitutions in benzene ring) are almost equal in all the investigated samples (except the PANI 2 sample) in comparison with that from 830 cm
−1 assigned to para substitutions. As the chain of conducting PANI contains a high proportion of para substitutions in the benzene ring [
11], it results that the PANI 2 sample has the smallest conductivity, the higher conductivity being attributed to the PANI 8 sample. In
Figure 7 can be observed that the intensity of the 830 cm
−1 IR band has the highest value in the case of PANI 8 sample IR spectrum and the smallest one in the case of PANI 2 sample IR spectrum.
The dependence of the intensity of the IR band from 830 cm
−1 on the plasma deposition conditions (
Table 1) can also be observed in
Figure 8. The monomer injection temperature of 50 °C (PANI 3, 5, 6, 7, 8), a substrate inclination angle of about 90° (PANI 5, 7, 8), and the anode substrate distance of 5 cm (PANI 7, 8) are the most favorable plasma deposition conditions for a high degree of aniline polymerization in para substitutions in the benzene ring.
In the polymerization process the coupling of the phenyl nuclei with respect to the amino groups is mainly performed in meta and ortho positions. The difference in the intensities of these bands and that from 830 cm
−1 can also be an indication of a branched structure of the polymers [
18,
19,
20].
The IR spectra of polyaniline synthetized the DC glow discharge plasma, (
Figure 7 and
Figure 8), showed the influence of the deposition parameters on the polymers structure. The spectra of PANI 1, 2 samples are distinct in terms of band intensities, especially in the 3700–2500 cm
−1 range, as a result of the variation of the inclination angle between the anode and the holder substrate for a monomer injection temperature of 20 °C. The IR spectra of the PANI 3–8 samples generated at 50 °C monomer injection temperature do not present such differences in their IR spectra even when the inclination angle between the anode and the substrate holder was increased up to 90°. As these polymeric layers are spectrally identified to be in the emeraldine salt form of polyaniline (
Figure 7), it seems that the inclination angle between the anode and the substrate holder affect mainly the proportion between para, ortho, and meta substitutions in benzene rings and, as a consequence, the conductivity of PANI samples.
Figure 9 presents the spectra of poly(
o-anisidine) liquid precursor (black line) and POA layers (red line). The IR bands assignment identified within the spectra are shown in
Table 3 and
Table 4.
The FTIR spectra of poly(
o-anisidine) liquid precursor and polymeric film obtained in the DC plasma reactor are shown in
Figure 9. The corresponding IR band assignments are presented in
Table 4 in agreement with the reference data [
4,
18,
20,
22]. In the polymeric layer, the main characteristic bands are attributed to: N–H stretching vibrations (3350 cm
−1) in poly(
o-anisidine) group; the vibrations of the quinoid (1597 cm
−1) and benzoid (1501, 1455 cm
−1 [
18]) rings which confirm the plasma polymerization of
o-anisidine to poly(
o-anisidine); carboxyl groups (1270, 1240 cm
−1) presence on benzene rings; 1,2,4 trisubstituted benzene ring (1217, 1177, 1152 cm
−1); 1,4 substitution on the benzene rings (1117, 1020 cm
−1); 1,2 and 1,3 substitutions on the benzene ring (848, 805, 740 cm
−1) [
4]; 1,4 disubstitution on benzene ring (550 cm
−1) can be clearly noticed. In comparison with the IR bands characteristic to the liquid precursor it can be observed that in the POA polymer spectrum, in the spectral range of 3400–2700 cm
−1, the IR bands characteristic to N–H stretching vibrations (3350 cm
−1) and C–H stretching vibrations (2930, 2882 cm
−1) are overlaid as an indication of their broadening. The C=C stretching vibrations of quinoid groups appear in the polymer spectrum at 1597 cm
−1, not at 1612 cm
−1 as in the liquid precursor spectrum. The C=C stretching vibration of benzoid groups has similar IR band features in both liquid and polymer spectra.
In 1320–1056 cm−1 and 617–470 cm−1 spectral ranges the IR bands are better evidenced in the precursor liquid spectrum than in the polymer one. This can be an indication that, in the polymer, the IR bands are broader and overlaid. The broadening of the IR bands is an indication of the cross-linking.
In comparison to the IR spectrum of PANI, the IR spectrum of poly(
o-anisidine) from
Figure 9 shows that the IR band specific to benzoid group is more intense than the one of quinoid group, indicating that their proportions are not equal.
3.4. X-Ray Diffraction Analysis
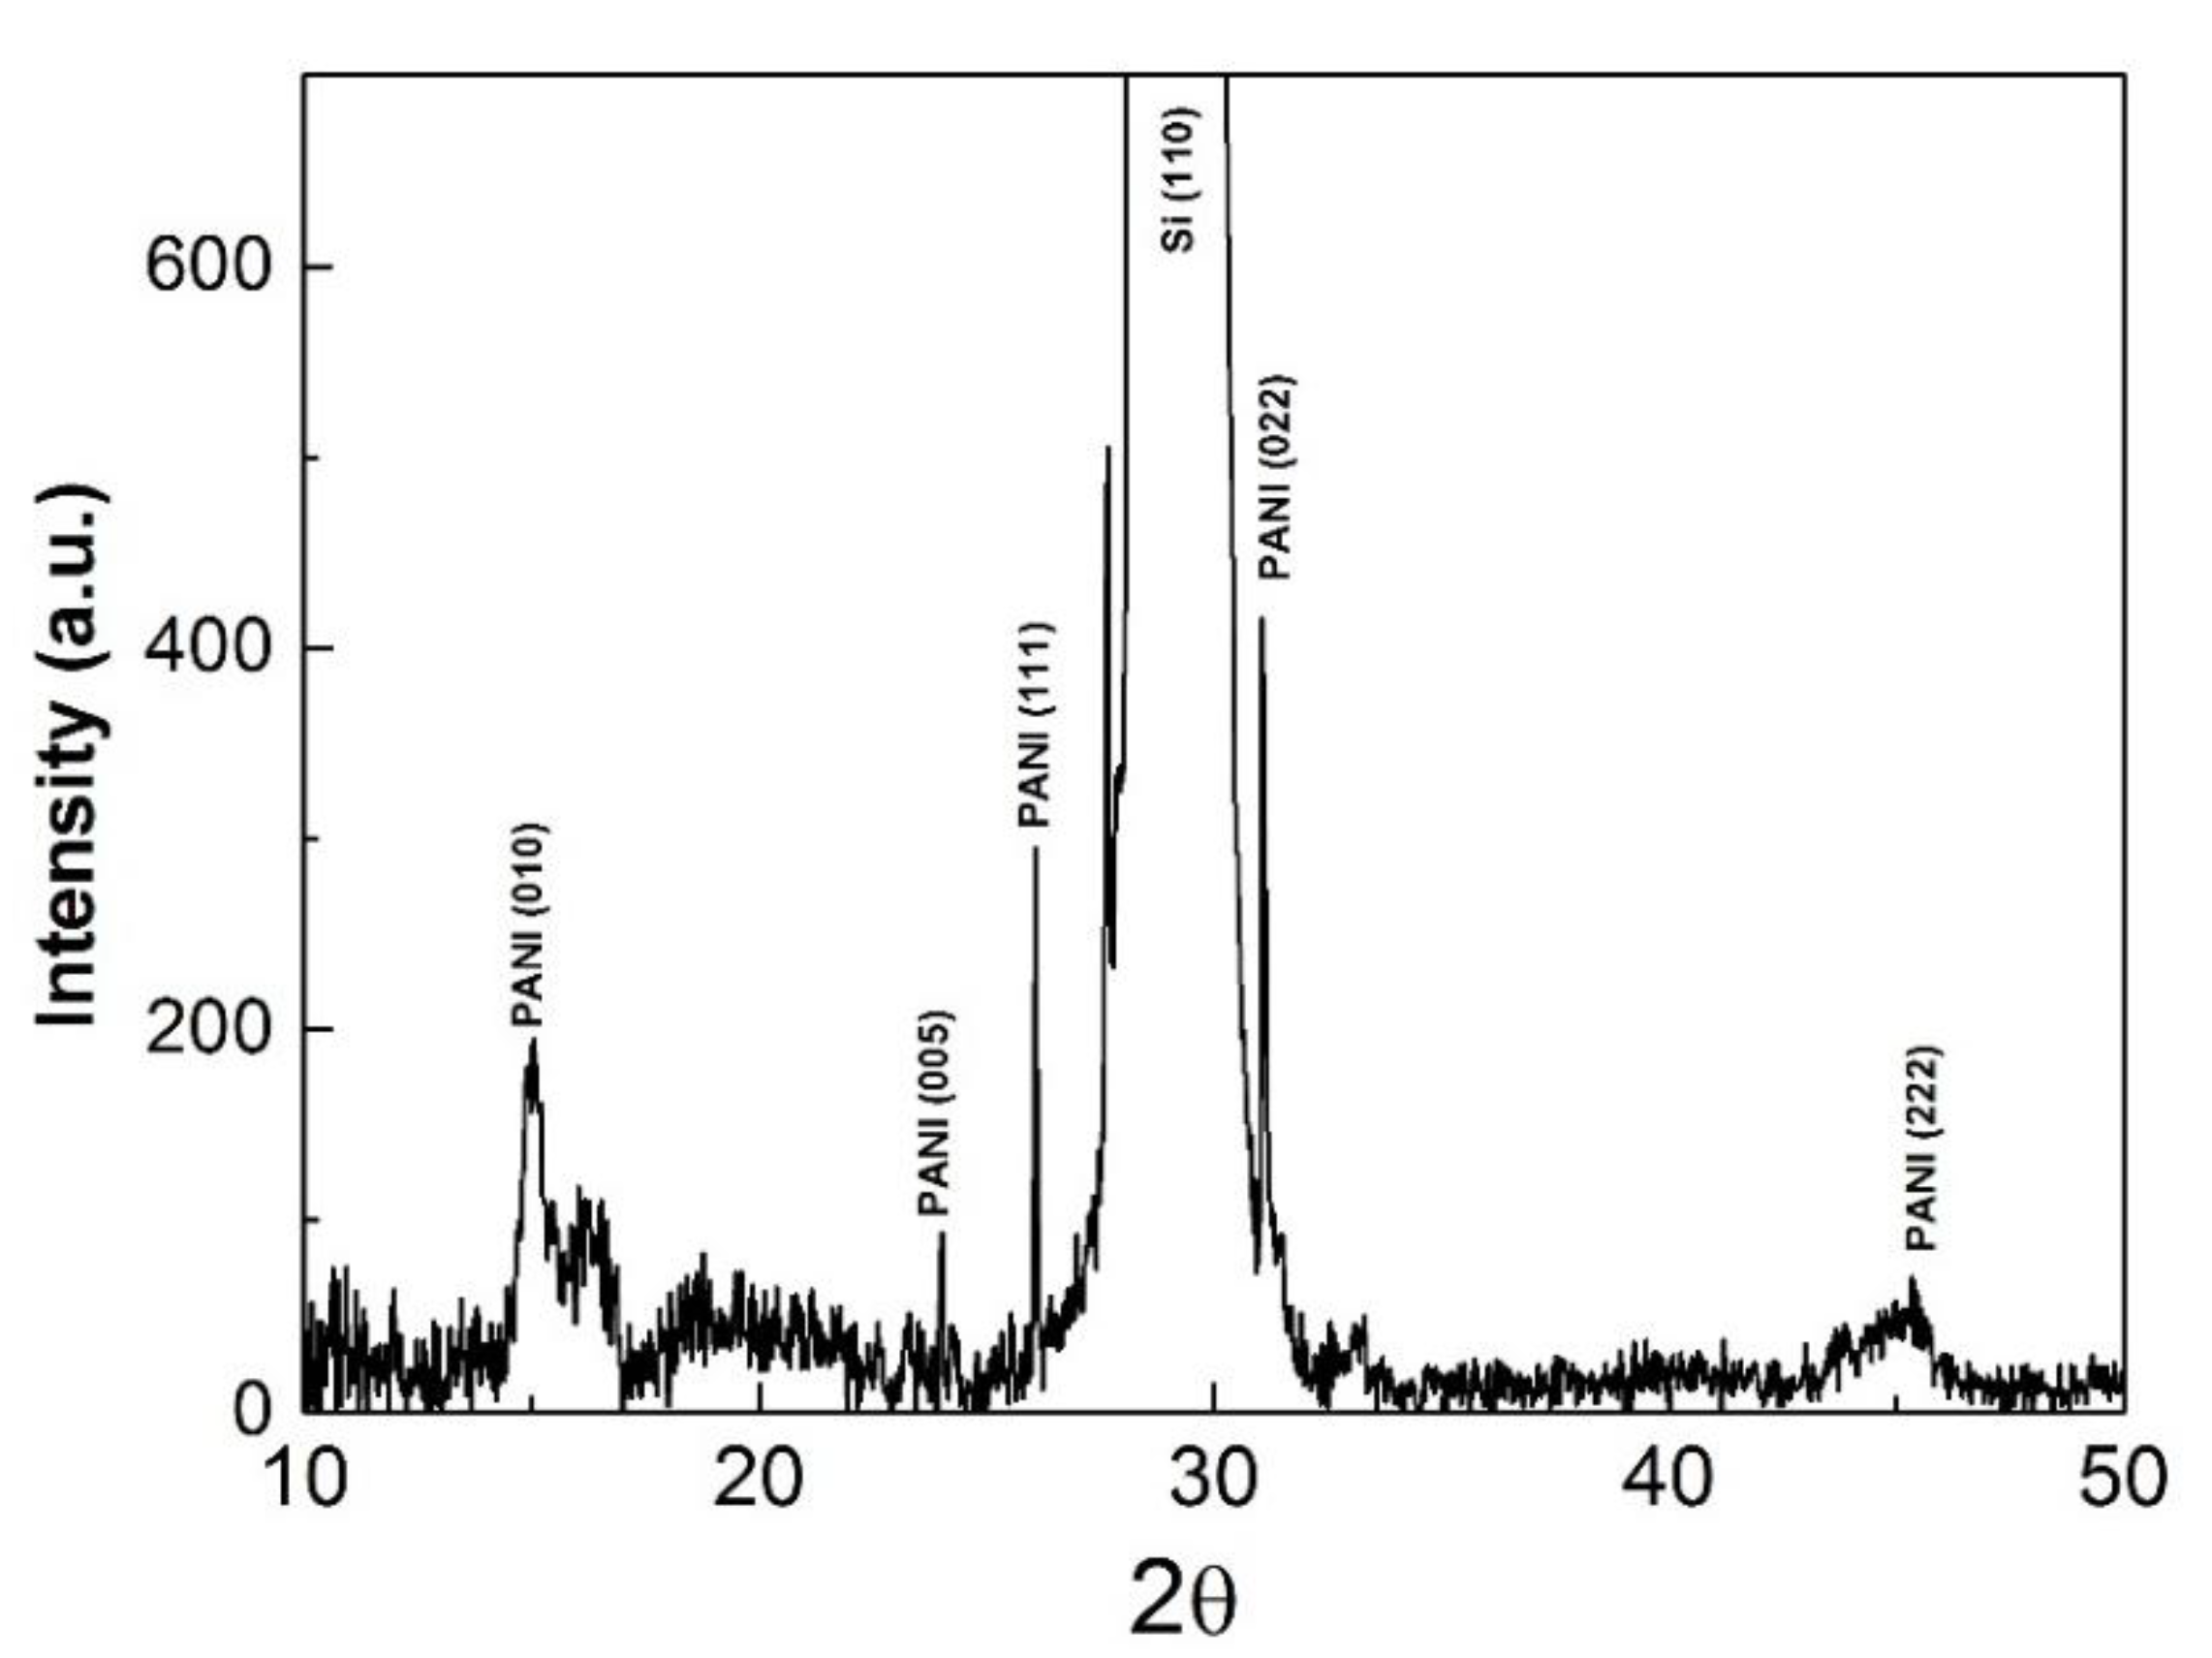
The crystalline structure of the polymers was investigated for all the samples produced in the experimental conditions presented in
Table 1 by means of an X-ray diffraction (XRD) setup. The XRD patterns of the PANI 8 sample are presented in
Figure 10.
The main reflections correspond to a pseudo orthorhombic phase of PANI. Crystallinity of PANI samples could account for superior conductive properties of the thin polymer layers. Thus, a highly-ordered structure, similar to metals, will most likely have enhanced conductivity. Our results present a textured polymer film made up of two components from the crystalline point of view. The first one formed from (010), (200) with broad appearance and low intensity due to the reduced crystalline dimension with a low degree of organization, and the other one composed of intense and narrow reflections corresponding to a highly-ordered structure. Additionally, in the latter case, the crystallite size increased with a factor of ~10. These results indicate that the polymeric layers are formed by crystalline domains embedded in an amorphous matrix.
Defects in the crystal symmetry are most likely caused by lattice strain which represents a measure of both defects and dislocation. This, in turn, leads to a lattice deformation that causes the residual stress in the crystalline matrix. Moreover, the lattice strain induces an effect of line broadening in the XRD spectra.
Assuming that the crystallite size and lattice strain have an independent contribution to line broadening, we calculated the strain induced in the PANI crystalline structure with the following relation [
23]:
where ε is the lattice strain induced in crystalline particles and β the full width at half maximum value.
The crystalline plane and the lattice strain associated to the diffraction peaks identified in
Figure 10 are summarized in
Table 5.
The crystalline domain size was evaluated using the Scherrer formula [
16]:
where d represents the crystallite dimension, λ the specific X-ray wavelength.
The interchain separation length was determined from Equation (2) for the highest intensity crystalline orientation. This parameter can give a measure of the polymeric layers conductivity and it represents the hopping distance of electrons from one chain to another. Thus, the probability for a polymer layer to be conductive increases as the distance between the chains decreases [
16]. In our case, the interchain separation length value was 3.59 Å, which is in good agreement with the literature for the conductive polyaniline [
16].
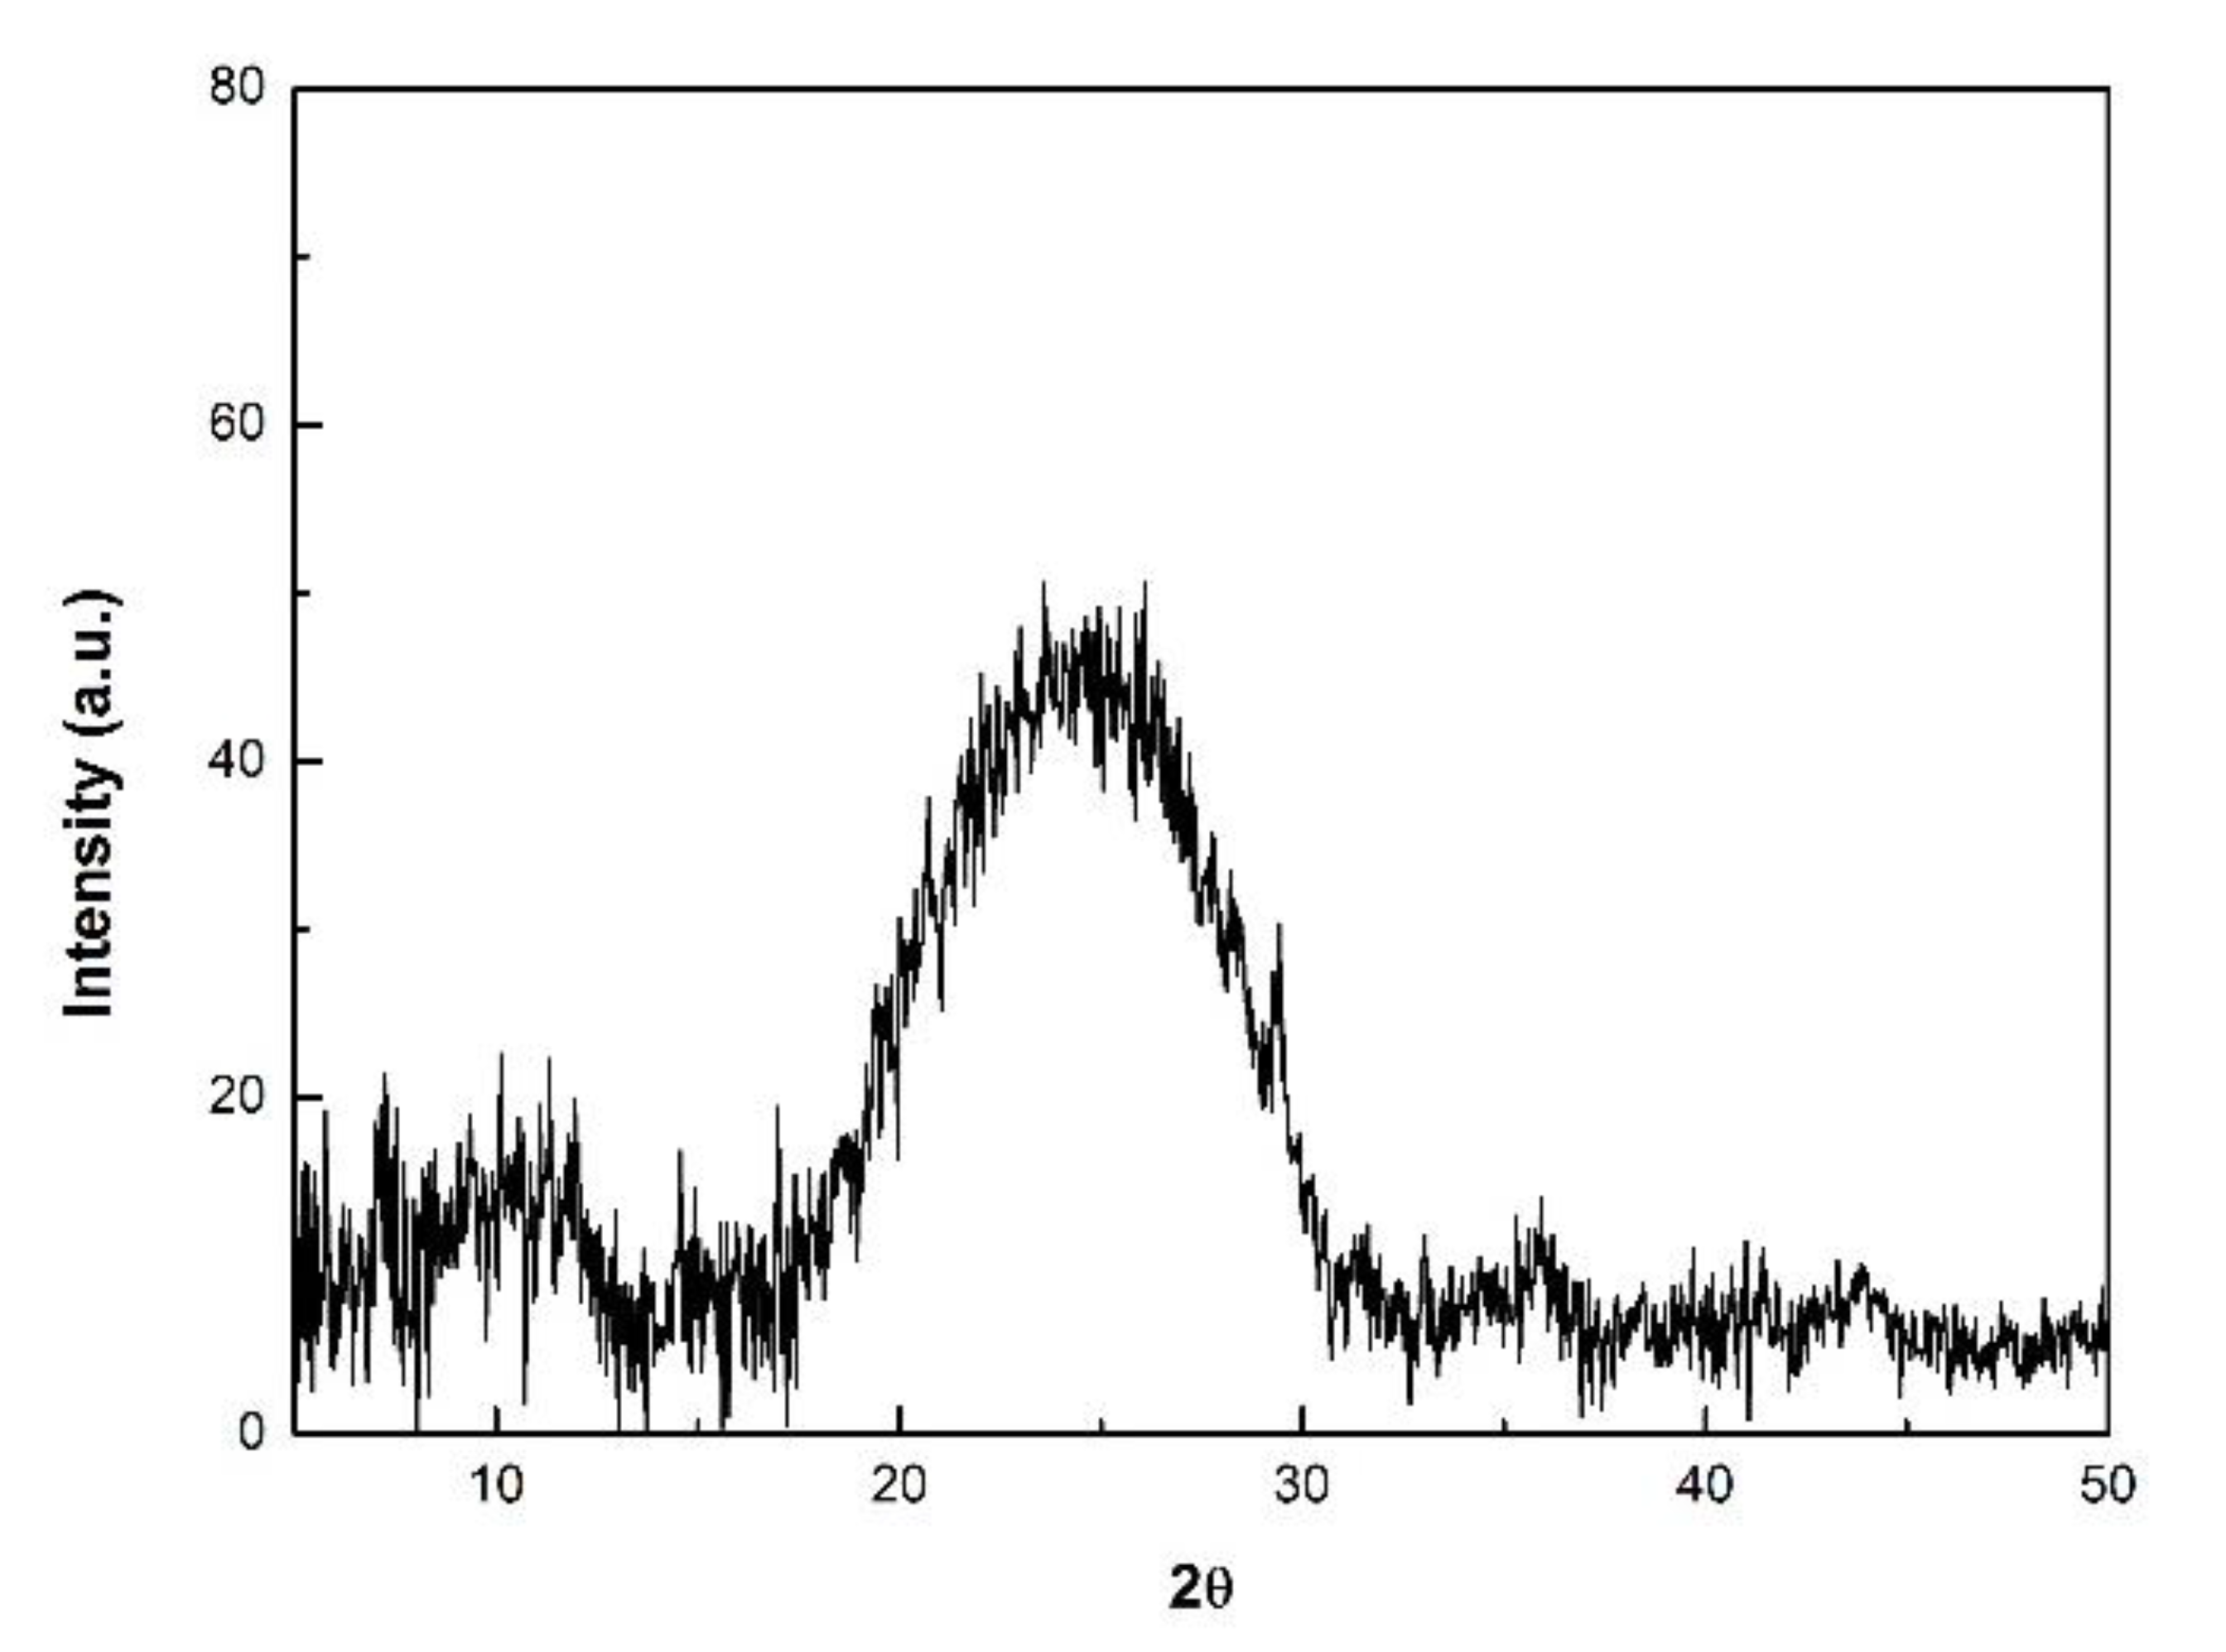
As presented in
Figure 11 the diffraction pattern of the POA sample exhibits a medium broad peak at 2θ = 12.5°, and a broad intense peak with its maximum centered at 25°. These peaks are attributed to the semi-crystalline nature of the polymer [
24].
In the case of PANI and POA samples obtained for a substrate inclination angle of 0 degree, namely, PANI 1, PANI 3, and PANI 6, there were no observed diffraction patterns.


