
Physicochemical and Antibacterial Properties of Carrageenan and Gelatine Hydrosols and Hydrogels Incorporated with Acidic Electrolyzed Water


Abstract
: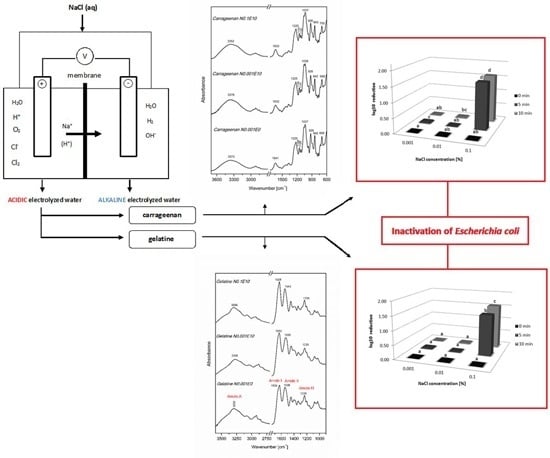
1. Introduction
2. Experimental Section
2.1. Apparatus
2.2. Material
2.3. Preparation of Hydrosols

| Carrageenan (C) | Variants | Concentration of NaCl (N) (%) | Electrolysis Time (E) (min) | pH | ORP (mV) | ACC (mg/L) |
| CN0.001E0 | 0.001 | 0 | 9.20 g ± 0.00 | 98.57 c ± 0.09 | 0.00 a ± 0.00 | |
| CN0.001E5 | 5 | 8.29 f ± 0.01 | 107.60 d ± 3.42 | 0.00 a ± 0.00 | ||
| CN0.001E10 | 10 | 8.24 e ± 0.00 | 72.80 a ± 1.01 | 0.00 a ± 0.00 | ||
| CN0.01E0 | 0.01 | 0 | 9.24 h ± 0.00 | 114.97 e ± 0.28 | 0.00 a ± 0.00 | |
| CN0.01E5 | 5 | 7.72 d ± 0.01 | 133.77 f ± 4.08 | 1.11 b ± 0.31 | ||
| CN0.01E10 | 10 | 7.12 c ± 0.02 | 89.47 b ± 0.88 | 3.19 c ± 0.35 | ||
| CN0.1E0 | 0.1 | 0 | 9.26 h ± 0.01 | 134.07 f ± 0.35 | 0.00 a ± 0.00 | |
| CN0.1E5 | 5 | 3.82 b ± 0.00 | 134.50 f ± 2.00 | 6.14 d ± 0.24 | ||
| CN0.1E10 | 10 | 2.59 a ± 0.02 | 89.47 b ± 0.88 | 8.20 e ± 0.30 |
| Gelatine (G) | Variants | Concentration of NaCl (N) (%) | Electrolysis Time (E) (min) | pH | ORP (mV) | ACC (mg/L) |
| GN0.001E0 | 0.001 | 0 | 5.87 g ±0.01 | 249.30 c ± 0.60 | 0 a ± 0.00 | |
| GN0.001E5 | 5 | 5.84 f ±0.01 | 222.03 a ± 0.58 | 0 a ± 0.00 | ||
| GN0.001E10 | 10 | 5.66 d ±0.01 | 225.20 a ± 0.57 | 0 a ± 0.00 | ||
| GN0.01E0 | 0.01 | 0 | 5.82 e,f ±0.00 | 253.37 c ± 1.13 | 0 a ± 0.00 | |
| GN0.01E5 | 5 | 5.67 d ±0.01 | 237.33 b ± 2.12 | 1.12 b ± 0.12 | ||
| GN0.01E10 | 10 | 5.34 c ±0.01 | 236.80 b ± 2.95 | 1.51 c ± 0.09 | ||
| GN0.1E0 | 0.1 | 0 | 5.80 e ±0.01 | 260.77 d ± 0.12 | 0 a ± 0.00 | |
| GN0.1E5 | 5 | 4.73 b ±0.02 | 327.90 f ± 1.46 | 1.87 d ± 0.07 | ||
| GN0.1E10 | 10 | 4.53 a ±0.01 | 312.40 e ± 1.93 | 2.19 e ± 0.06 |
2.4. Hydrosols Characterization
2.4.1. Physicochemical Properties
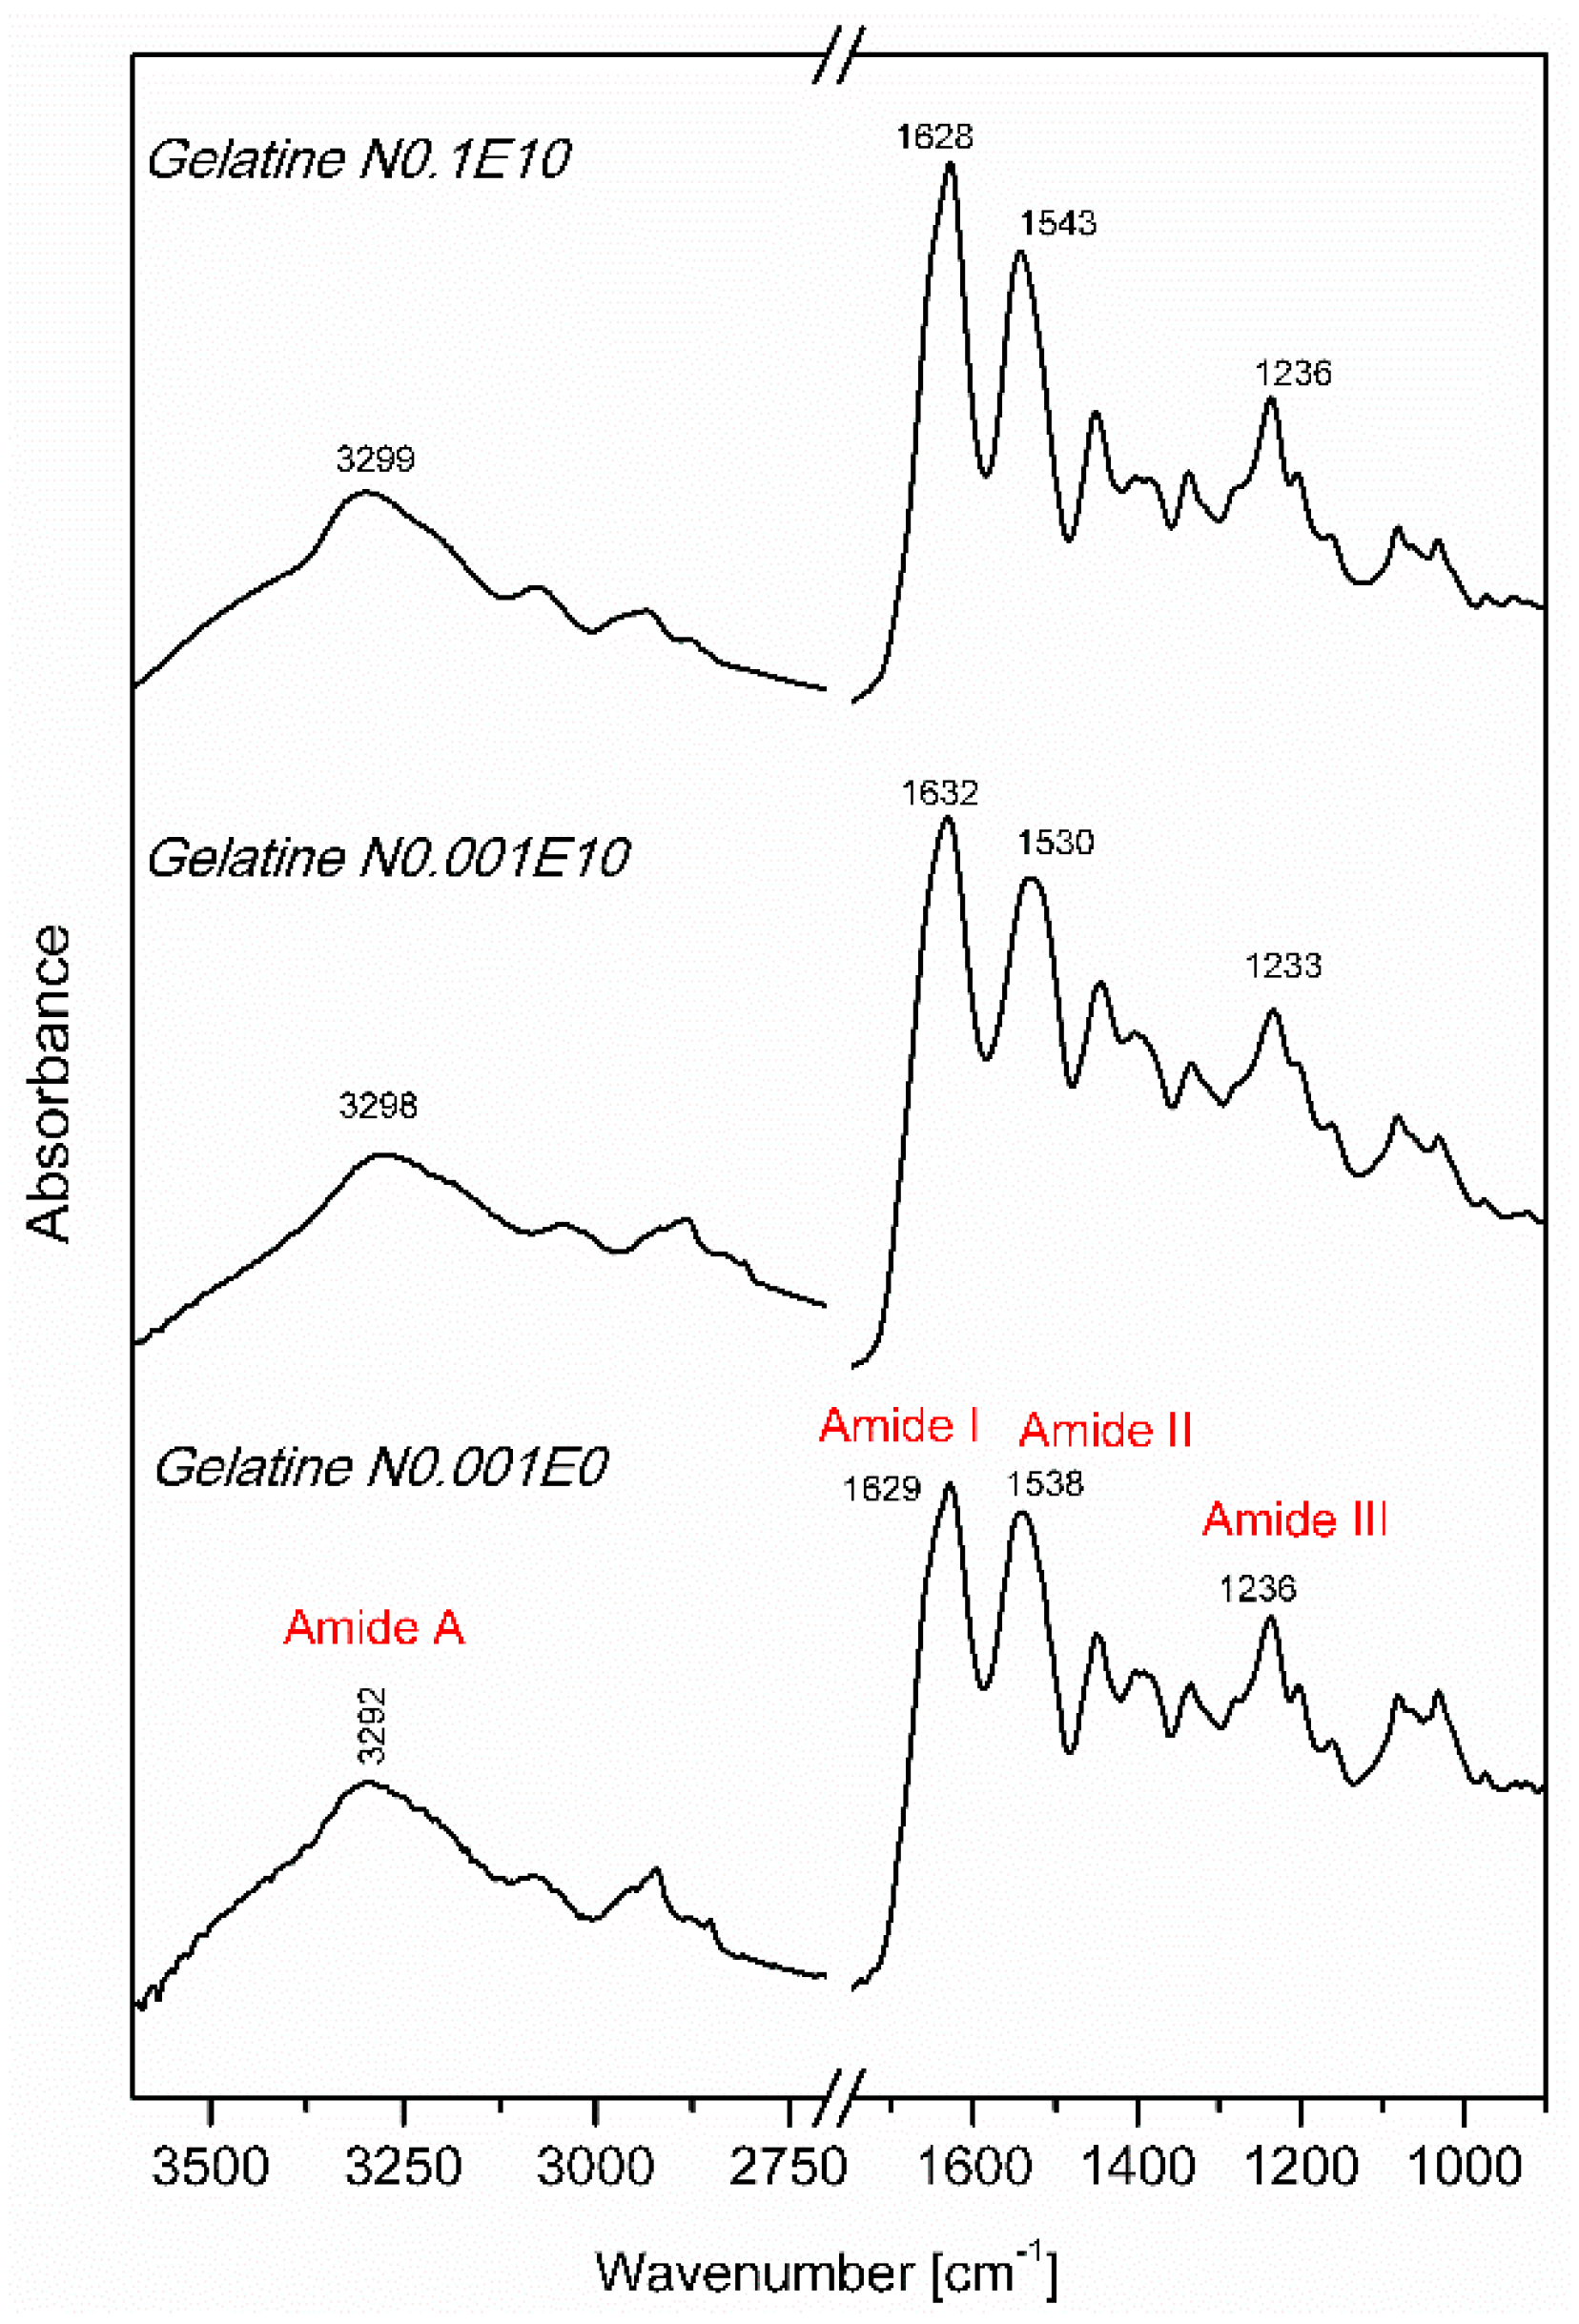
2.4.2. Fourier Transform Infrared Spectroscopy (FT IR)
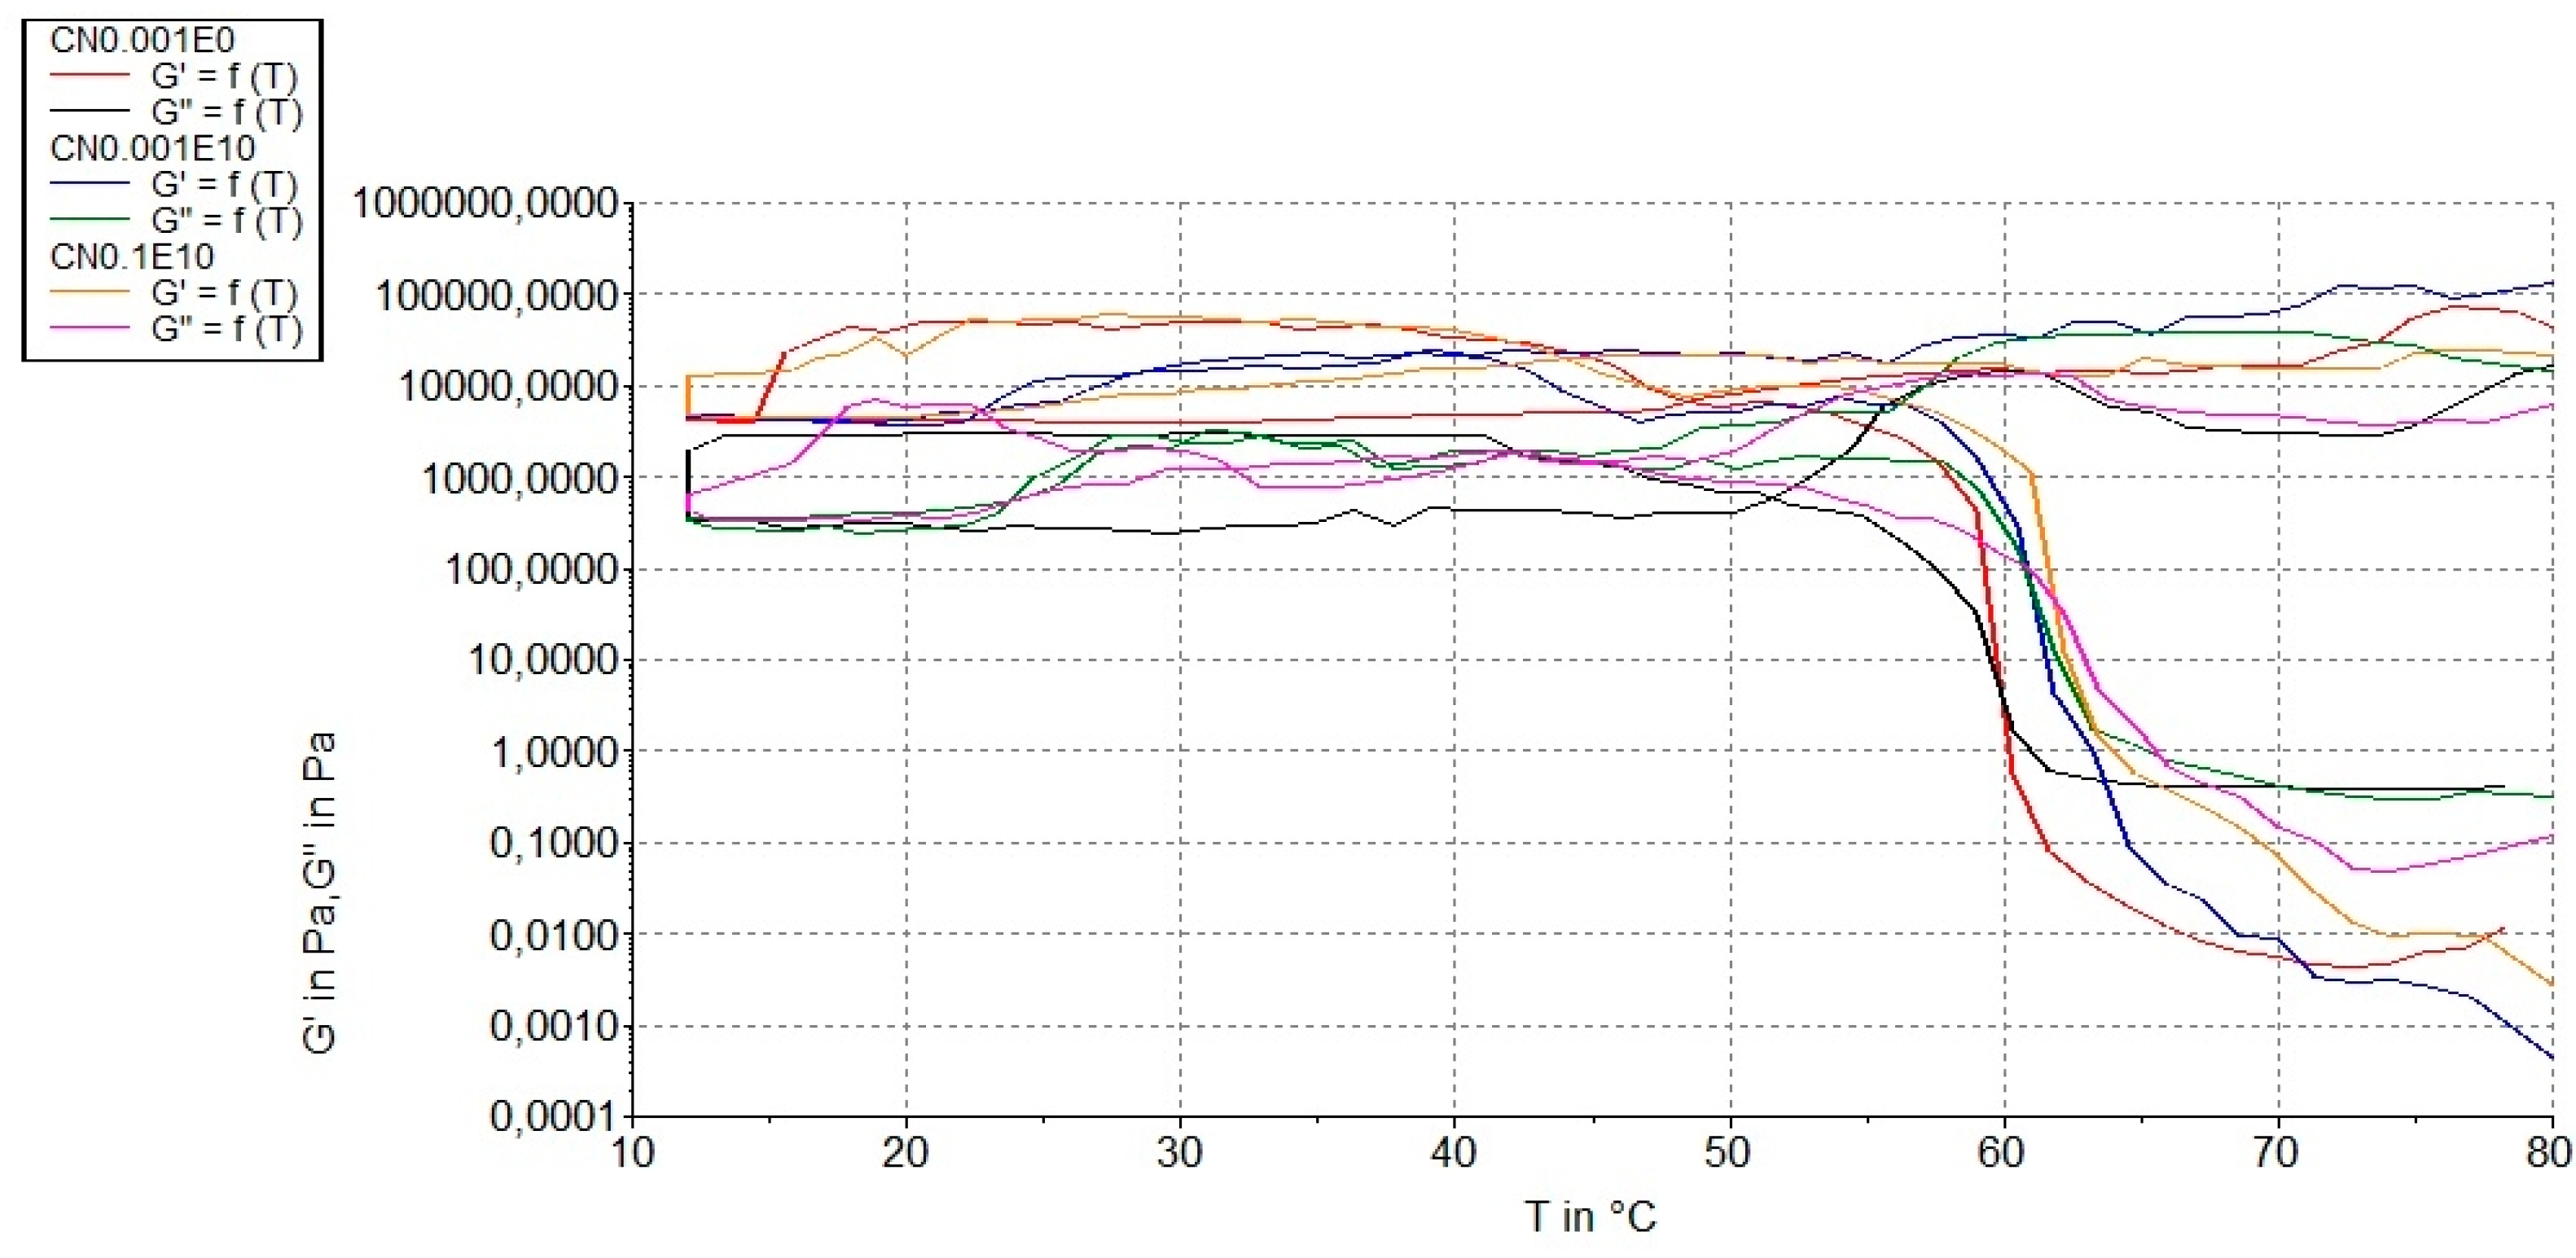
2.4.3. Rheological Measurements
2.4.4. Mechanical Properties
- Hardness: The peak force during the first compression cycle.
- Cohesiveness: The ratio of the area under the first and second compression.
- Springiness: the distance the sample was compressed during the second compression to the peak force, divided by the initial sample height, reported as a percentage.
- Gumminess: Hardness × cohesiveness.
- Chewiness: Gumminess × springiness.
2.4.5. Antibacterial Activity
2.5. Statistical Analysis
3. Results and Discussion
3.1. Physicochemical Properties
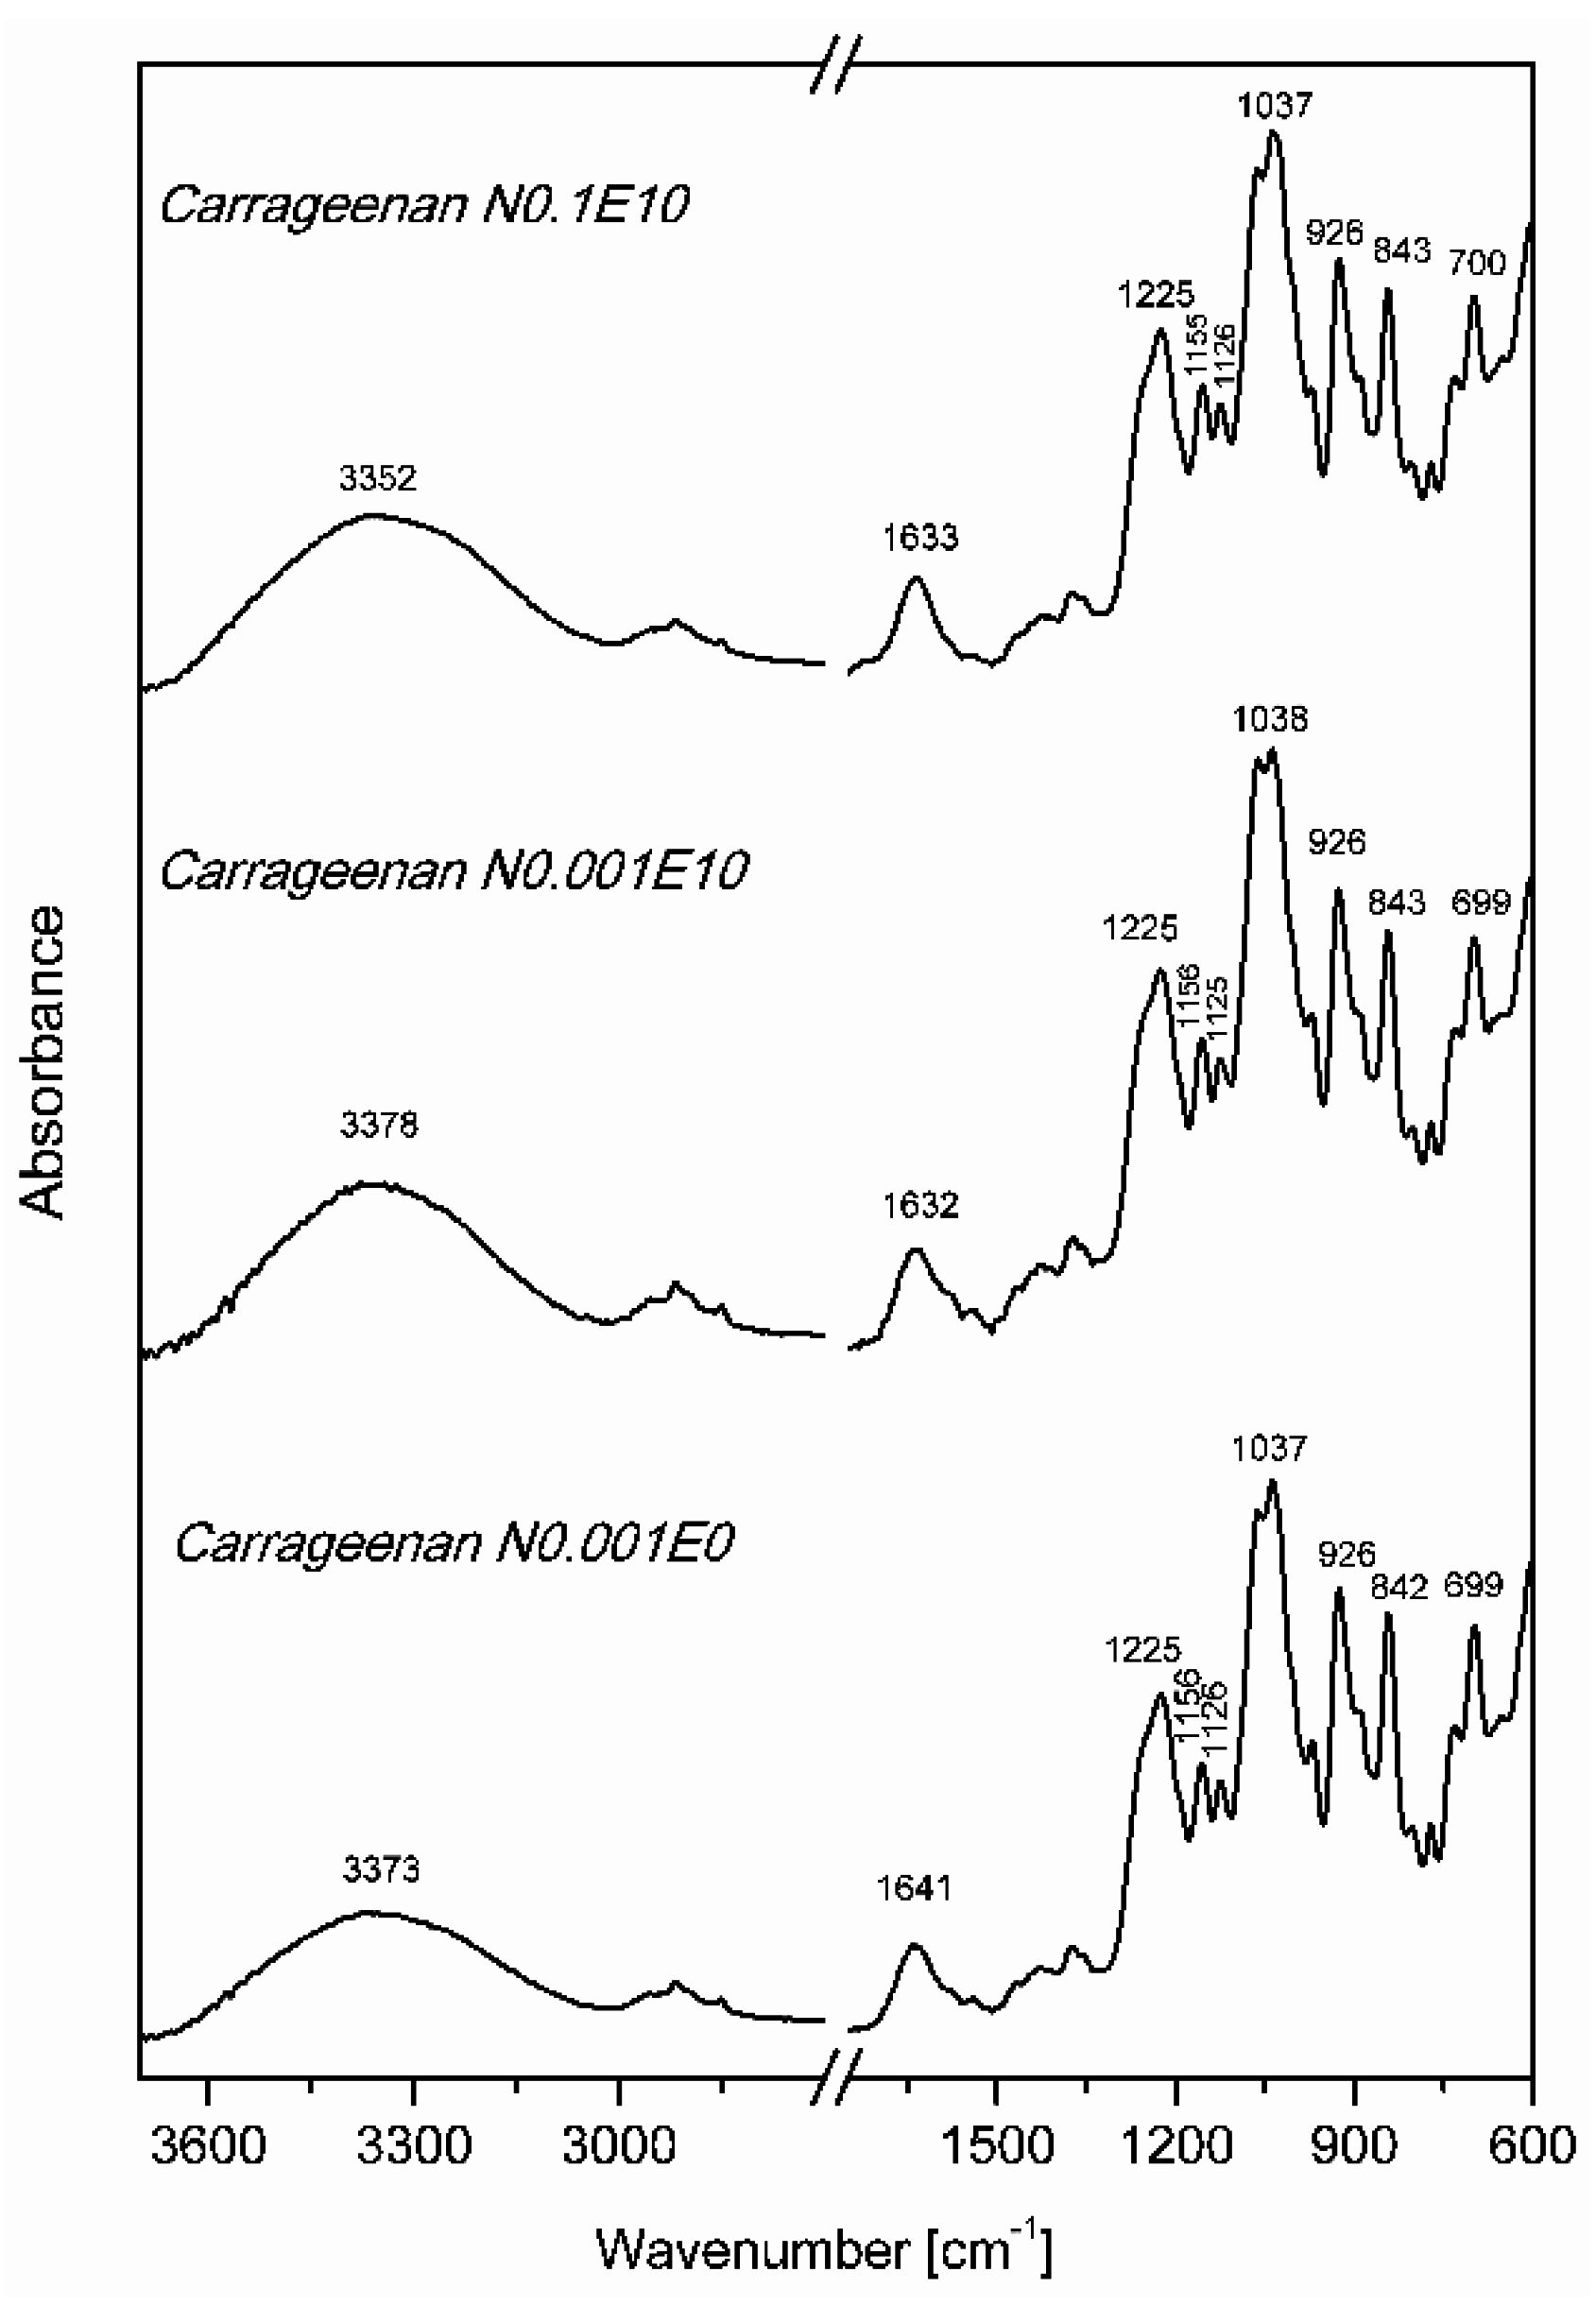
3.2. Fourier Transform Infrared Spectroscopy (FT IR)

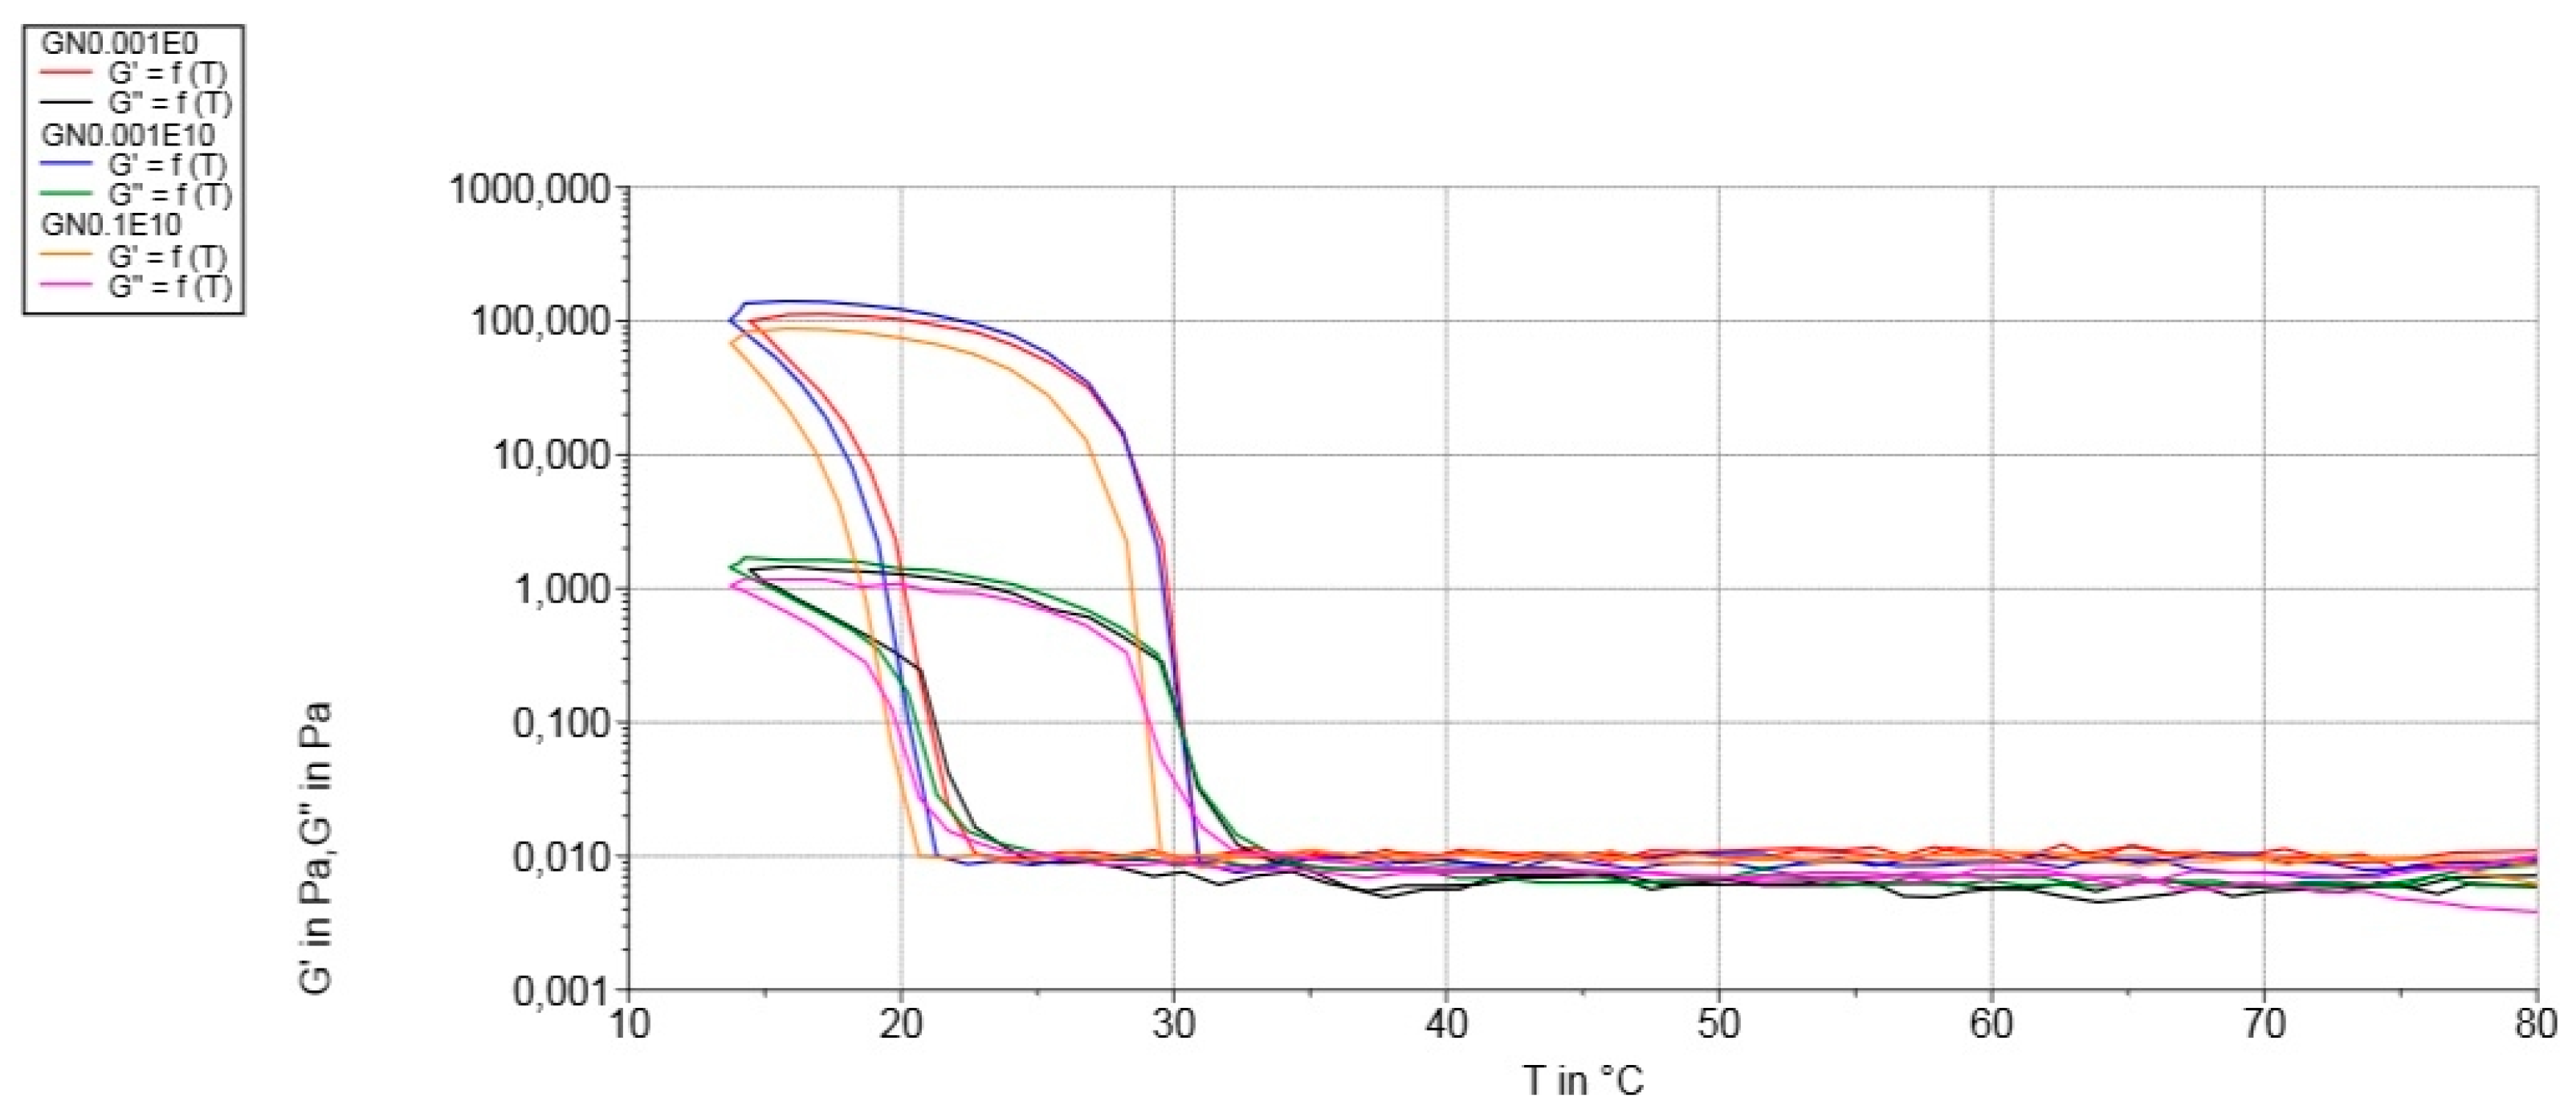
3.3. Rheological Measurements

3.4. Mechanical Properties
| Hydrocolloid | Variants | Hardness (H) | Springiness (S) | Gumminess (G) | Chewiness (CH) | Cohesiveness (C) |
|---|---|---|---|---|---|---|
| Carrageenan | CN0.001E0 | 93.63 c ± 4.84 | 0.36 b ± 0.02 | 3.62 c ± 0.11 | 1.30 bc ± 0.08 | 0.04 ab ± 0.01 |
| CN0.001E5 | 74.63 b ± 4.48 | 0.36 b ± 0.01 | 3.28 bc ± 0.22 | 1.24 bc ± 0.06 | 0.04 ab ± 0.01 | |
| CN0.001E10 | 61.77 ab ± 5.80 | 0.28 ab ± 0.06 | 2.33 ab ± 0.32 | 0.68 a ± 0.24 | 0.04 ab ± 0.01 | |
| CN0.01E0 | 101.93 c ± 4.11 | 0.33 ab ± 0.01 | 3.29 bc ± 0.54 | 1.29 bc ± 0.20 | 0.03 a ± 0.01 | |
| CN0.01E5 | 76.47 b ± 4.08 | 0.36 b ± 0.03 | 4.24 c ± 0.42 | 1.56 c ± 0.28 | 0.06 c ± 0.00 | |
| CN0.01E10 | 71.83 b ± 4.31 | 0.38 b ± 0.03 | 3.28 bc ± 0.27 | 1.28 bc ± 0.20 | 0.05 bc ± 0.00 | |
| CN0.1E0 | 65.37 b ± 3.04 | 0.37 b ± 0.01 | 3.90 c ± 0.32 | 1.57 c ± 0.01 | 0.05 bc ± 0.01 | |
| CN0.1E5 | 48.60 a ± 1.99 | 0.34 ab ± 0.02 | 2.24 a ± 0.13 | 0.78 ab ± 0.09 | 0.05 bc ± 0.00 | |
| CN0.1E10 | 63.20 ab ± 7.68 | 0.25 a ± 0.05 | 1.78 a ± 0.16 | 0.46 a ± 0.12 | 0.03 a ± 0.01 | |
| Gelatine | GN0.001E0 | 15.43 c ± 1.77 | 0.32 ab ± 0.05 | 0.62 a ± 0.26 | 0.19 a ± 0.14 | 0.06 a ± 0.01 |
| GN0.001E5 | 12.42 bc ± 1.57 | 0.34 ab ± 0.00 | 0.45 a ± 0.01 | 0.18 a ± 0.00 | 0.05 a ± 0.01 | |
| GN0.001E10 | 12.80 bc ± 1.96 | 0.34 ab ± 0.05 | 0.37 a ± 0.02 | 0.13 a ± 0.03 | 0.04 a ± 0.01 | |
| GN0.01E0 | 11.38 bc ± 1.15 | 0.34 ab ± 0.02 | 0.36 a ± 0.03 | 0.11 a ± 0.00 | 0.04 a ± 0.00 | |
| GN0.01E5 | 9.50 abc ± 1.85 | 0.40 abc ± 0.05 | 0.92 ab ± 0.01 | 0.41 ab ± 0.03 | 0.07 a ± 0.02 | |
| GN0.01E10 | 13.55 bc ± 2.88 | 0.49 c ± 0.07 | 1.34 b ± 0.50 | 0.73 b ± 0.36 | 0.09 a ± 0.01 | |
| GN0.1E0 | 8.39 ab ± 2.54 | 0.31 ab ± 0.00 | 0.34 a ± 0.04 | 0.10 a ± 0.01 | 0.08 a ± 0.01 | |
| GN0.1E5 | 4.68 a ± 1.22 | 0.29 a ± 0.05 | 0.33 a ± 0.03 | 0.10 a ± 0.02 | 0.08 a ± 0.02 | |
| GN0.1E10 | 11.95 bc ± 2.38 | 0.46 bc ± 0.05 | 0.71 a ± 0.04 | 0.30 a ± 0.01 | 0.10 a ± 0.04 |
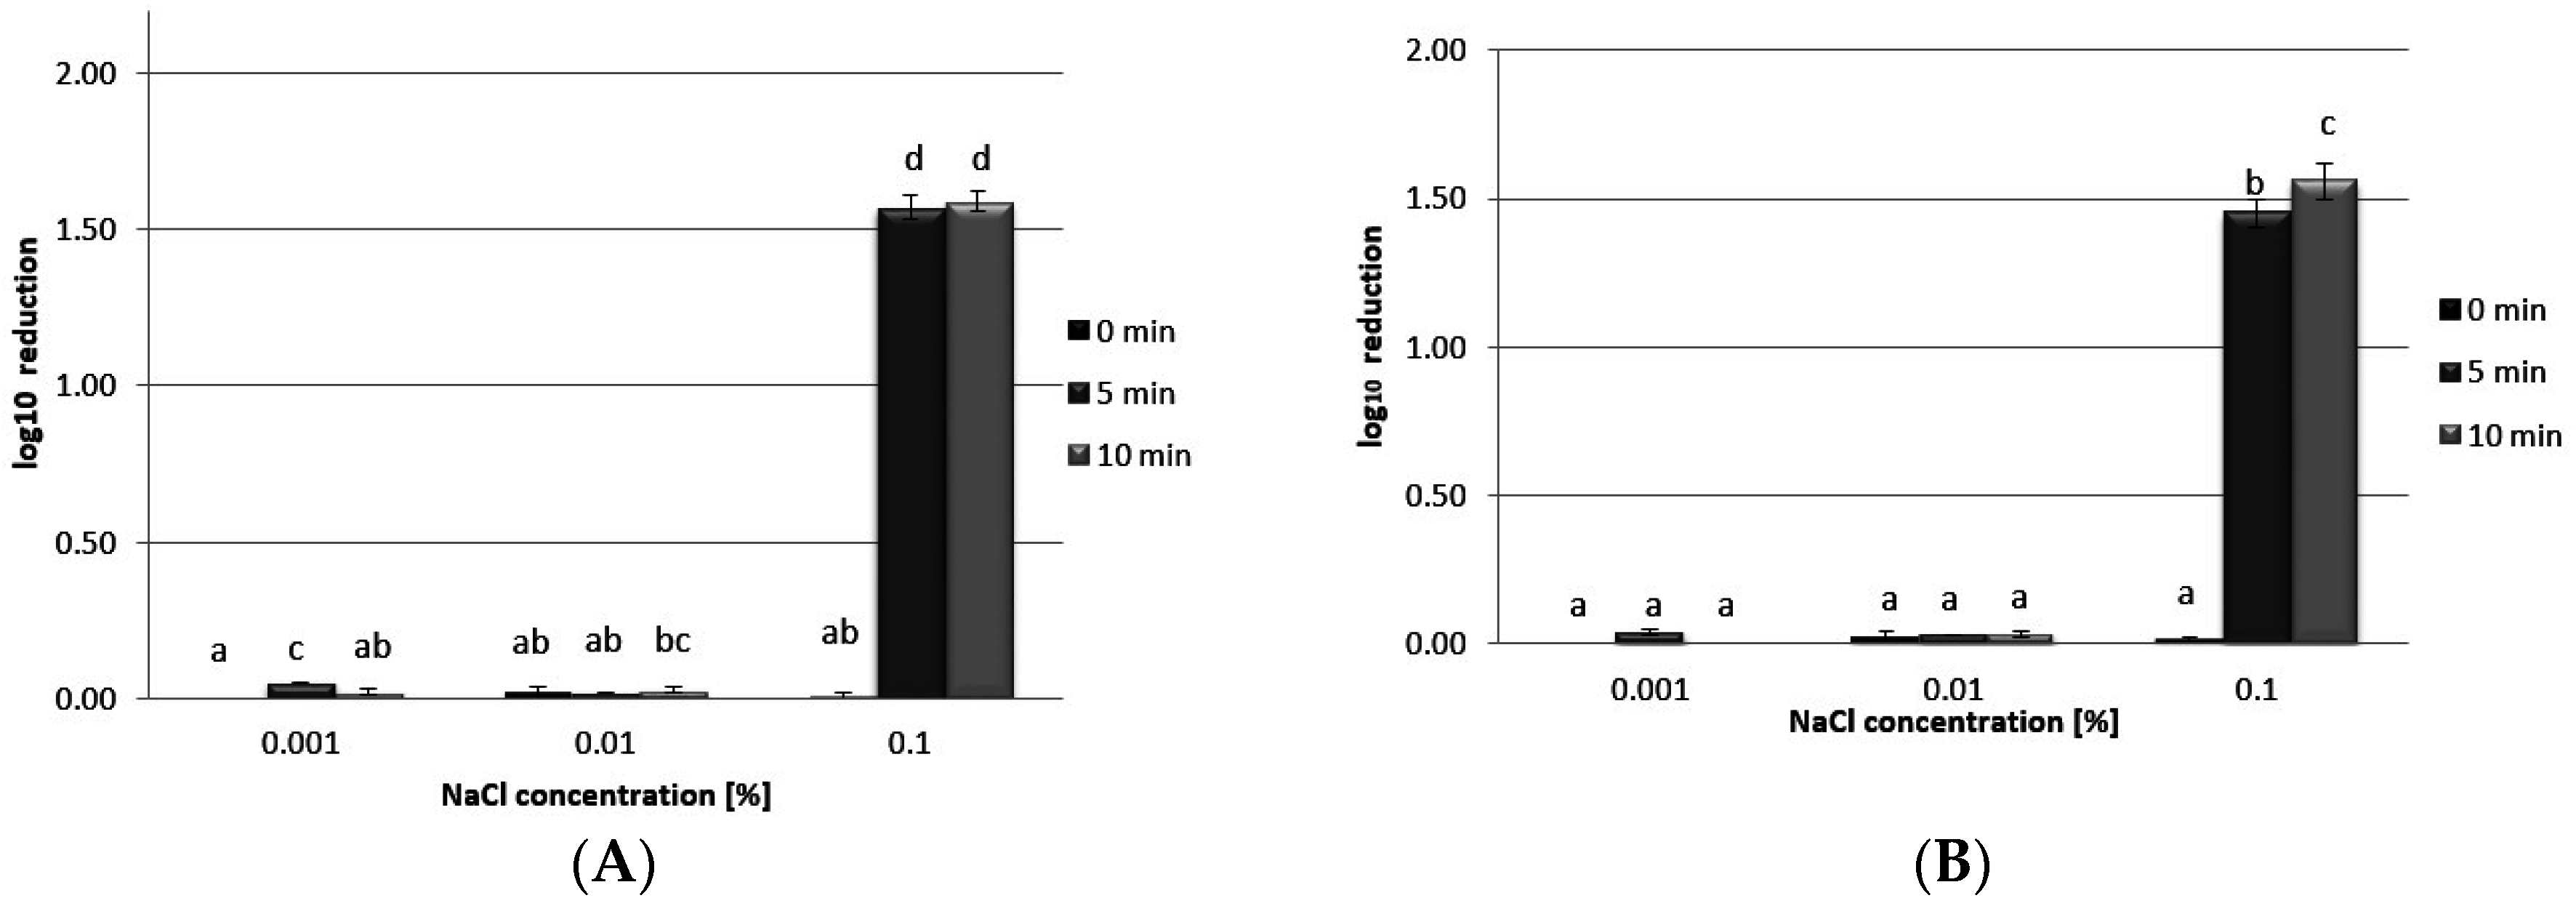
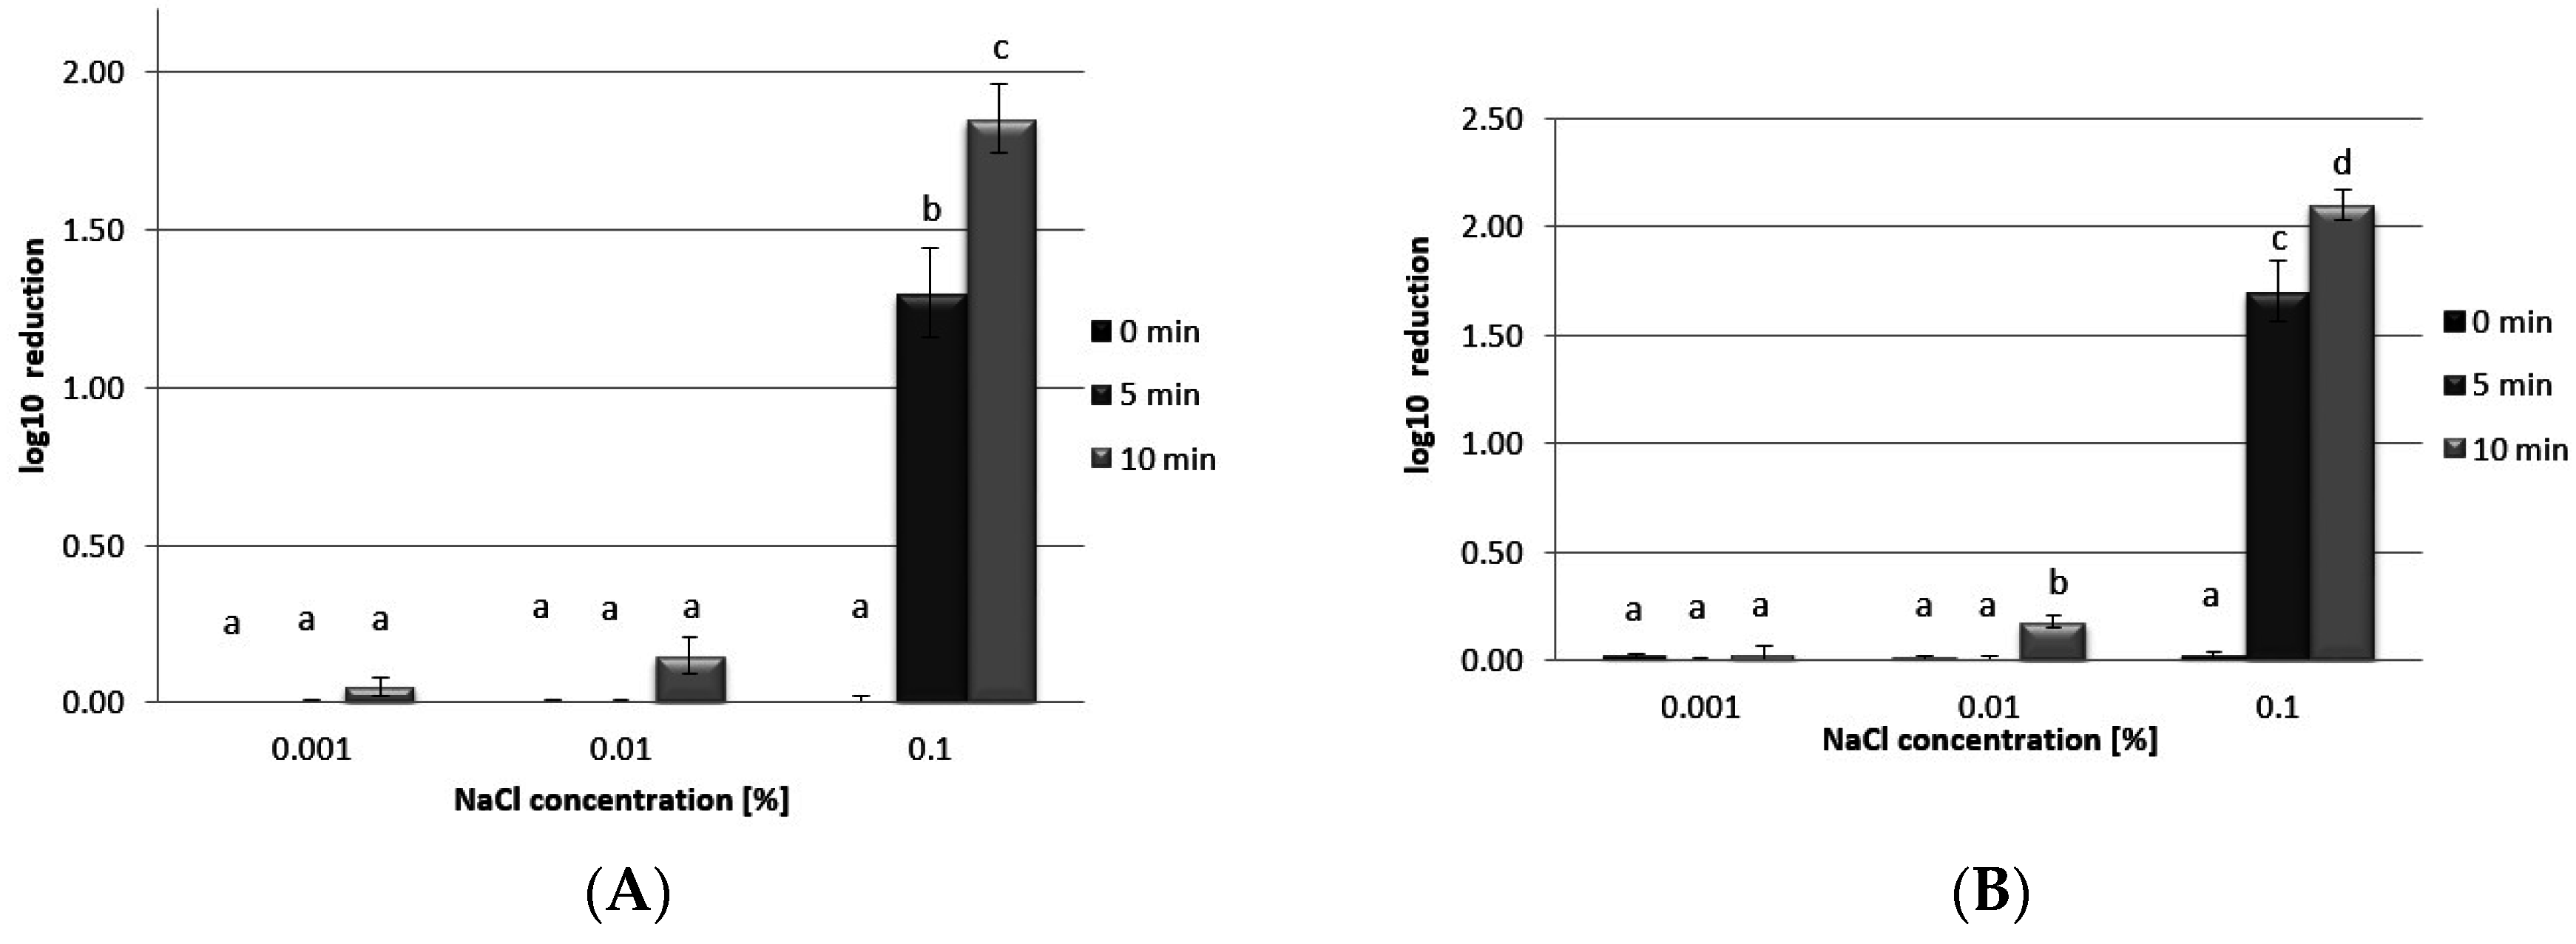
3.5. Antibacterial Activity
4. Conclusions
Acknowledgments
Author Contributions
Conflicts of Interest
References
- Ulbin-Figlewicz, N.; Zimoch-Korzycka, A.; Jarmoluk, A. Antibacterial activity and physical properties of edible chitosan films exposed to low-pressure plasma. Food Bioprocess Technol. 2014, 7, 3646–3654. [Google Scholar] [CrossRef]
- Brychcy, E.; Malik, M.; Drożdżewski, P.; Ulbin-Figlewicz, N.; Jarmoluk, A. Low-concentrated acidic electrolysed water treatment of pork: Inactivation of surface microbiota and changes in product quality. Int. J. Food Sci. Technol. 2015, 50, 2340–2350. [Google Scholar] [CrossRef]
- Rawdkuen, S.; Suthiluk, P.; Kamhangwong, D.; Benjakul, S. Mechanical, physic-chemical and antimicrobial properties of gelatin-based film incorporated with catechin-lysozyme. Chem. Cent. J. 2012, 6, 1–10. [Google Scholar] [CrossRef] [PubMed]
- Williams, P.; Philips, G. Handbook of Hydrocolloids, 2nd ed.; CRC Press: Cambridge, UK, 2000; pp. 1–19. [Google Scholar]
- Cierach, M.; Szaciło, K. The effect of carrageenans on the texture of low-fat breakfast sausages. Pol. J. Food Nutr. Sci. 2003, 12, 51–54. [Google Scholar]
- Thrimawithanaa, T.; Young, S.; Dunstanb, D.; Alanya, R. Texture and rheological characterization of kappa and iota carrageenan in the presence of counter ions. Carbohydr. Polym. 2010, 82, 69–77. [Google Scholar] [CrossRef]
- Briones, A.; Sato, T.; Bigol, U. Antibacterial activity of polyethylenimine/carrageenan multilayer against pathogenic bacteria. Adv. Chem. Eng. Sci. 2014, 4, 233–241. [Google Scholar] [CrossRef]
- Xing, Q.; Yates, K.; Vogt, C.; Qian, Z.; Frost, M.; Zhao, F. Increasing mechanical strength of gelatin hydrogels by divalent metal ion removal. Sci. Rep. 2014, 4, 1–10. [Google Scholar] [CrossRef] [PubMed]
- Mori, Y.; Komatsu, S.; Hata, Y. Toxicity of electrolyzed strong acid aqueous solution-subacute toxicity test and effect on oral tissue in rats. Odontology 1997, 84, 619–626. [Google Scholar]
- Ren, T.; Su, Y.C. Effects of electrolyzed oxidizing water treatment on reducing Vibrio parahaemolyticus and Vibrio vulnificus in raw oysters. J. Food Prot. 2006, 69, 1829–1834. [Google Scholar] [PubMed]
- The American Public Health Assoc (APHA). Standard Methods for the Examination of Water and Wastewater, 20th ed.; American Public Health Association, Inc.: Washington, DC, USA, 1998. [Google Scholar]
- Lau, M.H.; Tang, J.; Paulson, A.T. Texture profile and turbidity of gellan/gelatin mixed gels. Food Res. Int. 2000, 33, 665–671. [Google Scholar] [CrossRef]
- Al-Haq, M.; Sugiyama, J.; Isobe, S. Applications of electrolyzed water in agriculture & food industries. Food Sci. Technol. Res. 2005, 11, 135–150. [Google Scholar]
- Brychcy, E.; Jarmoluk, A.; Marycz, K. Impact of low-concentrated acidic electrolysed water obtained by membrane electrolysis on the decontamination of meat microbiota. Bull. Vet. Inst. Pulawy 2015, 59, 369–376. [Google Scholar] [CrossRef]
- Dion, B.; Ruzbie, M.; van de Voort, F.R.; Ismail, A.A.; Blais, J.S. Determination of protein and fat in meat by transmission Fourier transform infrared spectrometry. Analyst 1994, 119, 1765–1771. [Google Scholar] [CrossRef]
- Hoque, M.S.; Benjakul, S.; Prodpran, T. Effect of heat treatment of film-forming solution on the properties of film from cuttlefish (Sepia pharaonis) skin gelation. J. Food Eng. 2010, 96, 66–73. [Google Scholar] [CrossRef]
- Bajpai, A.K.; Choubey, J. Design of gelatin nanoparticles as swelling controlled delivery system for chloroquine phosphate. J. Mater. Sci. Mater. Med. 2006, 17, 345–358. [Google Scholar] [CrossRef] [PubMed]
- Barth, A.; Zscherp, C. What vibrations tell us about proteins. Q. Rev. Biophys. 2002, 35, 369–430. [Google Scholar] [CrossRef] [PubMed]
- Sen, M.; Erboz, E.N. Determination of critical gelation conditions of κ-carrageenan by viscosimetric and FT-IR analyses. Food Res. Int. 2010, 43, 1361–1364. [Google Scholar] [CrossRef]
- Bandekar, J. Amide modes and protein conformation. Biochim. Biophys. Acta 1992, 1120, 123–143. [Google Scholar] [CrossRef]
- Prado, F.J.; Rodriguez, V.J.A.; Tojo, E.; Andrade, J.M. Quantitation of κ, l- and λ-carrageenans by mid-infrared spectroscopy and PLS regression. Anal. Chim. Acta 2003, 480, 23–37. [Google Scholar] [CrossRef]
- Vinceković, M.; Pustak, A.; Lj, F.; Liu, G.; Ungar, M.; Bujan, I.; Filipović-Vinceković, N. Structural and thermal study of mesomorphic dodecylammonium carrageenates. J. Colloid Interface Sci. 2010, 1, 117–123. [Google Scholar] [CrossRef] [PubMed]
- Cuvelier, G.; Launay, B.; Michon, C. Concentration dependence of the critical viscoelastic properties of gelatin at the gel point. Rheol. Acta 1993, 32, 94–103. [Google Scholar]
- Chatterjee, S.; Bohidar, H. Effect of salt and temperature on viscoelasticity of gelatin hydrogels. J. Surf. Sci. Technol. 2006, 22, 1–13. [Google Scholar]
- Huang, Y.; Hung, Y.; Hsu, S.; Hwang, D. Application of electrolyzed water in the food industry. Food Control 2008, 19, 329–345. [Google Scholar] [CrossRef]
- Jones, G.M.J. Rheological Properties of Gelatin, Carrageenan and Locust Bean Gum Mixtures. Ph.D. Thesis, University of Nottingham, Nottingham, UK, 2004. [Google Scholar]
- Sołowiej, B.; Gustaw, W.; Mleko, S. Wpływ wybranych czynników na żelowanie ĸ- i Ɩ- karagenu. Żywność Nauka Technol. Jakość 2005, 2, 193–202. [Google Scholar]
- Rahman, M.S.; Al-Mahrouqi, A.I. Instrumental texture profile analysis of gelatin gel extracted from grouper skin and commercial (bovine and porcine) gelatin gels. Int. J. Food Sci. Nutr. 2009, 7, 229–234. [Google Scholar] [CrossRef] [PubMed]
- Kim, C.; Hung, Y.; Brackett, R. Efficacy of electrolyzed oxidizing (EO) and chemically modified water on different types of foodborne pathogens. Int. J. Food Microbiol. 2000, 61, 199–207. [Google Scholar] [CrossRef]
- Park, H.; Hung, Y.; Kim, C. Effectiveness of electrolyzed water as a sanitizer for treating different surfaces. J. Food Prot. 2002, 65, 1276–1280. [Google Scholar] [PubMed]
- Venkitanarayanan, K.; Ezeike, G.; Hung, Y.; Doyle, M. Efficacy of electrolyzed oxidizing water for inactivating. Appl. Environ. Microbiol. 1999, 65, 4276–4279. [Google Scholar] [PubMed]
- Huang, A.L.; Lai, V.M.; Lii, C.Y. Rheological properties and phase transition of red algal polysaccharide-starch composites. Food Hydrocoll. 1999, 13, 409–418. [Google Scholar]
- Issa-Zacharia, A.; Kamitani, Y.; Muhimbula, H.; Ndabikunze, B. A review of microbiological safety of fruits and vegetables and the introduction of electrolyzed water as an alternative to sodium hypochlorite solution. Afr. J. Food Sci. 2010, 4, 778–789. [Google Scholar]
© 2015 by the authors; licensee MDPI, Basel, Switzerland. This article is an open access article distributed under the terms and conditions of the Creative Commons by Attribution (CC-BY) license (http://creativecommons.org/licenses/by/4.0/).
Share and Cite
Brychcy, E.; Malik, M.; Drożdżewski, P.; Król, Ż.; Jarmoluk, A. Physicochemical and Antibacterial Properties of Carrageenan and Gelatine Hydrosols and Hydrogels Incorporated with Acidic Electrolyzed Water. Polymers 2015, 7, 2638-2649. https://doi.org/10.3390/polym7121534
Brychcy E, Malik M, Drożdżewski P, Król Ż, Jarmoluk A. Physicochemical and Antibacterial Properties of Carrageenan and Gelatine Hydrosols and Hydrogels Incorporated with Acidic Electrolyzed Water. Polymers. 2015; 7(12):2638-2649. https://doi.org/10.3390/polym7121534
Chicago/Turabian StyleBrychcy, Ewa, Magdalena Malik, Piotr Drożdżewski, Żaneta Król, and Andrzej Jarmoluk. 2015. "Physicochemical and Antibacterial Properties of Carrageenan and Gelatine Hydrosols and Hydrogels Incorporated with Acidic Electrolyzed Water" Polymers 7, no. 12: 2638-2649. https://doi.org/10.3390/polym7121534
APA StyleBrychcy, E., Malik, M., Drożdżewski, P., Król, Ż., & Jarmoluk, A. (2015). Physicochemical and Antibacterial Properties of Carrageenan and Gelatine Hydrosols and Hydrogels Incorporated with Acidic Electrolyzed Water. Polymers, 7(12), 2638-2649. https://doi.org/10.3390/polym7121534