
Study of Morphology, Rheology, and Dynamic Properties toward Unveiling the Partial Miscibility in Poly(lactic acid)—Poly(hydroxybutyrate-co-hydroxyvalerate) Blends


Abstract
:1. Introduction
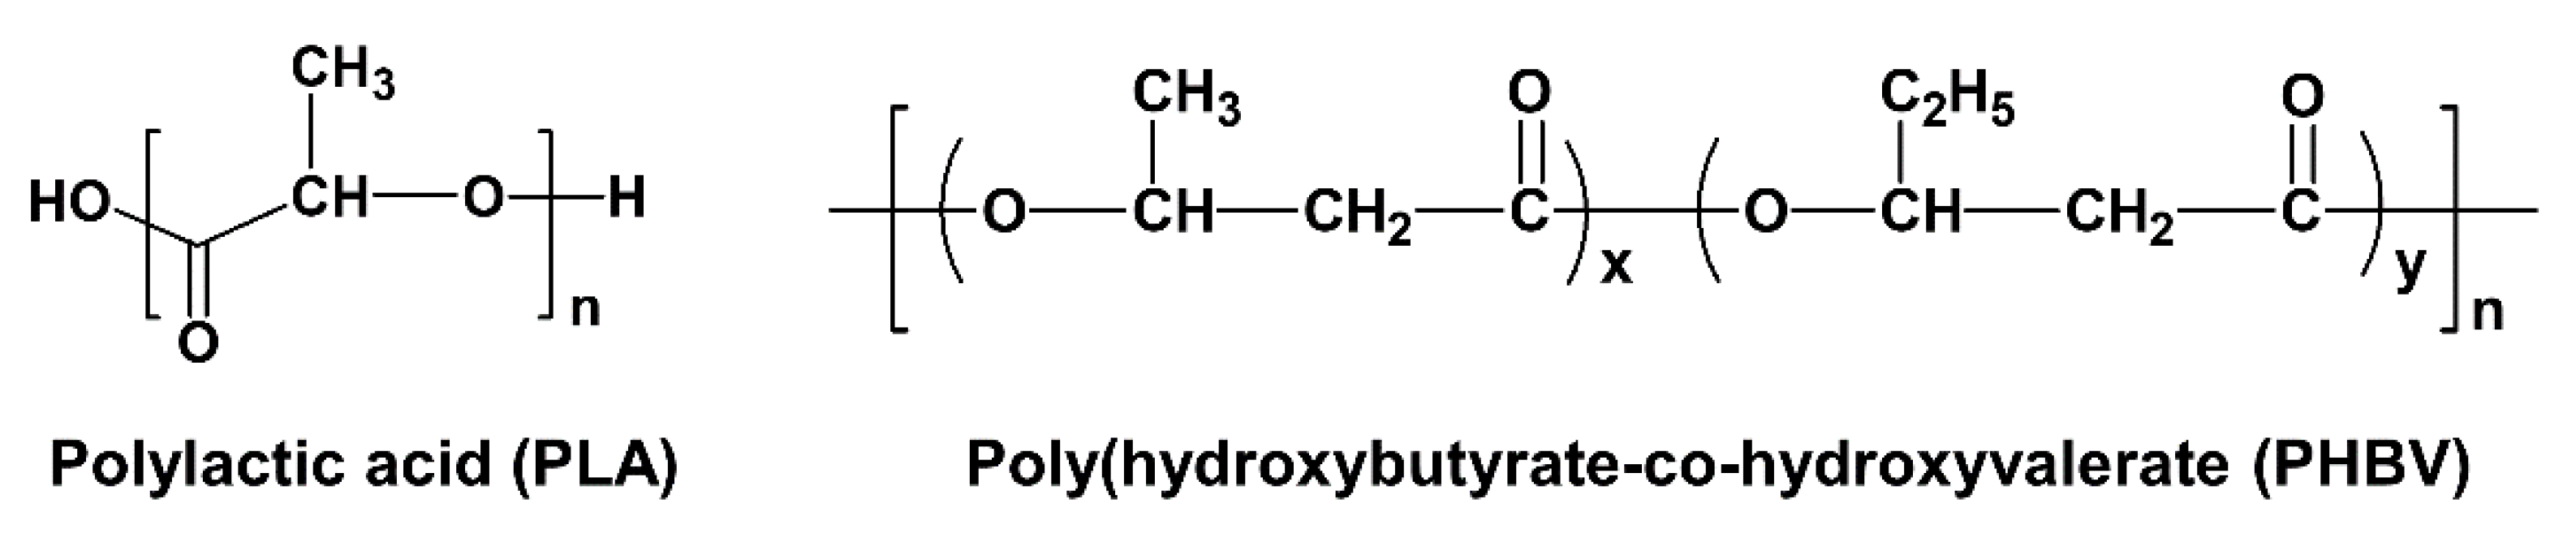
2. Materials
3. Preparation of Biopolymer Blends
4. Characterization Methods
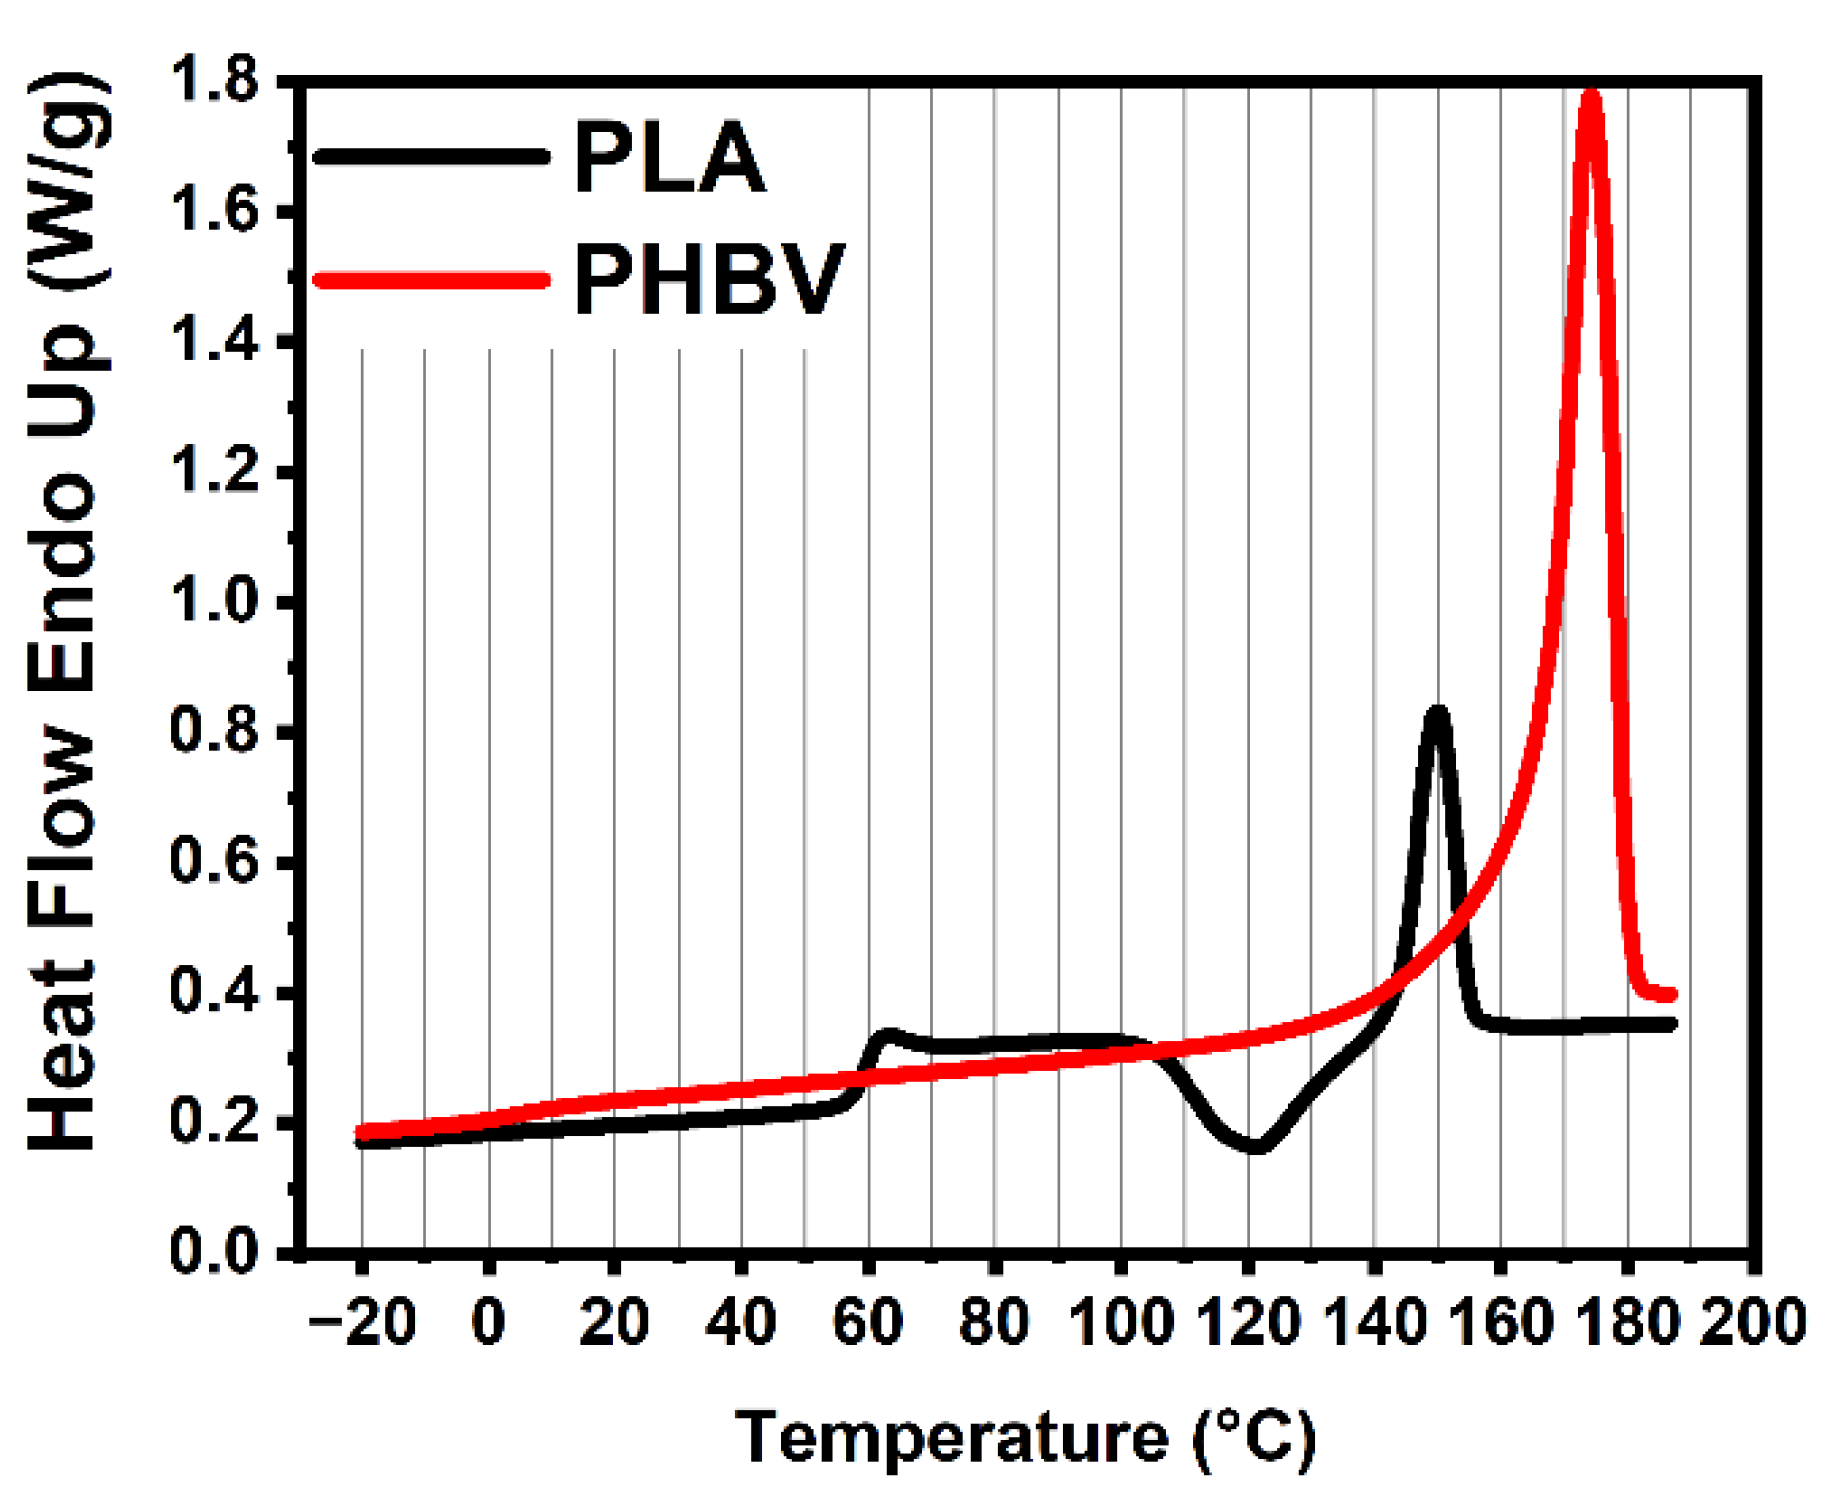
4.1. Differential Scanning Calorimetry
4.2. Thermogravimetric Analysis (TGA)
4.3. Size Exclusion Chromatography (SEC)
4.4. Morphological Characterizations
4.5. Dynamic Mechanical Analysis (DMA)
4.6. Small Amplitude Oscillatory Shear (SAOS) Measurements
4.7. Interfacial Tension Analysis
4.8. Dielectric Relaxation Spectroscopy (DRS)
5. Results
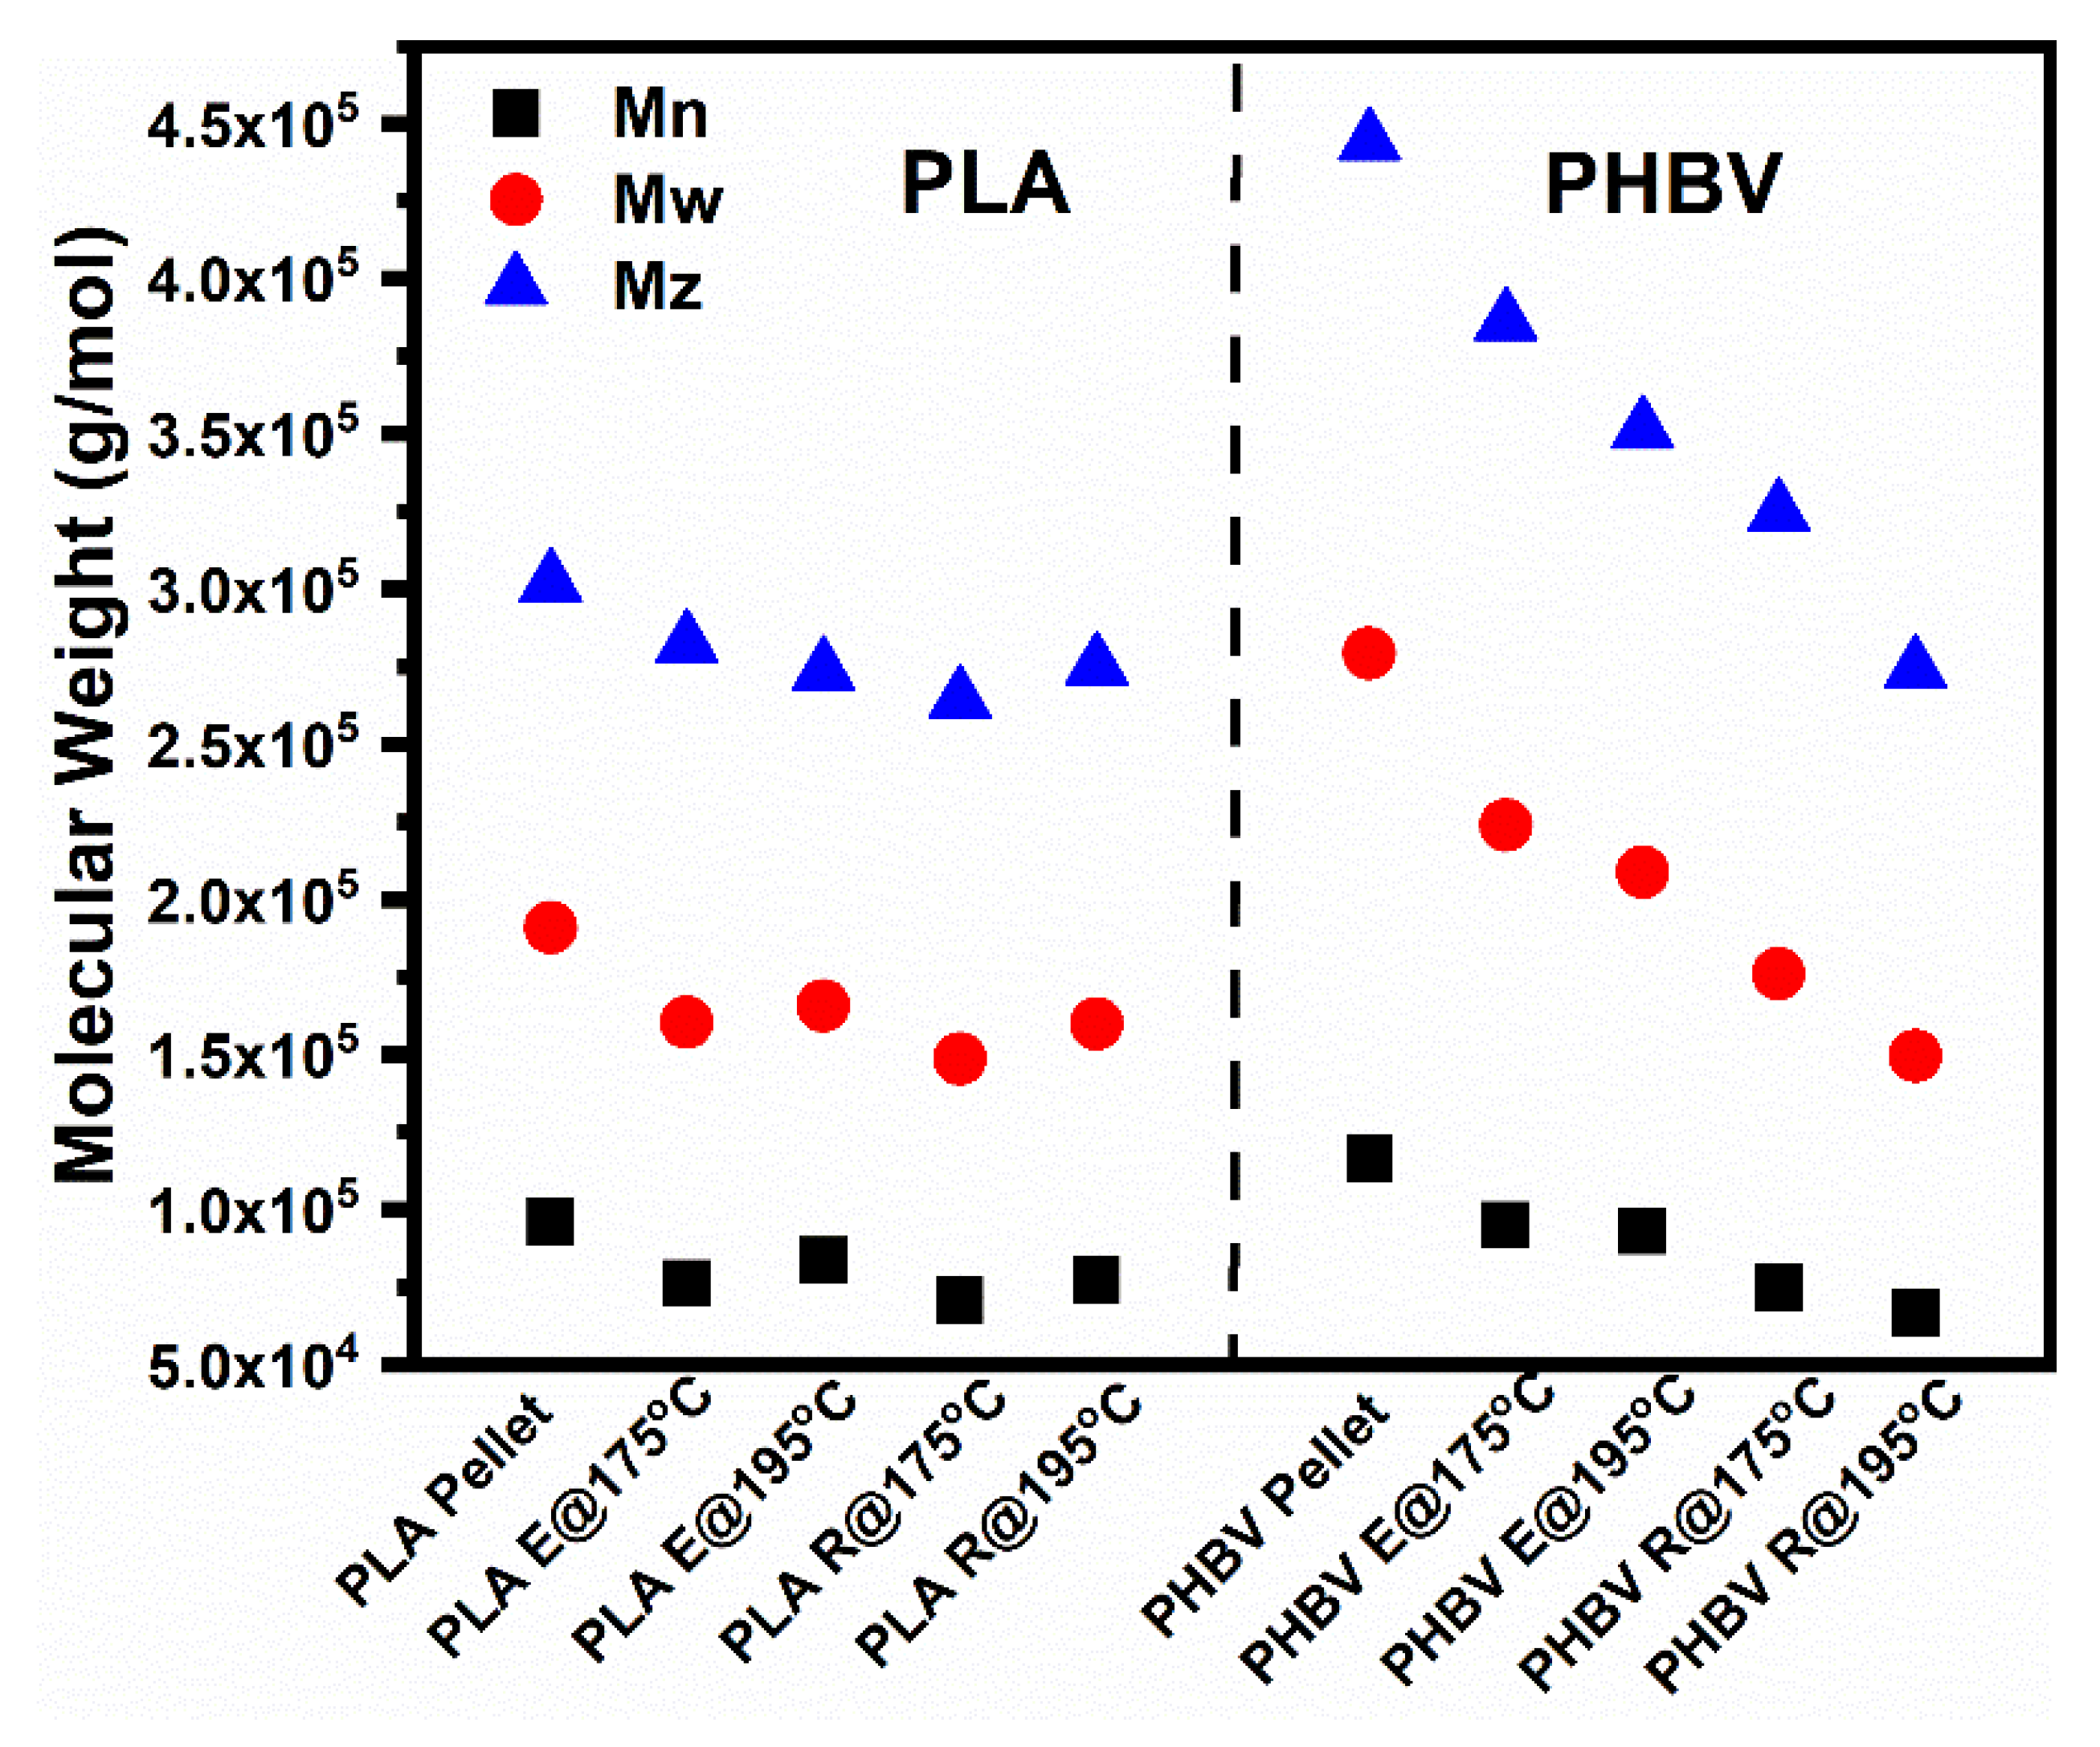
5.1. Measurement of Thermal Stabilities
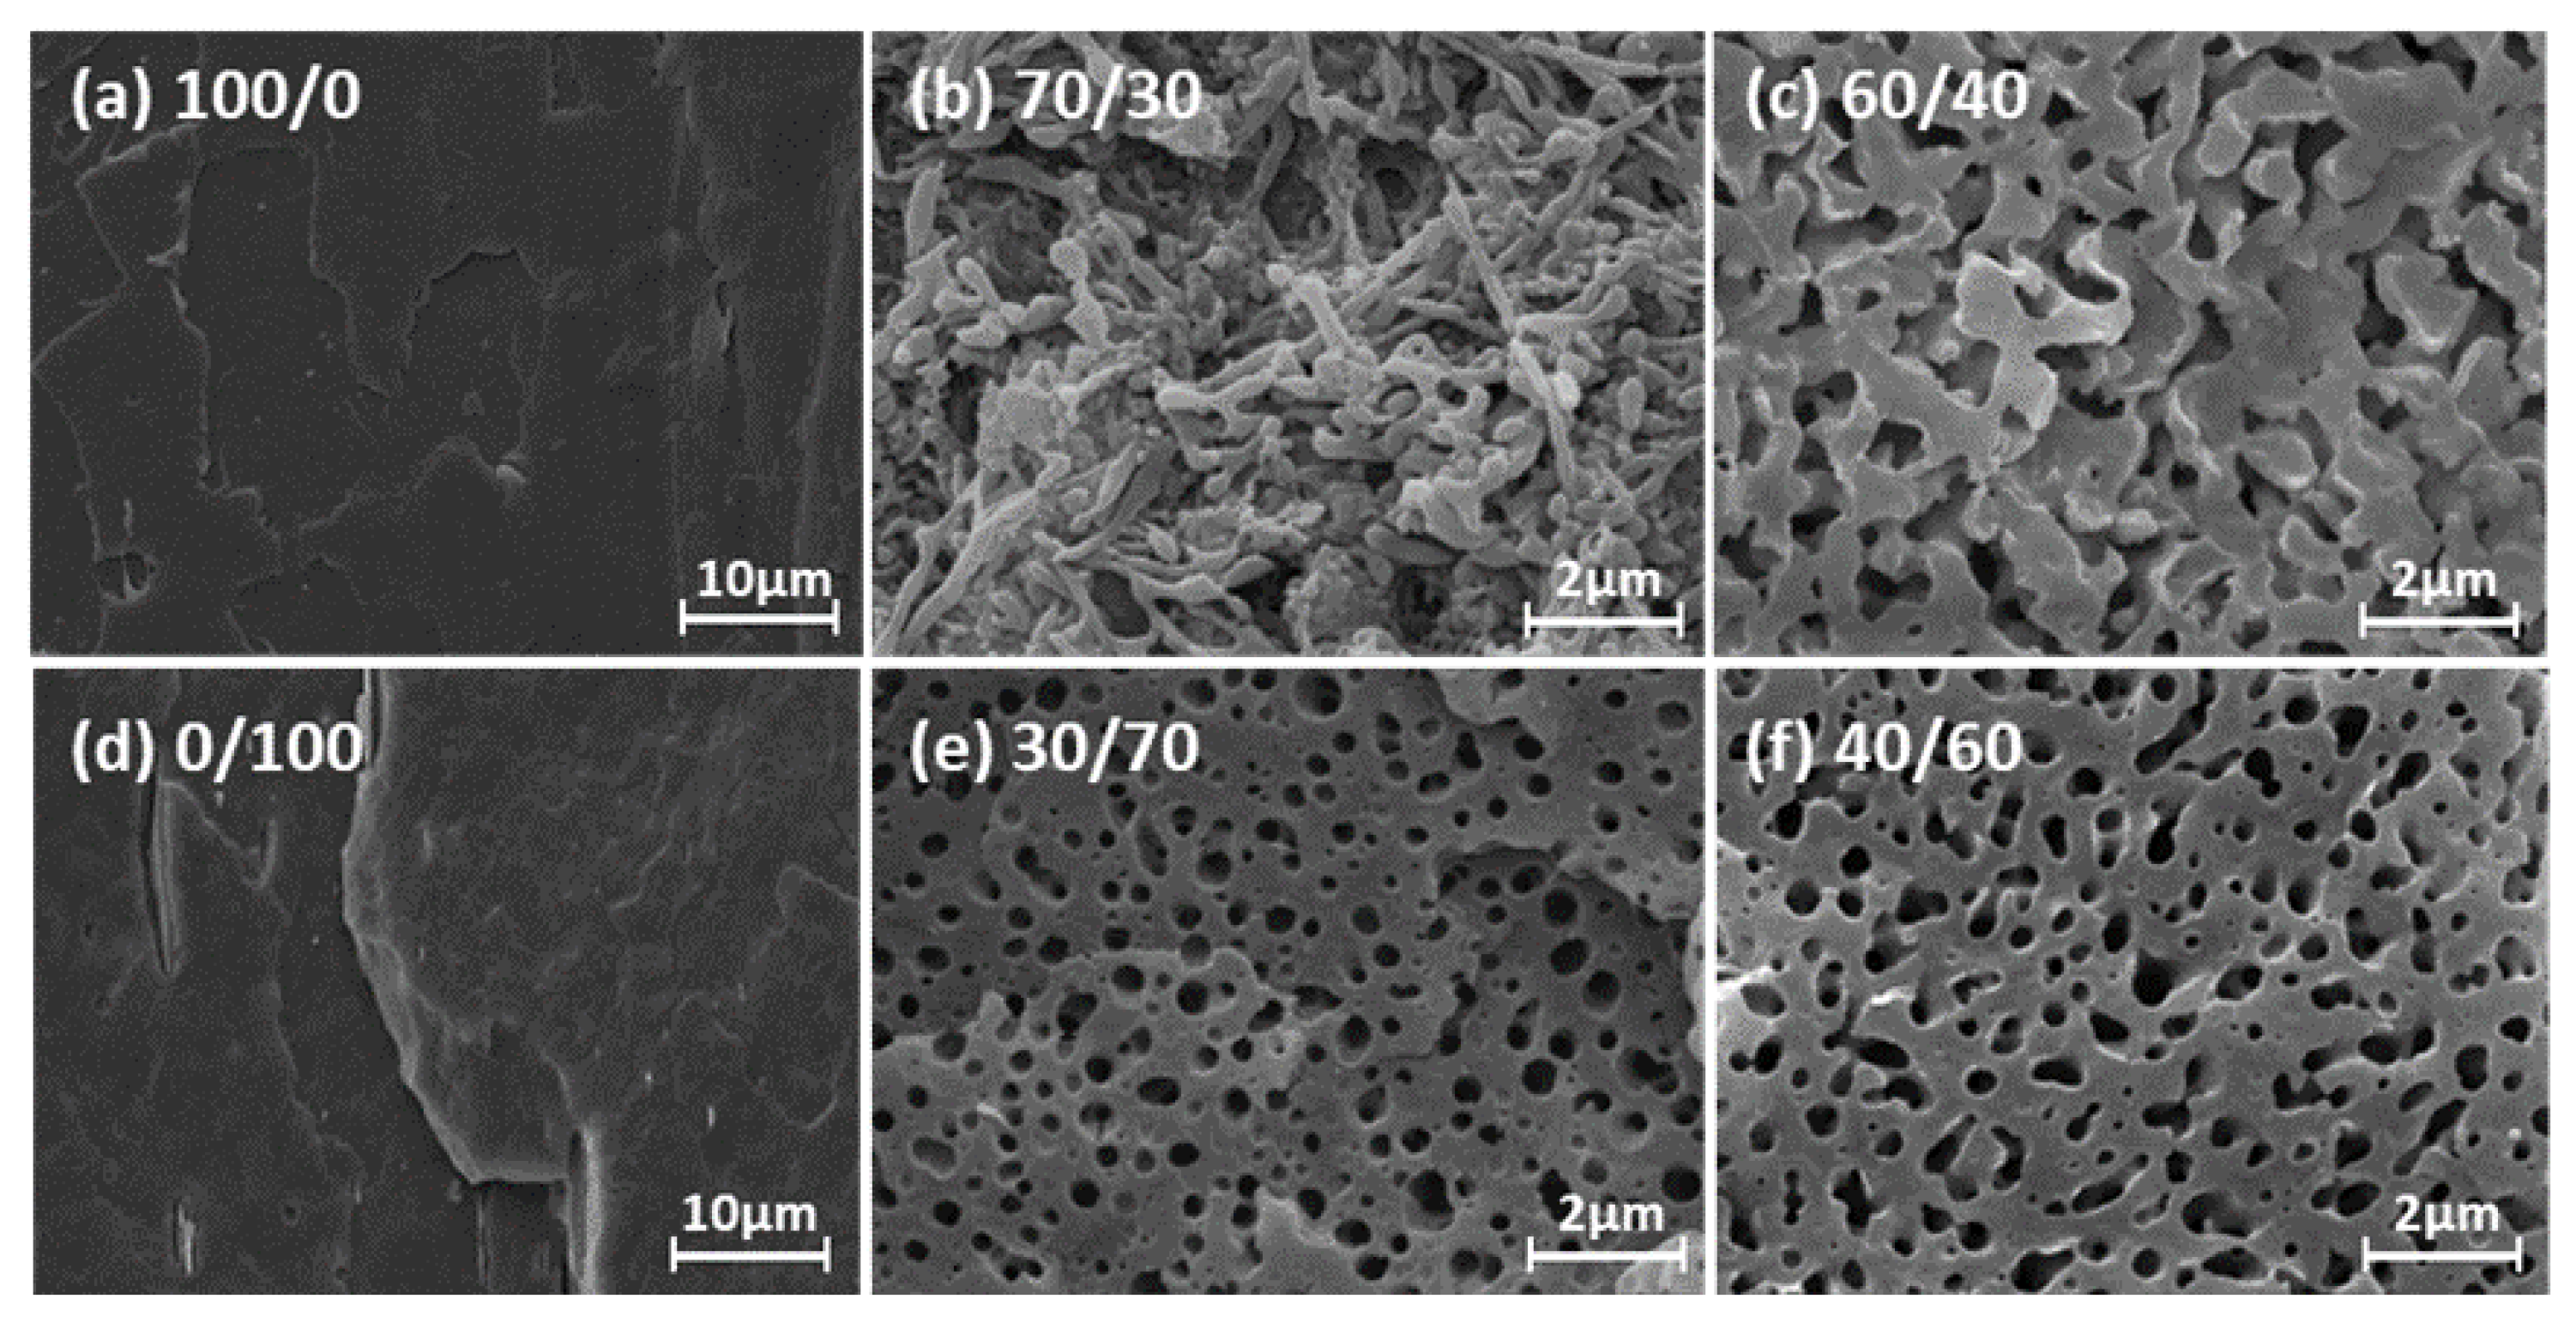
5.2. Morphology for PLA/PHBV Blends
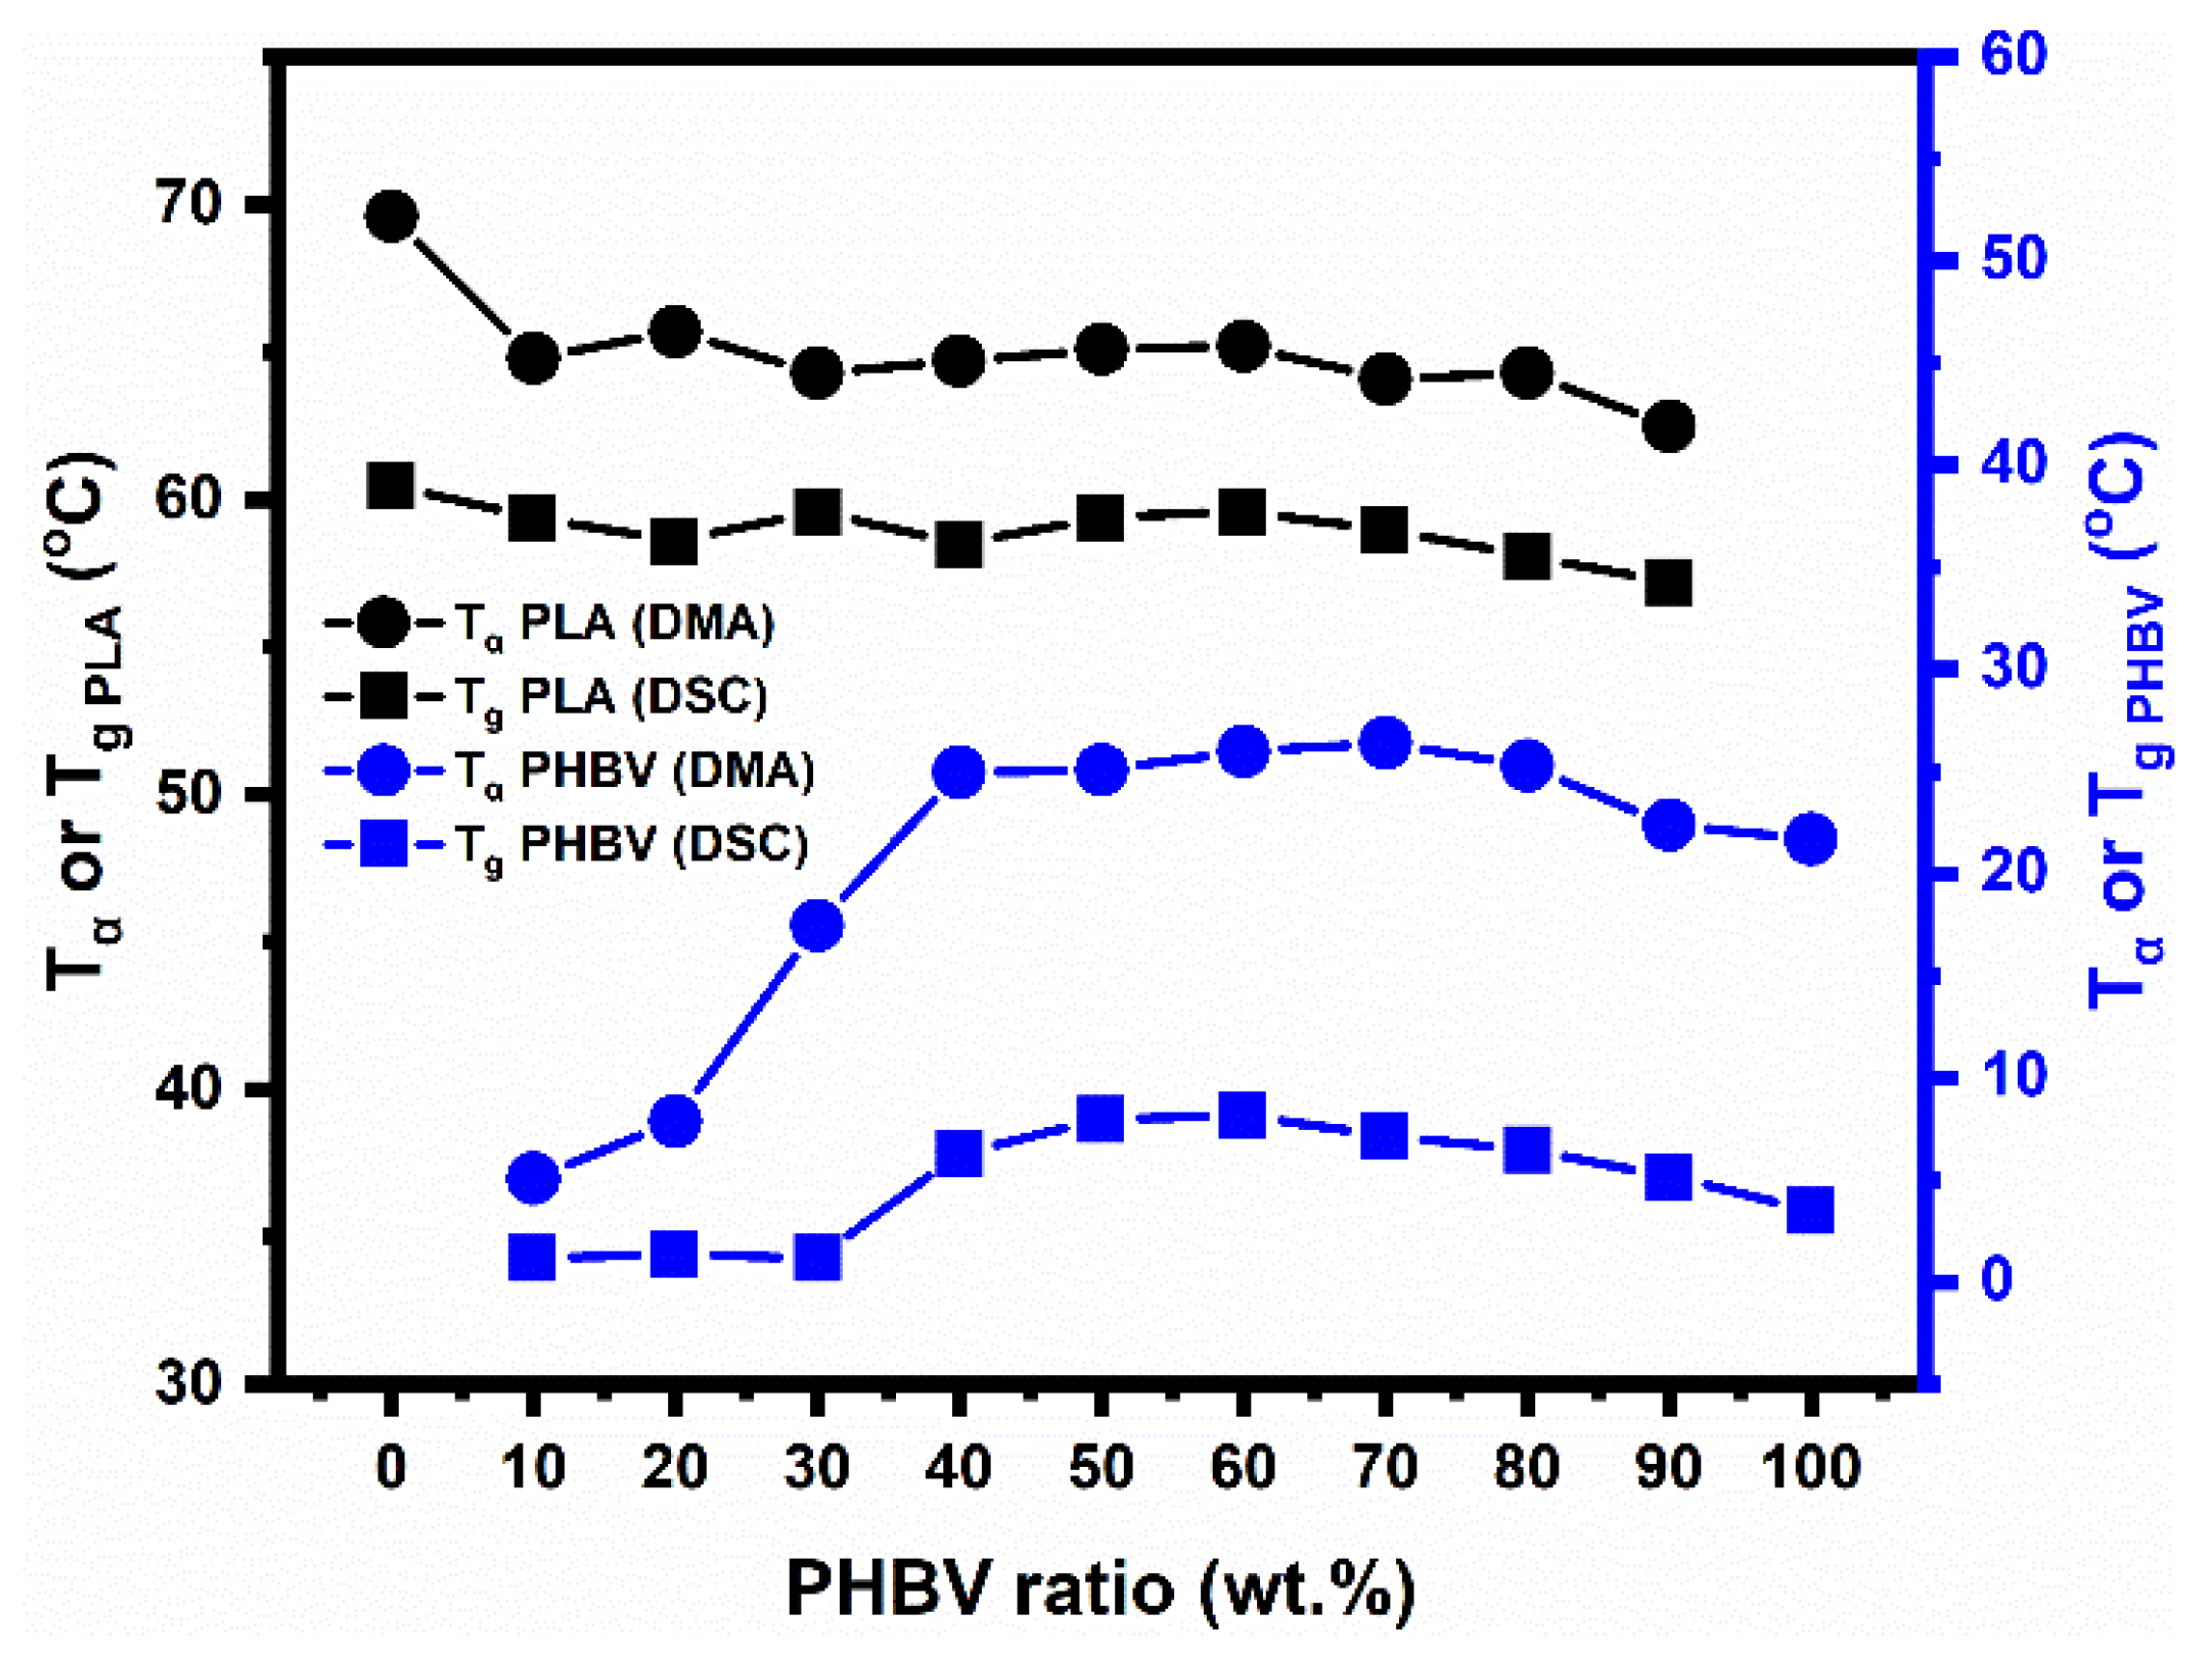
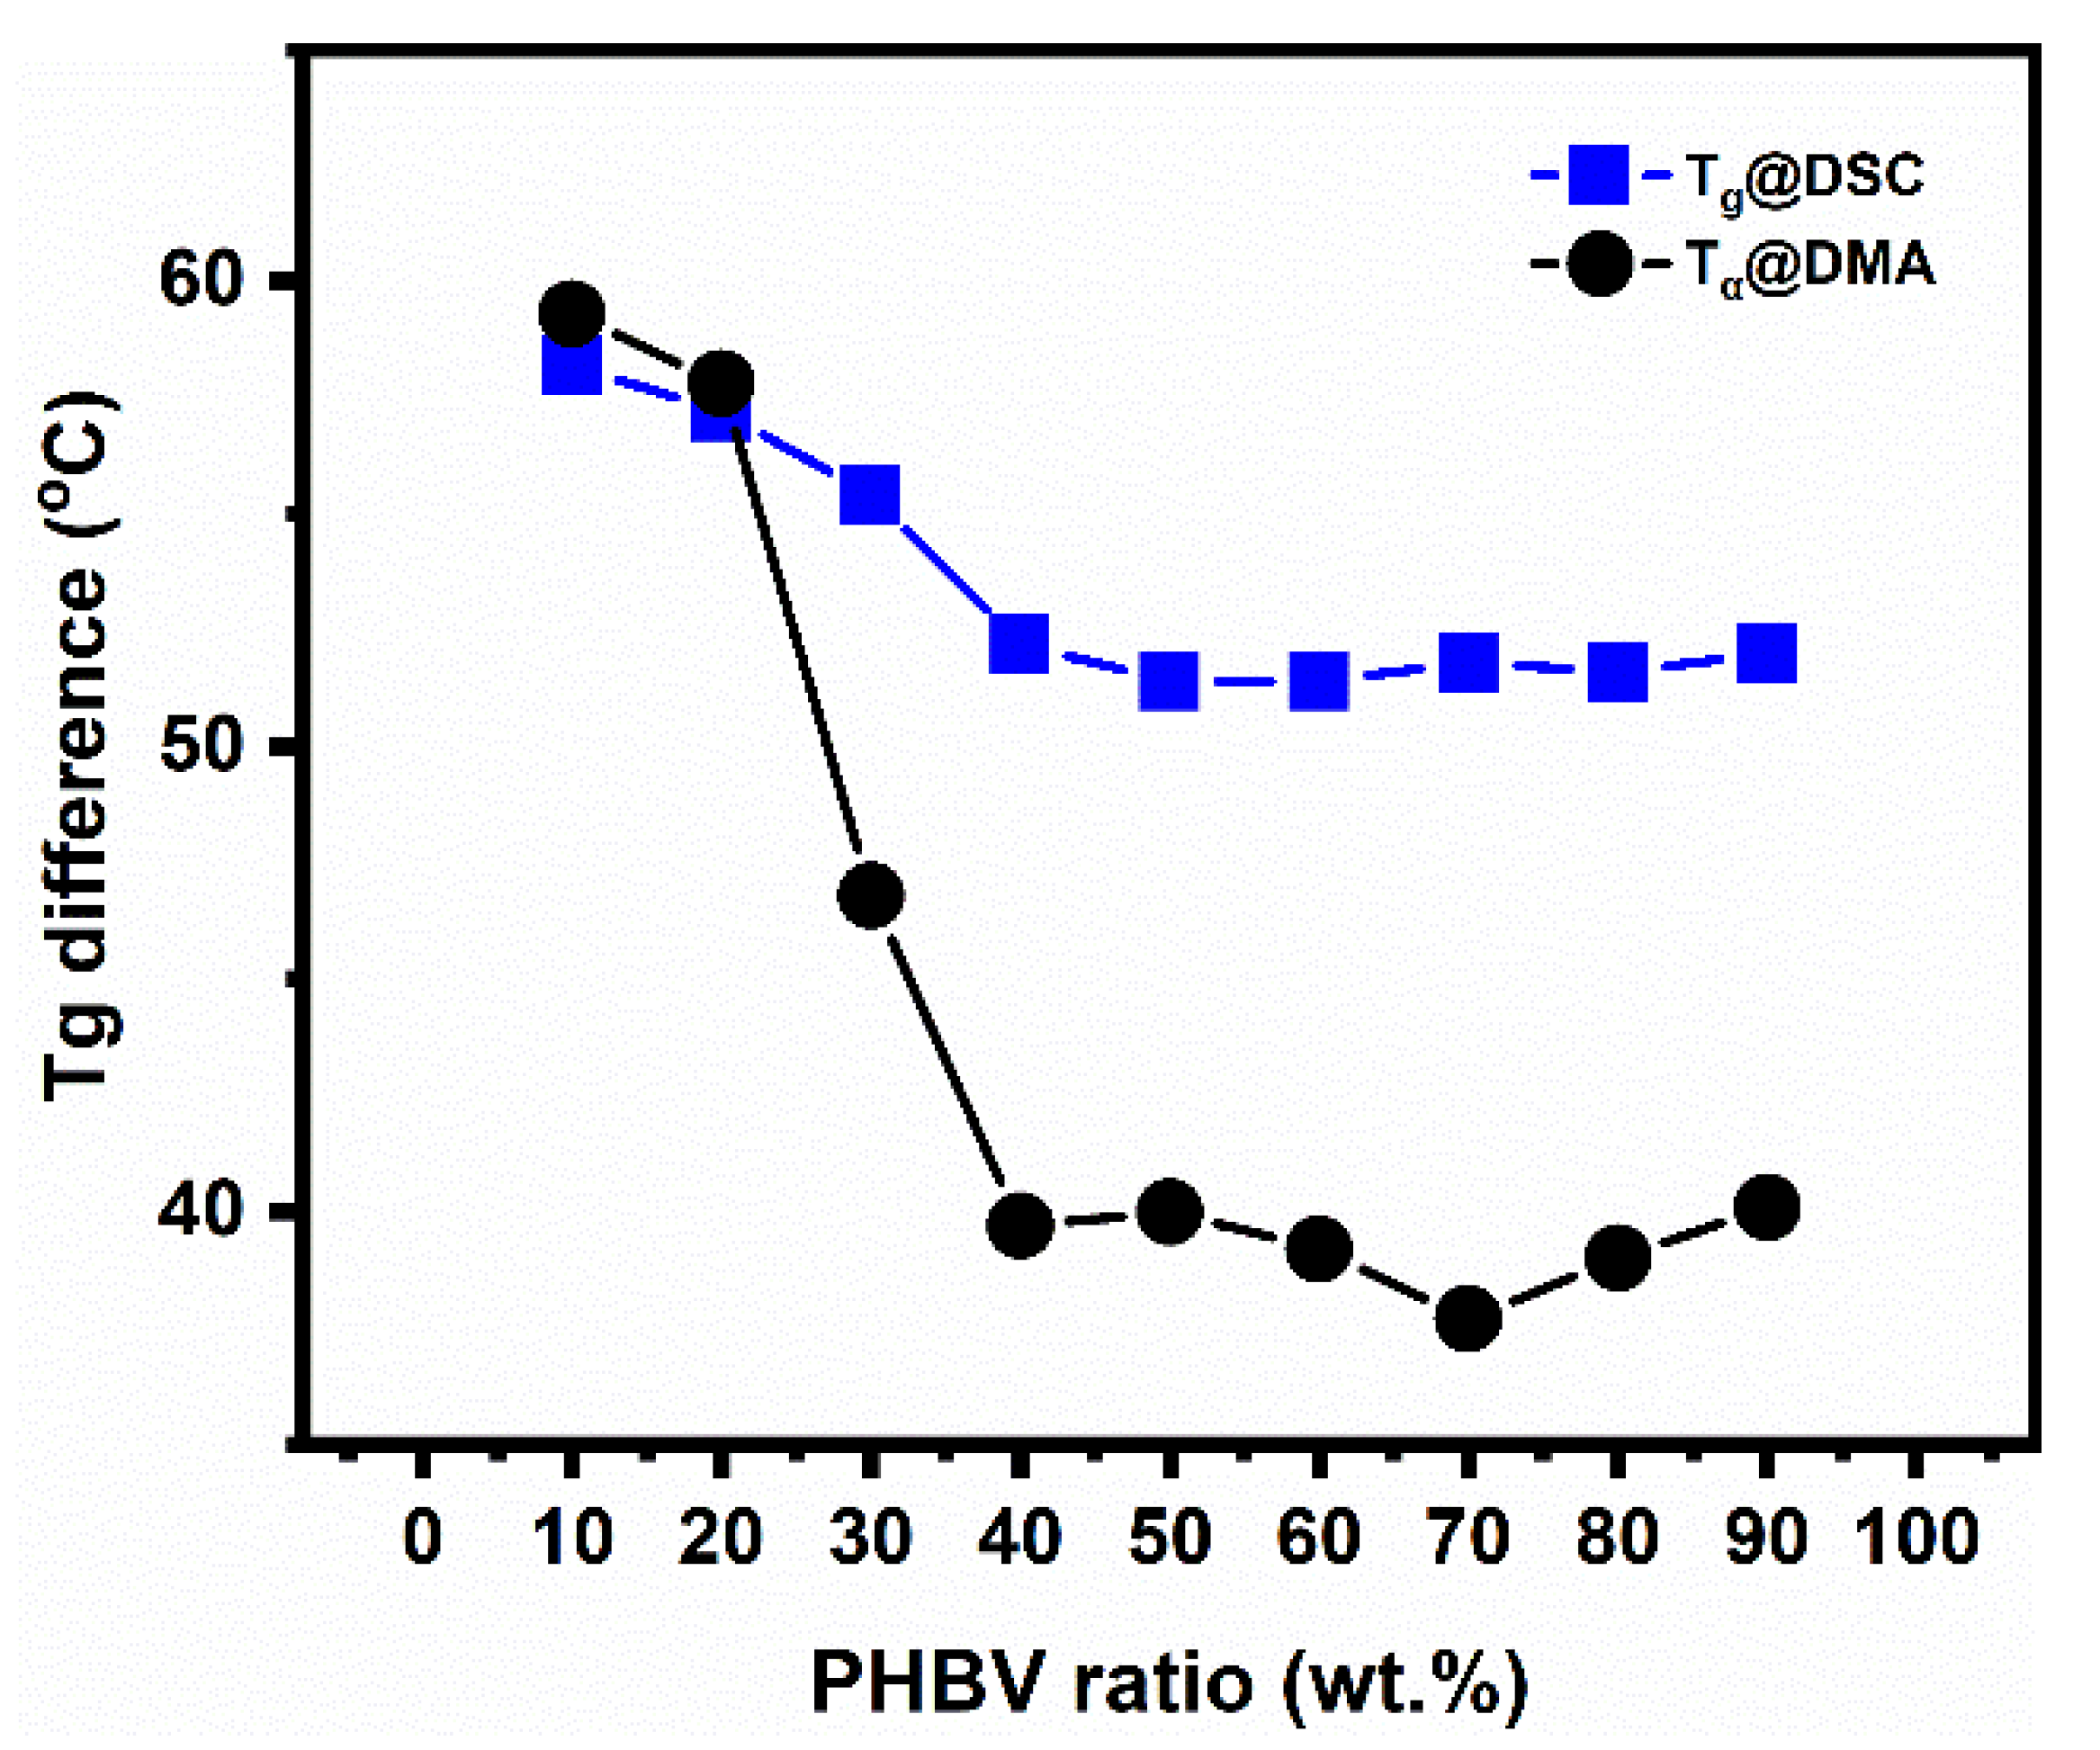
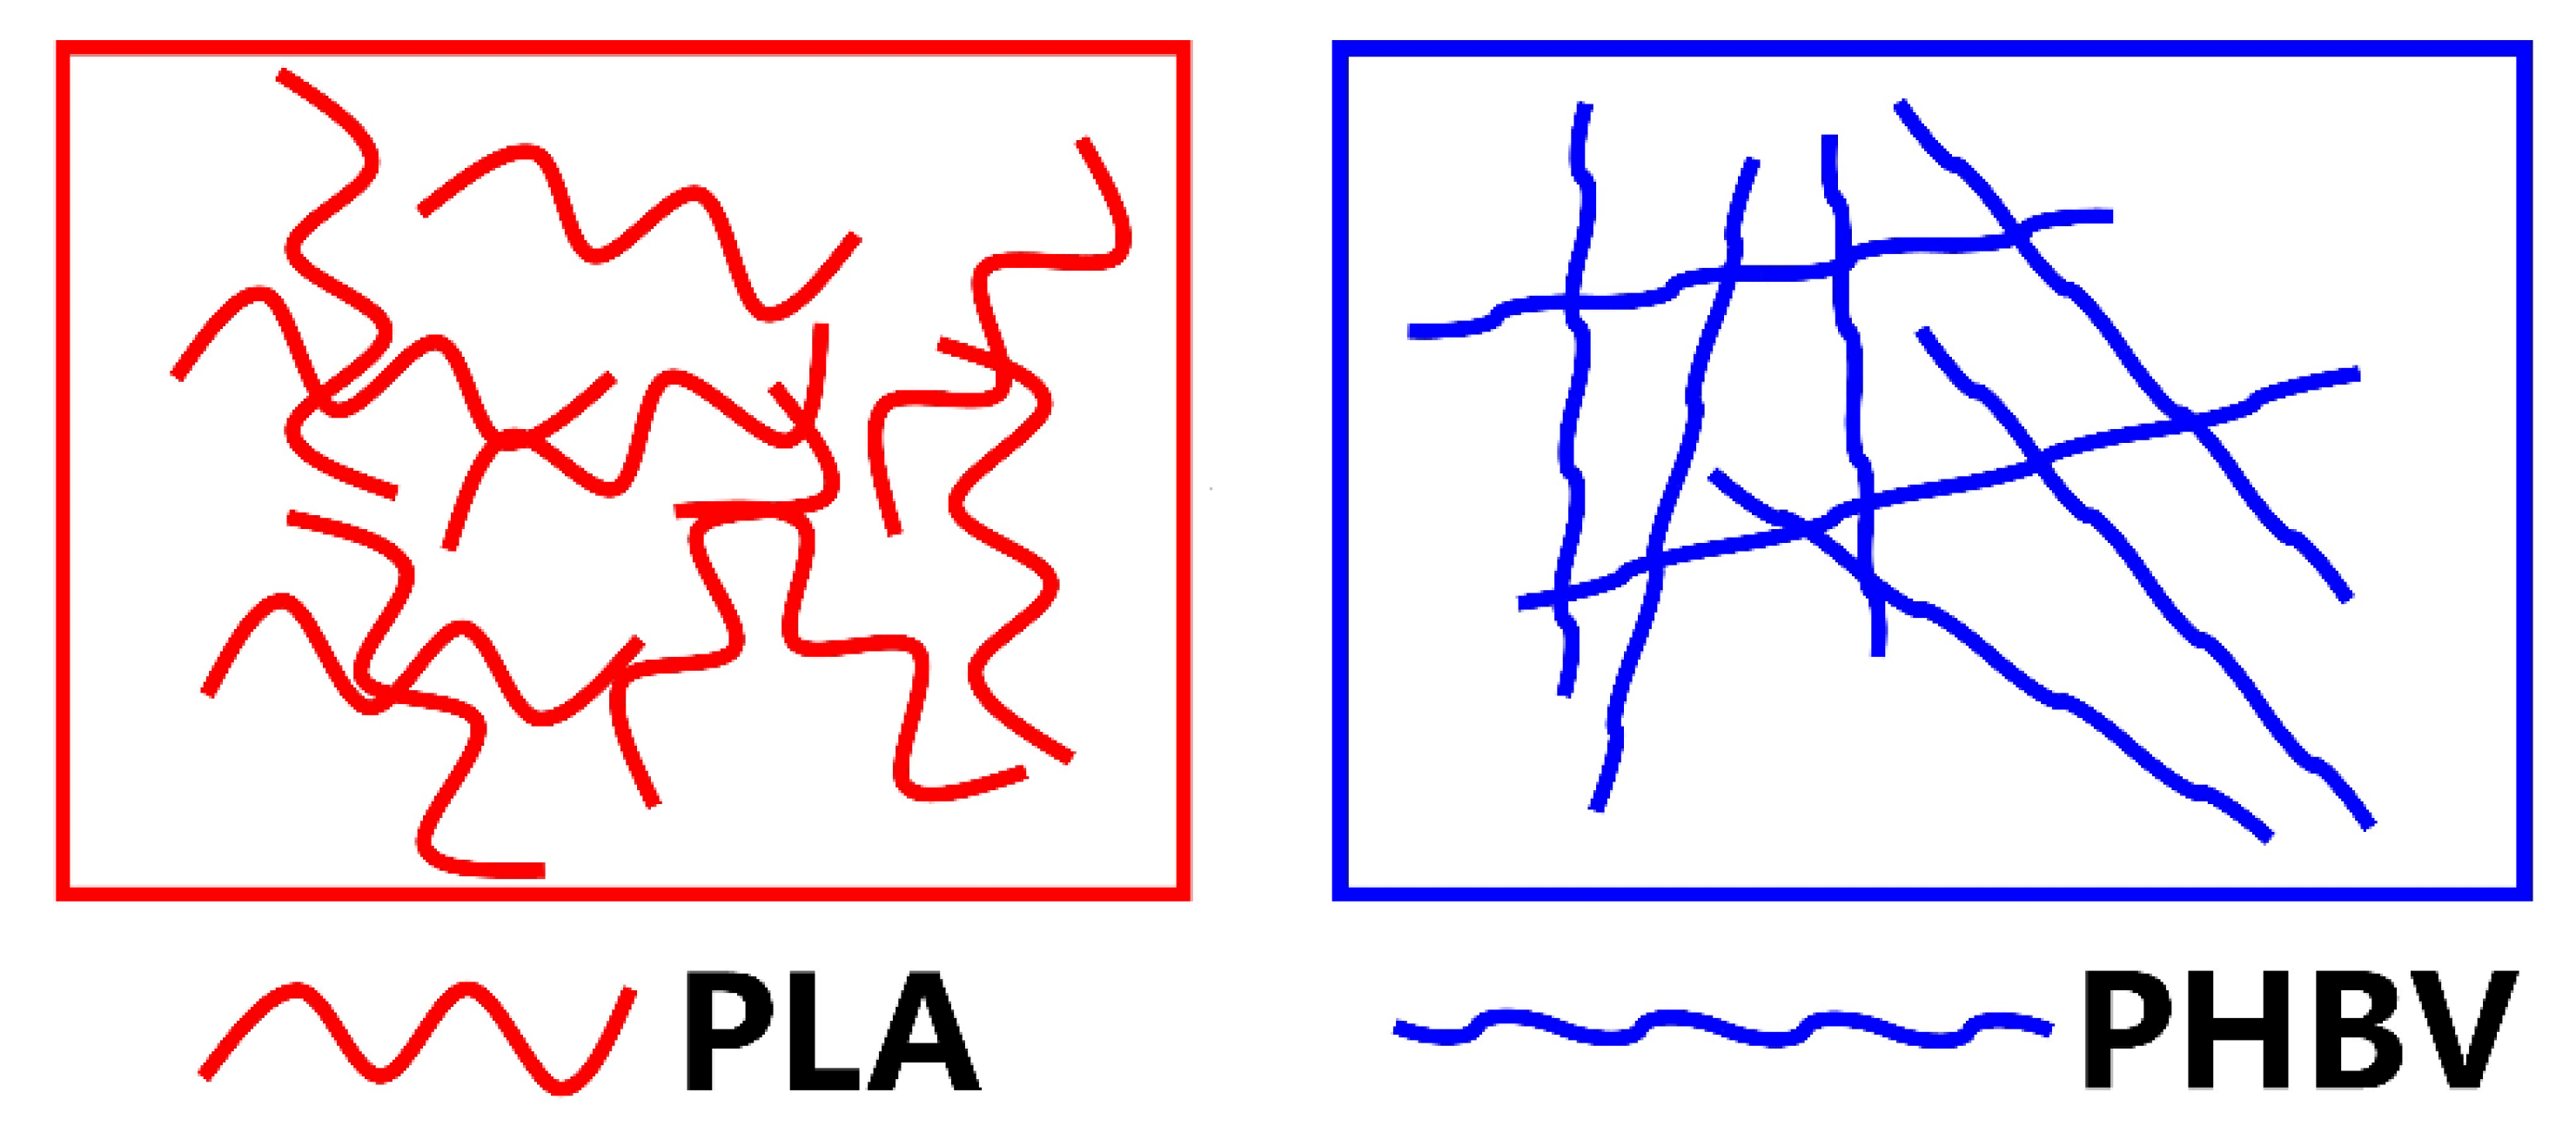
5.3. Investigation of PLA/PHBV Blend Miscibility
5.4. Small-Amplitude Oscillatory Shear (SAOS) Rheology
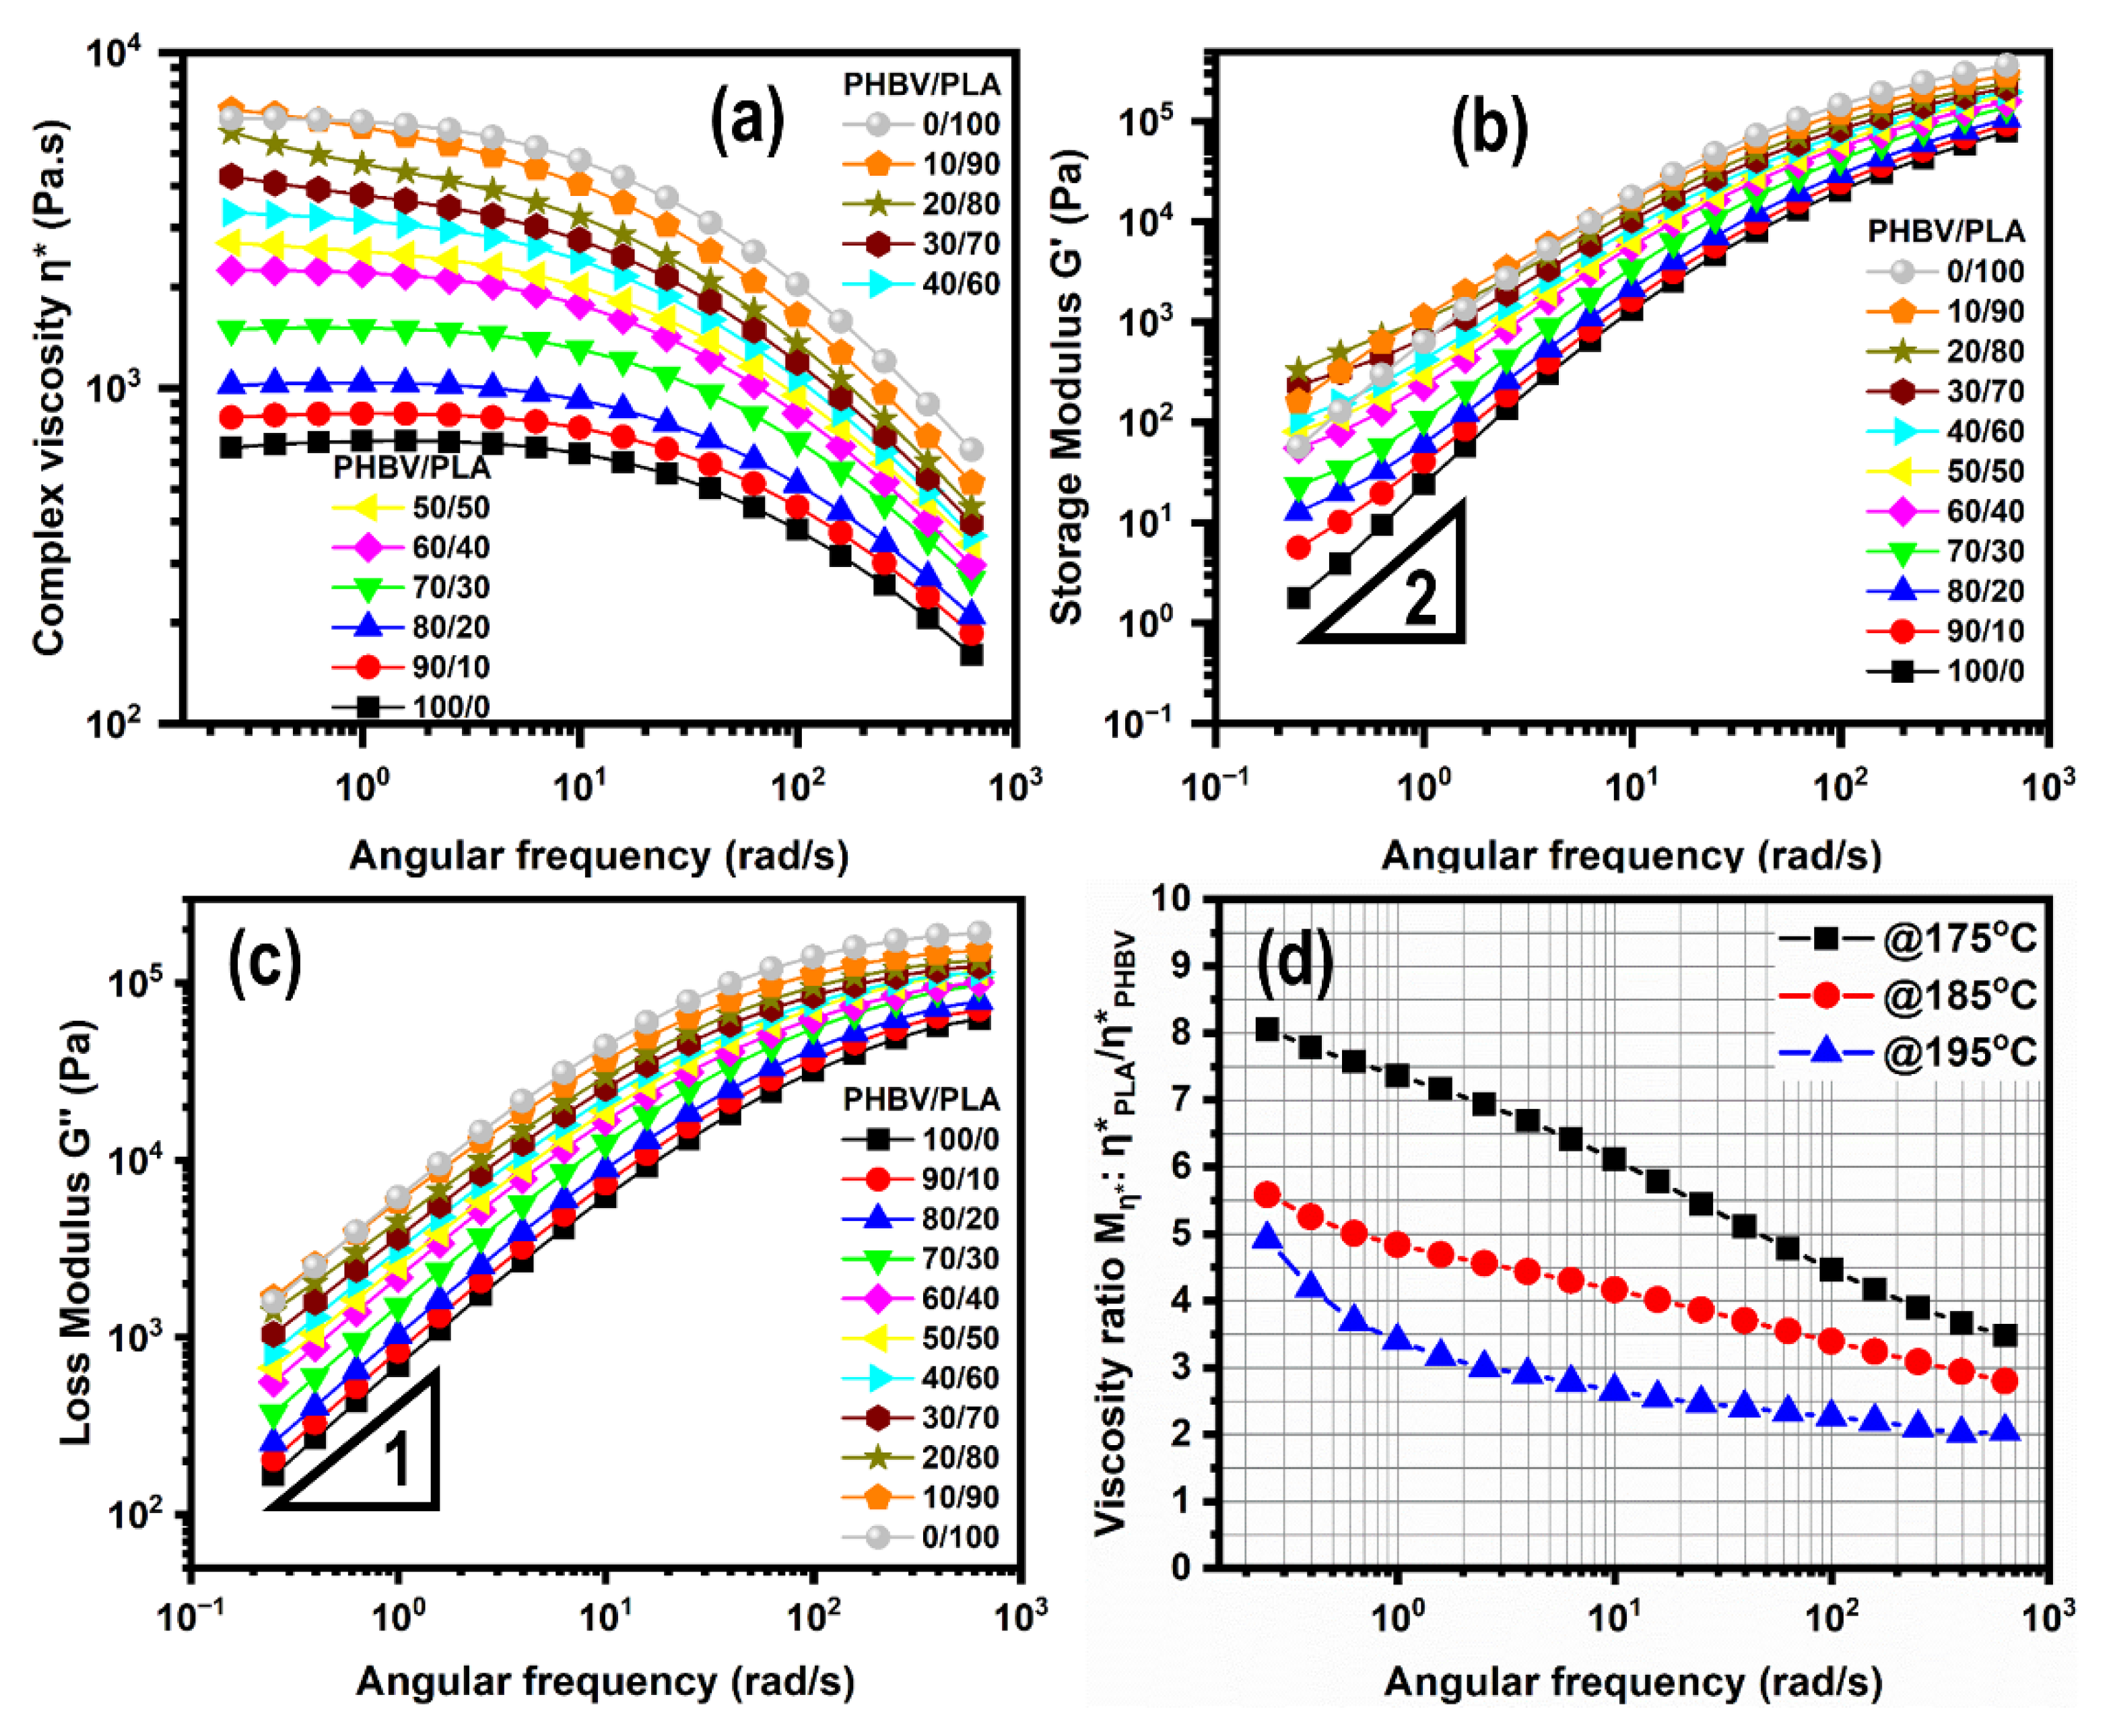
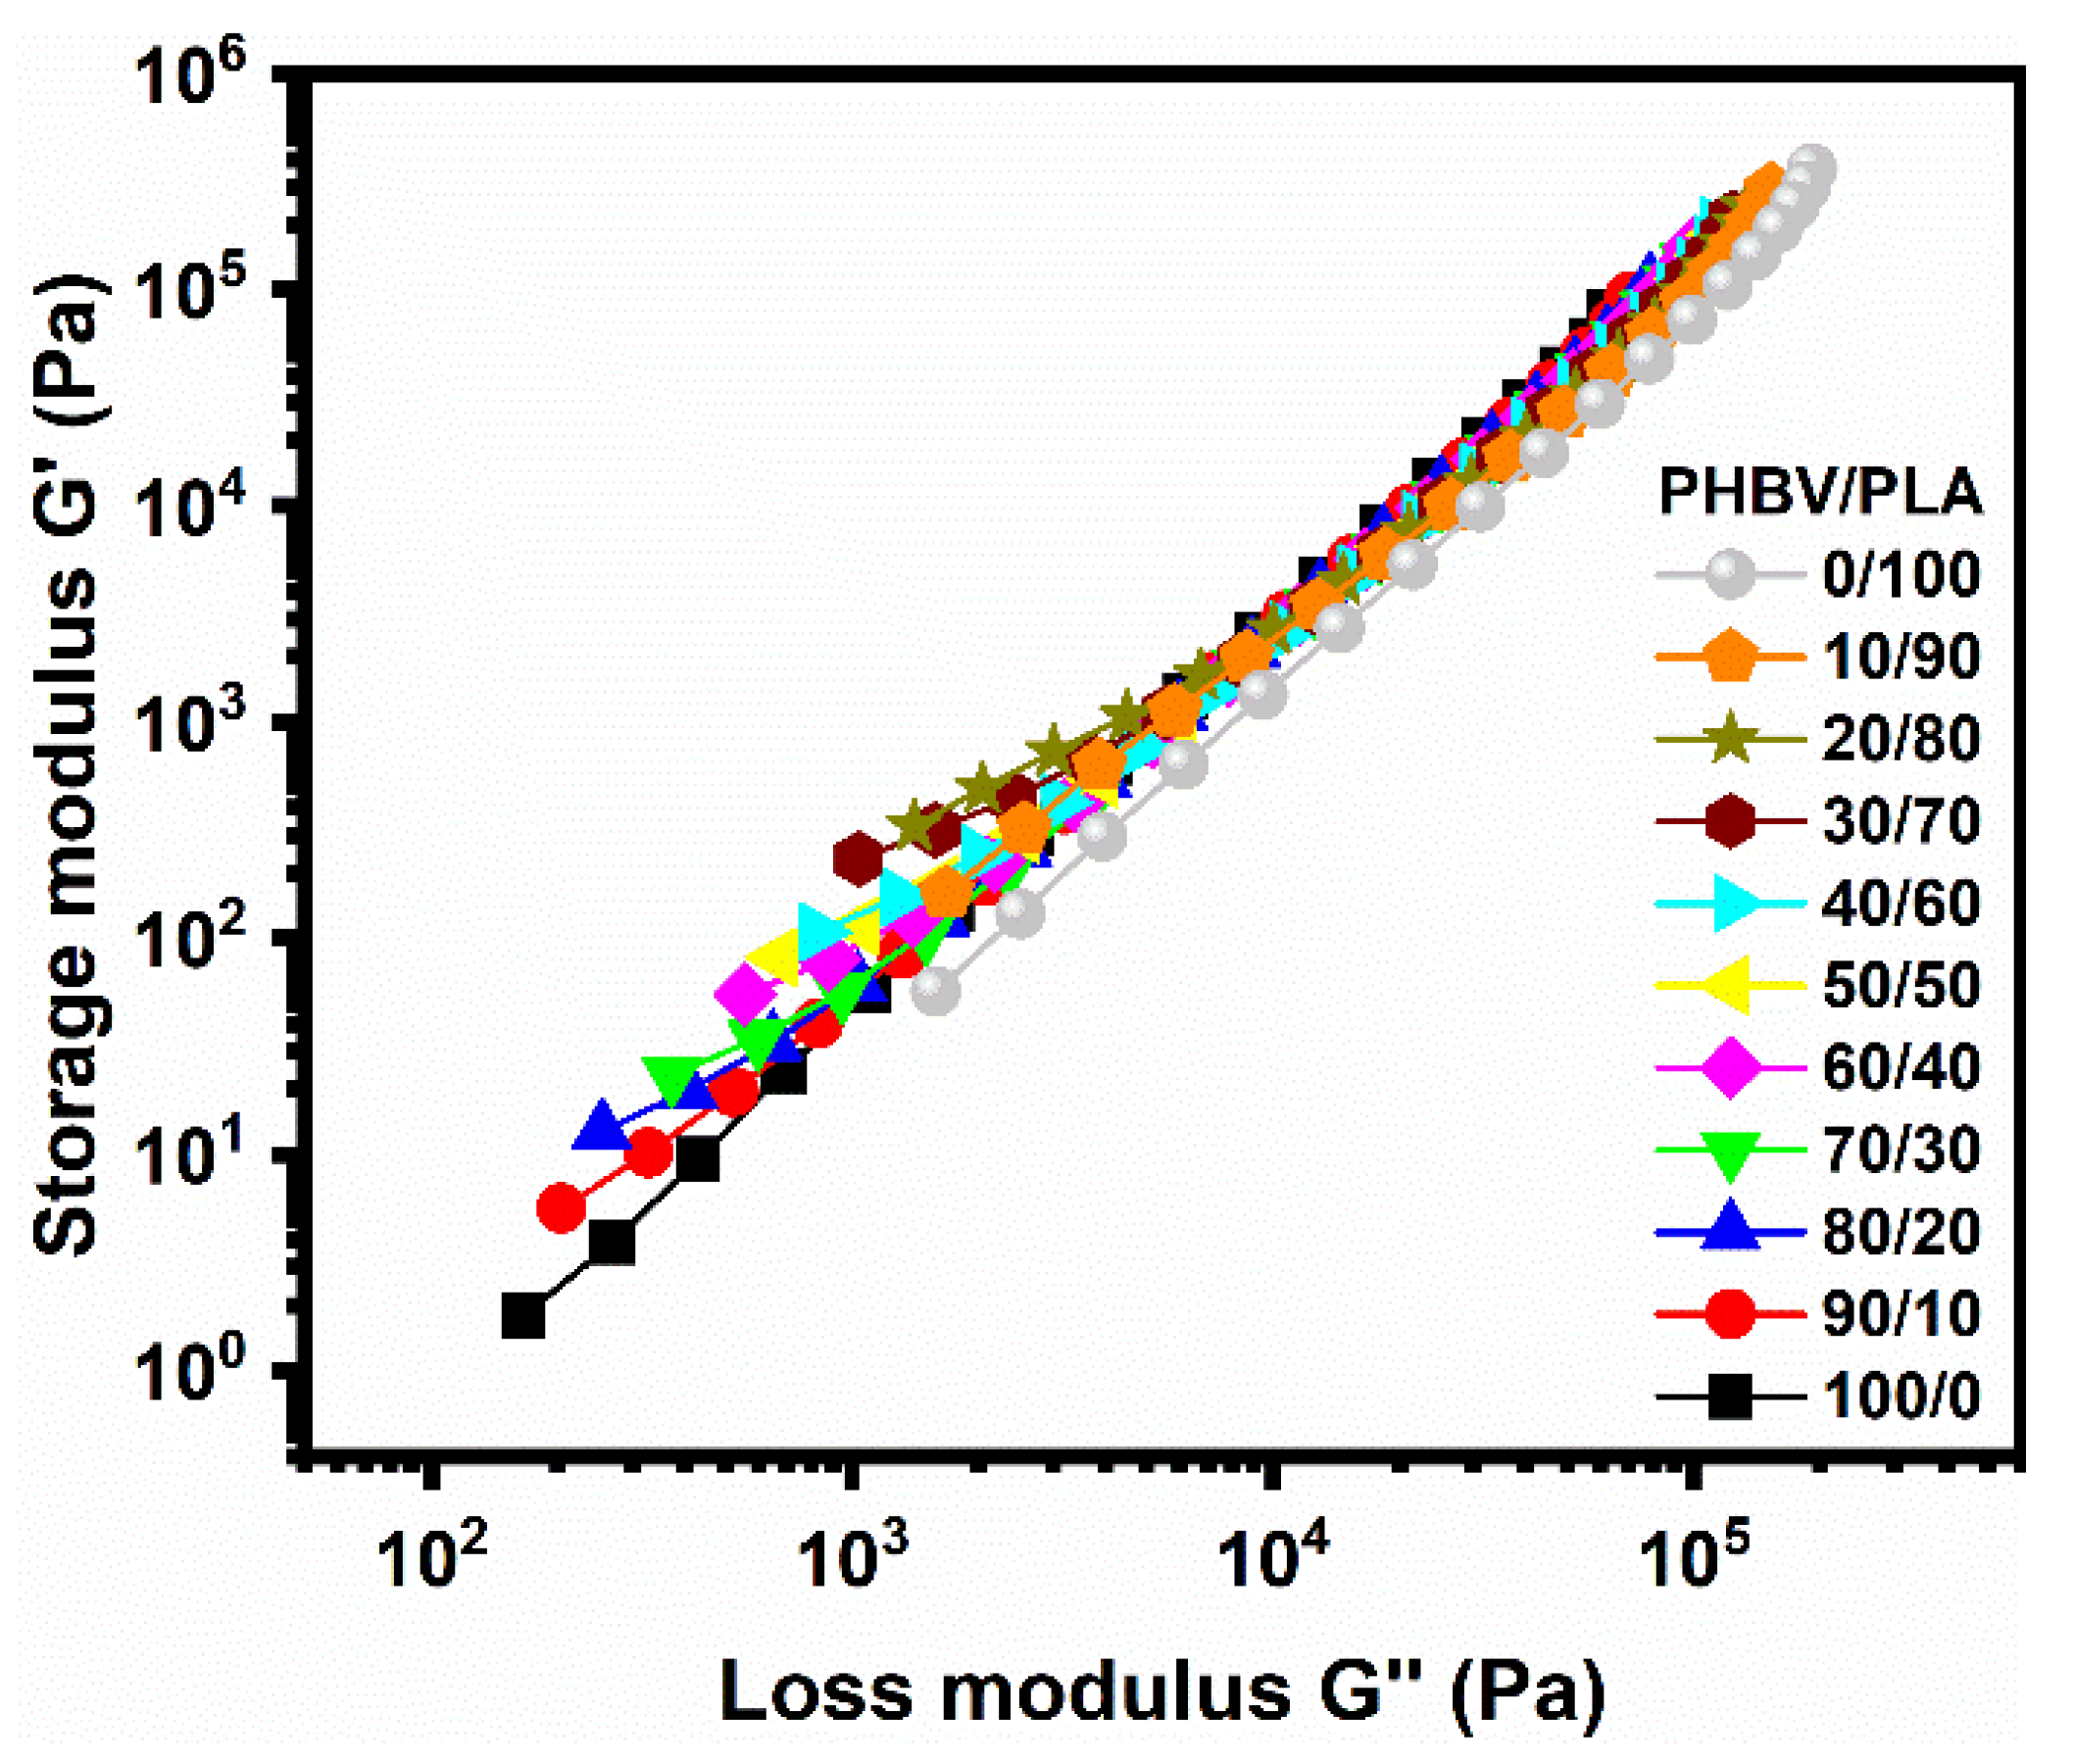
5.4.1. Linear Viscoelastic Properties
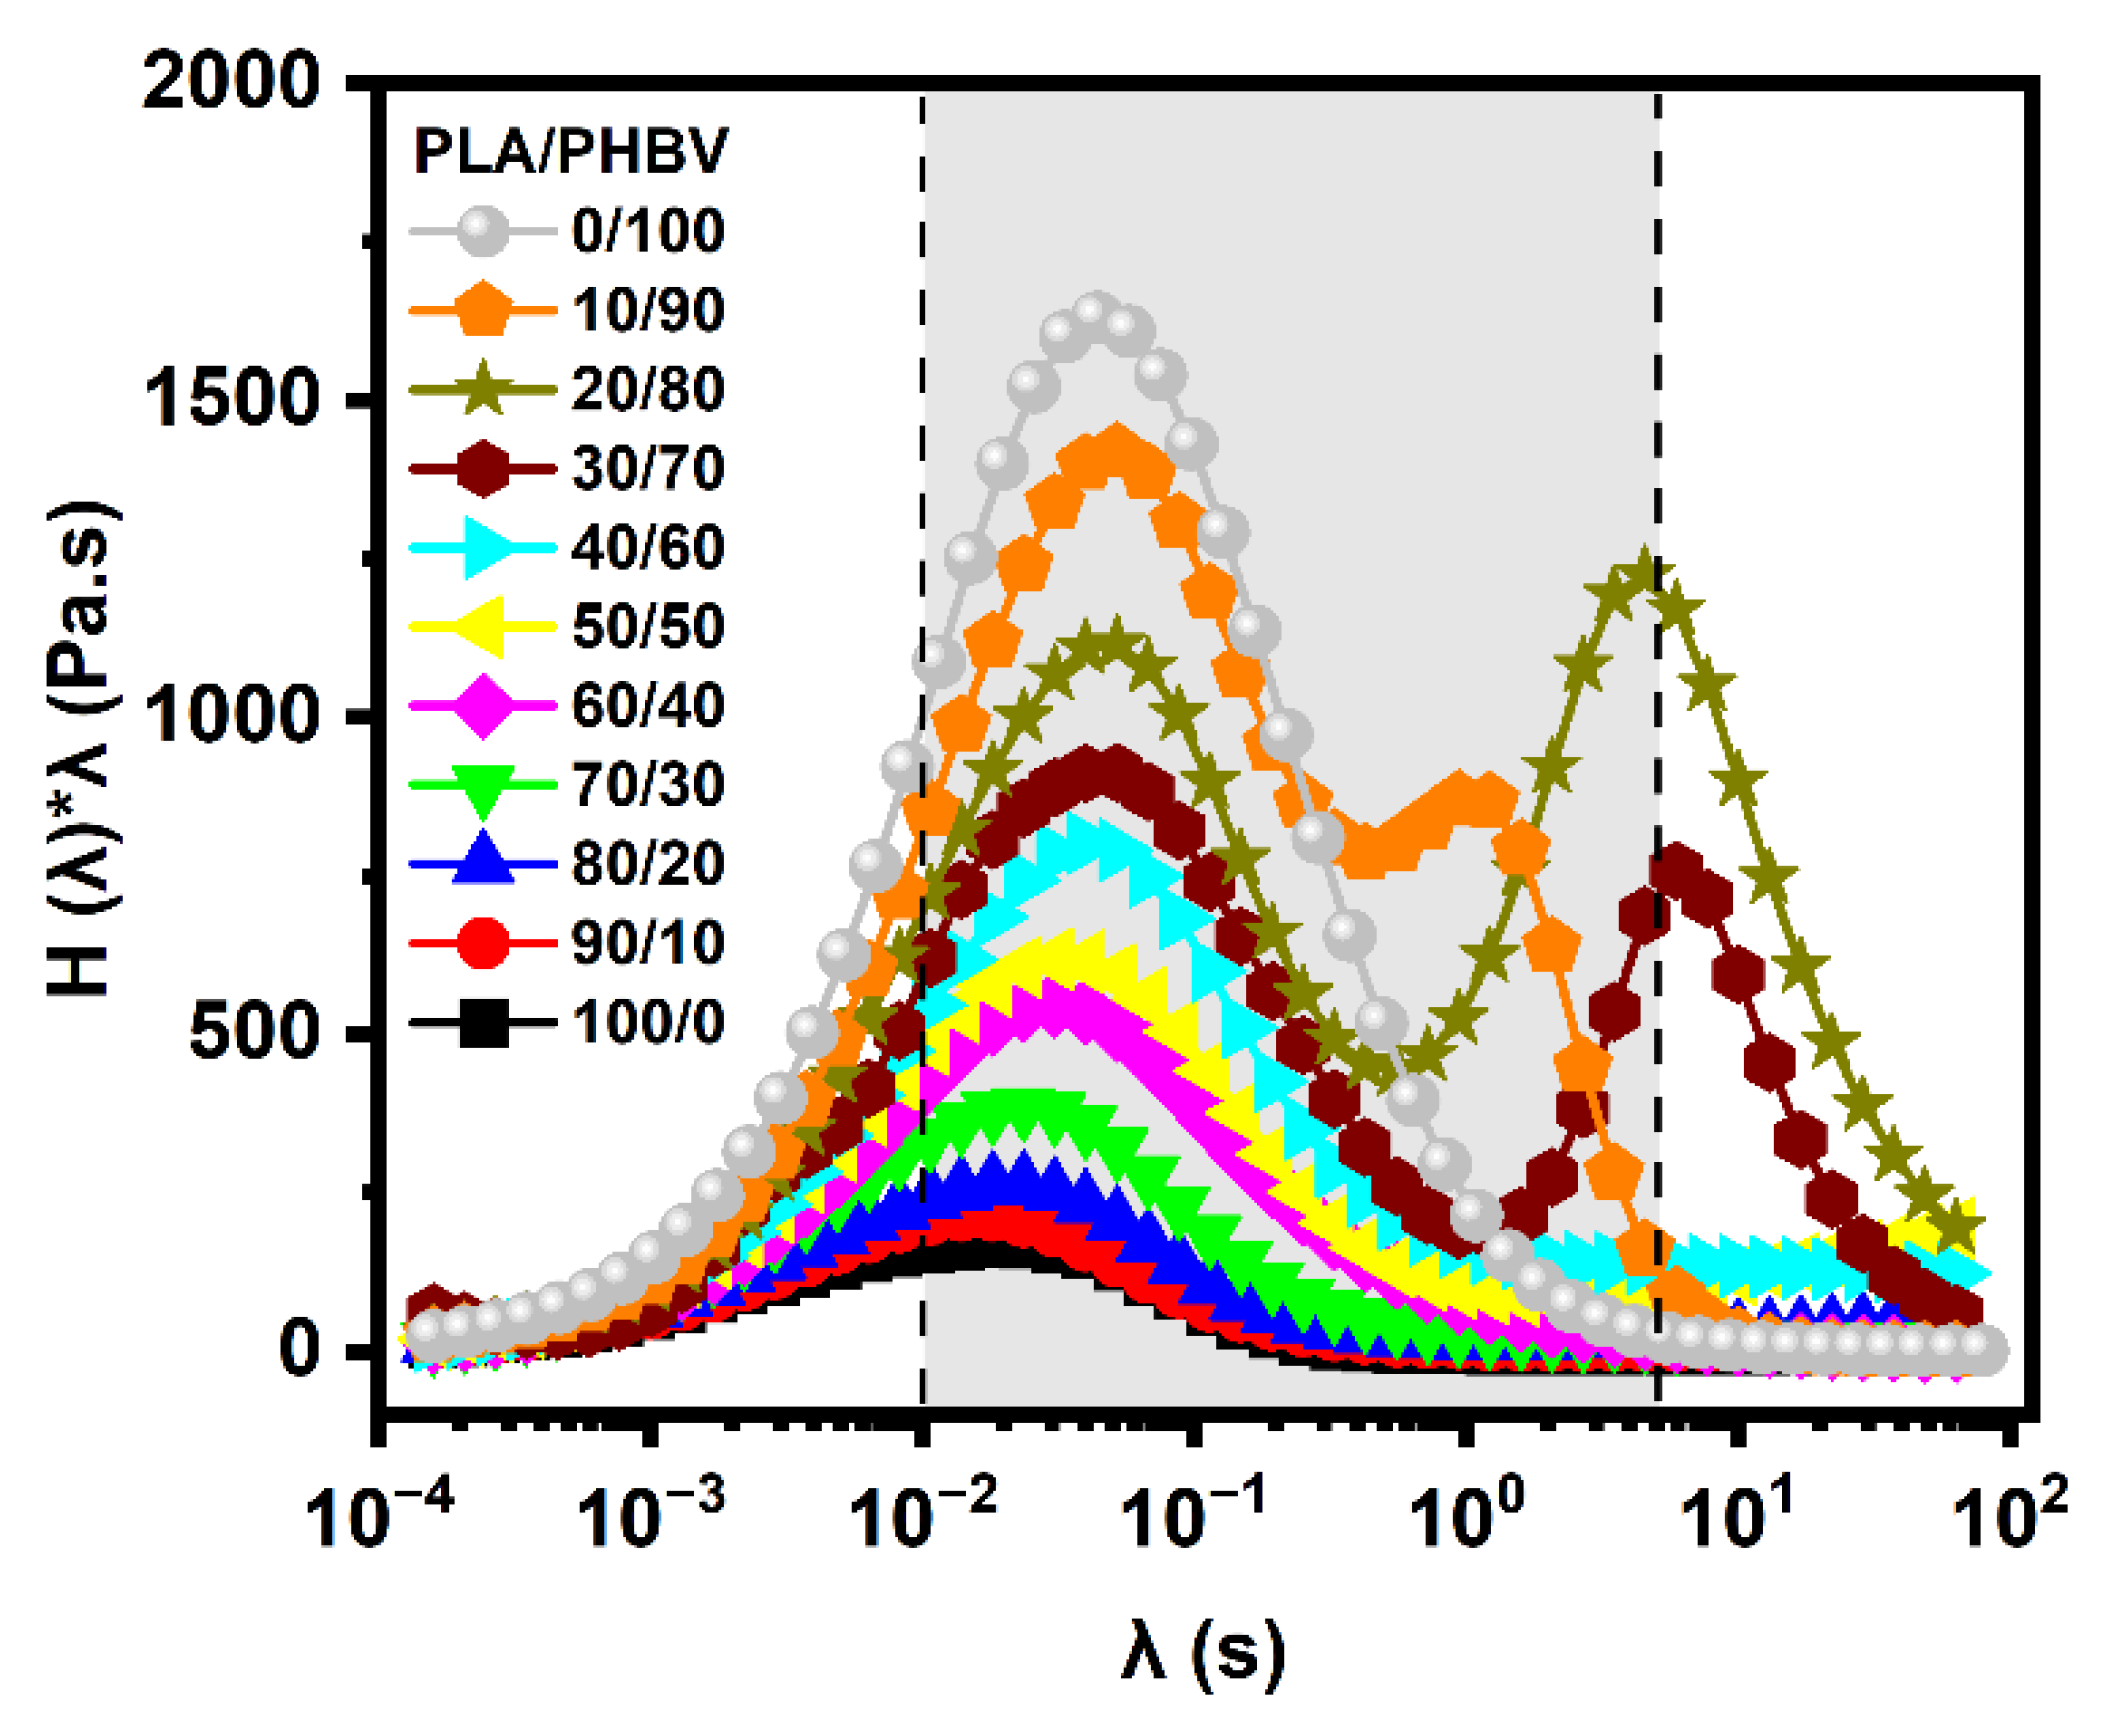
5.4.2. Weighted Relaxation Spectra
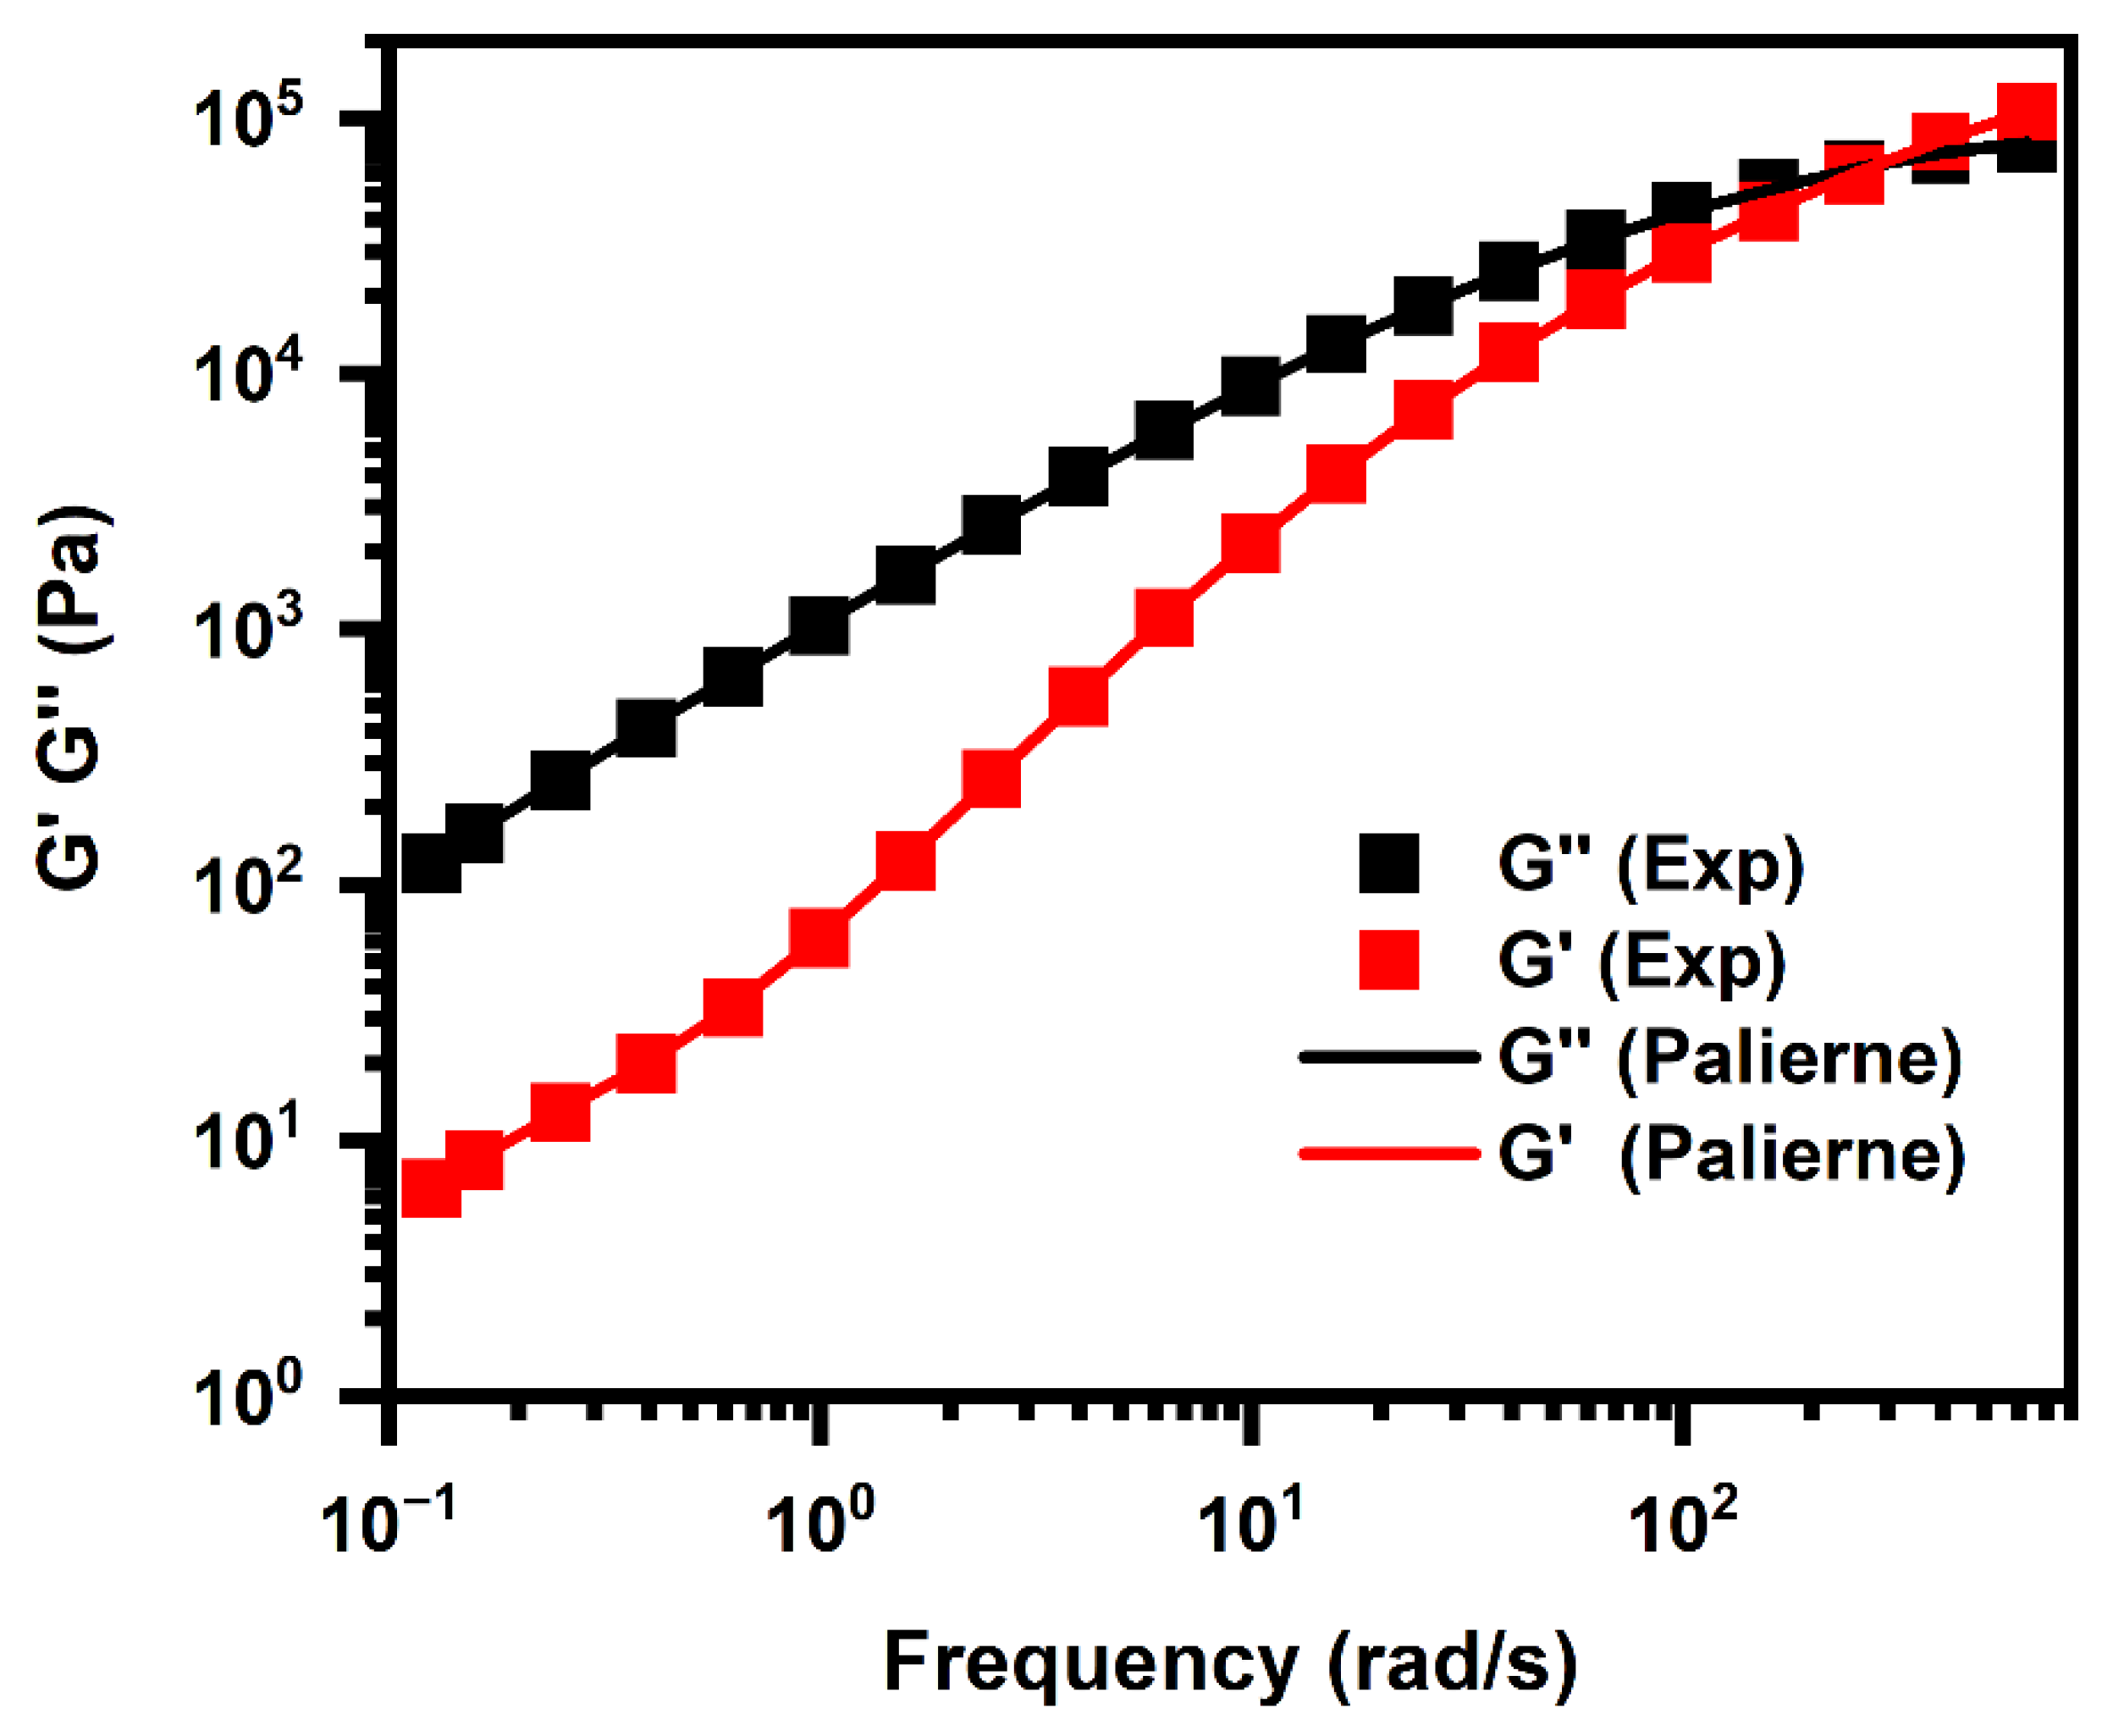
5.4.3. Interfacial Properties of the PLA/PHBV Blends
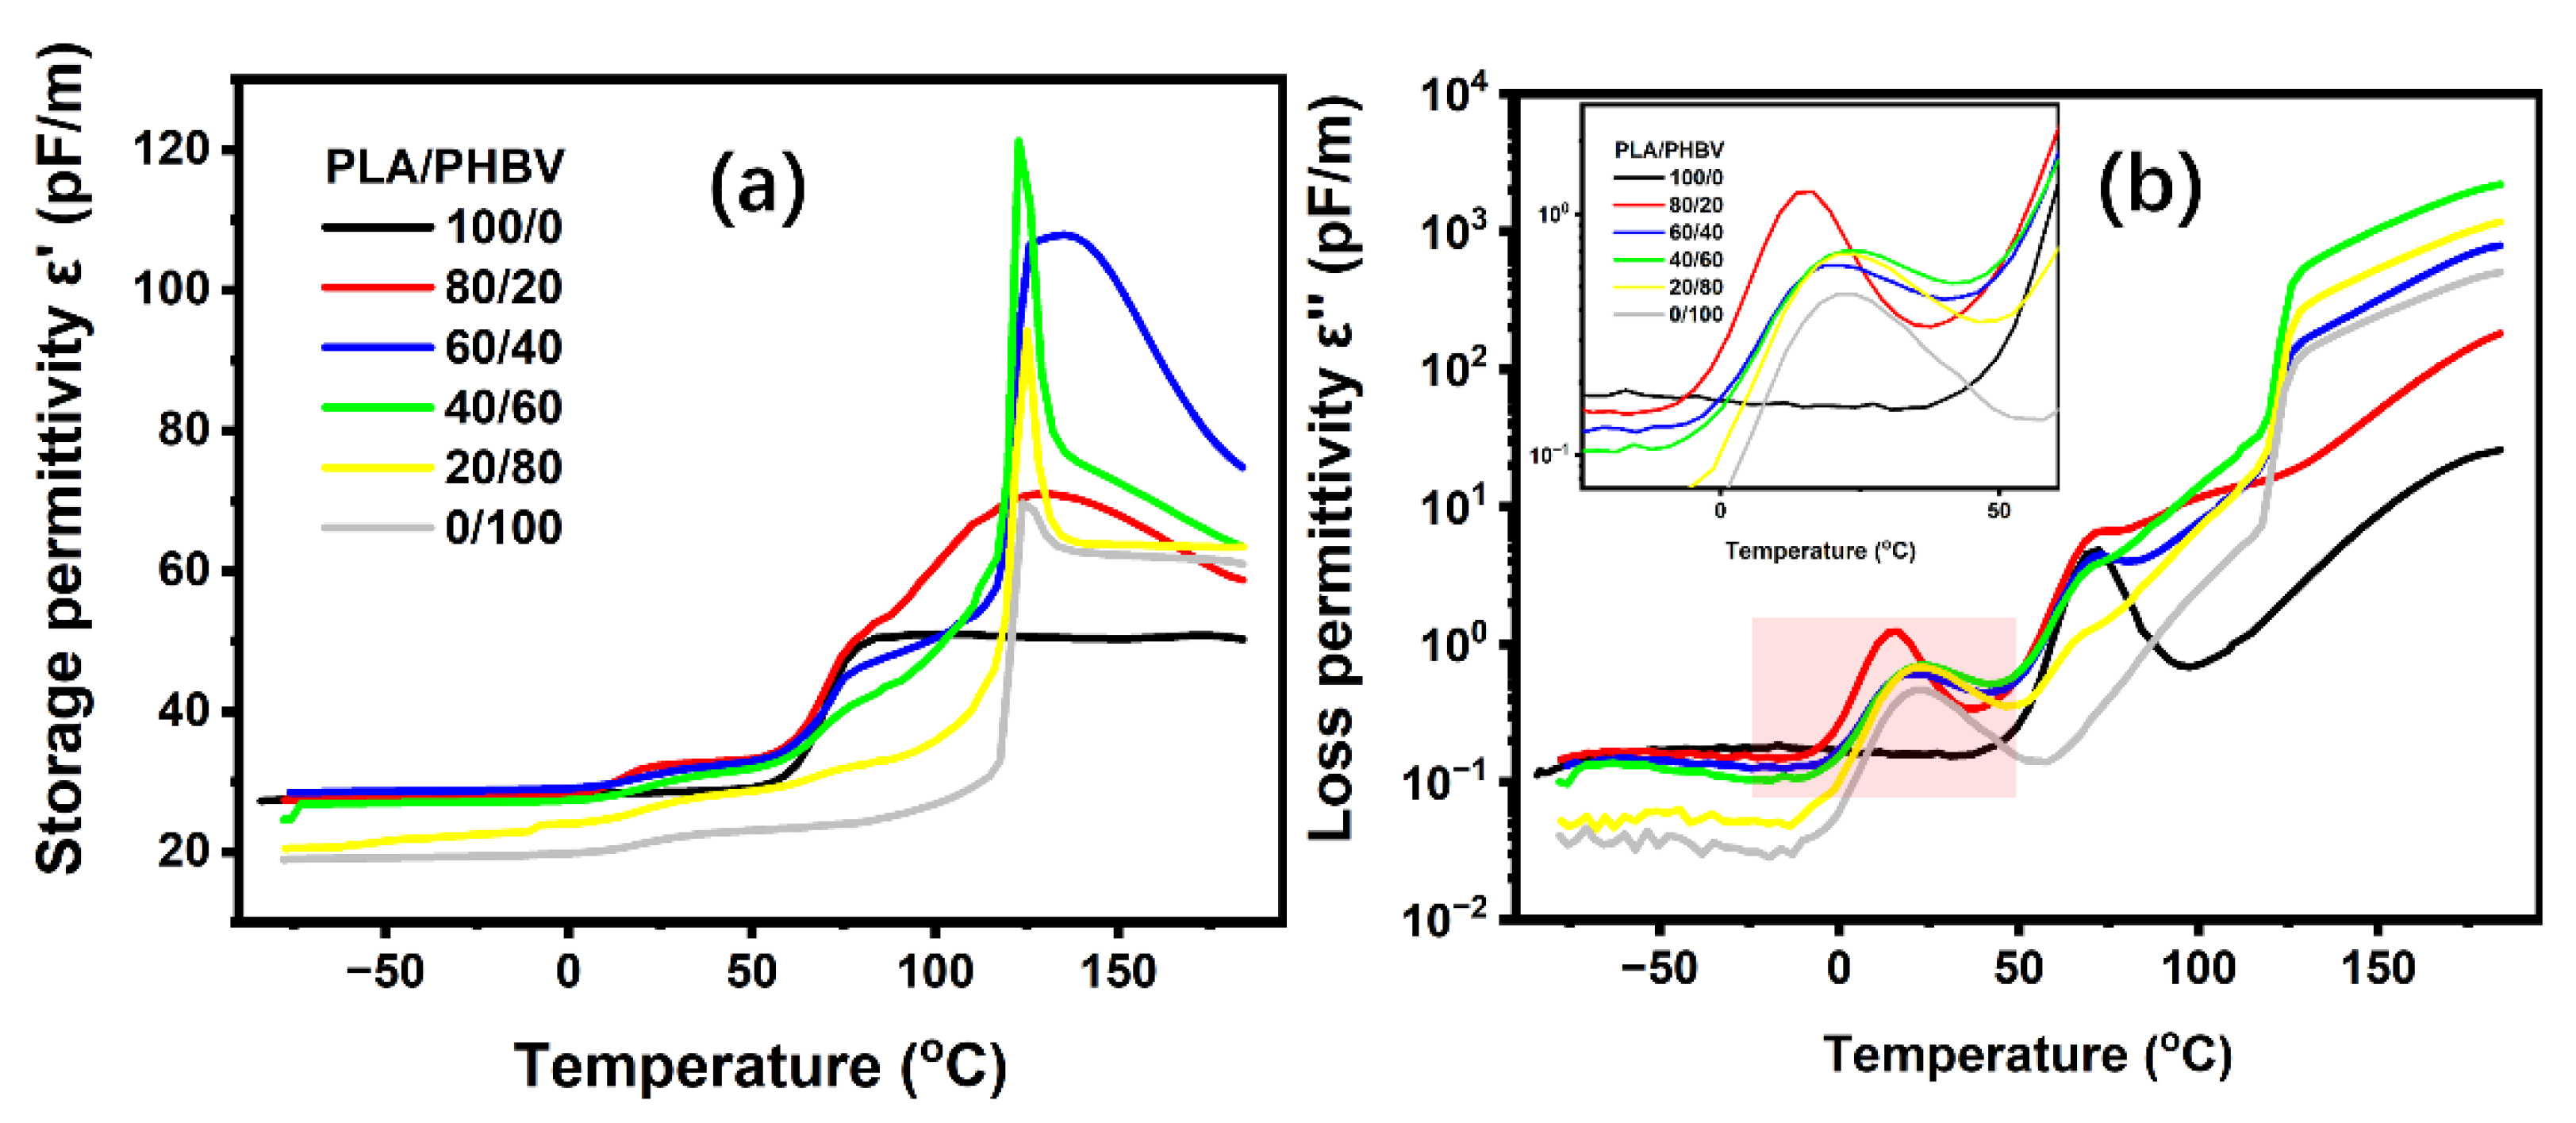
5.5. Dielectric Relaxation Spectrum for PLA/PHBV Blends
6. Conclusions
Author Contributions
Funding
Institutional Review Board Statement
Informed Consent Statement
Data Availability Statement
Acknowledgments
Conflicts of Interest
References
- Li, Y.; Qiu, S.; Sun, J.; Ren, Y.; Wang, S.; Wang, X.; Wang, W.; Li, H.; Fei, B.; Gu, X.; et al. A new strategy to prepare fully bio-based poly(lactic acid) composite with high flame retardancy, UV resistance, and rapid degradation in soil. Chem. Eng. J. 2022, 428, 131979. [Google Scholar] [CrossRef]
- Rocca-Smith, J.R.; Pasquarelli, R.; Lagorce-Tachon, A.; Rousseau, J.; Fontaine, S.; Aguié-Béghin, V.; Debeaufort, F.; Karbowiak, T. Toward sustainable PLA-based multilayer complexes with improved barrier properties. ACS Sustain. Chem. Eng. 2019, 7, 3759–3771. [Google Scholar] [CrossRef]
- Walha, F.; Lamnawar, K.; Maazouz, A.; Jaziri, M. Biosourced blends based on poly(lactic acid) and polyamide 11: Structure–properties relationships and enhancement of film blowing processability. Adv. Polym. Technol. 2018, 37, 2061–2074. [Google Scholar] [CrossRef]
- Xu, G.; Mahmood, Q.; Lv, C.; Yang, R.; Zhou, L.; Wang, Q. Asymmetric kinetic resolution polymerization. Coord. Chem. Rev. 2020, 414, 213296. [Google Scholar] [CrossRef]
- Oguz, O.; Candau, N.; Citak, M.K.; Cetin, F.N.; Avaz Seven, S.; Menceloglu, Y.Z. A sustainable approach to produce stiff, super-tough, and heat-resistant poly(lactic acid)-based green materials. ACS Sustain. Chem. Eng. 2019, 7, 7869–7877. [Google Scholar] [CrossRef]
- Ke, W.; Li, X.; Miao, M.; Liu, B.; Zhang, X.; Liu, T. Fabrication and Properties of Electrospun and Electrosprayed Polyethylene Glycol/Polylactic Acid (PEG/PLA) Films. Coatings 2021, 11, 790. [Google Scholar] [CrossRef]
- Mahmood, Q.; Xu, G.; Zhou, L.; Guo, X.; Wang, Q. Chiral 1, 5, 7-triazabicyclo [4.4. 0] dec-5-ene (TBD)-catalyzed stereoselective ring-opening polymerization of rac-lactide: High reactivity for isotactic enriched polylactides (PLAs). Polymers 2020, 12, 2365. [Google Scholar] [CrossRef]
- Zhou, Y.; Lei, L.; Yang, B.; Li, J.; Ren, J. Preparation and characterization of polylactic acid (PLA) carbon nanotube nanocomposites. Polym. Test. 2018, 68, 34–38. [Google Scholar] [CrossRef]
- Al-Itry, R.; Lamnawar, K.; Maazouz, A. Improvement of thermal stability, rheological and mechanical properties of PLA, PBAT and their blends by reactive extrusion with functionalized epoxy. Polym. Degrad. Stab. 2012, 97, 1898–1914. [Google Scholar] [CrossRef]
- Matta, A.K.; Rao, R.U.; Suman, K.N.S.; Rambabu, V. Preparation and characterization of biodegradable PLA/PCL polymeric blends. Procedia Mater. Sci. 2014, 6, 1266–1270. [Google Scholar] [CrossRef]
- Muniyasamy, S.; Ofosu, O.; John, M.J.; Anandjiwala, R.D. Mineralization of poly(lactic acid)(PLA), poly (3-hydroxybutyrate-co-valerate)(PHBV) and PLA/PHBV blend in compost and soil environments. J. Renew. Mater. 2016, 4, 133–145. [Google Scholar] [CrossRef]
- Chan, C.M.; Vandi, L.J.; Pratt, S.; Halley, P.; Ma, Y.; Chen, G.Q.; Richardson, D.; Werker, A.; Laycock, B. Understanding the effect of copolymer content on the processability and mechanical properties of polyhydroxyalkanoate (PHA)/wood composites. Compos. Part A Appl. Sci. Manuf. 2019, 124, 105437. [Google Scholar] [CrossRef]
- Requena, R.; Vargas, M.; Chiralt, A. Release kinetics of carvacrol and eugenol from poly (hydroxybutyrate-co-hydroxyvalerate)(PHBV) films for food packaging applications. Eur. Polym. J. 2017, 92, 185–193. [Google Scholar] [CrossRef]
- Gerard, T.; Budtova, T. Morphology and molten-state rheology of polylactide and polyhydroxyalkanoate blends. Eur. Polym. J. 2012, 48, 1110–1117. [Google Scholar] [CrossRef]
- Zembouai, I.; Kaci, M.; Bruzaud, S.; Benhamida, A.; Corre, Y.M.; Grohens, Y. A study of morphological, thermal, rheological and barrier properties of Poly (3-hydroxybutyrate-Co-3-Hydroxyvalerate)/polylactide blends prepared by melt mixing. Polym. Test. 2013, 32, 842–851. [Google Scholar] [CrossRef]
- Zembouai, I.; Bruzaud, S.; Kaci, M.; Benhamida, A.; Corre, Y.M.; Grohens, Y.; Taguet, A.; Lopez-Cuesta, J.M. Poly (3-hydroxybutyrate-co-3-hydroxyvalerate)/polylactide blends: Thermal stability, flammability and thermo-mechanical behavior. J. Polym. Environ. 2014, 22, 131–139. [Google Scholar] [CrossRef]
- van Oss, C.J.; Good, R.J. Surface tension and the solubility of polymers and biopolymers: The role of polar and apolar interfacial free energies. J. Macromol. Sci. A 1989, 26, 1183–1203. [Google Scholar] [CrossRef]
- Su, S. Prediction of the Miscibility of PBAT/PLA Blends. Polymers 2021, 13, 2339. [Google Scholar] [CrossRef]
- Ohkoshi, I.; Abe, H.; Doi, Y. Miscibility and solid-state structures for blends of poly [(S)-lactide] with atactic poly [(R, S)-3-hydroxybutyrate]. Polymer 2000, 41, 5985–5992. [Google Scholar] [CrossRef]
- Siracusa, V.; Blanco, I.; Romani, S.; Tylewicz, U.; Rocculi, P.; Rosa, M.D. Poly(lactic acid)-modified films for food packaging application: Physical, mechanical, and barrier behavior. J. Appl. Polym. Sci. 2012, 125, E390–E401. [Google Scholar] [CrossRef]
- Boufarguine, M.; Guinault, A.; Miquelard-Garnier, G.; Sollogoub, C. PLA/PHBV films with improved mechanical and gas barrier properties. Macromol. Mater. Eng. 2013, 298, 1065–1073. [Google Scholar] [CrossRef] [Green Version]
- Martin, O.; Avérous, L. Poly(lactic acid): Plasticization and properties of biodegradable multiphase systems. Polymer 2001, 42, 6209–6219. [Google Scholar] [CrossRef]
- Barker, P.A.; Barham, P.J.; Martinez-Salazar, J. Effect of crystallization temperature on the cocrystallization of hydroxybutyrate/hydroxyvalerate copolymers. Polymer 1997, 38, 913–919. [Google Scholar] [CrossRef]
- Palierne, J.F. Linear rheology of viscoelastic emulsions with interfacial tension. Rheol. Acta 1990, 29, 204–214. [Google Scholar] [CrossRef]
- Wu, D.; Yuan, L.; Laredo, E.; Zhang, M.; Zhou, W. Interfacial properties, viscoelasticity, and thermal behaviors of poly (butylene succinate)/polylactide blend. Ind. Eng. Chem. Res. 2012, 51, 2290–2298. [Google Scholar] [CrossRef]
- Wu, S. Polymer Interface and Adhesion; Marcel Dekker Inc.: New York, NY, USA, 1982. [Google Scholar]
- Ha, J.W.; Leal, L.G. An experimental study of drop deformation and breakup in extensional flow at high capillary number. Phys. Fluids 2001, 13, 1568–1576. [Google Scholar] [CrossRef]
- Mighri, F.; Carreau, P.J.; Ajji, A. Influence of elastic properties on drop deformation and breakup in shear flow. J. Rheol. 1998, 42, 1477–1490. [Google Scholar] [CrossRef]
- Grace, H.P. Dispersion phenomena in high viscosity immiscible fluid systems and application of static mixers as dispersion devices in such systems. Chem. Eng. Commun. 1982, 14, 225–277. [Google Scholar] [CrossRef]
- Lu, B.; Lamnawar, K.; Maazouz, A.; Zhang, H. Revealing the dynamic heterogeneity of PMMA/PVDF blends: From microscopic dynamics to macroscopic properties. Soft Matter 2016, 12, 3252–3264. [Google Scholar] [CrossRef]
- Ferreira, B.M.P.; Zavaglia, C.A.C.; Duek, E.A.R. Films of PLLA/PHBV: Thermal, morphological, and mechanical characterization. J. Appl. Polym. Sci. 2002, 86, 2898–2906. [Google Scholar] [CrossRef]
- Xu, L.Q.; Huang, H.X. Relaxation behavior of poly(lactic acid)/poly (butylene succinate) blend and a new method for calculating its interfacial tension. J. Appl. Polym. Sci. 2012, 125, E272–E277. [Google Scholar] [CrossRef]
- Yasuda, K. Investigation of the Analogies between Viscometric and Linear Viscoelastic Properties of Polystyrene Fluids. Ph.D. Thesis, Massachusetts Institute of Technology, New York, NY, USA, 1979. [Google Scholar]
- Han, C.D.; Kim, J. Rheological technique for determining the order–disorder transition of block copolymers. J. Polym. Sci. B Polym. Phys. 1987, 25, 1741–1764. [Google Scholar] [CrossRef]
- Walha, F.; Lamnawar, K.; Maazouz, A.; Jaziri, M. Rheological, morphological and mechanical studies of sustainably sourced polymer blends based on poly(lactic acid) and polyamide 11. Polymers 2016, 8, 61. [Google Scholar] [CrossRef] [PubMed] [Green Version]
- Honerkamp, J.; Weese, J. A nonlinear regularization method for the calculation of relaxation spectra. Rheol. Acta 1993, 32, 65–73. [Google Scholar] [CrossRef]
- Gui, Z.Y.; Wang, H.R.; Gao, Y.; Lu, C.; Cheng, S.J. Morphology and melt rheology of biodegradable poly(lactic acid)/poly (butylene succinate adipate) blends: Effect of blend compositions. Iran. Polym. J. 2012, 21, 81–89. [Google Scholar] [CrossRef]
- Nofar, M.; Maani, A.; Sojoudi, H.; Heuzey, M.C.; Carreau, P.J. Interfacial and rheological properties of PLA/PBAT and PLA/PBSA blends and their morphological stability under shear flow. J. Rheol. 2015, 59, 317–333. [Google Scholar] [CrossRef]
- Schönhals, A.; Kremer, F. Broadband Dielectric Spectroscopy. Analysis of Dielectric Spectra; Springer: Berlin/Heidelberg, Germany, 2003; Volume 3, pp. 59–98. [Google Scholar]
- Fahmy, T.; Ahmed, M.T.; El-Kotp, A.; Abdelwahed, H.G.; Alshaeer, M.Y. Broadband dielectric spectroscopy and electric modulus analysis of poly (3-hydroxybutyrate-co-3-hydroxyvalerate) and related copolymers films. Intern. J. Phys. Appl. 2016, 8, 1–14. [Google Scholar]
- Ohki, Y.; Fuse, N.; Hikosaka, S.; Takemura, Y.; Mizuno, M.; Fukunaga, K. Complex permittivity spectra of several insulating polymers at electrical and THz frequencies. In Proceedings of the 2009 IEEE Conference on Electrical Insulation and Dielectric Phenomena, Virginia Beach, VA, USA, 18–21 October 2009; pp. 7–10. [Google Scholar]
- Gasmi, S.; Hassan, M.K.; Luyt, A.S. Crystallization and dielectric behavior of PLA and PHBV in PLA/PHBV blends and PLA/PHBV/TIO 2 nanocomposites. Express Polym. Lett. 2019, 13, 199–212. [Google Scholar] [CrossRef]


| Samples | Supplier | Tg (°C) | Tm (°C) | MI (g/10 min (190 °C/2.16 kg)) | Density (g/cm3) |
|---|---|---|---|---|---|
| PLA (2003D) | NatureWorks, Plymouth, MN, USA | 56 | 145–155 | 5 | 1.25 |
| PHBV (Enmat Y1000P) | Tianan, Ningbo, China | 5 | 165–175 | 15 | 1.25 |
| Samples | DSC | TGA | ||
|---|---|---|---|---|
| Tg (°C) | Tm (°C) | TOnset (°C) | TPeak (°C) | |
| PLA | 60 | 150 | 301 | 339 |
| PHBV | 5 | 170 | 244 | 275 |
| Samples | Eta*(t)/Etao (t = 0) (%) | |||||
|---|---|---|---|---|---|---|
| 200 s | 400 s | 600 s | 800 s | 1000 s | 1200 s | |
| PLA@175 °C | 87 | 82 | 79 | 77 | 75 | 73 |
| PLA@185 °C | 83 | 78 | 74 | 71 | 68 | 66 |
| PLA@195 °C | 82 | 76 | 72 | 69 | 66 | 64 |
| PHBV@175 °C | 78 | 60 | 46 | 37 | 30 | 25 |
| PHBV@185 °C | 51 | 30 | 19 | 13 | 9 | 5 |
| PHBV@195 °C | 33 | 11 | 5 | 3 | 1 | 0.8 |
| Samples | Mn | Loss (%) | Mw | Loss (%) | Mz | Loss (%) | Polydispersity |
|---|---|---|---|---|---|---|---|
| PHBV pellet | 116,619 | 27,9303 | 444,098 | 2.40 | |||
| PHBV E@175 °C | 107,659 | 7.68 | 254,686 | 8.81 | 414,704 | 6.62 | 2.37 |
| PHBV E@195 °C | 93,181 | 20.1 | 208,811 | 25.2 | 351,135 | 20.9 | 2.24 |
| PHBV E@175 °C R@175 °C | 74,834 | 35.8 | 176,031 | 37.0 | 324,600 | 26.9 | 2.35 |
| PHBV E@175 °C R@195 °C | 66,961 | 42.6 | 149,584 | 46.4 | 274,179 | 38.3 | 2.23 |
| PLA pellet | 96,278 | 191,067 | 301,996 | 1.98 | |||
| PLA@175 °C | 89,897 | 6.63 | 175,243 | 8.28 | 282,750 | 6.37 | 1.95 |
| PLA@195 °C | 83,776 | 13.0 | 165,795 | 13.2 | 273,597 | 9.4 | 1.98 |
| PLA E@175 °C R@175 °C | 77,530 | 19.5 | 159,903 | 16.3 | 275,111 | 8.9 | 2.06 |
| PLA E@175 °C R@195 °C | 70,813 | 26.4 | 148,616 | 22.2 | 264,357 | 12.5 | 2.10 |
| PLA (%) | Rv (μm) | Rn (μm) |
|---|---|---|
| 10 | 0.179 | 0.167 |
| 20 | 0.197 | 0.176 |
| 30 | 0.259 | 0.227 |
| Samples (PLA/PHBV) | ΔHmPLA (J·g−1) | XcPLA (%) | ΔHmPHBV (J·g−1) | XcPHBV (%) |
|---|---|---|---|---|
| 100/0 | 3.3 | 3.7 | ||
| 90/10 | 2.5 | 2.8 | 0.7 | 4.9 |
| 80/20 | 1.1 | 1.2 | 7.7 | 26.2 |
| 70/30 | 0.5 | 0.6 | 22.1 | 50.5 |
| 60/40 | 4.2 | 4.7 | 33.0 | 56.5 |
| 50/50 | 46.3 | 63.4 | ||
| 40/60 | 56.8 | 64.8 | ||
| 30/70 | 66.3 | 64.9 | ||
| 20/80 | 76.3 | 65.3 | ||
| 10/90 | 84.5 | 64.3 | ||
| 0/100 | 93.9 | 64.3 |
| Polymers | Mw (kg/mol) | ||
|---|---|---|---|
| PLA | 190 | 4.7×10⁵ | 9.5 |
| PHBV | 280 | 2.7×10⁵ | 13.8 |
| γ PLA-PHBV (mJ/m2) | |
|---|---|
| Geometric-mean equation | 1.92 |
| Emulsion model of Palierne | 0.84 |
Publisher’s Note: MDPI stays neutral with regard to jurisdictional claims in published maps and institutional affiliations. |
© 2022 by the authors. Licensee MDPI, Basel, Switzerland. This article is an open access article distributed under the terms and conditions of the Creative Commons Attribution (CC BY) license (https://creativecommons.org/licenses/by/4.0/).
Share and Cite
Qiao, H.; Maazouz, A.; Lamnawar, K. Study of Morphology, Rheology, and Dynamic Properties toward Unveiling the Partial Miscibility in Poly(lactic acid)—Poly(hydroxybutyrate-co-hydroxyvalerate) Blends. Polymers 2022, 14, 5359. https://doi.org/10.3390/polym14245359
Qiao H, Maazouz A, Lamnawar K. Study of Morphology, Rheology, and Dynamic Properties toward Unveiling the Partial Miscibility in Poly(lactic acid)—Poly(hydroxybutyrate-co-hydroxyvalerate) Blends. Polymers. 2022; 14(24):5359. https://doi.org/10.3390/polym14245359
Chicago/Turabian StyleQiao, Hu, Abderrahim Maazouz, and Khalid Lamnawar. 2022. "Study of Morphology, Rheology, and Dynamic Properties toward Unveiling the Partial Miscibility in Poly(lactic acid)—Poly(hydroxybutyrate-co-hydroxyvalerate) Blends" Polymers 14, no. 24: 5359. https://doi.org/10.3390/polym14245359