1. Introduction
Increased global industrialization and environmental pollution have brought about irreversible environmental damage. The international community has been working to establish a circular economy to minimize resource use and waste. For this purpose, eco-innovation has been introduced. Eco-innovation focuses on the demand for sustainable development. It proposed translating waste and byproducts into resources through shifts in technology [
1]. It has been recognized that the waste and byproducts in the food industry can be used as an abundant and cheap source of functional substances. Carbone et al. used white grape pomace aqueous extract as both a reducing and a capping agent to synthetize dendritic silver nanostructures, composed of silver nanoparticles [
2]. Jiang et al. separated the antioxidant peptides from whey protein isolate (WPI) hydrolysate, which is a by-product of the manufacturing process of casein [
3]. Cacciotti et al. reported that multifunctional eco-sustainable systems, based on poly (lactic acid) as the biopolymeric matrix, could be produced using spent coffee grounds extract as an oxygen scavenger and diatomaceous earth as a reinforcing filler in response to an urgent market demand for green and eco-sustainable products [
4]. Effective utilization of by-products in production processes not only save resources but also reduces environmental pollution. Therefore, it is necessary and valuable to explore new technologies and new ideas to reprocess and utilize the waste and byproducts in the production of new commercially valuable products.
Ovalbumin (OVA), a typical globular protein, accounts for the major content of egg white protein at approximately 54% [
5]. It consists of 385 amino acids (45 kDa) [
6] with an isoelectric point (pI) of about 4.5. In addition to it being an ideal protein source with a well-balanced amino acid composition, OVA displays several functional properties, including emulsification, heat-setting, and foaming. Furthermore, OVA has been reported as an effective drug carrier [
7] and it can be applied for tumor suppression owing to its tumor necrosis releasing factors [
8].
OVA has been extracted and purified from egg white proteins by several methods, including salt precipitation, various chromatography methods, electrophoresis, and ultrafiltration. It was first isolated from egg white in the 1900s by ammonium sulfate precipitation [
9]. The method based on the experiment was further researched by Warner and Weber et al. [
10]; however, the low purity and irreversible unfolding caused by the high salt concentration implied that ammonium sulfate precipitation was not a satisfactory method for extracting OVA. A chromatographic method was first used to extracted OVA from egg white in 1960 [
11]. Since then, some chromatography methods, such as anion exchange chromatography [
12], reversed-phase high-performance liquid chromatography, and gel-permeation chromatography [
13], were developed to extract OVA. Nevertheless, it is difficult for chromatographic methods to be used in the industry due to their low yield, expensive operating costs, and high equipment requirement. OVA was separated by electrophoresis from egg white [
14]; however, denaturation was observed during the extracting process. Ultrafiltration was applied to separate OVA [
15]; however, ultrafiltration membranes lack selectivity and are easily contaminated during ultrafiltration [
16]. Therefore, it is necessary to develop an economical and simple method to isolate OVA from egg white.
An aqueous two-phase system (ATPS) has been widely studied in the past decades due to its advantages, such as enhanced selectivity, process integration, scale-up, low toxicity, continuous operation, and biocompatibility, and it was effectively applied for the extraction and purification of some biomolecules [
17]. The most common ATPSs are formed by polymers (usually polyethylene glycol (PEG)) and a salt (e.g., phosphate, citrate or sulfate) [
17]. Hence, ATPSs composed of PEG and salt were applied to extract proteins from egg white. In 2006, the separation of lysozyme from egg white by an ATPS composed of polyethylene glycol (PEG 6000) and sodium sulfate was reported by Su et al. [
18]. In 2009, Fabíola et al. [
19] discovered that ovomucoid could be extracted from egg white by an ATPS consisting of PEG 1500 and sodium carbonate, and the extraction of avidin was reported by ATPS in 2013 [
20]. In 2016, Pereira et al. [
21] reported that an ATPS consisting of PEG 400 and potassium citrate/citric acid (pH 7.0) was developed to extract OVA from egg white, with a recovery yield of 65%. However, it was found that the system could not extract OVA from salted egg white by our preliminary experiments.
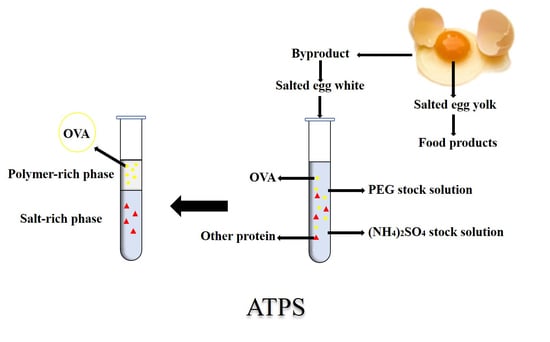
Salted eggs are a famous traditional egg product in China. Salted egg yolk is widely used in a variety of food products, such as mooncakes [
22]. Salted egg white is a byproduct of the manufacture process of salted egg yolk, and is normally treated as a waste. The annual output of salted egg white exceeds 10,000 tons. Salted egg white thus has a tremendous annual output without a reasonable application. The direct discharge of salted egg white containing a large amount of salt and protein not only wastes protein resources, but also pollutes the environment. At present, the main treatment methods are its direct use as a food additive, desalting treatment, enzymatic treatment, and the extraction of lysozymes [
23]. Based on the concept of eco-innovation, we tried to separate OVA from salted egg whites. The aim of this study was to develop a simple, inexpensive, and efficient process for the separation of OVA from salted egg white, so as to improve the utilization of protein resources and reduce pollution. With this goal, the separation of OVA from salted egg white by PEG 1000/ammonium sulphate ATPS was studied for the first time, and sodium dodecyl sulfate polyacrylamide gel electrophoresis (SDS–PAGE), reversed-phase high-performance liquid chromatography (RP-HPLC), liquid chromatography-nano electrospray ionization mass spectrometry (Nano LC-ESI-MS/MS), and Fourier transform infrared spectroscopy (FT-IR) were applied to characterize the obtained OVA.
2. Materials and Methods
2.1. Instruments
Chromatographic analysis was carried out on a Waters e2695 high performance liquid chromatograph (Waters, Waters Corporation, Milford s, Massachusetts, USA) equipped with C8 and C18 columns and an ultraviolet visible detector (Waters, Waters Corporation, Milford, Massachusetts, USA). An SC-3610 low-speed centrifuge was utilized for auxiliary phase separation (Anhui Zhongke Zhongjia Scientific Instrument Co., Ltd., Hefei, China). The employed ultraviolet-visible spectrophotometer was from Beijing Purkinje General Instrument Co., Ltd (Beijing, China). The employed A150011 vortex mixer was from Nanjing Jiajun Biological Co., Ltd (Nanjing, China). An FE201EL20 pH meter was utilized to determine the pH of the solutions, and an AL-04 electronic analytical balance (Mettler Toledo Instruments Co., Ltd., Shanghai, China) was used for weighing.
2.2. Reagents
Polyethylene glycol (PEG), with an average molecular weight (MW) of 1000 Da, was from Sinopharm Chemical Reagent Co., Ltd. (Shanghai, China). The SDS–PAGE electrophoresis kit was from Beijing Solarbio Technology Co., Ltd. (Beijing, China). Trifluoroacetic acid (TFA) and acetonitrile were chromatographically pure (Dikma, Beijing, China). OVA from hen egg white was obtained from SigmaUSA. Salted eggs were purchased in a supermarket. Other reagents used were of analytical grade.
2.3. Preparation of ATPS and Purification
The ATPSs were prepared by mixing the appropriate amount of PEG 1000 in a stock solution of ammonium sulfate in 10 mL graduated centrifuge tubes. Next, 10% (v:v) salted egg white solution was added to each system. The pH of the mixture was adjusted using NaOH (10 mol/L). The systems were vigorously mixed by a vortex mixer and centrifuged at 716 × g for 10 min to induce phase separation. The phase volumes were measured and then the top phases were collected for further analysis.
Salted egg white solution and top phases of ATPS were dialyzed (13,000 Da) overnight against deionized water to remove the salt and PEG 1000. They were then lyophilized to obtain the purified protein.
2.4. Definition of the Distribution of Protein in ATPS
The concentrations of protein in top phases of the ATPSs and salted egg white solution were determined by the Bradford method [
24]. Using BSA (albumin from bovine serum) as a standard, the samples were measured at 595 nm. The separation parameters were calculated using the following formulae:
where
Y is the recovery yield of OVA in ATPS,
P is the purity of OVA,
MOVA and
M are the weight measured by RP-HPLC of OVA in the top phase and salted egg white solution, respectively.
MTotal Proteins was the total protein in the top phase.
2.5. Experimental Design
In order to optimize the interaction between the separation parameters and parallel factors, a response surface method (RSM) experiment was carried out on the basis of a single-factor experiment. The effects of various factors, including
X1 (the mass fraction of PEG),
X2 (the mass fraction of (NH
4)
2SO
4),
X3 (the pH value), and
X4 (the salted egg white solution), were studied. The range of coded variable levels was determined by a single factor experiment. The experimental design is shown in
Table 1.
Y and the
P were taken as the responses of the experiments. Each experiment was replicated three times.
A second-order polynomial equation model was used to fit the
Y and
P data with interaction terms, as given below:
where
M is the predicted response value;
A0,
Ai,
Aij, and
Aii are the regression coefficients of the model for the intercept, linear, cross-product, and quadratic terms, respectively; and
xi is the variable under study [
25].
2.6. Electrophoresis
Twelve percent bis-acrylamide homogeneous gel was selected as the SDS-PAGE electrophoresis condition to identify proteins. The gel was run at a constant voltage of 80 V for about 20 min for stacking the gel, and at 120 V for 55 min for separating the gel. After the end of the electrophoresis, the tape was sequentially stained with Coomassie Brilliant Blue R-250 for 30 min and decolorized with eluent [
26].
2.7. RP-HPLC
RP-HPLC was used to analyze the protein in the top phase before and after purification. The conditions for RP-HPLC were as follows: Waters C
8 column (4.6 mm × 150 mm), 0.05% TFA in acetonitrile as mobile phase A, 0.05% aqueous TFA as mobile phase B, flow rate of 1.00 mL/min, and detection wavelength of 280 nm. Gradient elution was programmed as follows: the concentration of mobile phase A was increased from 7% to 70% in 17 min and decreased to 7% before 22 min [
27].
2.8. FT-IR
A 2 mg sample of powder was mixed with 200 mg of potassium bromide powder, which was ground under an infrared baking lamp for 10 min and pressed in a mold. The measurement parameters were: resolution 4 cm
−1, wave number accuracy 0.01 cm
−1, 64 scanning times, ambient temperature 25 °C, infrared scanning wavenumber 400 cm
−1–4000 cm
−1. The sample was detected by FT-IR. The experiment was repeated three times [
28]. After obtaining the infrared spectra, the protein conformation was analyzed by Peak Fit v4.12 software.2.9.
Nano LC-ESI-MS/MS.
Nano LC-ESI-MS/MS analysis of a digested protein sample was carried out by an HPLC system with a C18 column (75 μm × 80 mm). The HPLC solvent A was 97.5% water, 2% acetonitrile, and 0.5% formic acid. The HPLC solvent B was 9.5% water, 90% acetonitrile, and 0.5% formic acid. The gradient elution process is described as follows. The concentration of mobile phase B was improved from 2% to 90% within 60 min. The column flow rate was around 800 nanoliter per minute after splitting. The typical sample injection volume was 3 µL. The HPLC system was on-line coupled with a linear ion trap mass spectrometer (LTQ, Thermo) so that a sample eluted from the HPLC column was directly ionized by an electrospray ionization (ESI) process and entered into the mass spectrometer. The ionization voltage was often optimized in the instrument tuning process and normally in a range of 1.5–1.8 kv. The capillary temperature was set at 100 °C. The mass spectrometer was set at the data-dependent mode to acquire MS/MS data via a low energy collision induced dissociation (CID) process. The default collision energy was 33% and the default charge state was 3. One full scan with one microscan with a mass range of 350 amu to 1650 amu was acquired, followed by nine MS/MS scans of the nine most intense ions with a full mass range and three microscans. The dynamic exclusion feature was set as follows: repeat count of 1 and exclusion duration of 1 min. The exclusion width was 4 Da.
4. Conclusions
In this study, the single-step extraction of OVA from salted egg white using an ATPS containing PEG 1000/(NH4)2SO4 was investigated successfully. The optimum ATPS conditions were obtained using response surface methodology and a Box–Behnken experimental design. Under optimum conditions, including 20% PEG 1000 (w/w), 16% (NH4)2SO4 (w/w), pH 9, and 1 g salted egg white solution, maximum Y and the P values of 89.25 ± 0.76% and 96.28 ± 0.97%, respectively, could be reached. Separating ovalbumin through the ATPS proved to be efficient based on the determination of SDS–PAGE, RP-HPLC, Nano LC-ESI-MS/MS, and FT-IR analyses. Therefore, it was suggested that the ATPS could be a valuable protocol for the separation of OVA from salted egg white. It might be an effective and sustainable way to reduce environmental pollution and improve the utilization of salted egg white. The goal of extracting OVA from salted egg white was achieved to some degree; however, purification method need to be further studied.


