Investigation of the Effects of Non-Conjugated Co-Grafts on the Spectroelectrochemical and Photovoltaic Properties of Novel Conjugated Graft Copolymers Based on Poly(3-hexylthiophene)

 , ,
, , 
 , and
, and
Abstract
:
1. Introduction
2. Materials and Methods
2.1. Materials
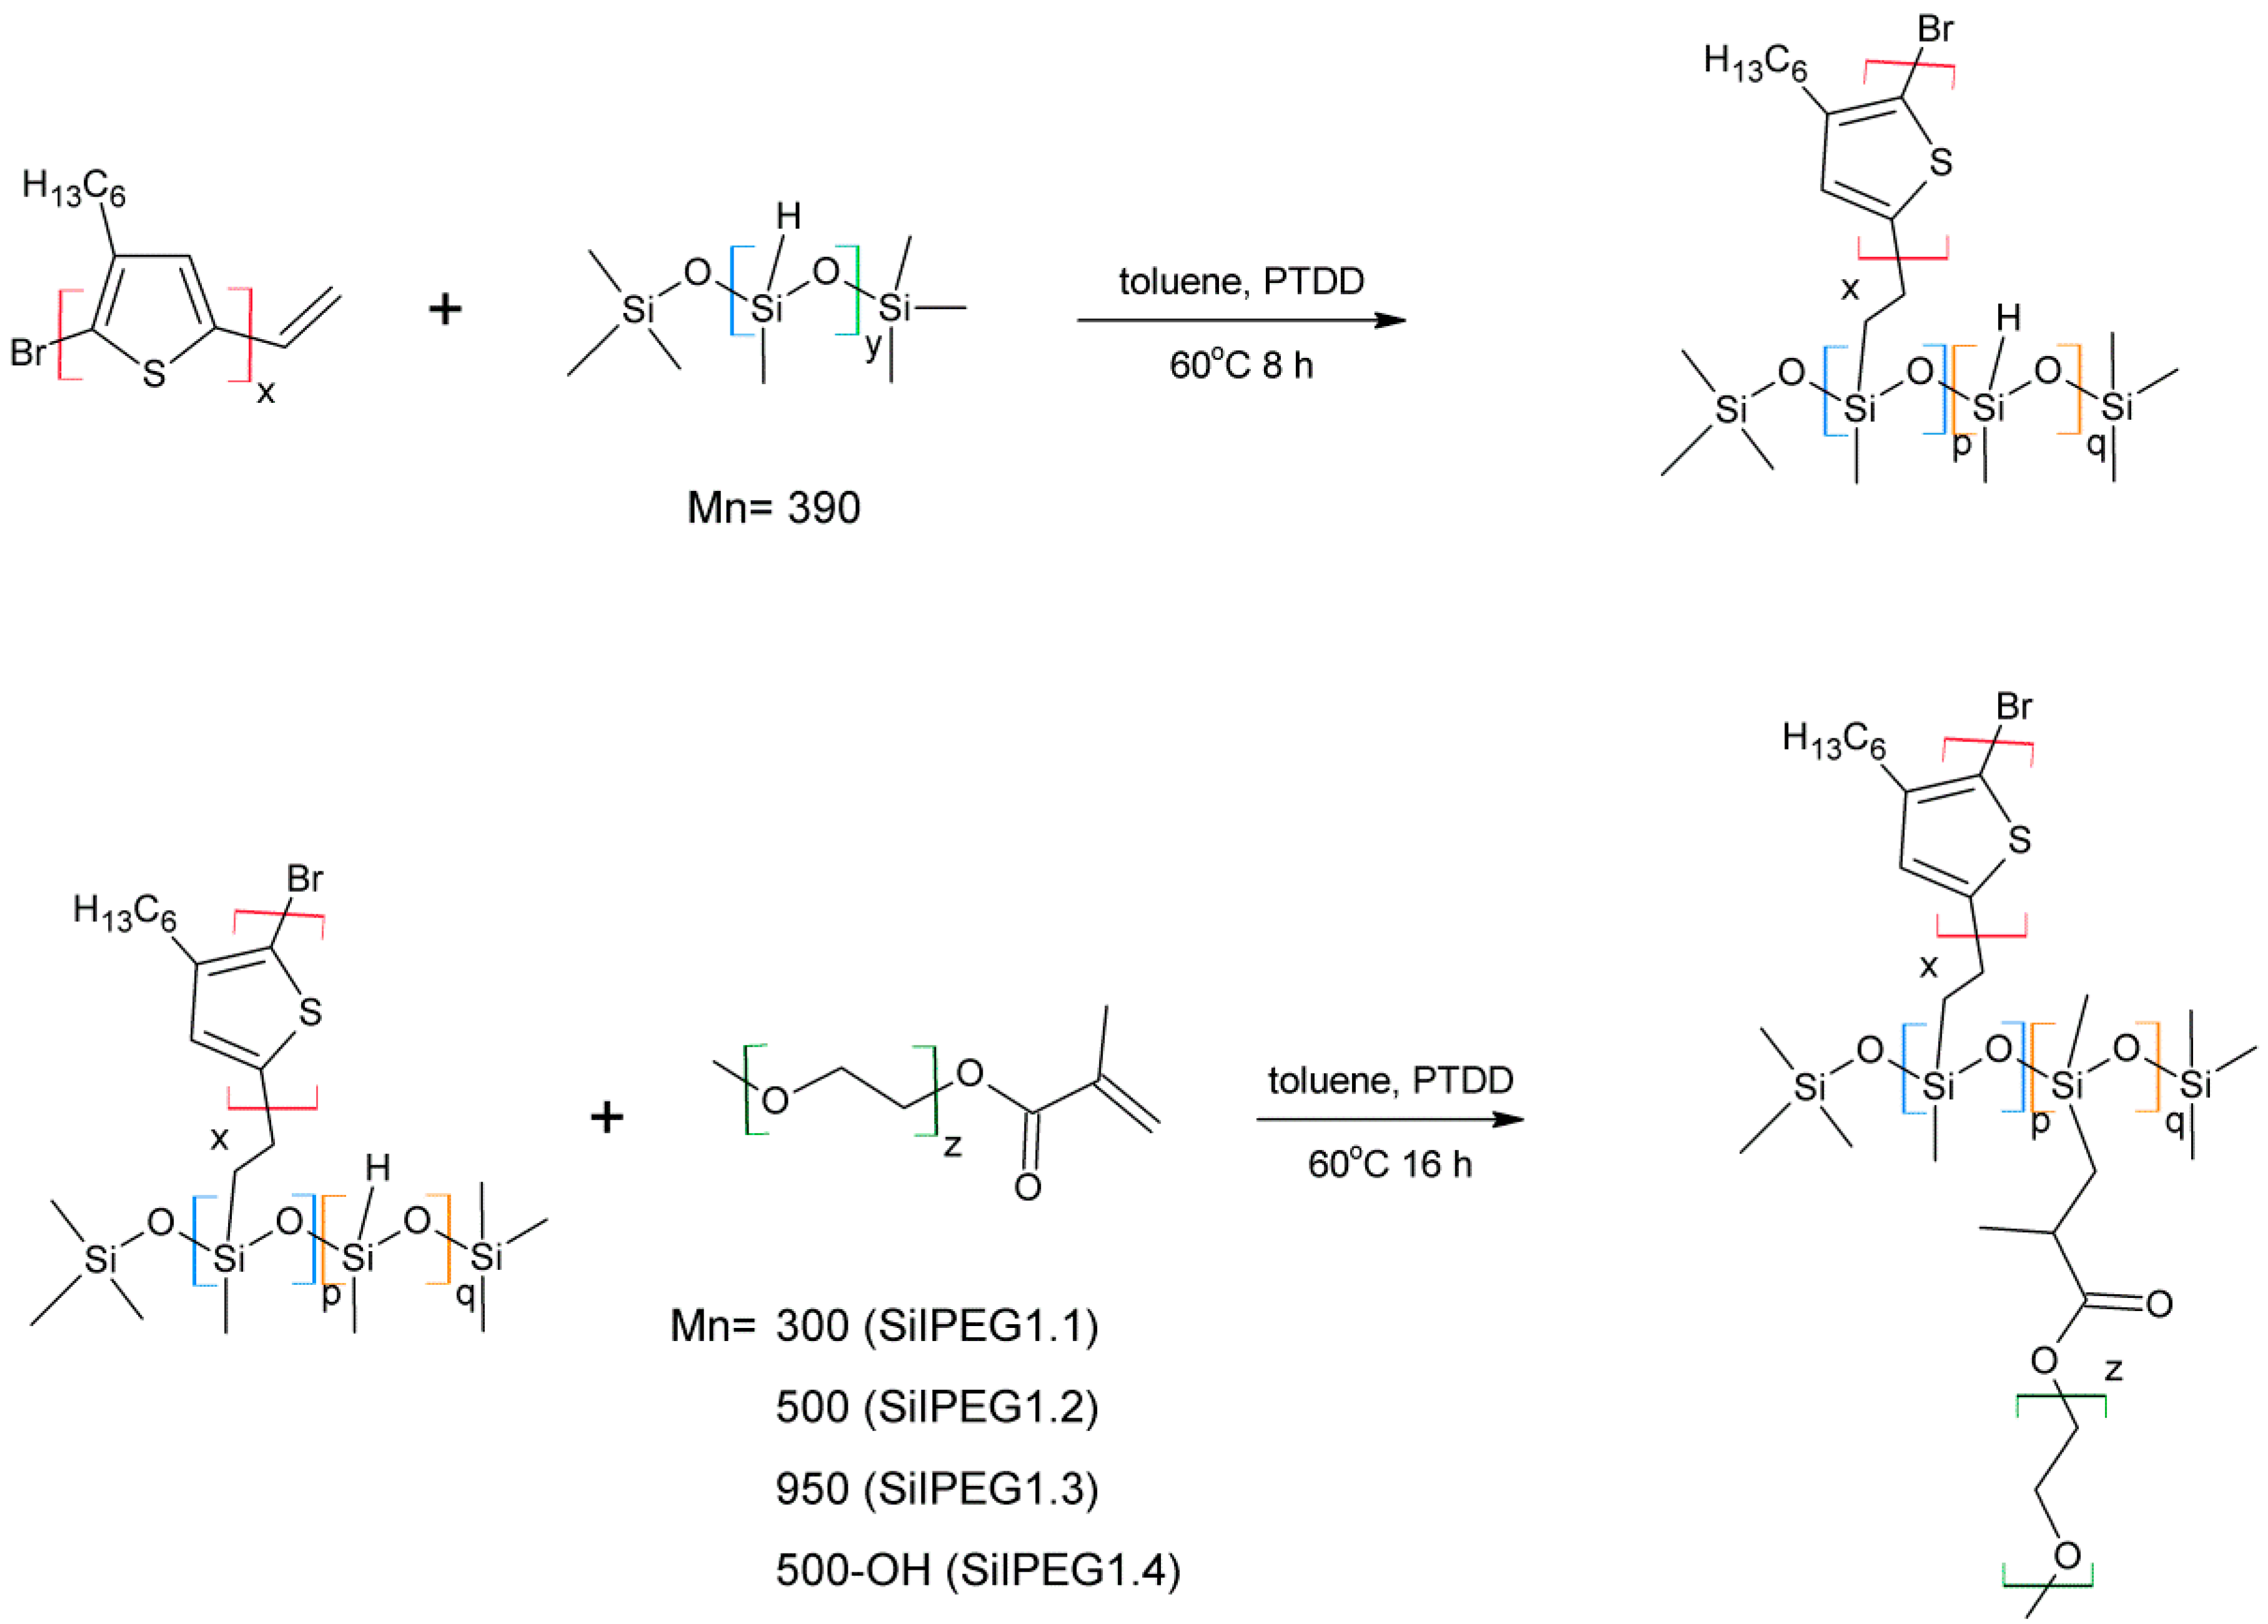
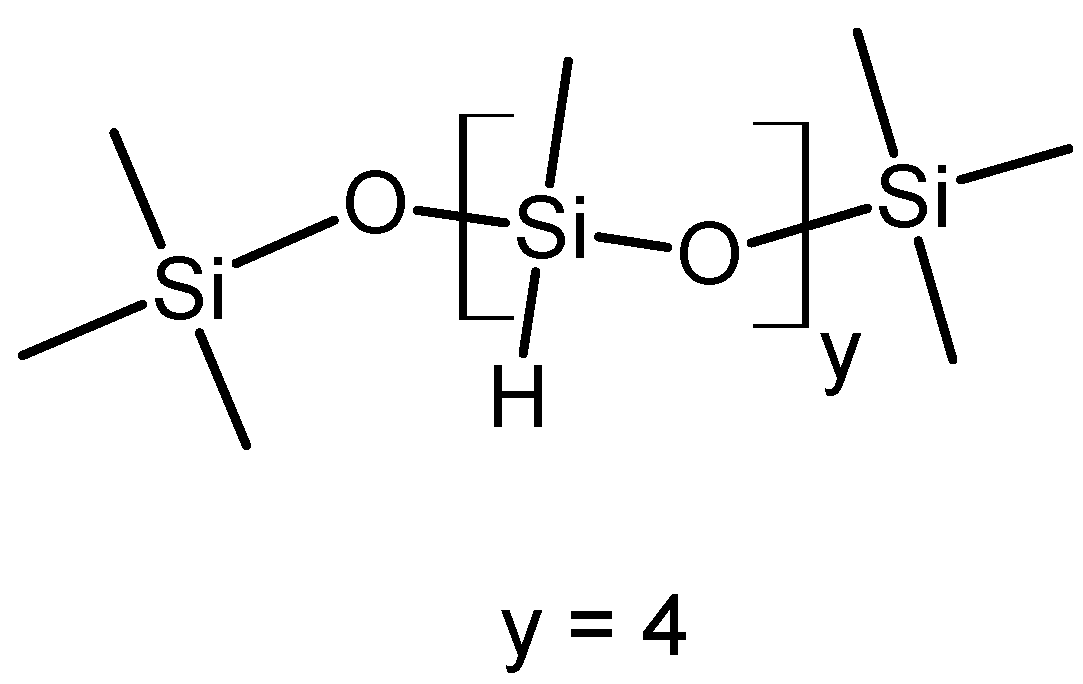
2.2. Syntheses
2.3. Molecular Characterisation
2.4. Electrochemical, Spectroelectrochemical, and Conductometric Measurements
2.5. Solar Cell Fabrication and Investigation
3. Results and Discussion
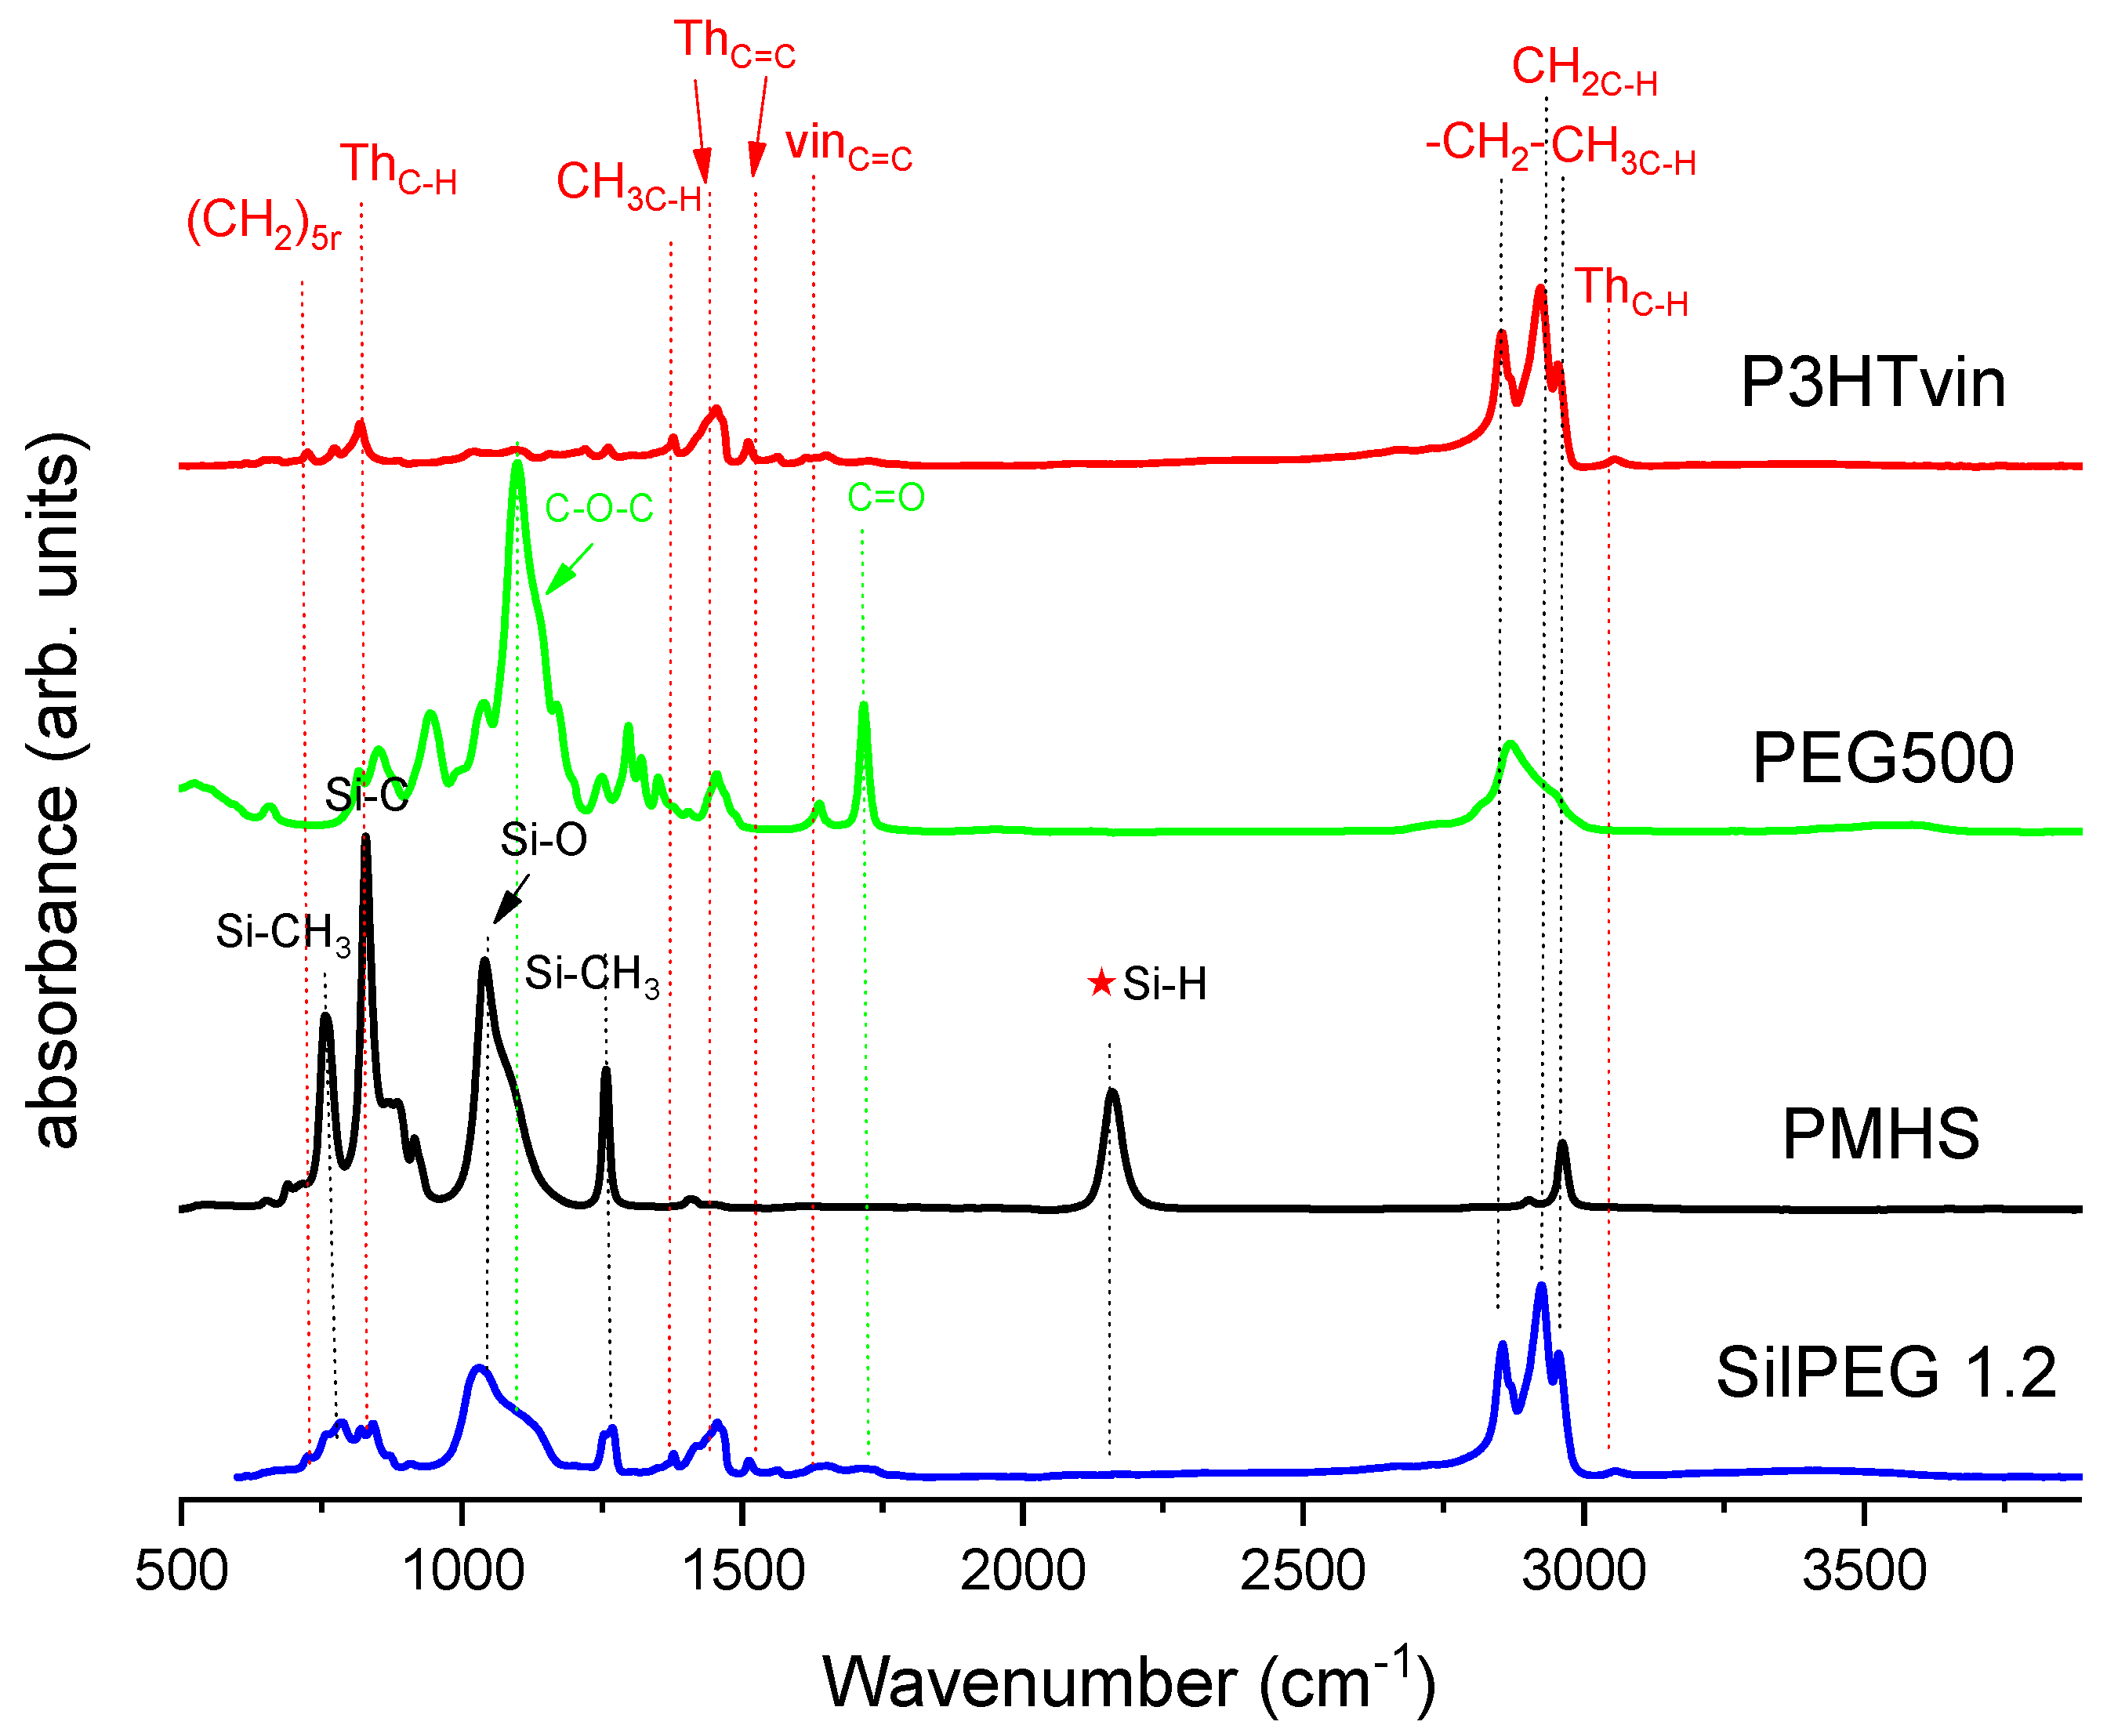
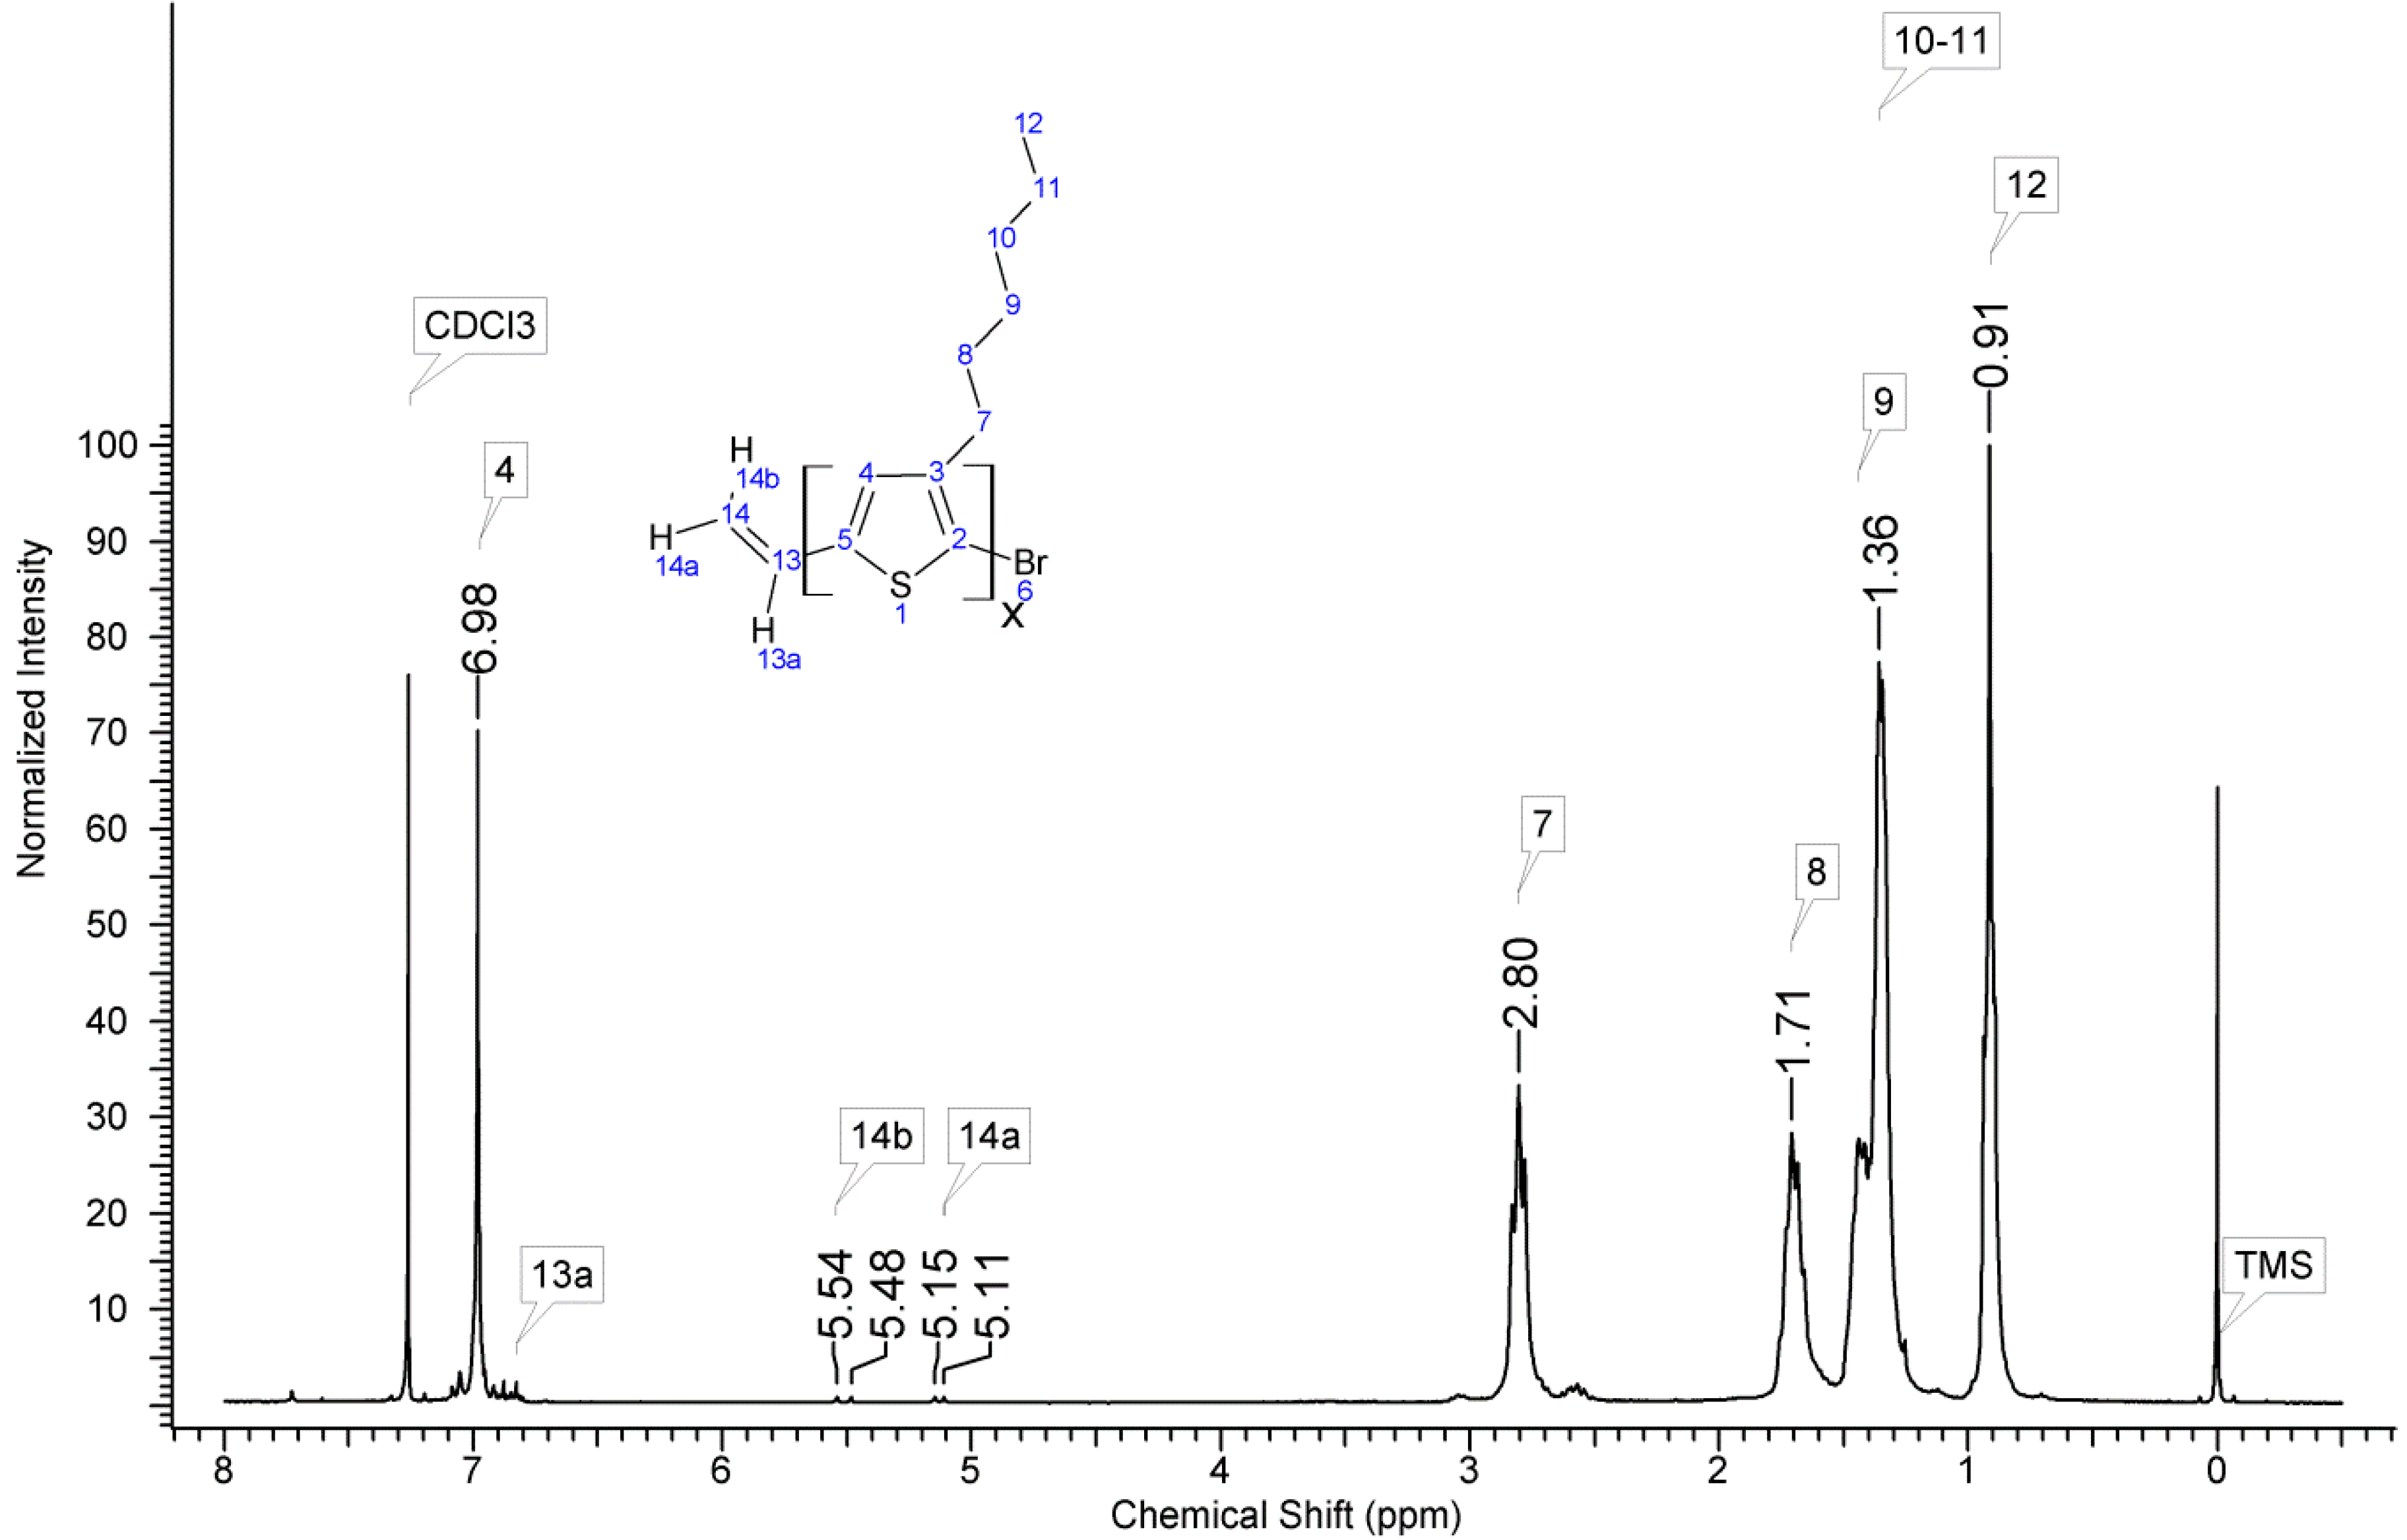
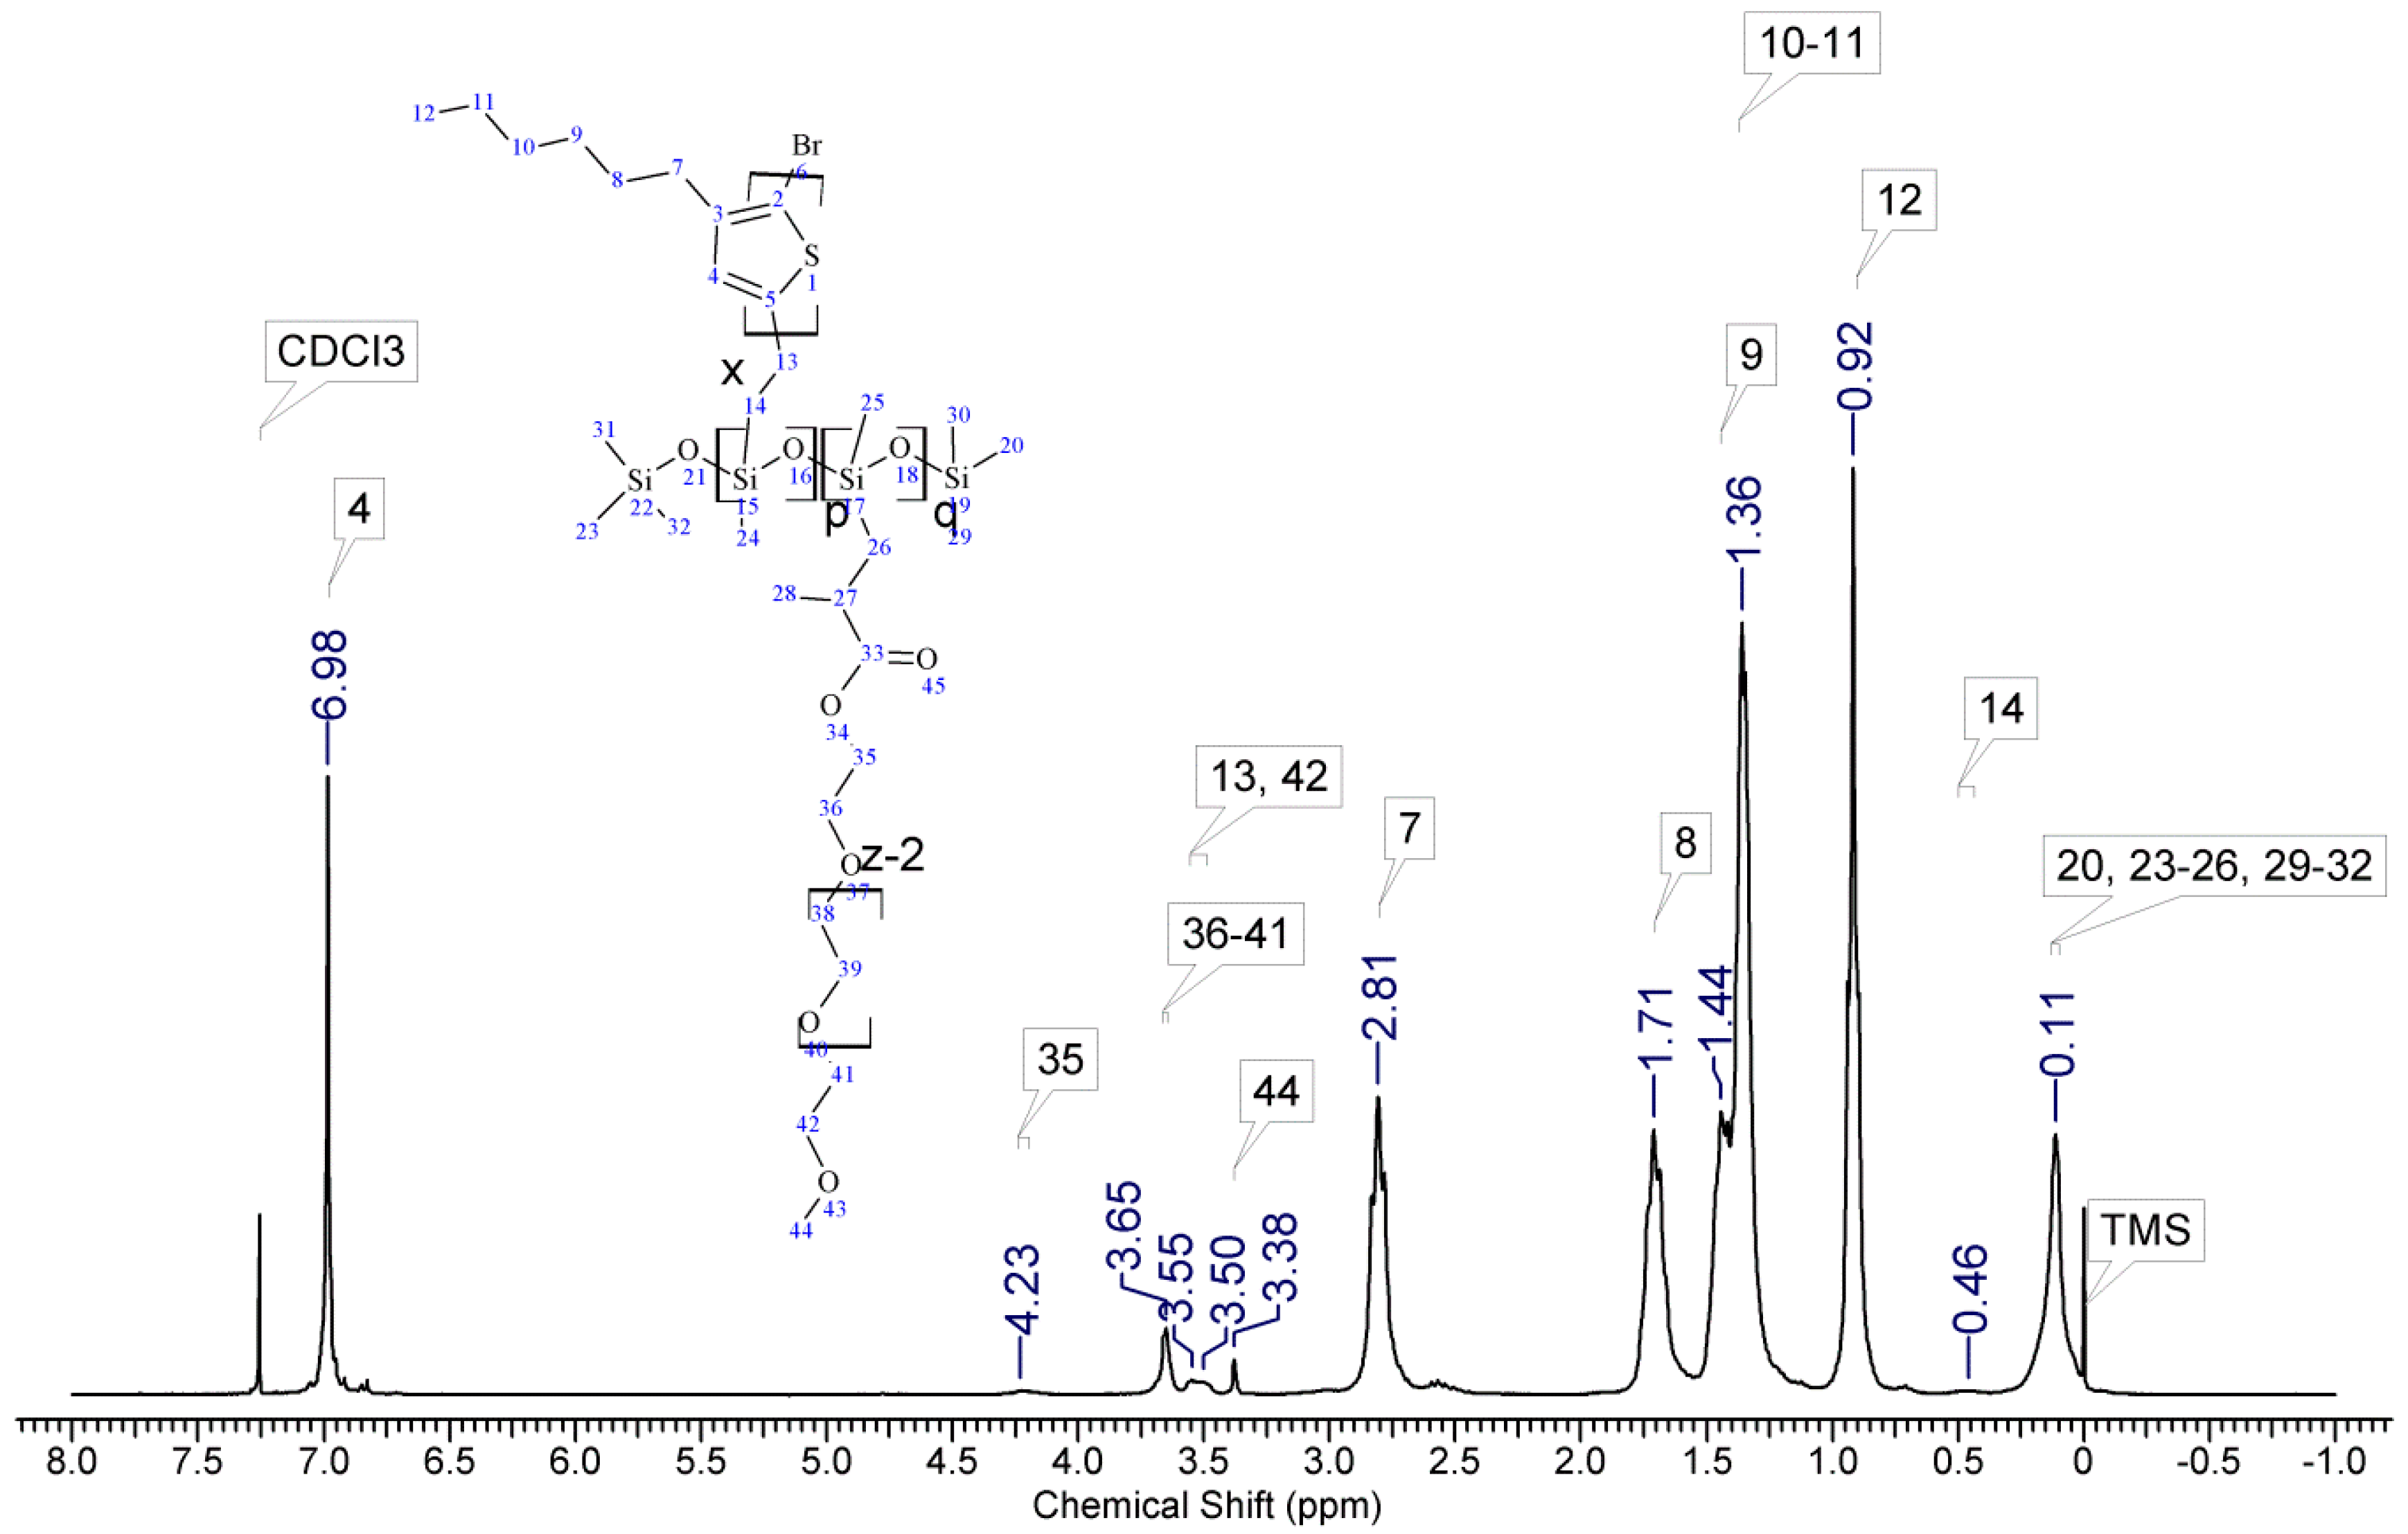
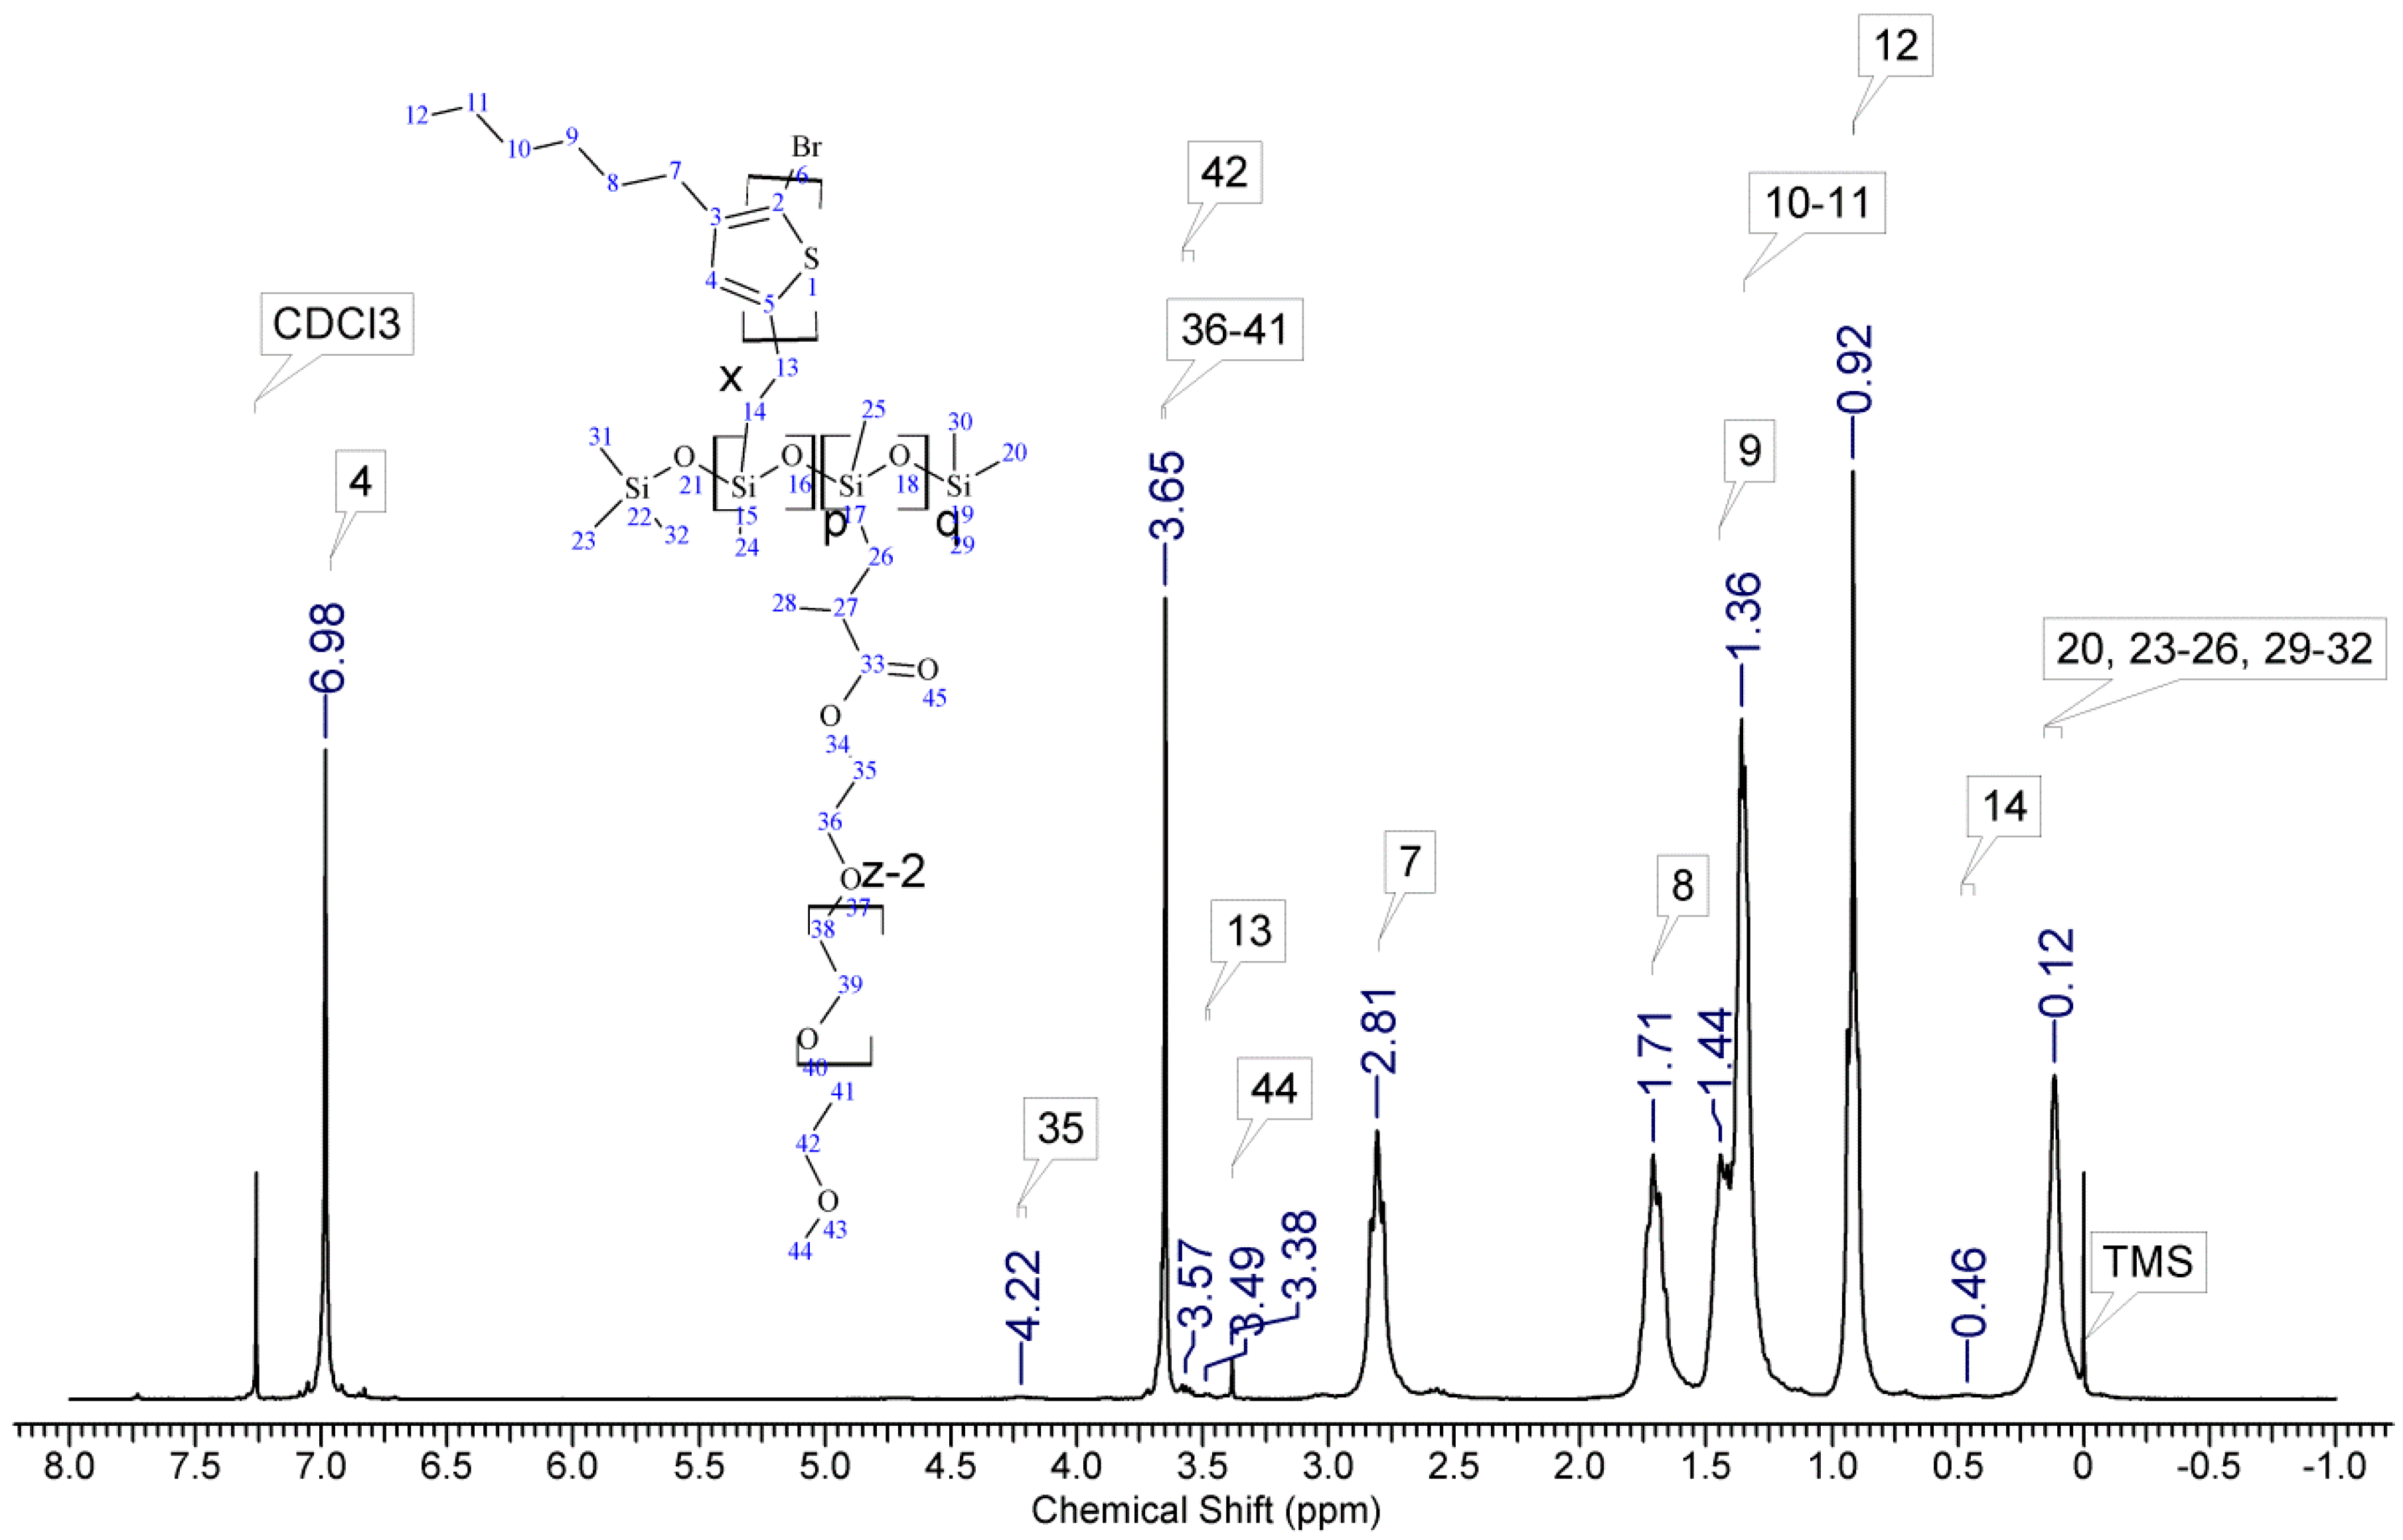
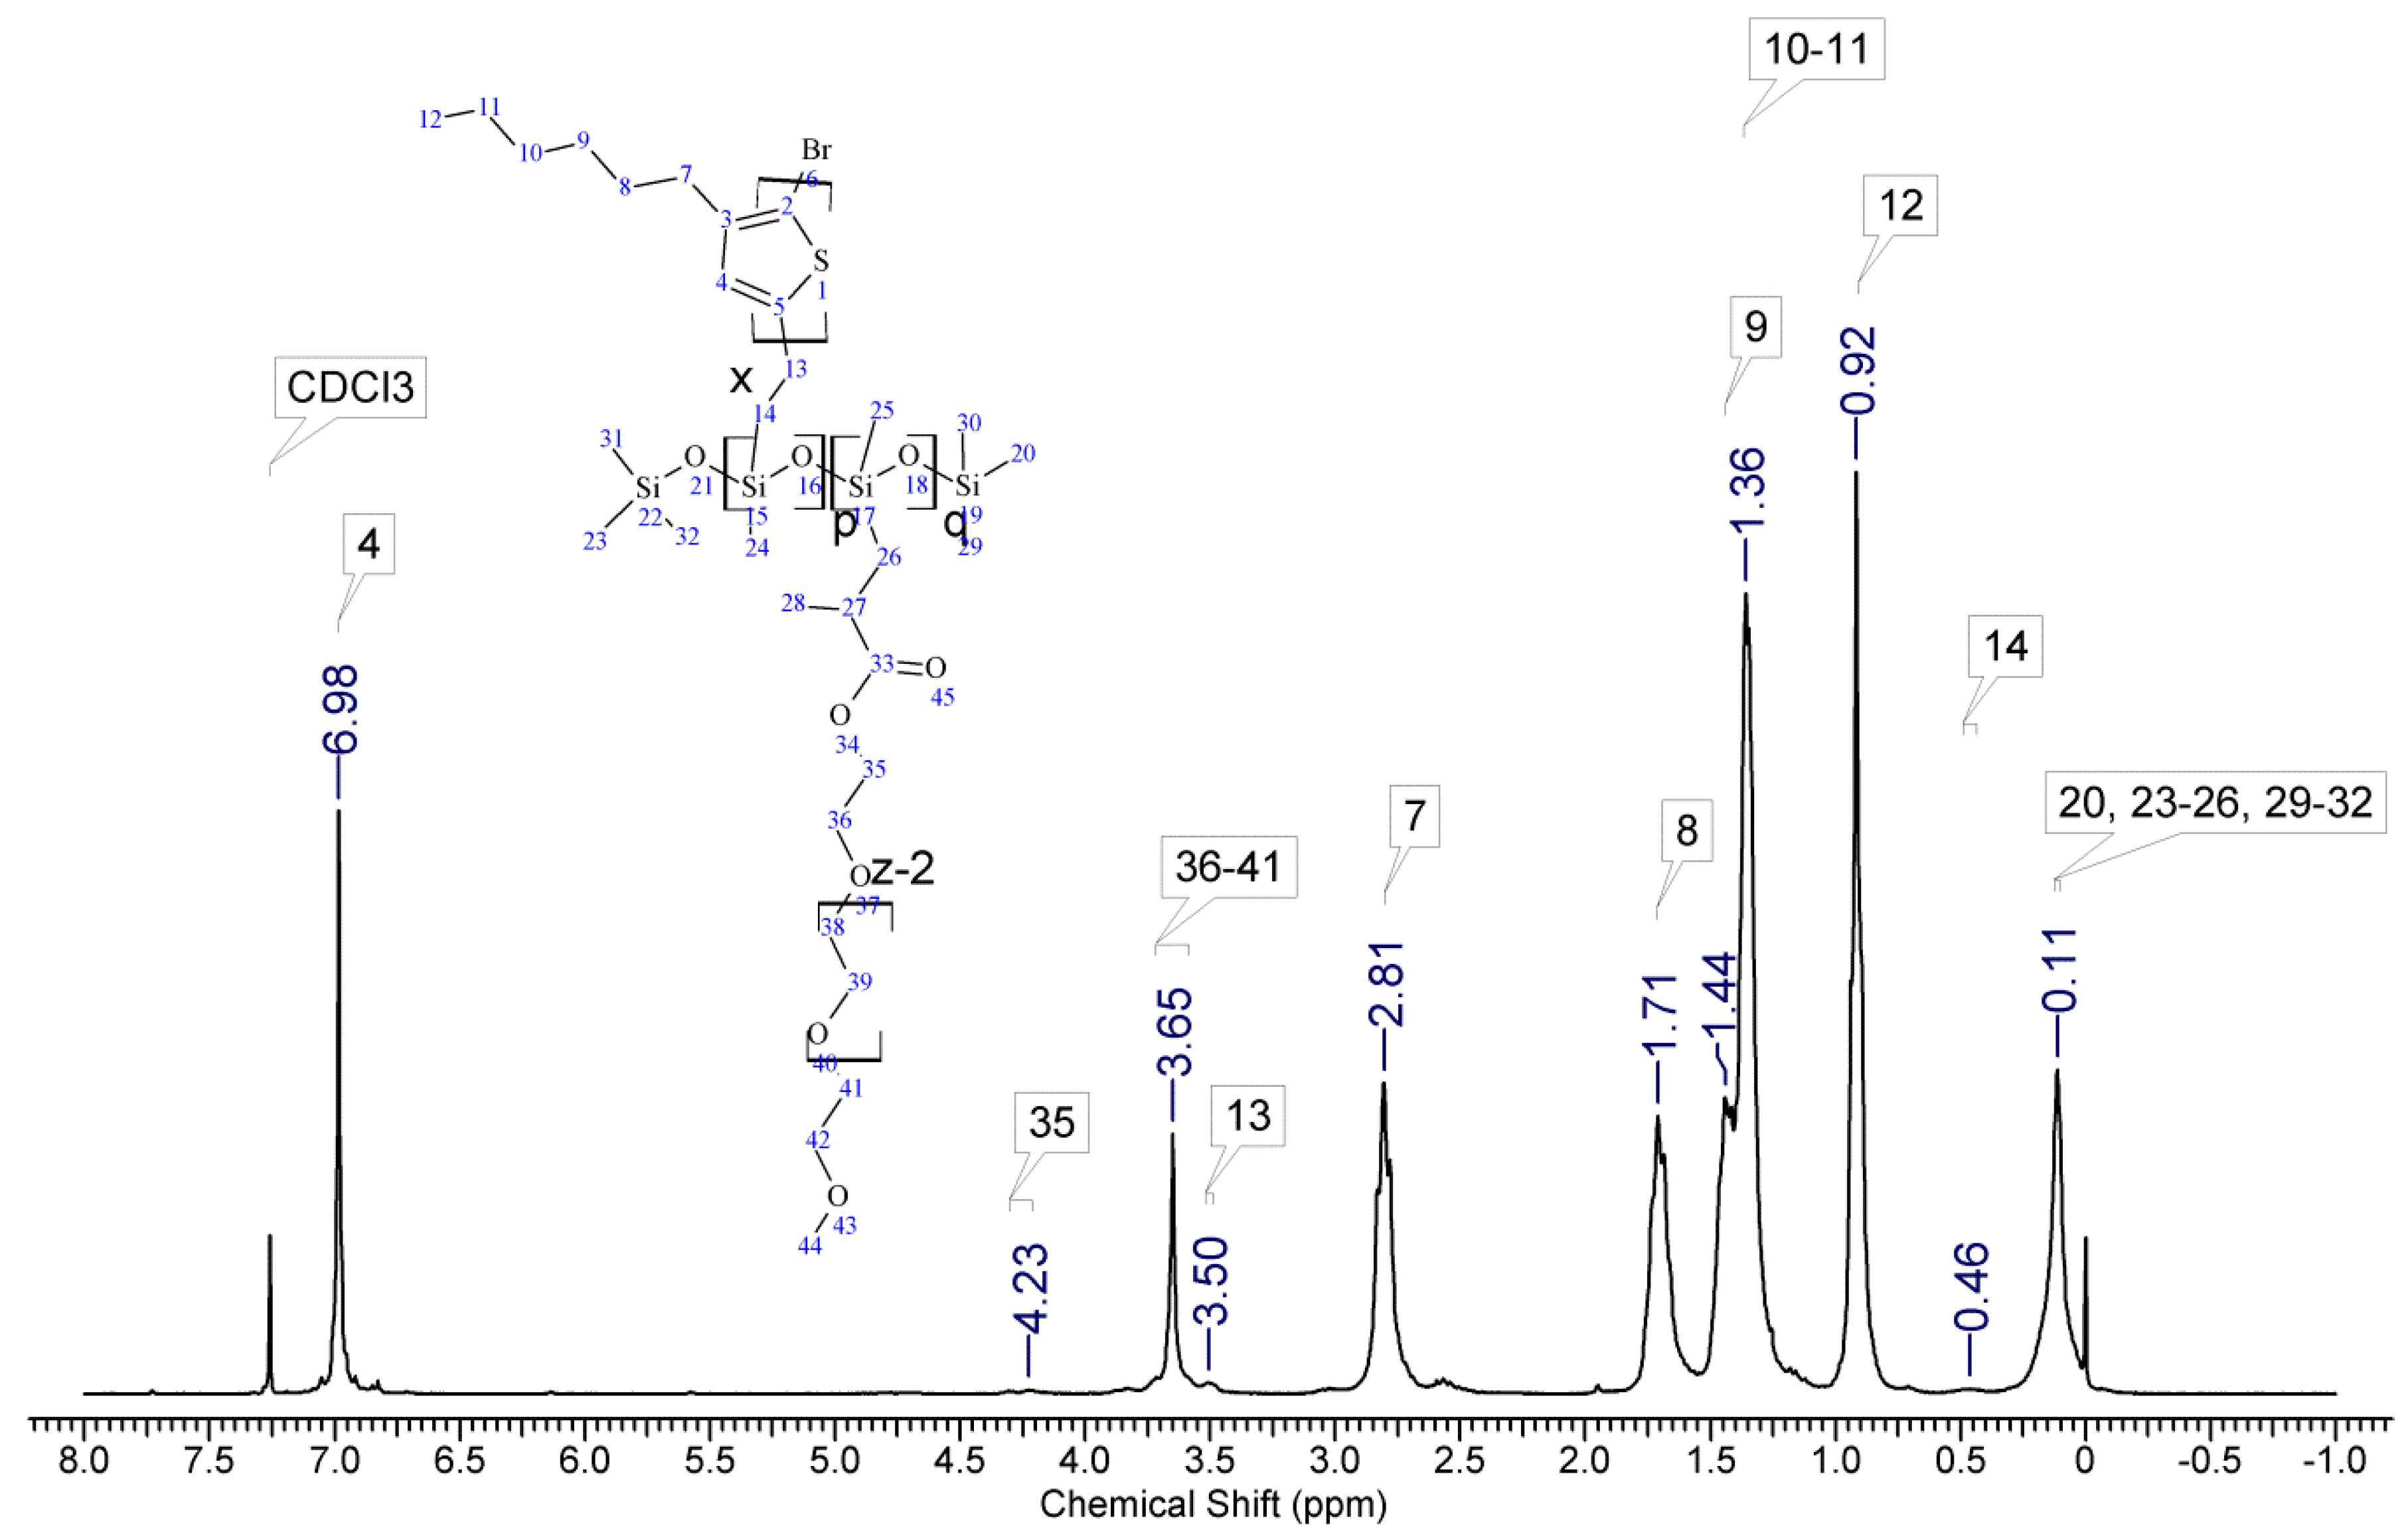
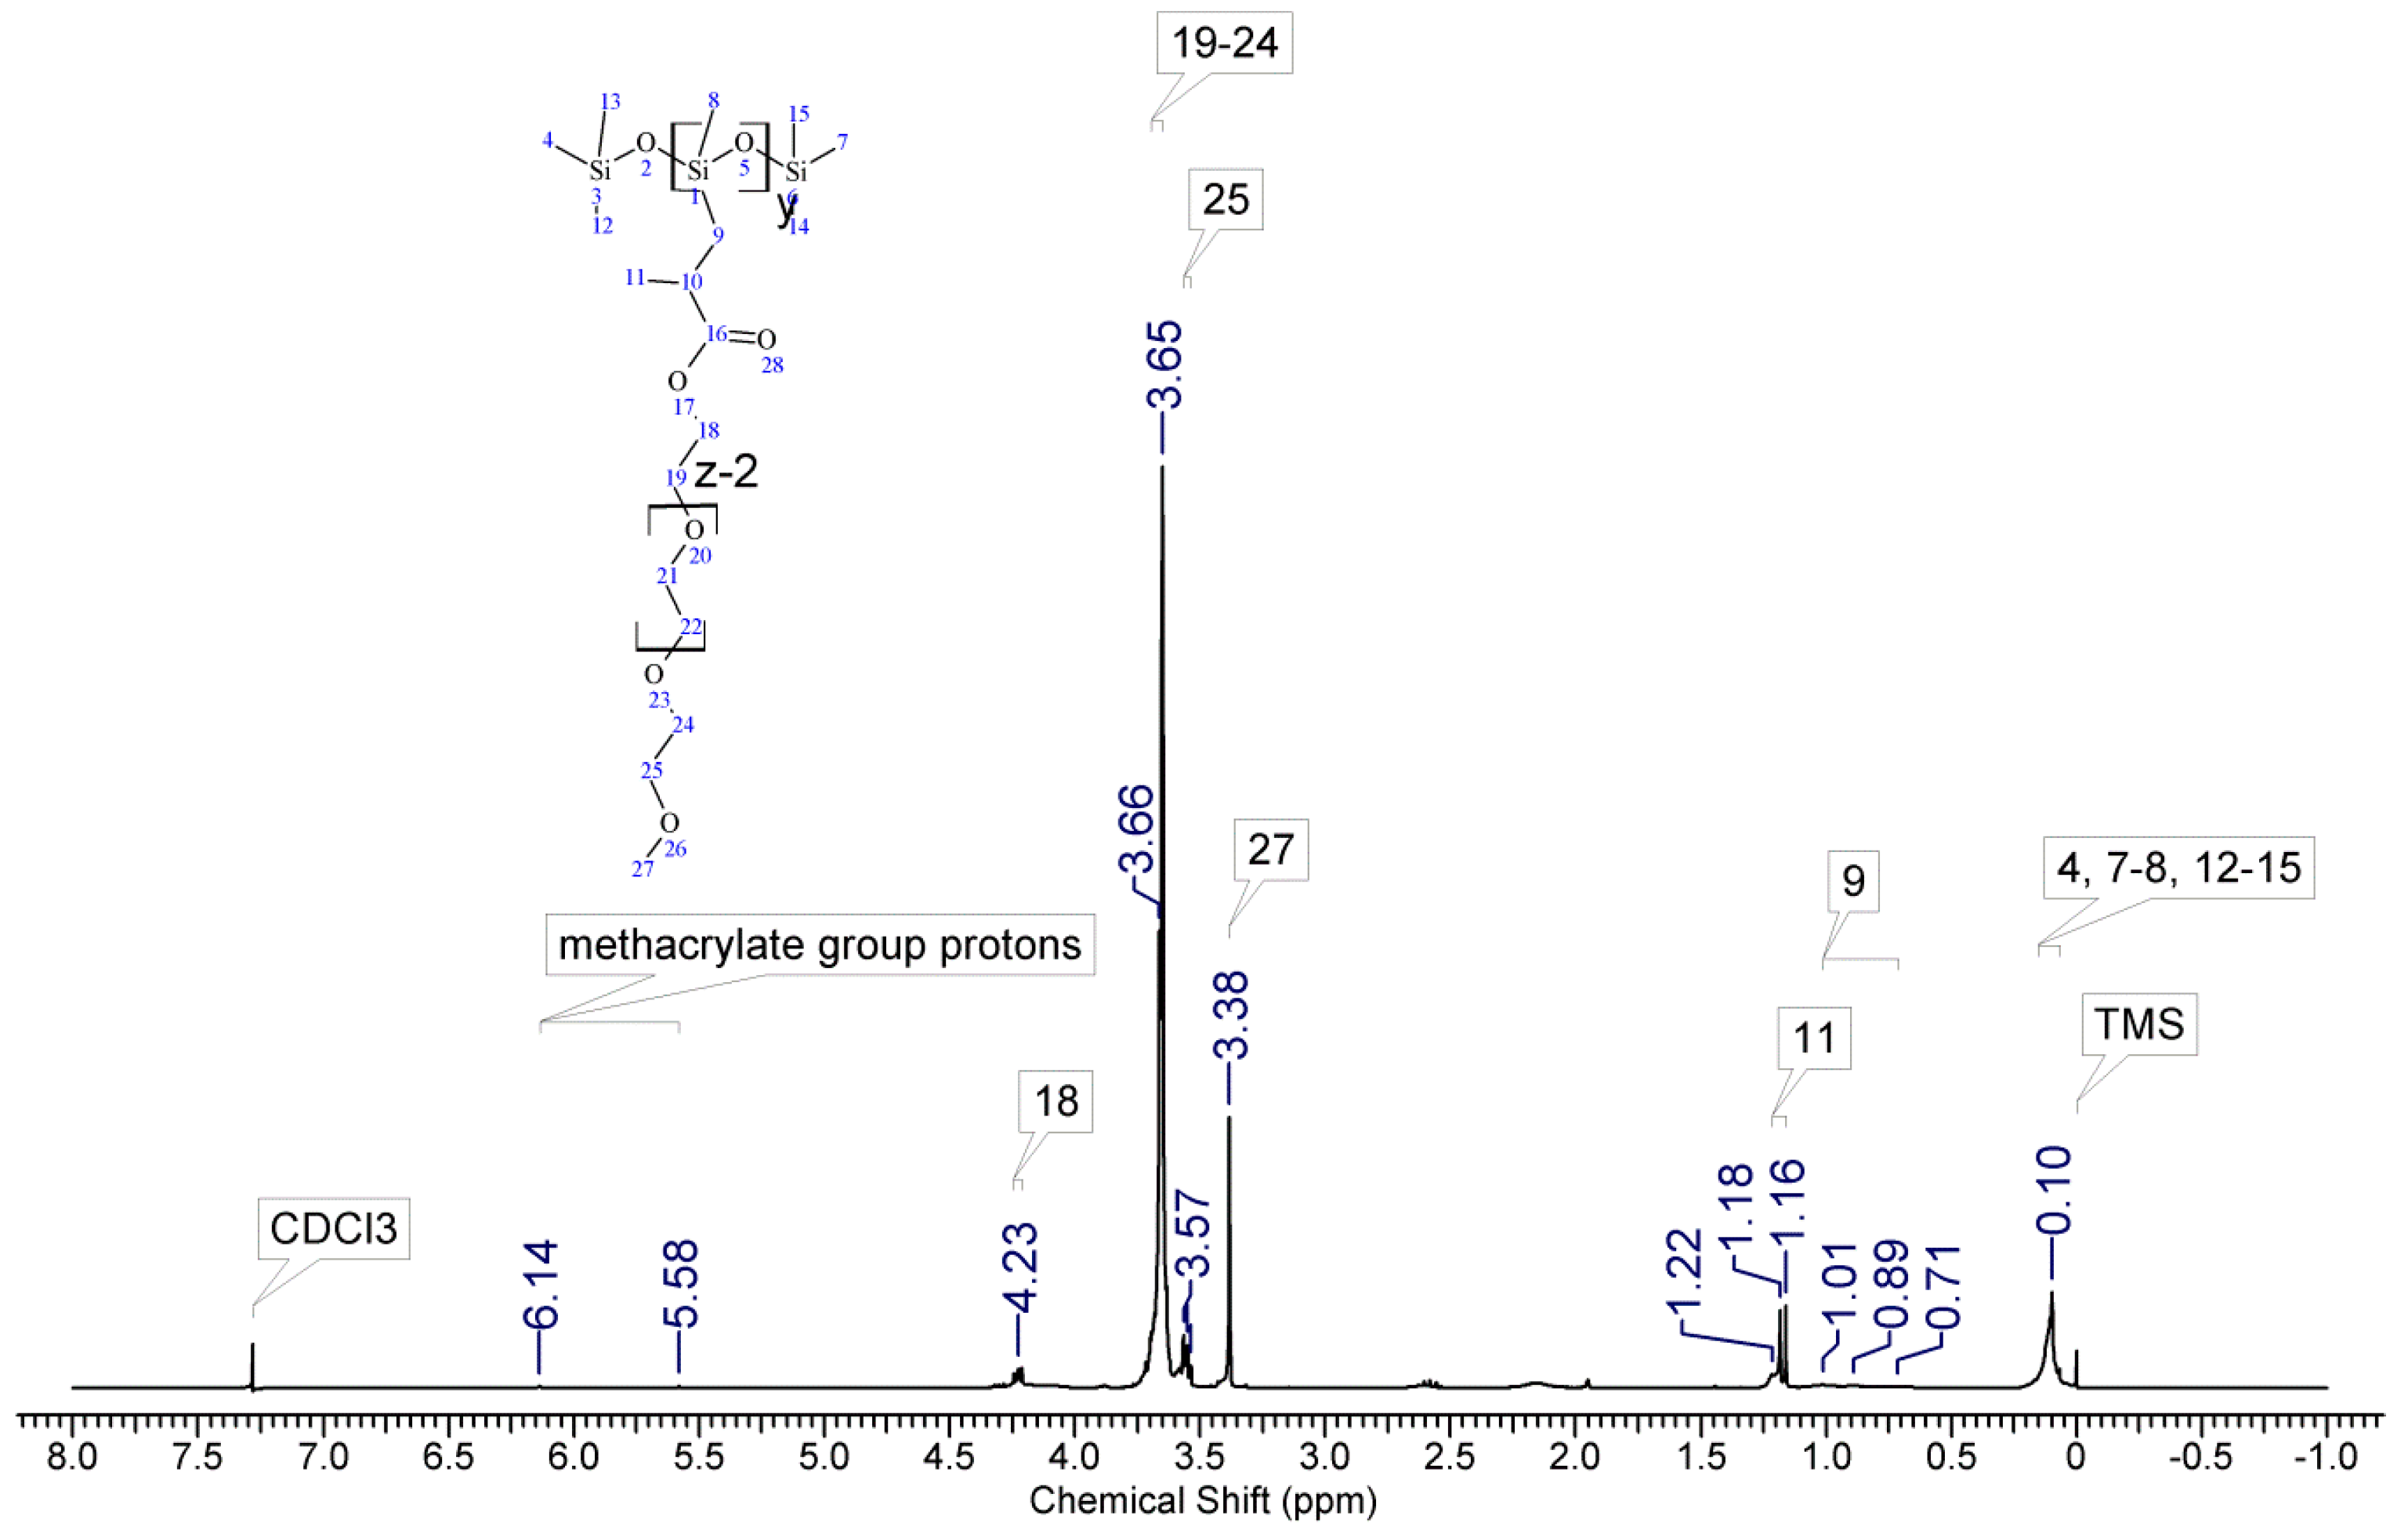
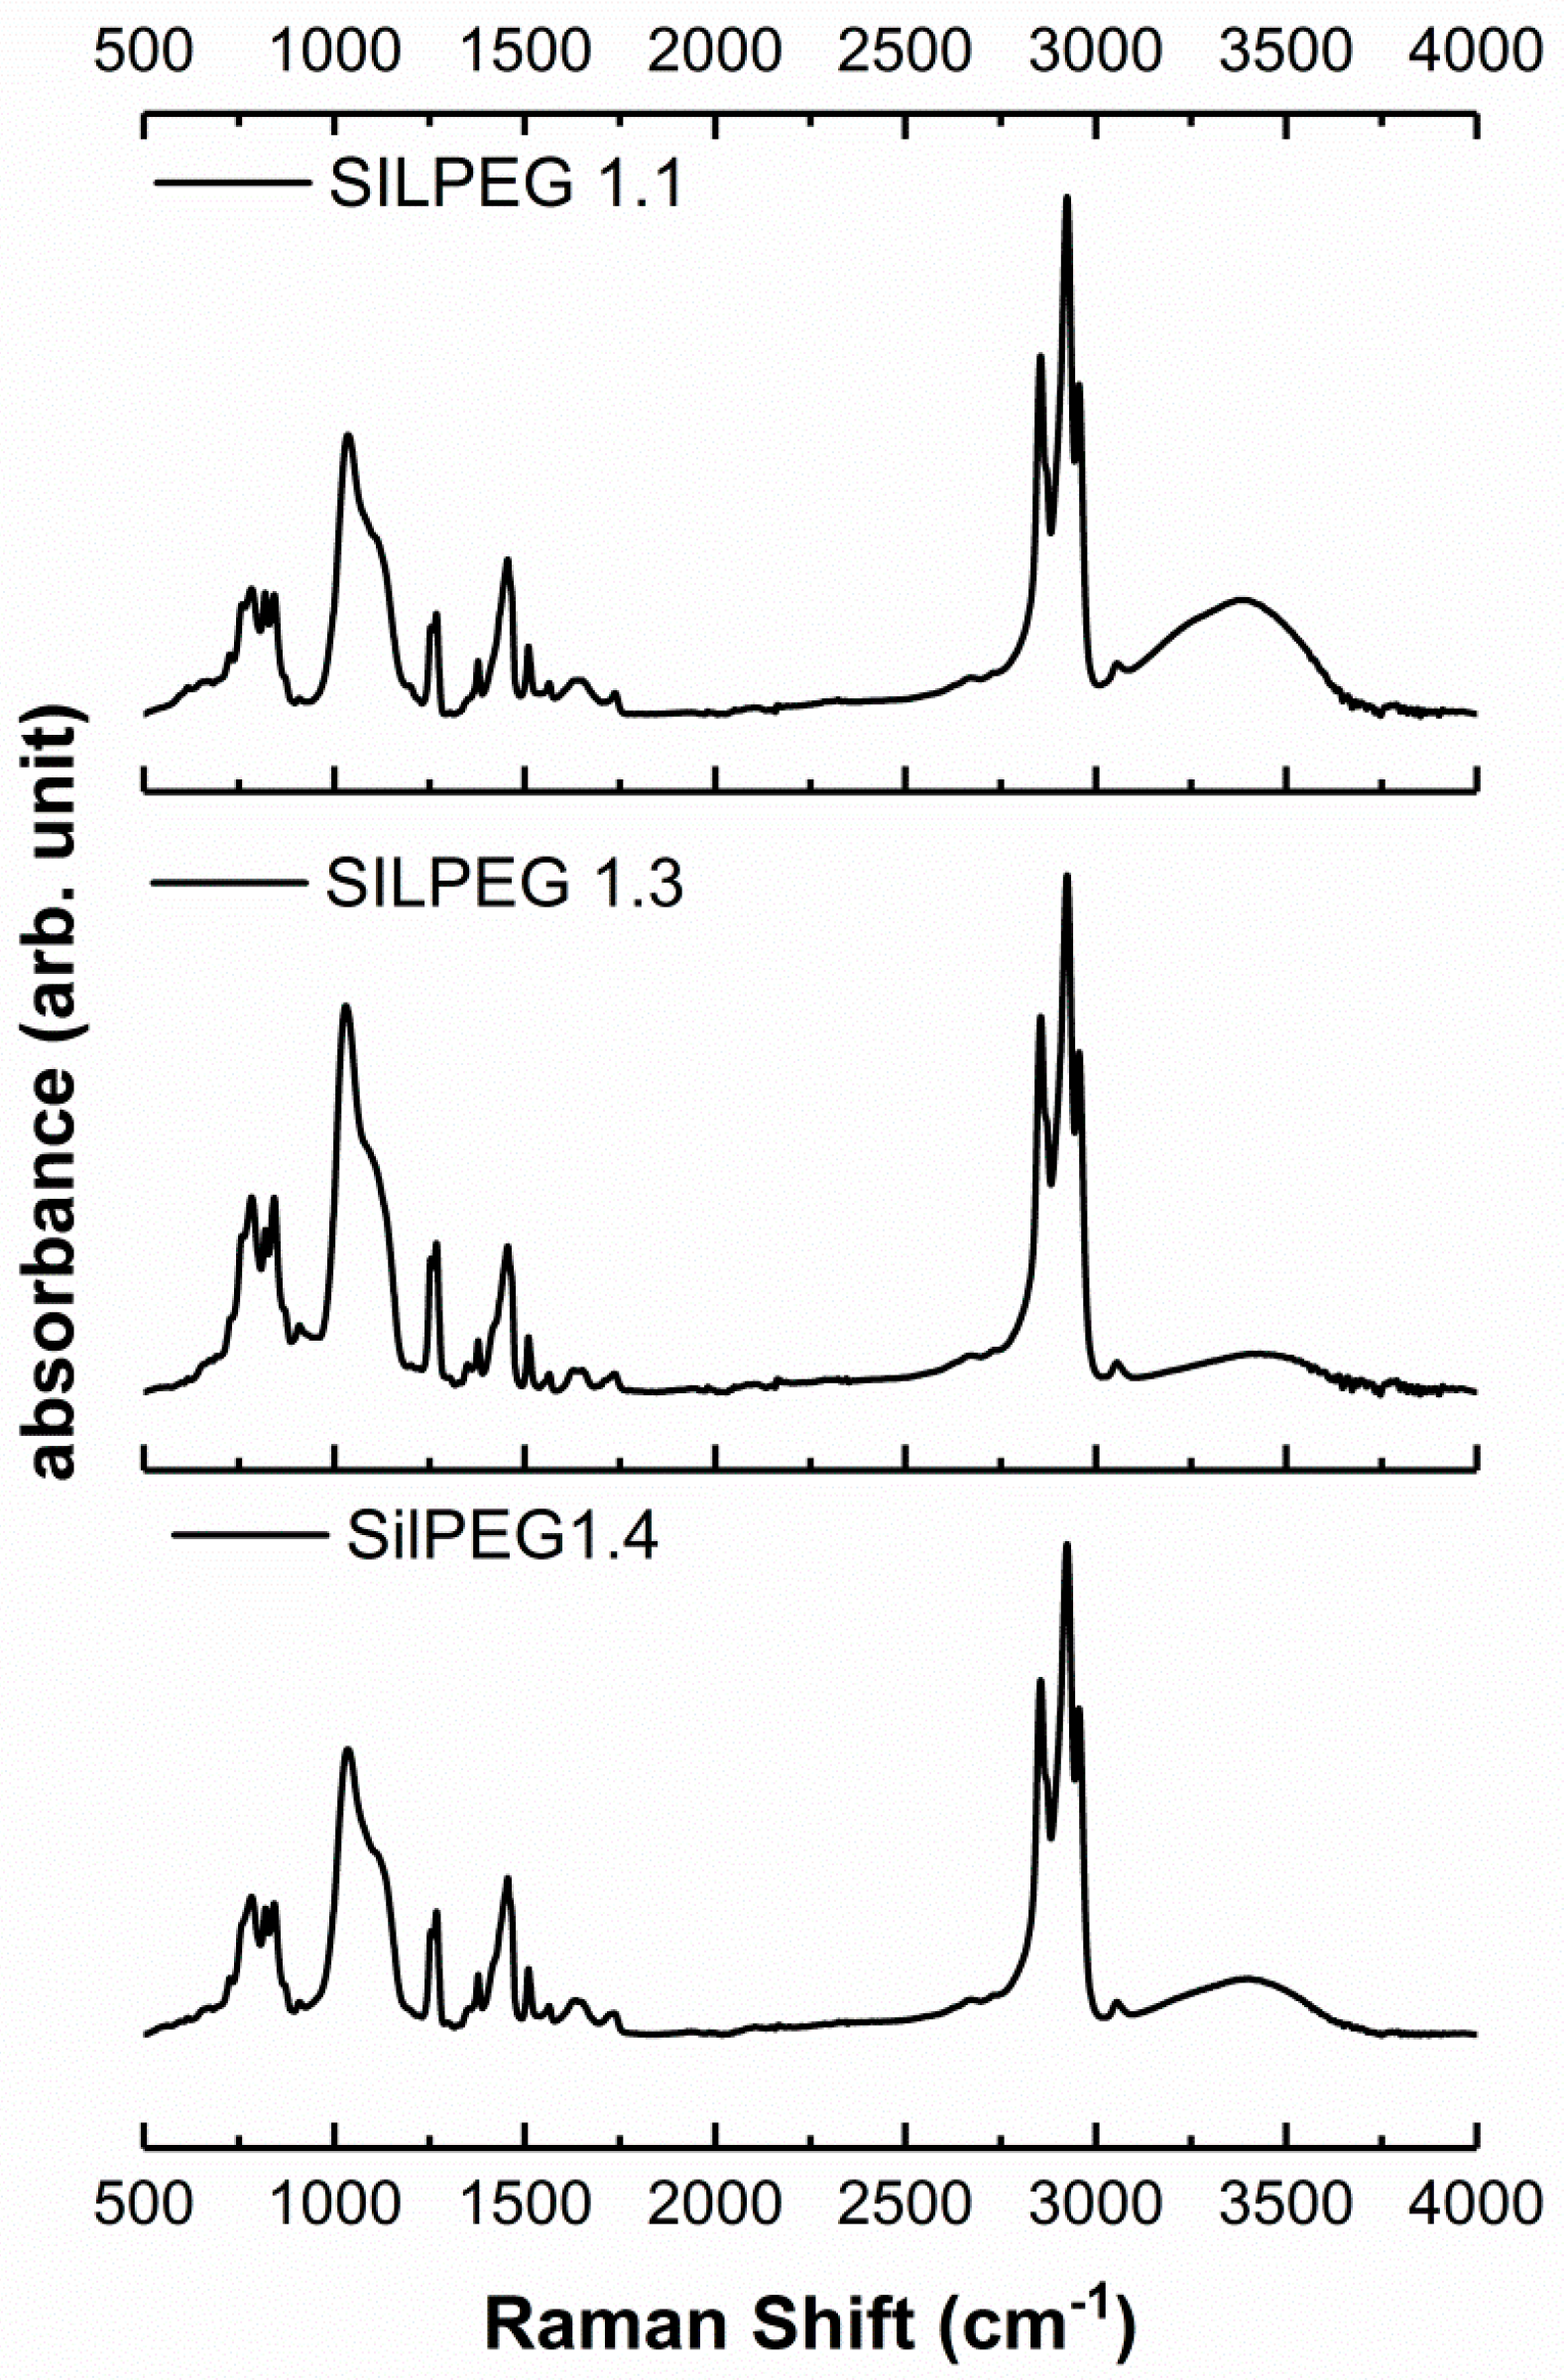
3.1. Material Identification
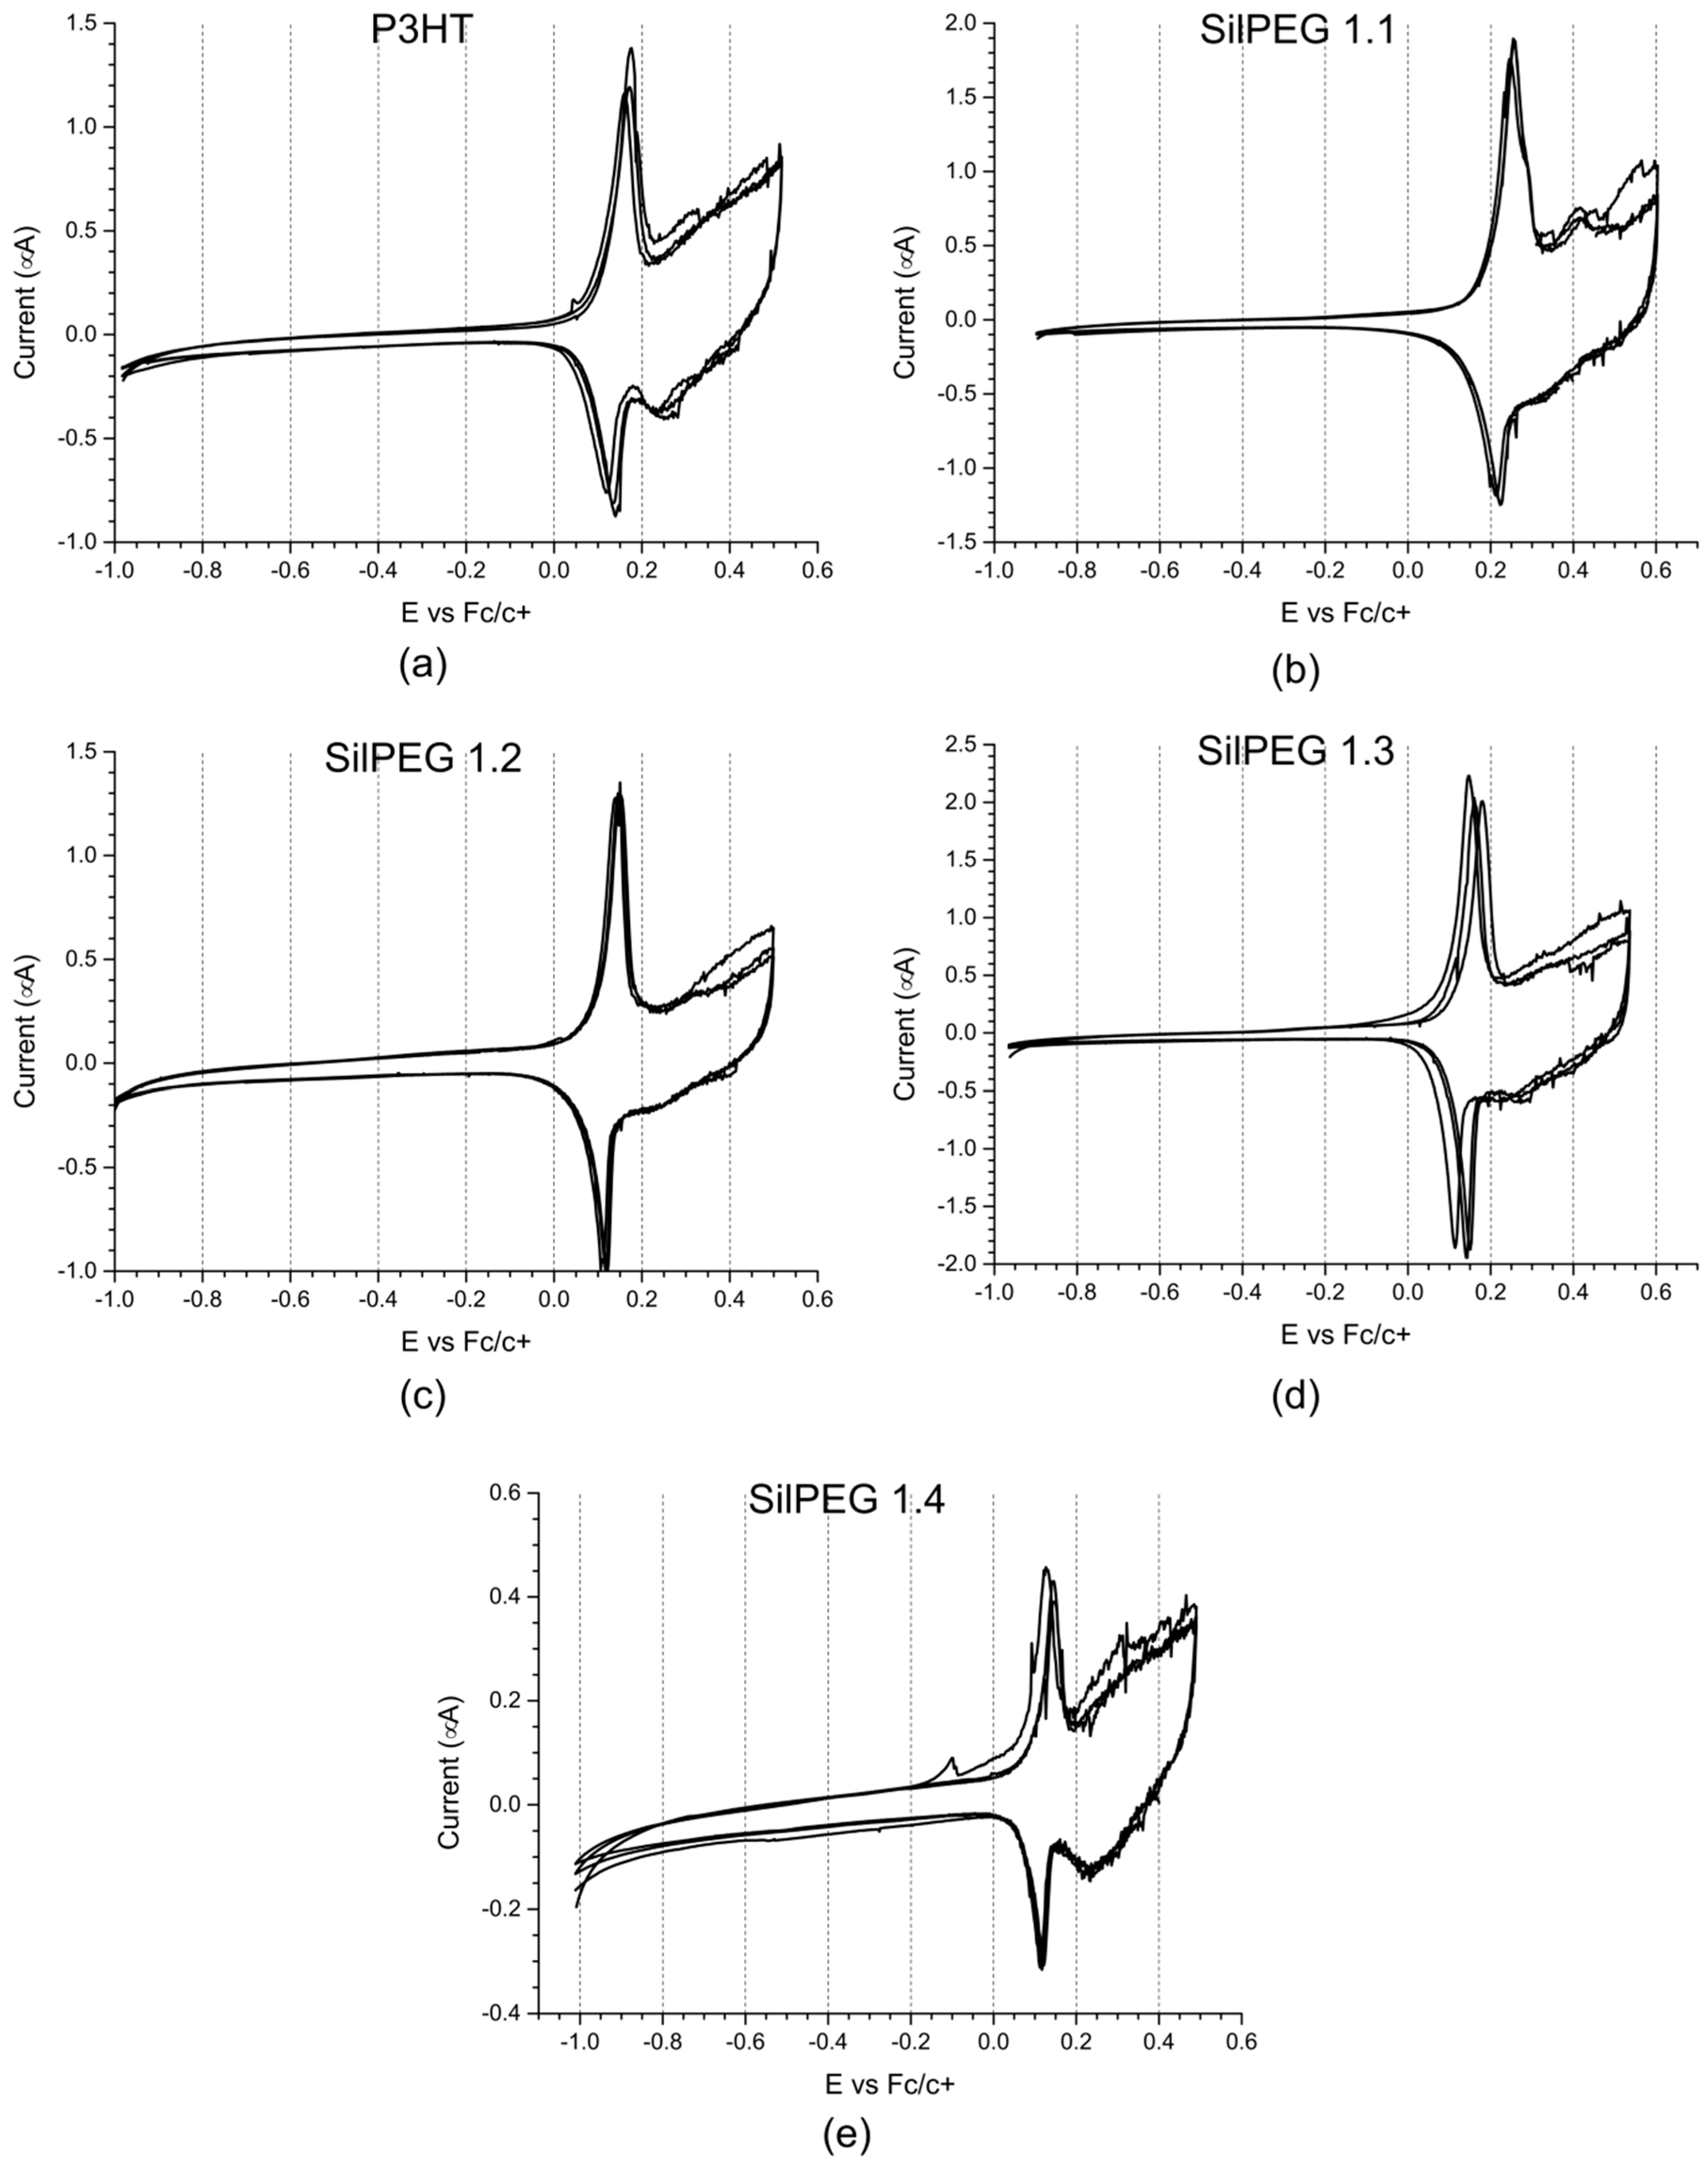
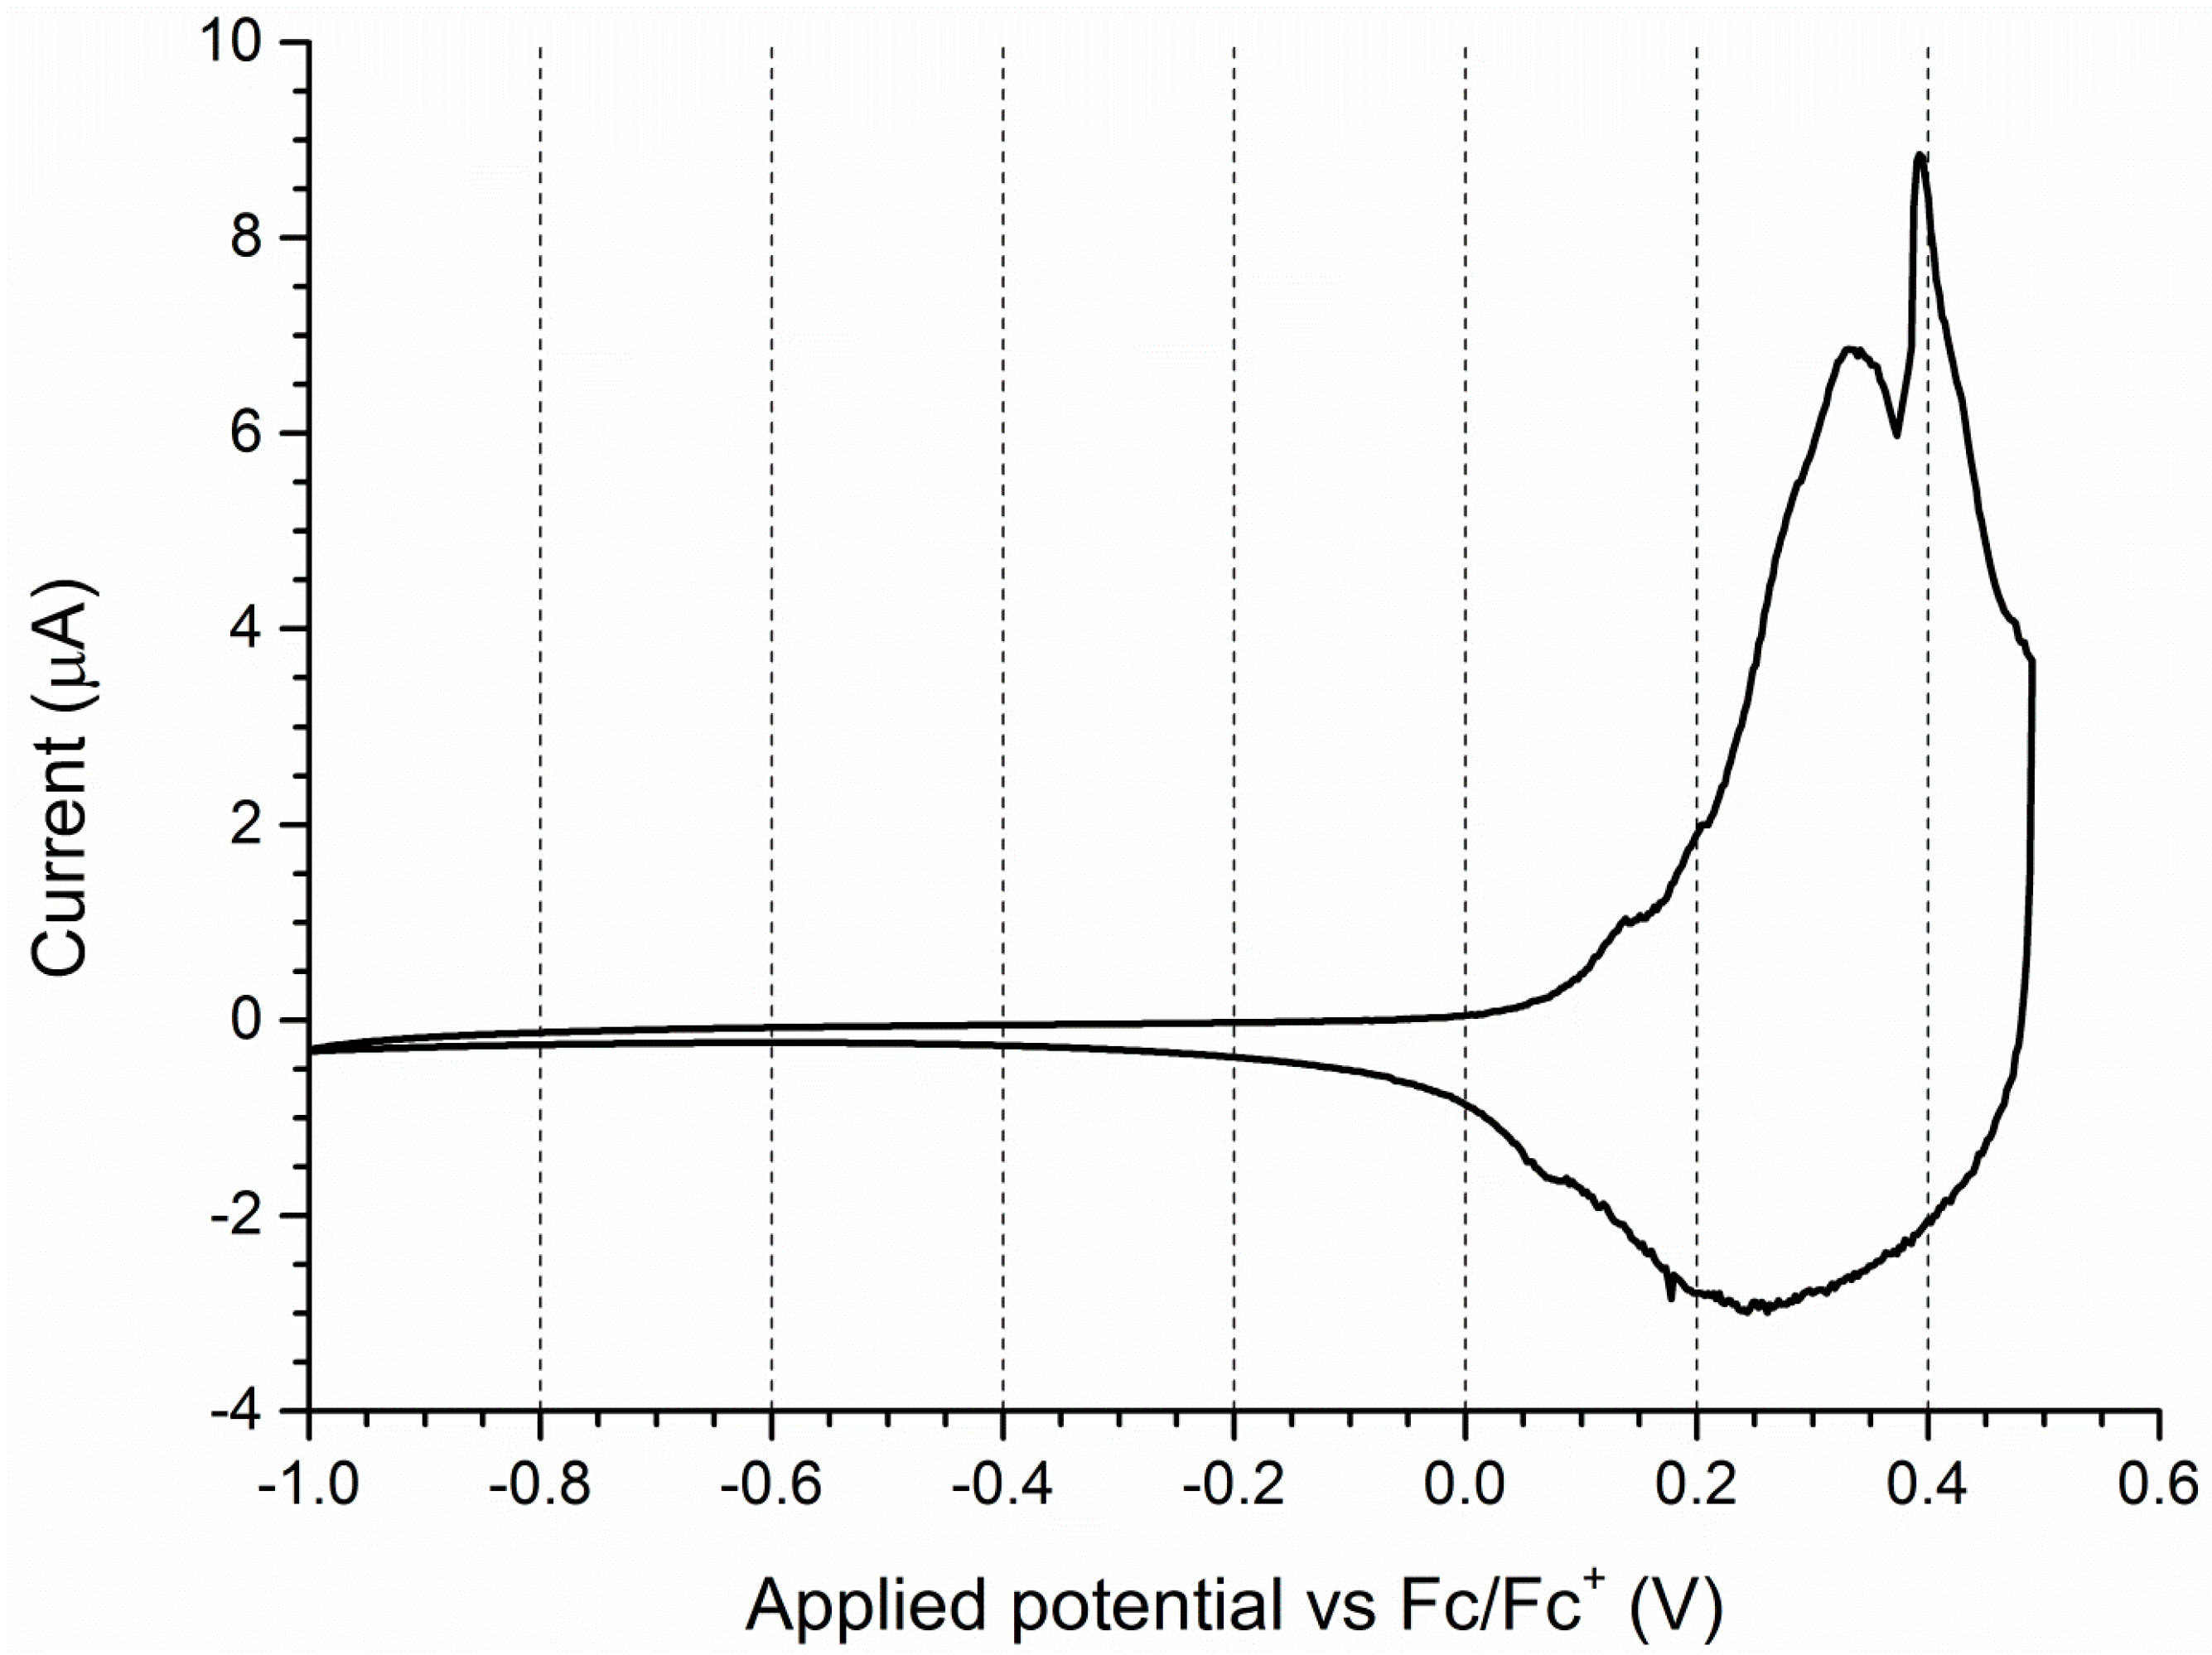
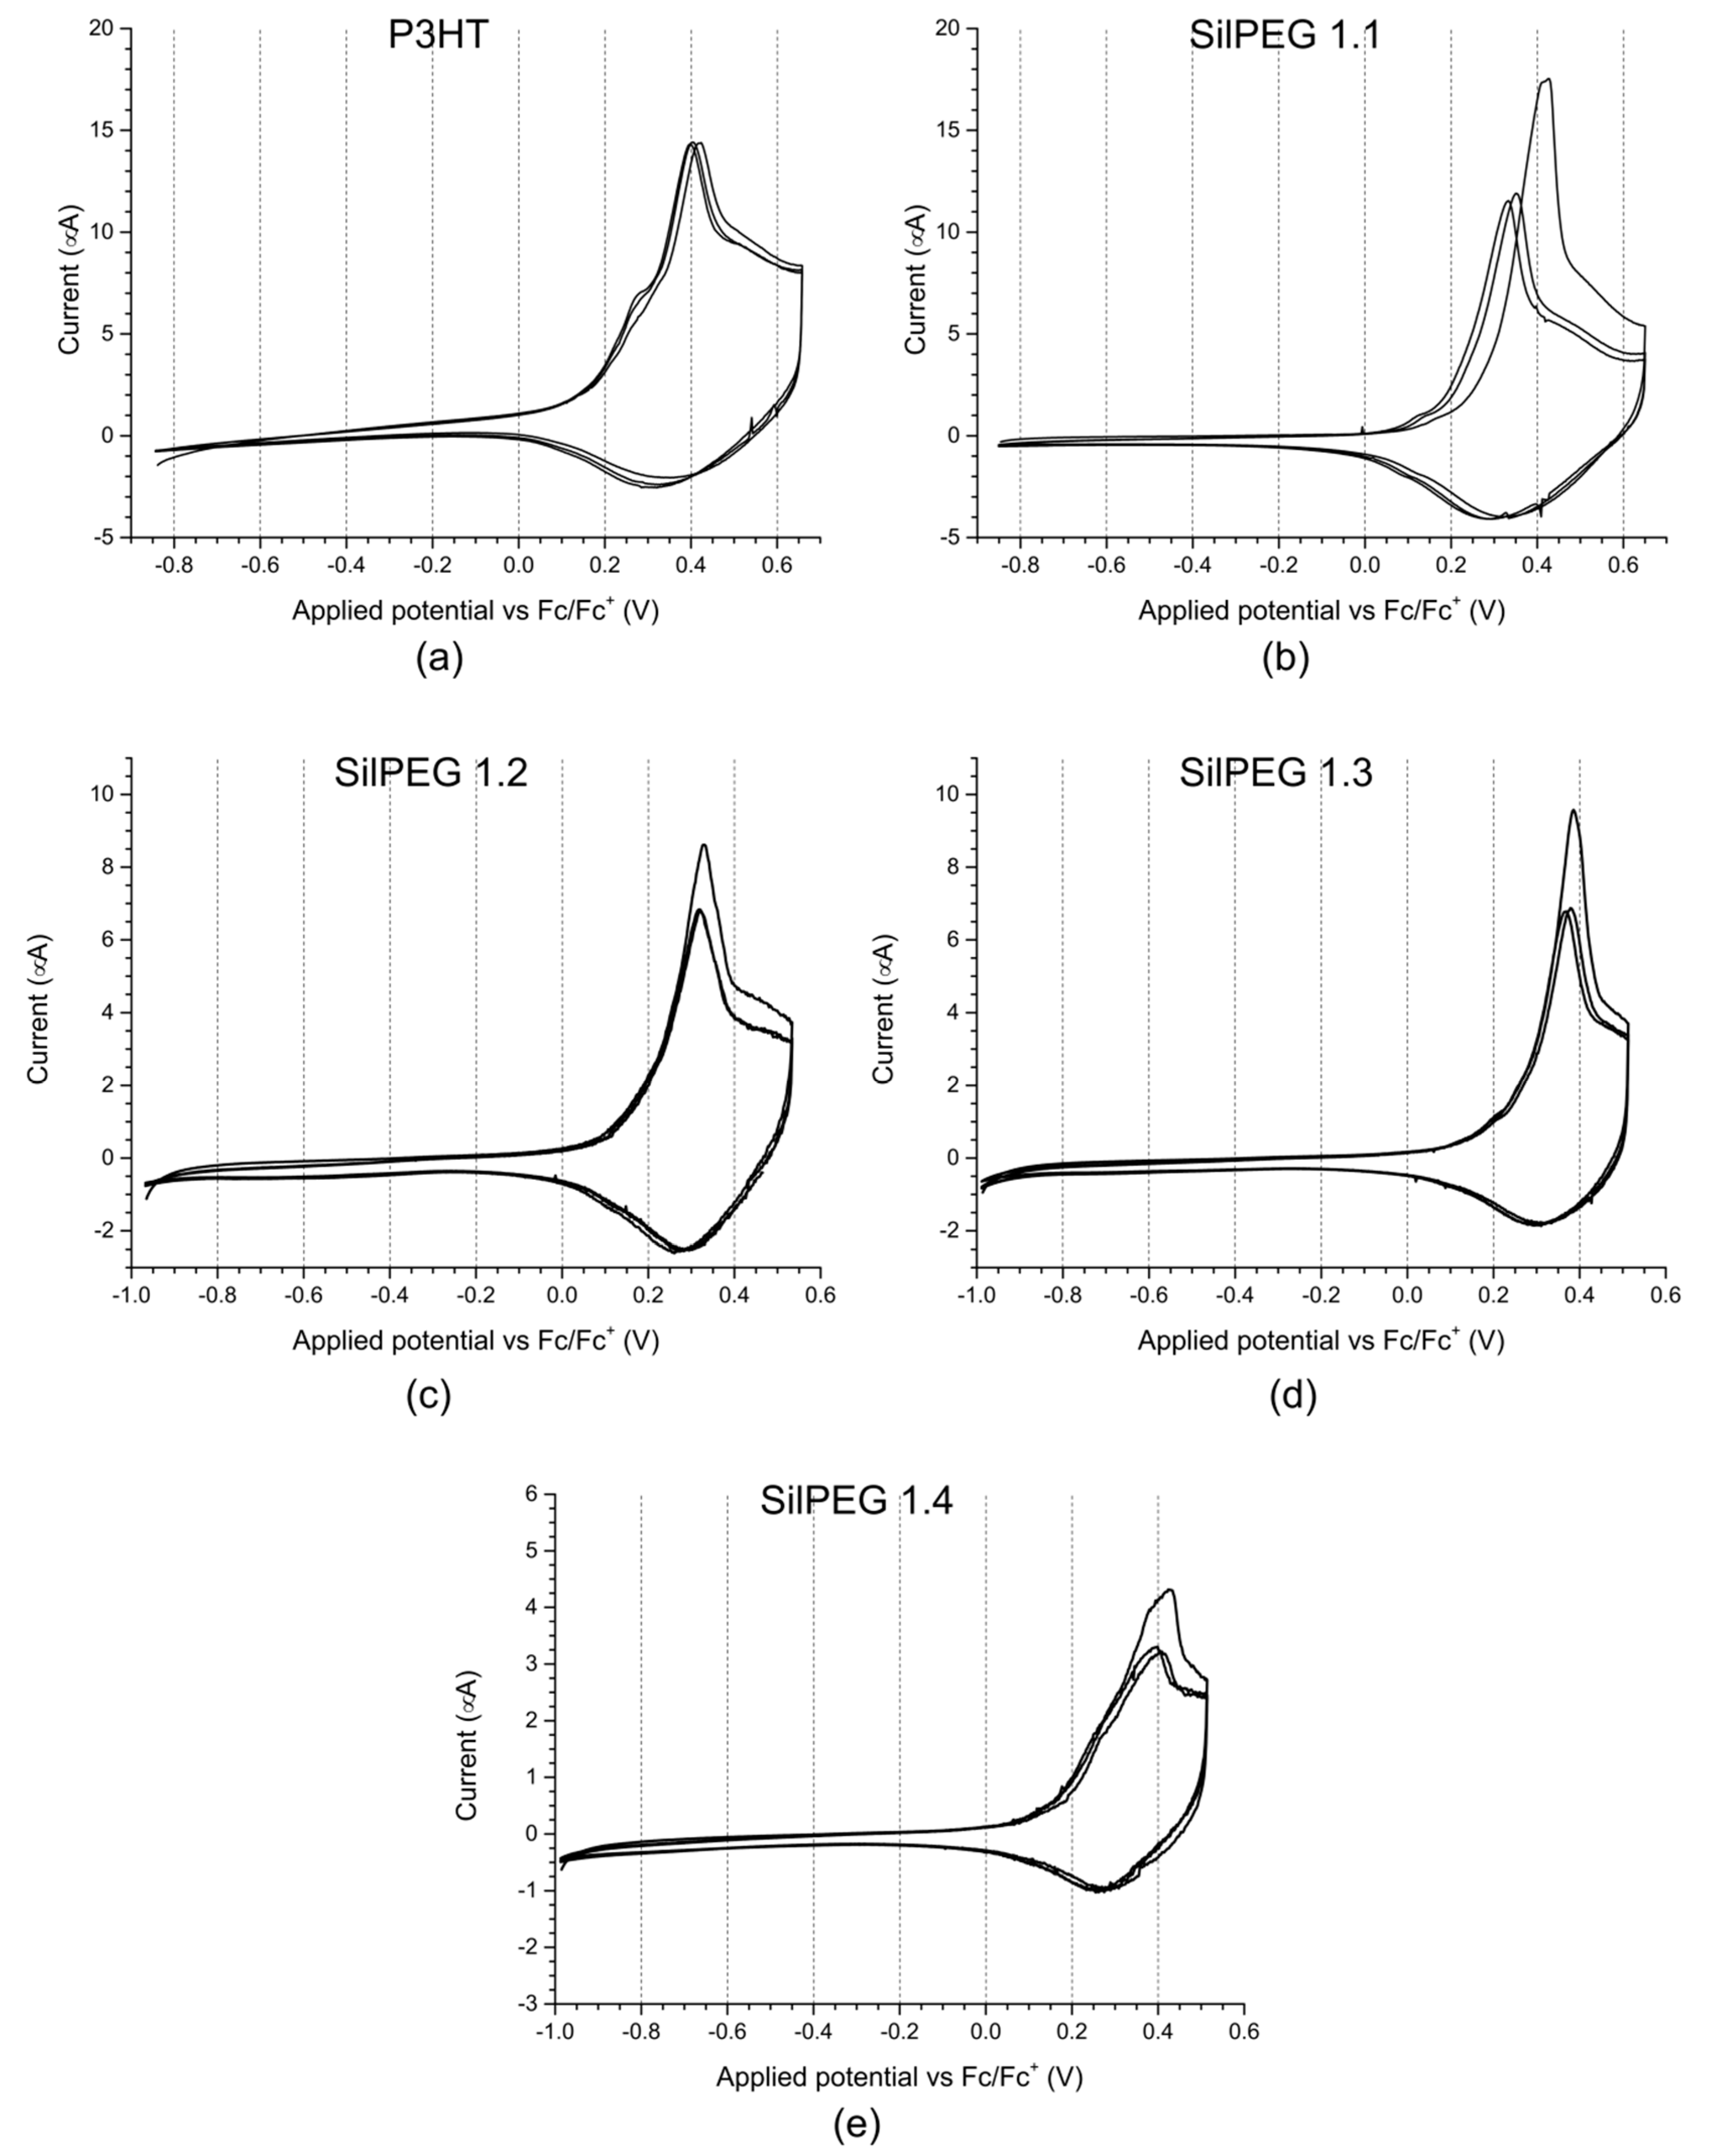
3.2. Cyclic Voltammetry
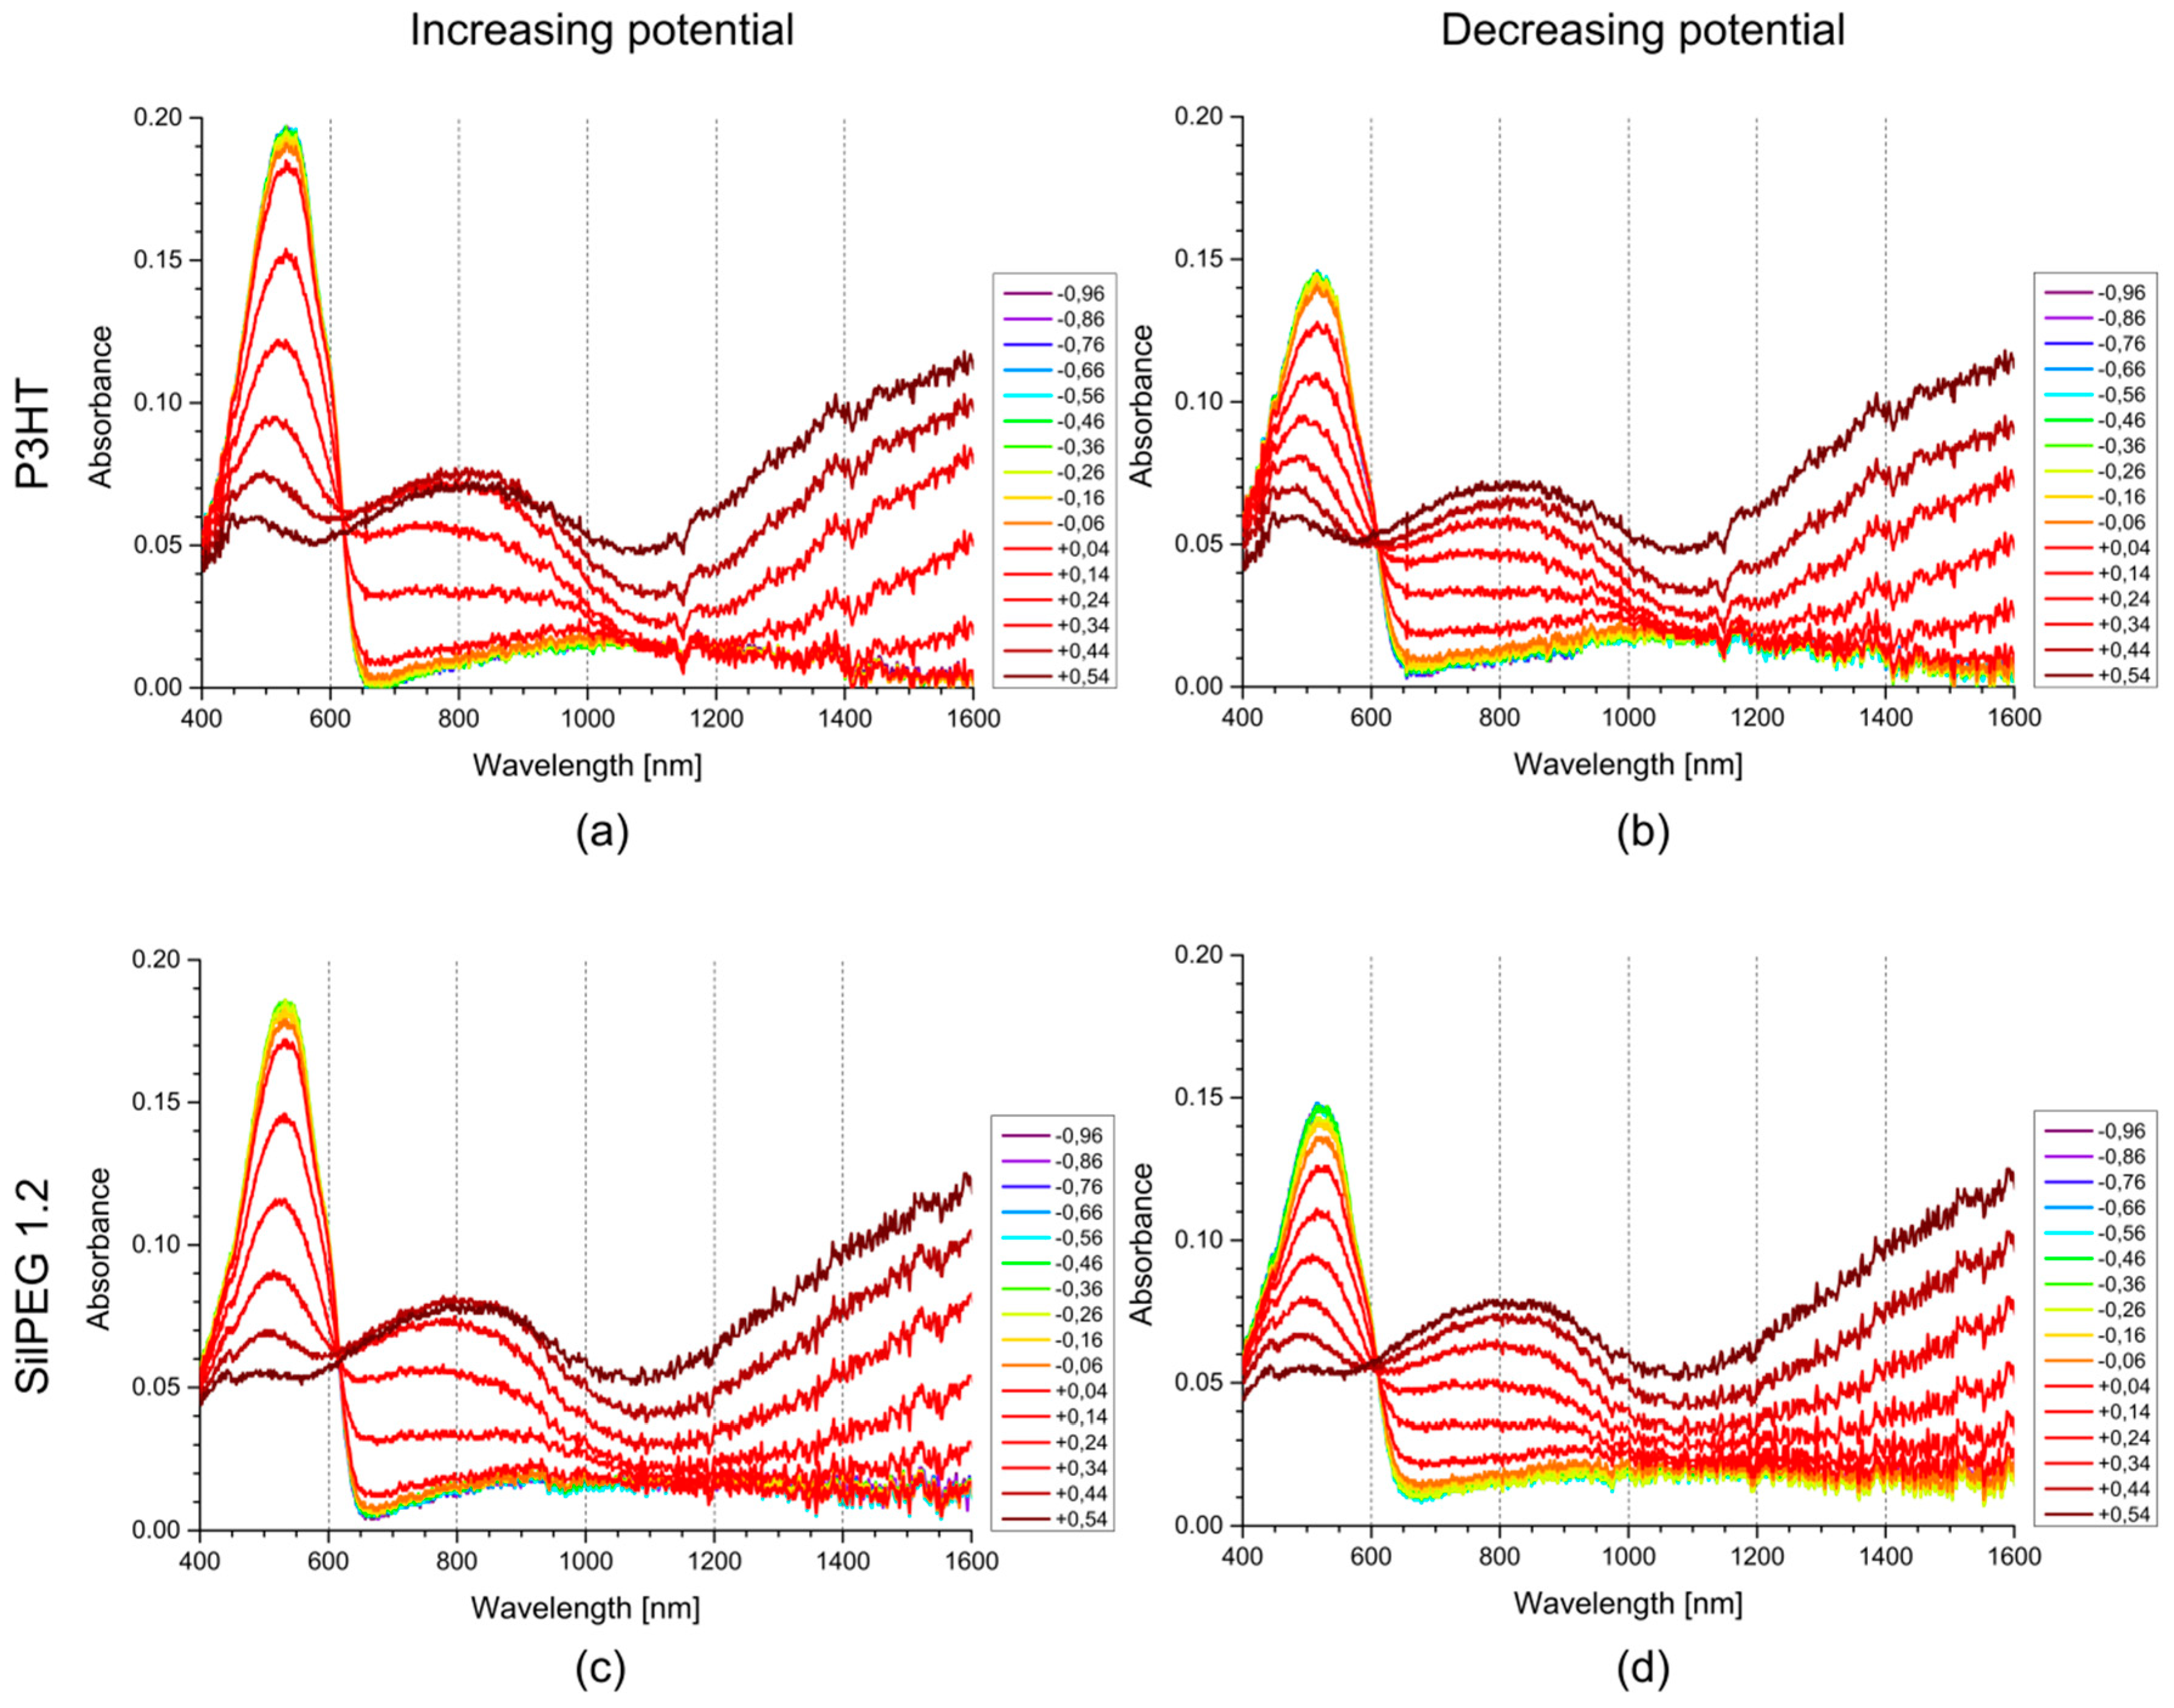
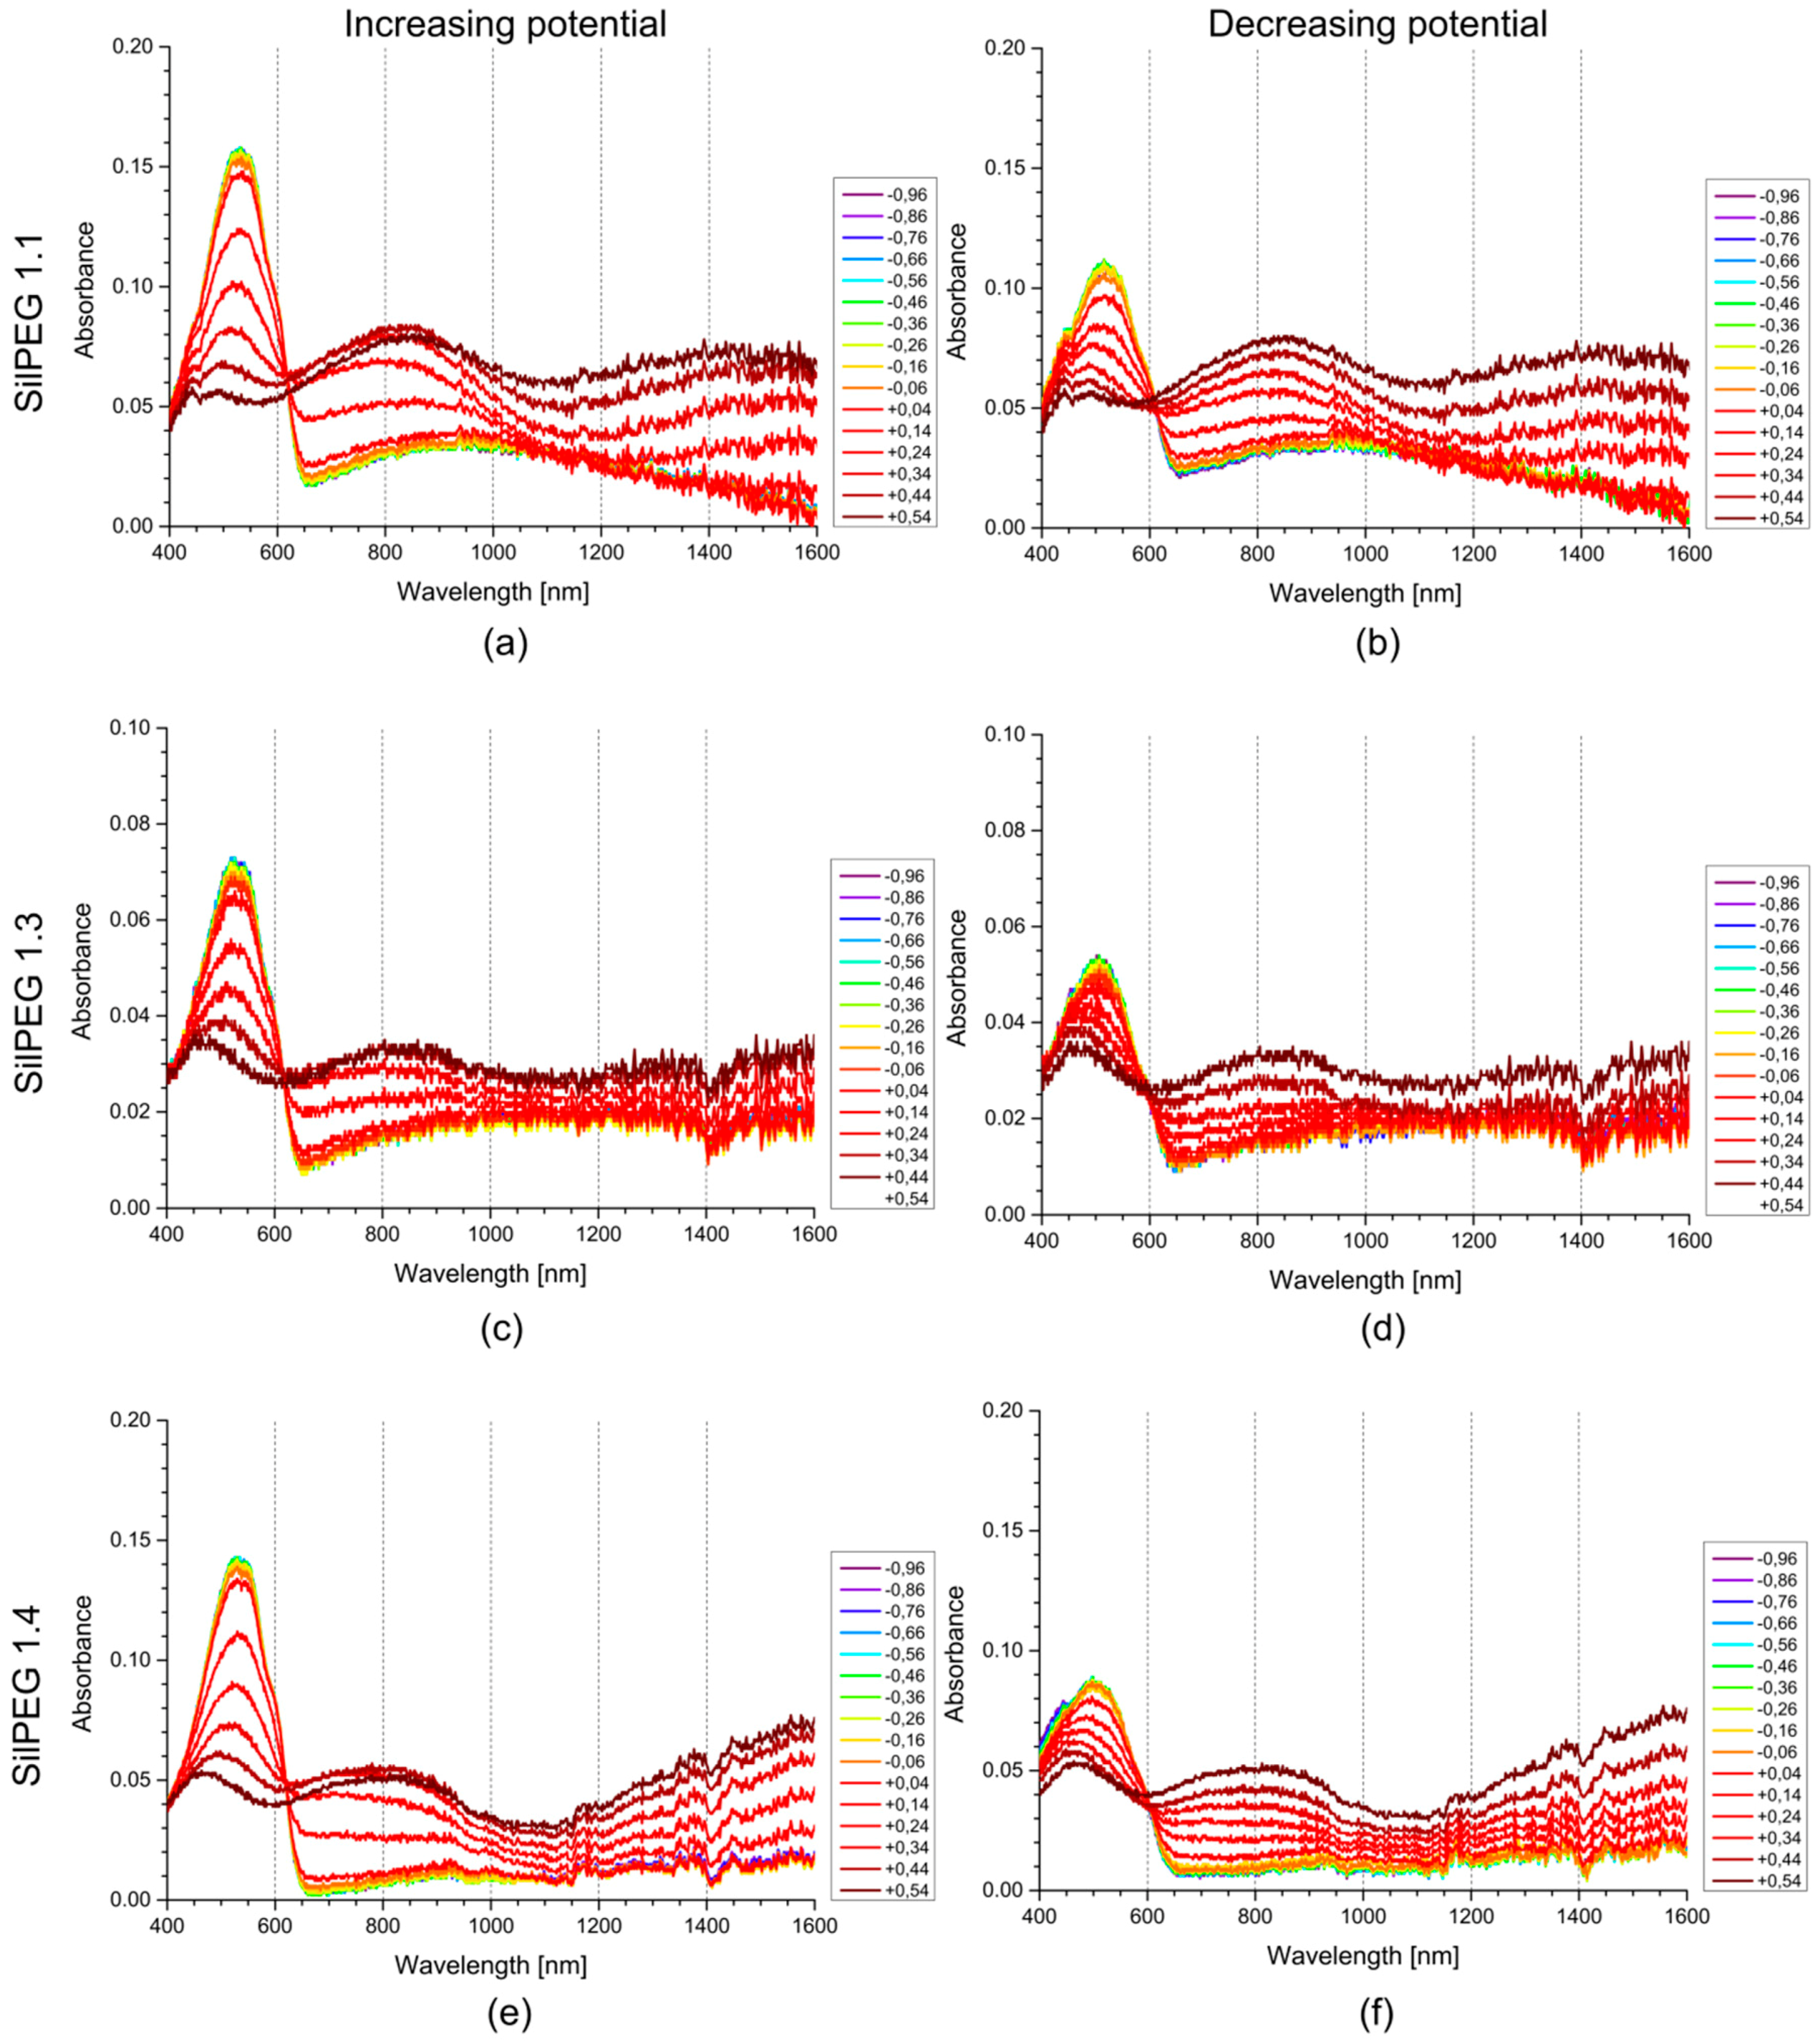
3.3. UV-Vis-NIR Spectroelectrochemistry
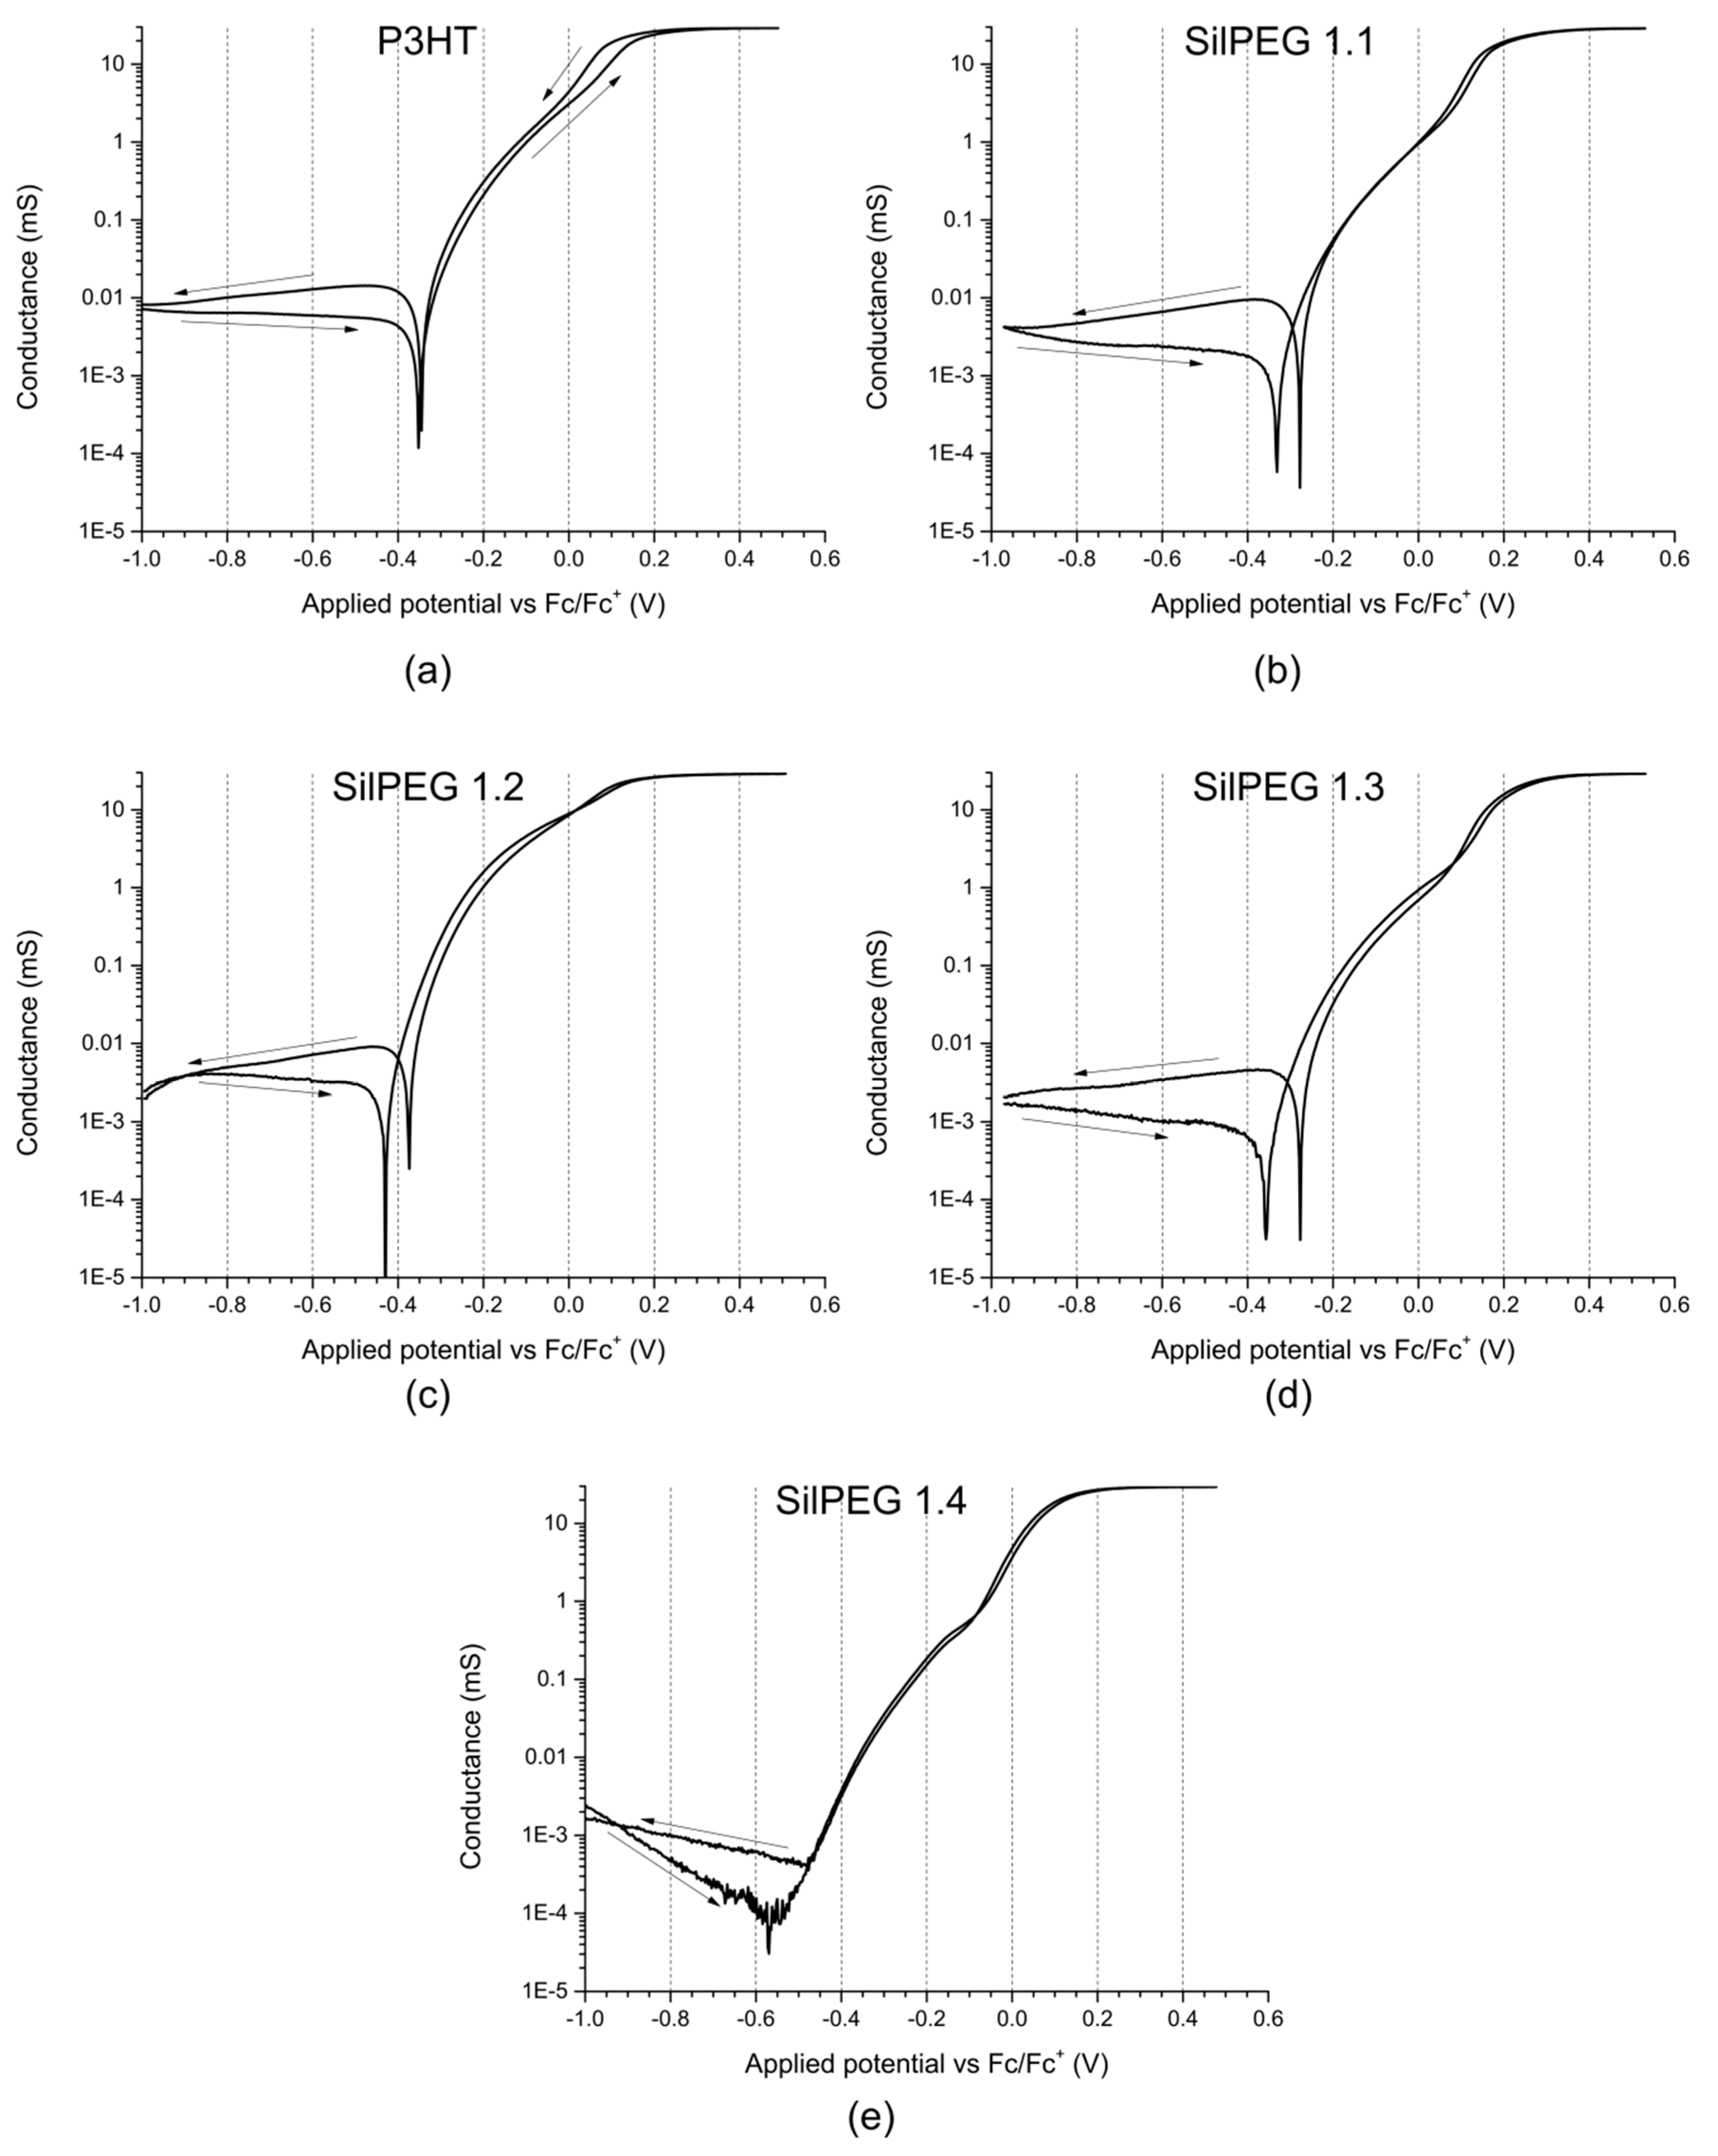
3.4. Conductance of Polymer Films
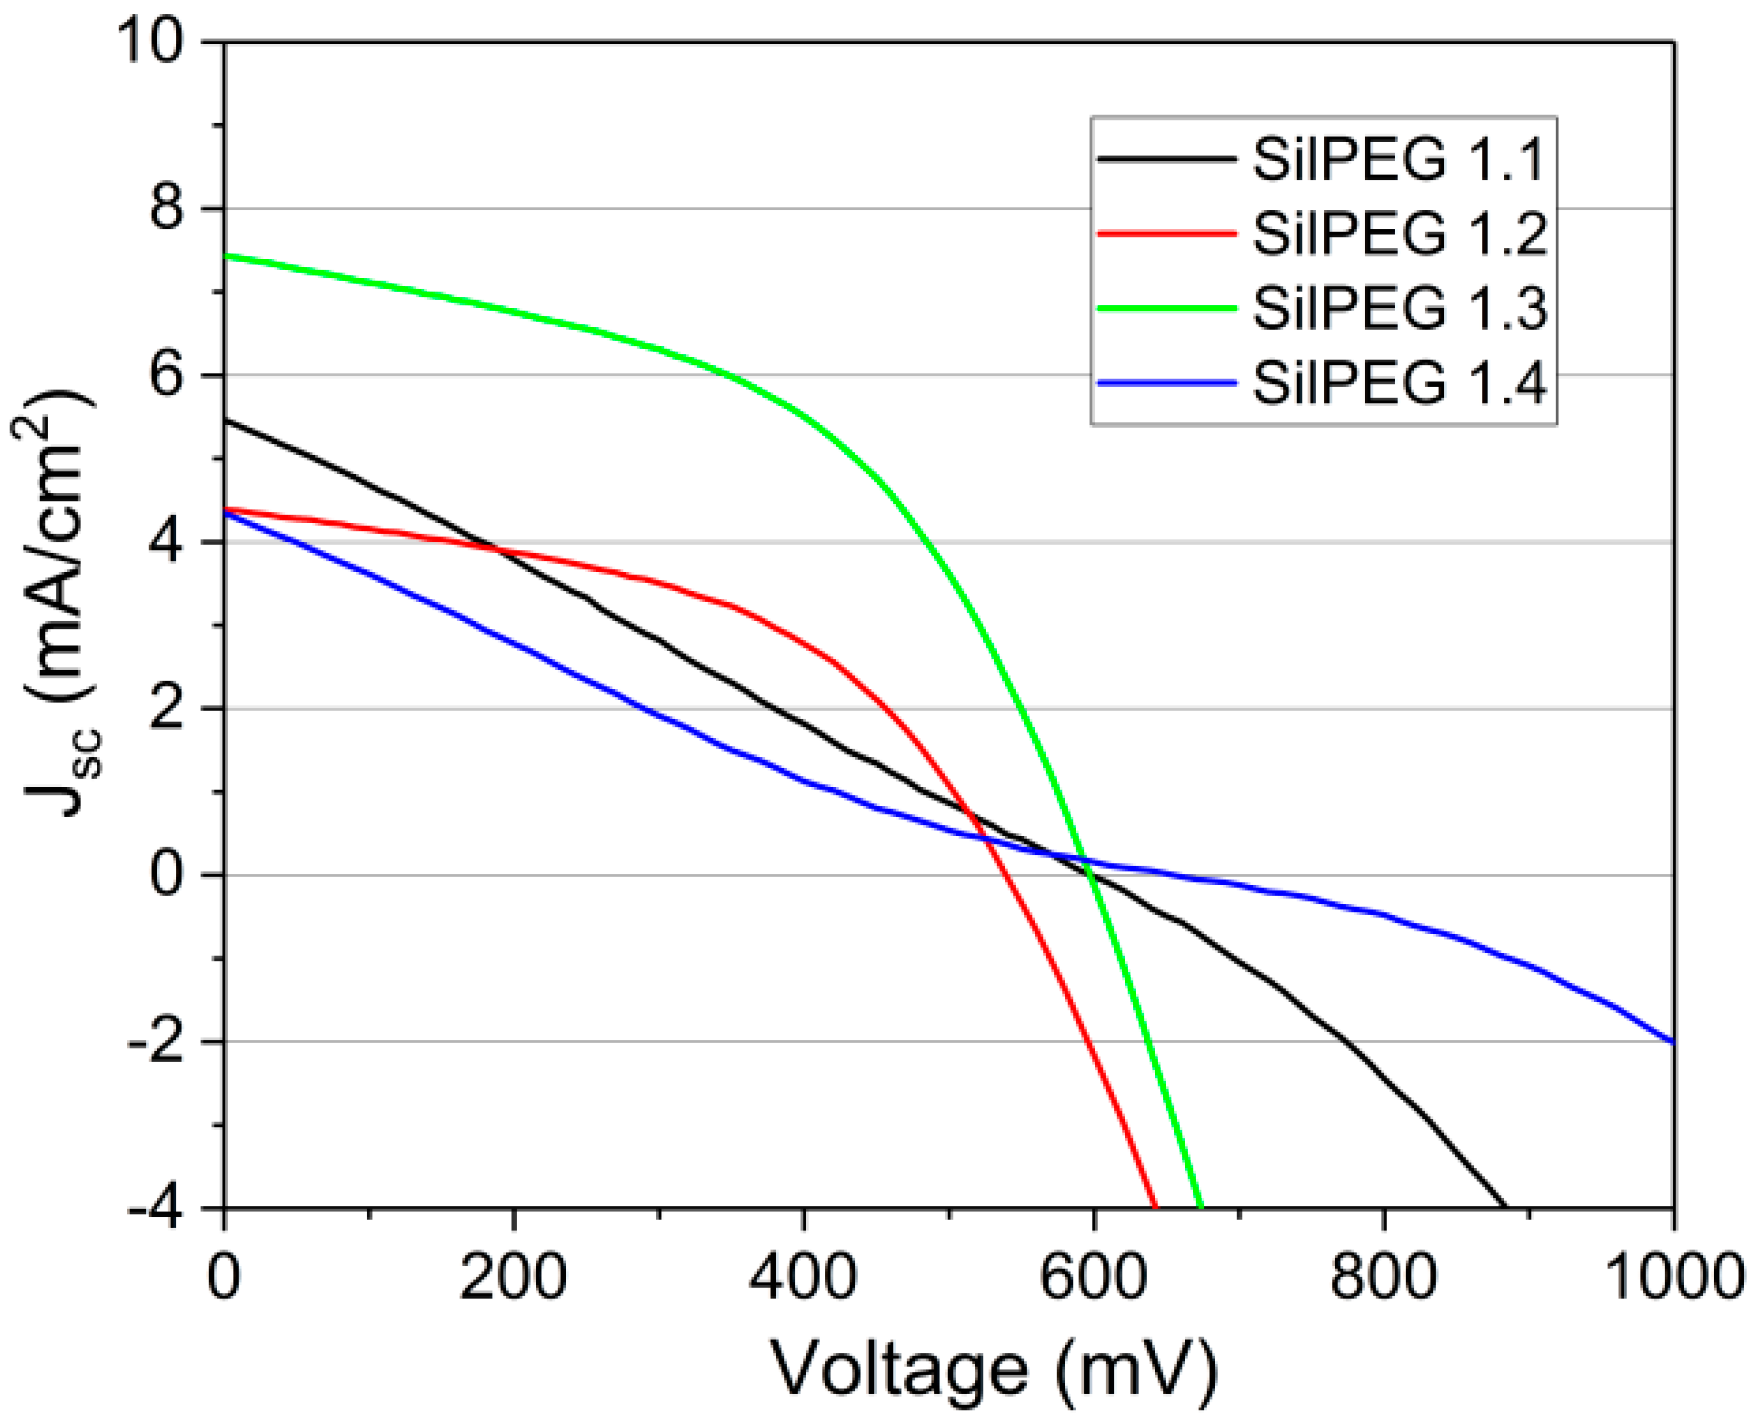
3.5. Solar Cells Fabrication and Characteristics
4. Conclusions
5. Patents
Author Contributions
Funding
Acknowledgments
Conflicts of Interest
Appendix A


| Copolymer | n P3HT per PMS Molecule | n PEG per PMS Molecule | Grafting Density [%] | P3HT Grafting Density by Feed [%] | |
|---|---|---|---|---|---|
| P3HT | PEG | ||||
| SilPEG 1.1 | 0.53 | 0.32 | 13.3 | 8.0 | 3.2 |
| SilPEG 1.2 | 0.34 | 0.54 | 8.5 | 13.5 | 3.2 |
| SilPEG 1.3 | 0.26 | 0.18 | 6.5 | 4.5 | 3.2 |
| SilPEG 1.4 | 0.49 | 0.25 | 12.3 | 6.3 | 3.2 |


References
- Roncali, J. Conjugated poly(thiophenes): Synthesis, functionalization, and applications. Chem. Rev. 1992, 92, 711–738. [Google Scholar] [CrossRef]
- Chirvase, D.; Chiguvare, Z.; Knipper, M.; Parisi, J.; Dyakonov, V.; Hummelen, J.C. Temperature dependent characteristics of poly(3 hexylthiophene)-fullerene based heterojunction organic solar cells. J. Appl. Phys. 2003, 93, 3376–3383. [Google Scholar] [CrossRef] [Green Version]
- Zhang, J.; Kan, B.; Pearson, A.; Parnell, A.; Cooper, J.; Liu, X.-K.; Conaghan, P.; Hopper, T.R.; Wu, Y.; Wan, X.; et al. Efficient Non-fullerene Organic Solar Cells Employing Sequentially Deposited Donor-Acceptor Layers. J. Mater. Chem. A 2018, 3, 7939–7944. [Google Scholar] [CrossRef]
- Etxebarria, I.; Ajuria, J.; Pacios, R. Solution-processable polymeric solar cells: A review on materials, strategies and cell architectures to overcome 10%. Org. Electron. Phys. Mater. Appl. 2015, 19, 34–60. [Google Scholar] [CrossRef]
- Jørgensen, M.; Norrman, K.; Gevorgyan, S.A.; Tromholt, T.; Andreasen, B.; Krebs, F.C. Stability of polymer solar cells. Adv. Mater. 2012, 24, 580–612. [Google Scholar] [CrossRef]
- Wu, M.-C.; Liao, H.-C.; Lo, H.-H.; Chen, S.; Lin, Y.-Y.; Yen, W.-C.; Zeng, T.-W.; Chen, C.-W.; Chen, Y.-F.; Su, W.-F. Nanostructured polymer blends (P3HT/PMMA): Inorganic titania hybrid photovoltaic devices. Sol. Energy Mater. Sol. Cells 2009, 93, 961–965. [Google Scholar] [CrossRef]
- Street, R.A.; Northrup, J.E.; Krusor, B.S. Radiation induced recombination centers in organic solar cells. Phys. Rev. B 2012, 85, 205211. [Google Scholar] [CrossRef]
- Street, R.A.; Davies, D.M. Kinetics of light induced defect creation in organic solar cells. Appl. Phys. Lett. 2013, 102, 043305. [Google Scholar] [CrossRef]
- Manceau, M.; Chambon, S.; Rivaton, A.; Gardette, J.L.; Guillerez, S.; Lematre, N. Effects of long-term UVvisible light irradiation in the absence of oxygen on P3HT and P3HT: PCBM blend. Sol. Energy Mater. Sol. Cells 2010, 94, 1572–1577. [Google Scholar] [CrossRef]
- Bhattacharya, J.; Peer, A.; Joshi, P.H.; Biswas, R.; Dalal, V.L. Blue photon management by inhouse grown ZnO:Al cathode for enhanced photostability in polymer solar cells. Sol. Energy Mater. Sol. Cells 2018, 179, 95–101. [Google Scholar] [CrossRef]
- Loos, J. Volume morphology of printable solar cells. Mater. Today 2010, 13, 14–20. [Google Scholar] [CrossRef]
- Serbenta, A.; Kozlov, O.V.; Portale, G.; van Loosdrecht, P.H.M.; Pshenichnikov, M.S. Bulk heterojunction morphology of polymer:fullerene blends revealed by ultrafast spectroscopy. Sci. Rep. 2016, 6, 36236. [Google Scholar] [CrossRef] [PubMed] [Green Version]
- Abbasi, F.; Mirzadeh, H.; Katbab, A.A. Modification of polysiloxane polymers for biomedical applications: A review. Polym. Int. 2001, 50, 1279–1287. [Google Scholar] [CrossRef]
- Xiao, S.; Nguyen, M.; Gong, X.; Cao, Y.; Wu, H.; Moses, D.; Heeger, A.J. Stabilization of Semiconducting Polymers with Silsesquioxane. Adv. Funct. Mater. 2003, 13, 25–29. [Google Scholar] [CrossRef]
- Ren, Z.; Yan, S. Polysiloxanes for optoelectronic applications. Prog. Mater. Sci. 2016, 83, 383–416. [Google Scholar] [CrossRef]
- Hao, L.; Wang, W.; Niu, H.; Zhou, Y. Grafting triphenylamine groups onto polysiloxanes to improve interaction between the electrochromic films and ITO. Electrochim. Acta 2017, 246, 259–268. [Google Scholar] [CrossRef]
- Marciniec, B.; Gulinski, J.; Urbaniak, W.; Kornetka, Z.W. Comprehensive Handbook on Hydrosilylation; Elsevier: Amsterdam, The Netherlands, 1992; p. 754. [Google Scholar] [CrossRef]
- McCullough, R.D.; Lowe, R.D.; Jayaraman, M.; Anderson, D.L. Design, synthesis, and control of conducting polymer architectures: Structurally homogeneous poly(3-alkylthiophenes). J. Org. Chem. 1993, 58, 904–912. [Google Scholar] [CrossRef]
- Loewe, R.S.; Khersonsky, S.M.; McCullough, R.D. A Simple Method to Prepare Head-to-Tail Coupled, Regioregular Poly(3-alkylthiophenes) Using Grignard Metathesis. Adv. Mater. 1999, 11, 250–253. [Google Scholar] [CrossRef]
- Jeffries-el, B.M.; Sauvø, G.; Mccullough, R.D. In-Situ End-Group Functionalization of Regioregular Poly (3-alkylthiophene ) Using the Grignard Metathesis Polymerization Method. Adv. Mater. 2004, 16, 1017–1019. [Google Scholar] [CrossRef]
- Stolarczyk, A.; Turczyn, R.; Januszkiewicz-Kaleniak, A.; Kepska, K. Comb Macromolecule Polymethylsiloxane-Graft-Polymer Conjugated-Graft-Polyether and Method for Producing It. Patent PL229564, 2014. [Google Scholar]
- Ganicz, T.; Makowski, T.; Stanczyk, W.A.; Tracz, A. Side chain polysiloxanes with phthalocyanine moieties. Express Polym. Lett. 2012, 6. [Google Scholar] [CrossRef] [Green Version]
- Mårdalen, J.; Samuelsen, E.J.; Gautun, O.R.; Carlsen, P.H.J. Structure and electronic properties of polythiophene and poly(3-alkylthiophene) films electropolymerized on indium tin oxide (ITO) glass at elevated potentials. Die Makromol. Chem. 1993, 194, 2483–2495. [Google Scholar] [CrossRef]
- Trznadel, M.; Pron, A.; Zagorska, M.; Chrzaszcz, R.; Pielichowski, J. Effect of Molecular Weight on Spectroscopic and Spectroelectrochemical Properties of Regioregular Poly(3-hexylthiophene). Macromolecules 1998, 31, 5051–5058. [Google Scholar] [CrossRef] [PubMed]
- Trznadel, M.; Pron, A.; Zagorska, M. Preparation and properties of fractionated regioregular poly(3-alkylthiophenes). Synth. Met. 1999, 101, 118–119. [Google Scholar] [CrossRef]
- Mellah, M.; Labbé, E.; Nédélec, J.-Y.; Périchon, J. Electroreductive polymerisation of 3-substituted 2,5-dihalothiophenes: Direct electrosynthesis vs. stepwise procedure involving thienylzinc intermediates. New J. Chem. 2002, 26, 207–212. [Google Scholar] [CrossRef]
- Nayak, P.K.; Rosenberg, R.; Barnea-Nehoshtan, L.; Cahen, D. O2 and organic semiconductors: Electronic effects. Org. Electron. Phys. Mater. Appl. 2013, 14, 966–972. [Google Scholar] [CrossRef]
- Holmes, N.P.; Ulum, S.; Sista, P.; Burke, K.B.; Wilson, M.G.; Stefan, M.C.; Zhou, X.; Dastoor, P.C.; Belcher, W.J. The effect of polymer molecular weight on P3HT:PCBM nanoparticulate organic photovoltaic device performance. Sol. Energy Mater. Sol. Cells 2014, 128, 369–377. [Google Scholar] [CrossRef]
- Liu, F.; Chen, D.; Wang, C.; Luo, K.; Gu, W.; Briseno, A.L.; Hsu, J.W.P.; Russell, T.P. Molecular Weight Dependence of the Morphology in P3HT:PCBM Solar Cells. ACS Appl. Mater. Interfaces 2014, 6, 19876–19887. [Google Scholar] [CrossRef] [PubMed]
- Seibers, Z.D.; Le, T.P.; Lee, Y.; Gomez, E.D.; Kilbey, S.M. Impact of Low Molecular Weight Poly(3-hexylthiophene)s as Additives in Organic Photovoltaic Devices. ACS Appl. Mater. Interfaces 2018, 10, 2752–2761. [Google Scholar] [CrossRef] [PubMed]
- Nicolet, C.; Deribew, D.; Renaud, C.; Fleury, G.; Brochon, C.; Cloutet, E.; Vignau, L.; Wantz, G.; Cramail, H.; Geoghegan, M.; et al. Optimization of the bulk heterojunction composition for enhanced photovoltaic properties: Correlation between the molecular weight of the semiconducting polymer and device performance. J. Phys. Chem. B 2011, 115, 12717–12727. [Google Scholar] [CrossRef]
- Schilinsky, P.; Asawapirom, U.; Scherf, U.; Biele, M.; Brabec, C.J. Influence of the molecular weight of poly(3-hexylthiophene) on the performance of bulk heterojunction solar cells. Chem. Mater. 2005, 17, 2175–2180. [Google Scholar] [CrossRef]
- Rubio Arias, J.J.; Vieira Marques, M.D.F. Performance of poly(3-hexylthiophene) in bulk heterojunction solar cells: Influence of polymer size and size distribution. React. Funct. Polym. 2017, 113, 58–69. [Google Scholar] [CrossRef]


| Copolymer | Composition | PEG co-grafts | Mn and ÐM by SEC |
|---|---|---|---|
| SilPEG 1.1 | P3HTvin, poly(methylhydrosiloxane) Mn ~ 390 g/mol, poly(ethylene glycol) methyl ether methacrylate/poly(ethylene glycol) methacrylate | Mn ~ 300 g/mol Methyl-terminated | Mn = 15,000 g/mol ÐM = 1.68 |
| SilPEG 1.2 | Mn ~ 500 g/mol Methyl-terminated | Mn = 19,000 g/mol ÐM = 1.75 | |
| SilPEG 1.3 | Mn ~ 950 g/mol Methyl-terminated | Mn = 17,000 g/mol ÐM = 1.49 | |
| SilPEG 1.4 | Mn ~ 500 g/mol Hydroxyl-terminated | Mn = 16,000 g/mol ÐM = 1.65 |
| Polymer | Assignment |
|---|---|
| P3HTvin | 3057 (ν CAr–H w), 2965 (νasym C–H s), 2928 (νasym C–H s), 2855 (νsym C–H s), 1620 (ν C=C w), 1563 (ν CAr=CAr w), 1511 (νsymCAr=CArm), 1456 (δasym C–H[–CH3]m), 1374 (δsym C–H[–CH3, –CH2–]m), 1217 (νCAr=CAr w), 1155 (δ C–H[–CH=CH2] w), 819 (δCAr–H m), 724 (δ=C–H; δ –(CH2)n>3 w), 668 (δ=C–H w) |
| SilPEG 1.2 | 3057 (ν CAr−H w), 2965 (νasym C–H s), 2928 (νasym C–H s), 2855 (νsymC–H s), 15,656 (ν CAr=CAr w), 1513 (νsymCAr=CAr w), 1451 (δasym C–H m), 1253 (δsym Si(CH3)n=1,3,4 m), 1028 (ν C=O s), 818 (δ CAr–H m), 724 (δ = C–H; δ –(CH2)n>3 m) |
| Sample | Oxidation Potentials [V] | Reduction Potentials [V] |
|---|---|---|
| P3HT | +0.18 | +0.23; +0.14 |
| SilPEG 1.1 | +0.25; +0.41 | +0.21 |
| SilPEG 1.2 | +0.15 | +0.12 |
| SilPEG 1.3 | +0.15 | +0.11 |
| SilPEG 1.4 | +0.38; +0.43 | +0.27 |
| Sample | Undoped Polymer Absorbance | Band Gap c [eV] | Isosbestic Point [nm] | Oxidised Polymer Absorption Band Maxima [nm] | |||
|---|---|---|---|---|---|---|---|
| Initial a | Final b | Anodic d | Cathodic e | 1st Band | 2nd Band | ||
| P3HT | 0.17 | 0.12 | 1.93 | 617 | 608 | 817 | 1587 |
| SilPEG 1.1 | 0.20 | 0.15 | 1.92 | 619 | 606 | 819 | 1537 |
| SilPEG 1.2 | 0.17 | 0.13 | 1.93 | 615 | 608 | 808 | 1586 |
| SilPEG 1.3 | 0.05 | 0.03 | 1.94 | 615 | 594 | 828 | 1513 |
| SilPEG 1.4 | 0.11 | 0.05 | 1.93 | 624 | 597 | 810 | 1533 |
| Polymer/Copolymer | Conductance [mS] | Doped/Undoped (“ON/OFF”) Ratio | |
|---|---|---|---|
| Undoped State | Doped State | ||
| P3HT | 7.28 × 10⁻³ | 2.92 × 101 | 4.01 × 10³ |
| SilPEG 1.1 | 4.19 × 10⁻³ | 2.89 × 101 | 6.90 × 10³ |
| SilPEG 1.2 | 2.42 × 10⁻³ | 2.91 × 101 | 1.20 × 10⁴ |
| SilPEG 1.3 | 1.70 × 10⁻³ | 2.90 × 101 | 1.71 × 10⁴ |
| SilPEG 1.4 | 2.86 × 10⁻³ | 2.95 × 101 | 1.03 × 10⁴ |
| Copolymer | Jsc a [mA/cm2] | Voc b [V] | FF c | PCE d [%] |
|---|---|---|---|---|
| SilPEG 1.1 | 5.5 | 0.60 | 0.26 | 0.87 ± 0.15 |
| SilPEG 1.2 | 4.4 | 0.54 | 0.48 | 1.10 ± 0.07 |
| SilPEG 1.3 | 7.4 | 0.60 | 0.50 | 2.11 ± 0.02 |
| SilPEG 1.4 | 4.4 | 0.66 | 0.21 | 0.60 ± 0.19 |
© 2018 by the authors. Licensee MDPI, Basel, Switzerland. This article is an open access article distributed under the terms and conditions of the Creative Commons Attribution (CC BY) license (http://creativecommons.org/licenses/by/4.0/).
Share and Cite
Jarosz, T.; Gebka, K.; Kepska, K.; Lapkowski, M.; Ledwon, P.; Nitschke, P.; Stolarczyk, A. Investigation of the Effects of Non-Conjugated Co-Grafts on the Spectroelectrochemical and Photovoltaic Properties of Novel Conjugated Graft Copolymers Based on Poly(3-hexylthiophene). Polymers 2018, 10, 1064. https://doi.org/10.3390/polym10101064
Jarosz T, Gebka K, Kepska K, Lapkowski M, Ledwon P, Nitschke P, Stolarczyk A. Investigation of the Effects of Non-Conjugated Co-Grafts on the Spectroelectrochemical and Photovoltaic Properties of Novel Conjugated Graft Copolymers Based on Poly(3-hexylthiophene). Polymers. 2018; 10(10):1064. https://doi.org/10.3390/polym10101064
Chicago/Turabian StyleJarosz, Tomasz, Karolina Gebka, Kinga Kepska, Mieczyslaw Lapkowski, Przemyslaw Ledwon, Pawel Nitschke, and Agnieszka Stolarczyk. 2018. "Investigation of the Effects of Non-Conjugated Co-Grafts on the Spectroelectrochemical and Photovoltaic Properties of Novel Conjugated Graft Copolymers Based on Poly(3-hexylthiophene)" Polymers 10, no. 10: 1064. https://doi.org/10.3390/polym10101064
APA StyleJarosz, T., Gebka, K., Kepska, K., Lapkowski, M., Ledwon, P., Nitschke, P., & Stolarczyk, A. (2018). Investigation of the Effects of Non-Conjugated Co-Grafts on the Spectroelectrochemical and Photovoltaic Properties of Novel Conjugated Graft Copolymers Based on Poly(3-hexylthiophene). Polymers, 10(10), 1064. https://doi.org/10.3390/polym10101064