Article

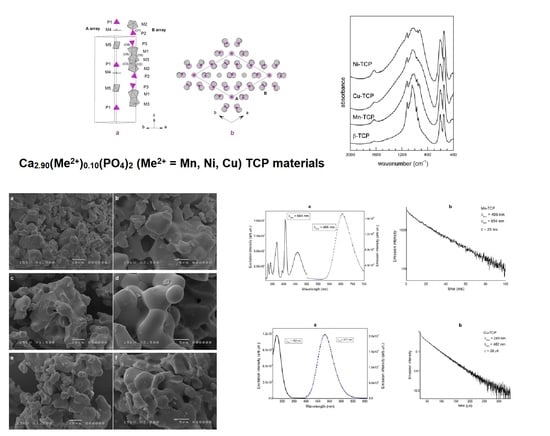
New Ca2.90(Me2+)0.10(PO4)2 β-tricalcium Phosphates with Me2+ = Mn, Ni, Cu: Synthesis, Crystal-Chemistry, and Luminescence Properties

1
Istituto di Cristallografia–CNR, Via G. Amendola, 122/O, 70126 Bari, Italy
2
Dipartimento di Scienze della Terra dell’Ambiente e delle Risorse, Università di Napoli Federico II, Via Mezzocannone 8, 80134 Naples, Italy
3
Faculté des Sciences Semlalia, BP 2390, Université Cadi Ayyad, Marrakech 40000, Morocco
4
Luminescent Materials Laboratory, Università di Verona, Ca’ Vignal, Strada Le Grazie 15, 37134 Verona, Italy
5
Dipartimento di Scienze, Università Roma Tre, Largo S. L. Murialdo 1, 00016 Monterotondo (Rome), Italy
6
Istituto di Cristallografia–CNR, Via Salaria Km 29.300, 00016 Monterotondo (Rome), Italy
*
Author to whom correspondence should be addressed.
Crystals 2019, 9(6), 288; https://doi.org/10.3390/cryst9060288
Submission received: 19 April 2019 / Revised: 23 May 2019 / Accepted: 28 May 2019 / Published: 1 June 2019

Abstract

:
C a 2.90 M e 0.10 2 + ( P O 4 ) 2 (with Me = Mn, Ni, Cu) β-tricalcium phosphate (TCP) powders were synthesized by solid-state reaction at T = 1200 °C and investigated by means of a combination of scanning electron microscopy (SEM) equipped with energy dispersive X-ray spectroscopy (EDS), powder X-ray diffraction (PXRD), Fourier transform infrared (FTIR) spectroscopy, and luminescence spectroscopy. SEM morphological analysis showed the run products to consist of sub spherical microcrystalline aggregates, while EDS semi-quantitative analysis confirmed the nominal Ca/Me composition. The unit cell and the space group were determined by X-ray powder diffraction data showing that all the compounds crystallize in the rhombohedral R3c whitlockite-type structure, with the following unit cell constants: a = b = 10.41014(19) Å, c = 37.2984(13) Å, and cell volume V = 3500.53(15) Å3 (Mn); a = b = 10.39447(10) Å, c = 37.2901(8) Å; V = 3489.22(9) Å3 (Ni); a = b = 10.40764(8) Å, c = 37.3158(6) Å, V = 3500.48(7) Å3 (Cu). The investigation was completed with the structural refinement by the Rietveld method. The FTIR spectra are similar to those of the end-member Ca β-tricalcium phosphate (TCP), in agreement with the structure determination, and show minor band shifts of the (PO4) modes with the increasing size of the replacing Me2+ cation. Luminescence spectra and decay curves revealed significant luminescence properties for Mn and Cu phases.

Graphical Abstract

1. Introduction

Calcium phosphate materials have been largely employed in biomedical applications, such as coatings of components of bone and teeth used in implantology. Owing to their favorable biological response, these materials have been applied in orthopedics and dentistry, in a wide range of typologies like cements, scaffolds, coatings, etc. [1]. Even if the main mineral component of natural bone is Ca10(PO4)6(OH)2 hydroxyapatite (HAp), the synthetic counterpart is poorly resorbed in the body: For this reason, many calcium phosphates, more resorbable and capable of inducing a better bone regeneration, have been preferred to HAp for biomedical applications [2]. Among these compounds, there is the β-Ca3(PO4)2 tricalcium phosphate (β-TCP), well known for being an ideal bone tissue substitute [3] besides being present in human body as dental calculi, salivary stones, arthritic cartilage, and in soft-tissue deposits [2].
Like HAp that allows noticeable substitutions in both cationic and anionic sites of its structure [4], synthetic β-TCP is also well known to be flexible enough for a wide number of cationic substitutions without significant lattice distortions [5]. This gives rise to a large number of products employed in biomedical sciences, for grafts [6] or coatings [7] in bone repairing and in teeth implants [8], or in optical applications due to their excellent luminescence properties when doped with Mn [9] or rare earth elements (RE) [10,11]. In addition, β-TCP is widely investigated because of its close structural relationship with whitlockite Ca18Mg2(PO4)12(PO3OH)2 [12] and merrillite Ca18Na2Mg2(PO4)14 (found in Moon rocks and meteorites) minerals [13].
Recently, we investigated new synthetic Ca9RE(PO4)7·β-TCP optical materials doped with different RE cations, ranging from La (Z = 57) up to Lu (Z = 71) [14,15]. We showed how their crystal chemical features agree with the expected behaviour according to the lanthanide contraction effect already described in phosphate compounds [16,17].
In the present work, the attention is focused on the crystal chemical properties of β-TCP doped with divalent transition metals, specifically Mn, Ni, and Cu. Although TCP structure can accommodate a large number of small-sized metal cations partially replacing Ca, such as Mg, Mn, Fe, Co, Cu, and Zn [18,19,20,21,22,23], as well as divalent cations larger than Ca such as Sr and Ba [18], the system Ni–Ca phosphate has been scarcely investigated from the structural point of view. Studies on inorganic dual-paste apatite cements, produced starting from Me(II)-exchanged TCP, including Ni [24], are present in literature, but structure solutions of nickel–calcium phosphates are rare. Among these, we report a β-TCP polymorph, Ca8.50Ni9.50(PO4)12 (α-TCP), solved in the monoclinic C2/c [25] space group, and two diphosphates: CaNi3(P2O7)2, monoclinic P21/c [26], and CaNi(P2O7), triclinic P 1 ¯ [27].
The aim of the present study is providing a crystal-chemical study of polycrystalline Ca2.90Me0.10(PO4)2 (with Me = Mn, Ni, Cu) materials, obtained via solid-state reaction. Particular emphasis will be devoted to the Ni phase because no crystal structure determinations, to date, exist in the literature. The study was done by combining SEM-EDS morphological analysis, X-ray powder structure solution and refinement, infrared spectroscopy, and luminescence spectroscopy. The present study makes up a further contribution in the frame of a more general study on the crystal chemistry of inorganic phosphates that we have been carrying out in recent years [14,28,29,30].

2. Experimental

Ca3(PO4)2 tricalcium phosphate (TCP) is a high-temperature phase usually obtained by thermal decomposition at T = 800 °C of Ca-deficient HAp, or by solid-state reaction of acidic Ca orthophosphate with a base, usually CaO [31]. The Ca3(PO4)2 compound exists as two polymorphs: A rhombohedral phase (β-TCP) stable at lower T that converts into monoclinic α-TCP at T > 1125 °C [31]. In the present work, Ca2.90Me0.10(PO4)2 (with Me = Mn, Ni, Cu, β–TCP) powder samples were prepared by solid state method, using CaCO3 (FLUKA, 99.0%), (NH4)H2PO4 (Riedel-de Haën, Seelze, Germany, 99%), and MeO (respectively MnO, NiO, and CuO; ALDRICH, Saint Louis, MI, USA, 99.0%), as precursors for calcium, phosphorus, and Me(II), respectively. These starting materials were heated at 700 °C for 3 h to remove H2O and CO2 from the mixture, then were finely ground in an agate mortar and calcinated in an alumina crucible for 7 h at 1250 °C [9], giving rise to the desired stoichiometry according to the reaction:
2.9CaCO3 + 0.1MeO + 2(NH4)H2PO4→Ca2.90Me0.10(PO4)2 + 2NH3 + 2.9CO2 + 3H2O
In the final synthesis stage, the powder samples were heated to a temperature higher than that given by [2] for the β→α transition in pure TCP (1125 °C). This was necessary due to the presence of the Me dopant [14,32].
Detailed morphological and semi-quantitative chemical analyses of the synthesized samples were obtained by using a scanning electron microscope (SEM) JEOL-JSM 5310 (JEOL LTD, Tokio, Japan), coupled with energy dispersive X-Ray spectroscopy (EDS). The setup is equipped with an Oxford Instruments Microanalysis unit, INCA X-act detector, operating at 15 kV primary beam voltage, 50–100 mA filament current, variable spot size, 20 mm WD, and 40 s net acquisition real time.
The powder samples were pressed and placed in the right half part of a conventional 13 mm aluminium stab making a homogeneous and flat surface to be exposed to the electron beam, and then coated with graphite. Two analytical points on 10 microcrystals for each sample were collected; cobalt was used for routine calibration and as an internal standard, imposing the closure to 100 wt%. Morphological analysis was performed, placing the samples at the left half part of the stab and then coating with gold.
X-ray powder diffraction data of Me β-TCP were collected for structural analysis. They were recorded at room temperature by using an automated Rigaku RINT2500 laboratory diffractometer (50 KV, 200 mA) equipped with the silicon strip Rigaku D/teX Ultra detector. An asymmetric Johansson Ge (111) crystal was used to select the monochromatic Cu Kα1 radiation (λ = 1.54056 Å). The main acquisition parameters are reported in Table 1. The angular range 8–120° (2θ) was scanned with a step size of 0.02° (2θ) and counting time of 4 s/step. Each measurement was executed in transmission mode, by introducing the sample in a special glass capillary with a 0.3 mm of diameter and mounted on the axis of the goniometer. In order to reduce the effect of possible preferred orientation, the capillary was rotated during measurement to improve the randomization of the orientations of the individual crystallites.
The determination of the unit cell parameters, the identification of the space group, the structure solution, and the model refinement via the Rietveld method [33] were carried out by a default run of EXPO2013 [34], a package able to automatically execute the full pathway of the powder solution process.
The powder FTIR spectra of Me β-TCP samples were collected on a Nicolet iS50 FTIR spectrometer equipped with a DTGS detector and a KBr beam splitter; nominal resolution was 4 cm−1 and 64 scans were averaged for both sample and background. The samples were prepared as a KBr disk, mixing 1 mg of sample with 150 mg of KBr.
Room temperature luminescence spectra and decay curves were measured by using a Fluorolog 3 (Horiba-Jobin Yvon) spectrofluorometer, equipped with a Xe lamp, a double excitation monochromator, a single emission monochromator (mod. HR320), and a photomultiplier in photon counting mode for the detection of the emitted signal. Lifetimes were measured by means of time correlated single photon counting technique (TCSPC), with a xenon microsecond pulsed lamp as excitation source. The decays curves were fitted by the instrument software [35].
End-member TCP has been also synthesized in the same experimental batch and characterized using the same set of methods described here for Me(II) substituted phases. The structural details of this compound are, however, well known in the literature [36], thus will not be included in the present paper, except for the IR pattern, which is useful for the discussion below.

3. Results and Discussion

3.1. SEM-EDS Analysis

SEM images show that the synthesized TCP compounds crystallize with morphologies slightly different from phase to phase. Specifically, Mn-TCP crystallites appear usually rounded, subspherical, and in few cases, drop-like shaped, and forming relatively compact aggregates (Figure 1a). Locally, the aggregates result as porous due to the presence of cavities (Figure 1b). Average sizes for crystals and aggregates are 5 and 20 μm, respectively.
Ni-TCP consists of crystallites with dimensions ranging from 5 up to 10 μm (Figure 1c), displaying subspherical habit; those with larger sizes assemble into porous aggregates with irregular shape. The aggregates also show, besides an evident porosity, concavities in correspondence with fractures, suggesting non-perfect cohesion among the microcrystals (Figure 1d). A magnified image of the subspherical microcrystals (Figure 1d) shows growth layers on the surface of the single microcrystals.
Cu-TCP shows the presence of irregular aggregates, composed of crystallites with variable size (Figure 1e), displaying a porous texture. Microcrystals are rounded with subspherical shape, and in some cases, have a drop-like shape (Figure 1f). The cavities of aggregates show a size up to 10 μm.
Similar morphologies were already observed in natural TCP, like dental calculi [37], and in synthetic RE-TCP compounds [14] where, in particular, the Eu-TCP and Nd-TCP showed similar subspherical habit, analogous crystal dimensions, and comparable aggregates porosity.
Specifically, the Cu-TCP crystal shows a morphology comparable with copper-substituted TCP described by [38], even if with different size of crystallites (average 2 μm). The Mn-TCP morphology is very similar to manganese-substituted TCP samples reported by [19], where the crystals are described as rounded and drop-like shaped, with dimensions of crystallites similar to those reported in Figure 1e,f.
Semi-quantitative EDS analysis, reported in Table 2, provided crystal formulae in excellent agreement with the nominal empirical formulae for these compounds. SEM-EDS observations also showed the absence of additional phases in the experimental powders.

3.2. X-ray Structural Study

3.2.1. Structural Solution

For each compound under investigation, all crystal structure solution steps, from indexing to structure model refinement, were performed using the EXPO2013 software [34]. The indexation of the powder diffraction patterns was obtained through the N-TREOR09 program [39] integrated in EXPO2013. For each investigated X-ray diffraction profile, we verified that the cell parameters corresponded to a monophase crystal structure and no other unindexed diffraction peaks were present in the pattern. The following space group determination step revealed the rhombohedral R3c space group, confirming the expected whitlockite-like unit cell [12,36]. Structure solution was obtained via the direct methods procedure in EXPO2013, confirming the model reported in [36], while structural refinement was performed by the Rietveld method, assuming different possible localization for Me, as further explained. Detailed crystallographic results are given in Table 1. Due to the refinement instability, the following working strategy was applied: In the sites shared by Ca and Me, the position and the thermal parameter of both occupants were constrained to be equal, and the sum of Ca and Me occupancies fixed to 1.0. Moreover, the thermal parameters of P and O atoms were constrained to be equal. The principal crystal structure refinements data are reported in Table 1, while in Figure 2, and only for Ni-TCP phase, the agreement between the observed (blue line) and the calculated (red line) diffraction pattern is displayed, together with the difference pattern plotted on the same scale (violet curve). The crystallographic information files (CIF) can be obtained free of charge from the joint service Cambridge Structural Database (CSD) [40]—Inorganic Crystal Structure Database (ICSD) [41], quoting the depository number CSD-1893568 (Mn), -1882721 (Ni), and -1893571 (Cu), via www.ccdc.cam.ac.uk/getstructures.
The refined unit cell constants: a = b = 10.41014(19) Å, c = 37.2984(13) Å, V = 3500.53(15) Å3 (Mn); a = b = 10.39447(10) Å, c = 37.2901(8) Å; V = 3489.22(9) Å3 (Ni); a = b = 10.40764(8) Å, c = 37.3158(6) Å, V = 3500.48(7) Å3 (Cu), are similar to those of Me(II) β-TCP phases given in ICSD [41].
According to the notation introduced in the neutron refinement of β-TCP [36], five cationic sites (M1–M5) are present in the Ca2.90Me0.10(PO4)2 structure: M1–M3 are in general positions, while M4 and M5 are in special ones (Table 3). Two phosphorous and nine oxygen atoms are located in general positions, while one additional phosphorous (P1) and one oxygen atom (O10) are in special positions, as reported in Table 3 for the Ni β–TCP phase. As they are isostructural with Ni β–TCP, the Mn and Cu β–TCP atomic positions are not reported. Worthy of note is that the M4 occupancy, which is fixed at 1/2 in order to allow the charge balance in the structure [36,42], is unambiguously confirmed by the Rietveld refinement, as described below.

Polyhedral coordination

The calcium atoms occupy all M1–M5 sites, giving rise, with the surrounding oxygen atoms, to different polyhedral coordinations, when using a maximum bonding threshold at 2.81 Å. For each of the Me dopants, the M1 site displays a complex 7-fold coordination (Figure 3), with the shorter distance observed for the M1-O6 bond and equal to 2.255(16) (Mn), 2.249(18) (Ni), and 2.313(11) (Cu) Å. The longest distance is M1-O9 = 2.434(1) for Mn and 2.455(9) for Ni Å, and M1-O3 = 2.313(11) Å for Cu. The average <M1-O> bond distances are 2.39 (Mn), 2.40 (Ni), and 2.44 (Cu) Å (Table 4). Worthy of note are the M1…O2 interactions, slightly over the coordination spheres of the three cations, respectively at 2.891(14) (Mn), 2.823(15) (Ni), and 2.889(12) (Cu) Å.
The M2 site is engaged in an irregular 8-fold coordination (Figure 3). The lowest distances are M2-O9 = 2.287(19) (Mn) and 2.276(13) Å (Ni) and M2-O7 = 2.343(9) for Cu. The longest distance values are M2-O6 = 2.706(16) (Mn), 2.76(2) (Ni), and 2.803(16) (Cu) Å. The average <M2-O> bond distances for Mn, Ni, and Cu phases are 2.45, 2.44, and 2.48 Å, respectively (Table 4).
The M3 site, as well as M2, displays an irregular 8-fold coordination (Figure 3). The M3-O3 is the lowest bond distance, equal to 2.36(2) (Mn), 2.349(15) (Ni), and 2.371(15) (Cu) Å, while the largest ones are M3-O3 for Mn (2.643(17) Å) and Ni (2.634(12) Å) and M3-O1 = 2.659(13) Å for Cu phase. The average bond distances in M3 site are 2.53 (Mn), 2.52 (Ni), and 2.52 (Cu) Å (Table 4).
The coordination of the M4 site is quite singular, being a 3-fold coordinated polyhedron, with coordinating cation lying on the 6a special position, which gives rise to three M4-O1 equal bond distances at 2.431(14) (Mn), 2.472(12) (Ni), and 2.524(11) (Cu) Å. As shown in Figure 3, the environment geometry resembles to a triangular planar shape.
The last M5 site displays a regular octahedral coordination (Figure 3), which gives rise to two sets of bond distances: M5-O4 = 2.18(2) (Mn), 2.144(16) (Ni), and 2.165 (Cu) Å, and M5-O7 = 2.194(19) (Mn), 2.217(17) (Ni), and 2.296(13) (Cu) Å. The average bond distances at M5 site are 2.19 (Mn), 2.18 (Ni), and 2.23 (Cu) Å.
The M5 octahedral site is a highly interesting host site with unexpectedly short Ca-O bond lengths (Table 4) and low values of isotropic thermal parameters (Table 3). The site can be easily partially substituted by transition metal cations, as Mn in Ca2.85Mn0.15(PO4)2 [19], Fe in Ca2.67Fe0.33(PO4)2 [20], Co in Ca2.71Co0.29(PO4)2 [21], and Zn in Ca2.71Zn0.29(PO4)2 [23]. A different behavior is observed in Ca2.71Cu0.29(PO4)2 [21], where Cu fully replaces M5, leading to a remarkably large energetic and steric distortions due to Jahn–Teller effect [43].
With respect to other inorganic Ca phosphates [41], shorter Ca-O bond distances are observed in M1, M2, and, above all, in the M5 site. Such short bond length values lead to anomalous results in the bond valence sum (BVS) calculations, peaking in M1 at 2.35 (Mn), 2.33 (Ni), and 2.06 (Cu) valence units (v.u.), in M2 at 2.34 (Mn), 2.40 (Ni), and 2.18 (Cu) v.u., and in M5 at 2.85 (Mn), 2.82 (Ni), and 2.43 (Cu) v.u. (Table 4). The large BVS values in M5, for each of the investigated compounds, suggest the presence of the dopant in the site, as is also confirmed by the Rietveld refinement.
Regarding the M3 site, the Ca–O bond distances are in good agreement with the literature with more usual BVS values equal to 1.83 (Mn), 1.86 (Ni), and 1.85 (Cu) v.u. (Table 4).
A separate discussion is required for the triangular M4 site, which shows the noticeable low BVS values of 0.43 (Mn), 0.38 (Ni), and 0.34 (Cu) v.u. (derived taking into account the site occupancy factor fixed at ½, see Table 3). Over the three Ca4-O1 bonds, the next three oxygen atoms are at 2.99 Å from Ca4. We could speculate that Ca4 is a missing octahedron, with three of the six interactions overbonded for packing reasons.
The phosphorous atoms are engaged in regular tetrahedral coordinations, with average bond distances of 1.57 (Mn), 1.58 (Ni), and 1.52 (Cu) Å in (P1O4) group, of 1.63 (Mn), 1.62 (Ni), and 1.62 (Cu) Å in (P2O4) group, and of 1.57 (Mn), 1.58 (Ni), and 1.53 (Cu) Å in (P3O4) group (Table 4). In each investigated sample, all the P–O bond distance values are longer than those retrieved in orthophosphate anions [41], especially P2-O2 = 1.663(18) (Mn) and 1.65(2) (Ni) Å, even if in good agreement with distances reported in literature for powder diffraction refinements of some phosphate structures [14,17]. These long-distance values also anticipate the underestimated results in BVS calculations for phosphorous atoms. For P1, the lowest values are 4.51 (Mn) and 4.41 (Ni) v.u., for P2, 3.86 (Mn) and 4.02 (Ni) v.u., and for P3, 4.53 (Mn) and 4.23 (Ni) v.u. In the Cu phase, the BVS values are closer to the ideal ones, peaking at 5.17 (P1), 4.84 (P2), and 5.05 (P3) v.u. (Table 3).
The dopant distribution within the crystal structure was investigated by testing the possible dopant localization in all the structural sites. The result of the occupancy refinements unambiguously led to the presence of the dopant cation only in the M5 site, in agreement with other Me(II) β-TCP structures [41] and provided occupancy values of 0.32(3) (Mn), 0.31(2) (Ni), and 0.33(1) (Cu). Moreover, the presence of the dopant in M5 was expected on the basis of the short average <M5-O> distances (Table 4), and it was confirmed by the Ni–O distances reported in the inorganic phosphates [25,26,27] by the Mn-O and Cu-O distances found in some β-TCP [41], and from a further investigation executed in the open chemistry database (OChemDb), the free online portal designed for analyzing crystal-chemical information [44], whose obtained statistics are depicted in Figure 4; this revealed that the most recurrent Mn-O, Ni-O, and Cu-O bond distances are those experimentally found in the M5 site. Last, the refined site-occupancy results provided total apfu values of 0.091 for Mn, 0.089 for Ni, and 0.094 for Cu, very close to the Ca2.90Me0.10(PO4)2 nominal formula. Such a tendency for the substituting dopants to preferentially order at M5 was expected on the basis of ionic radii considerations [45]: Mn (0.67 Å), Ni (0.69 Å), and Cu (0.73 Å), and Mg 0.72 (Å), are smaller than Ca (1.00 Å), thus preferring the energetically favorable M5 in the β-TCP structure; on the other hand, cations with ionic radius larger than Ca, such as Sr (1.18 Å) and Ba (1.35 Å), seem to prefer the larger M4 site [18]. This is also in agreement with the bonding properties prevailing within the phosphate structure: In fact, the electronic structure of β-TCP has a strong ionic character, and thus the ionic radii play a key role in determining the site preference of the substituting ions. There is also, however, a covalent contribution to the bonding connection between the substituting ions and the surrounding oxygens [46].

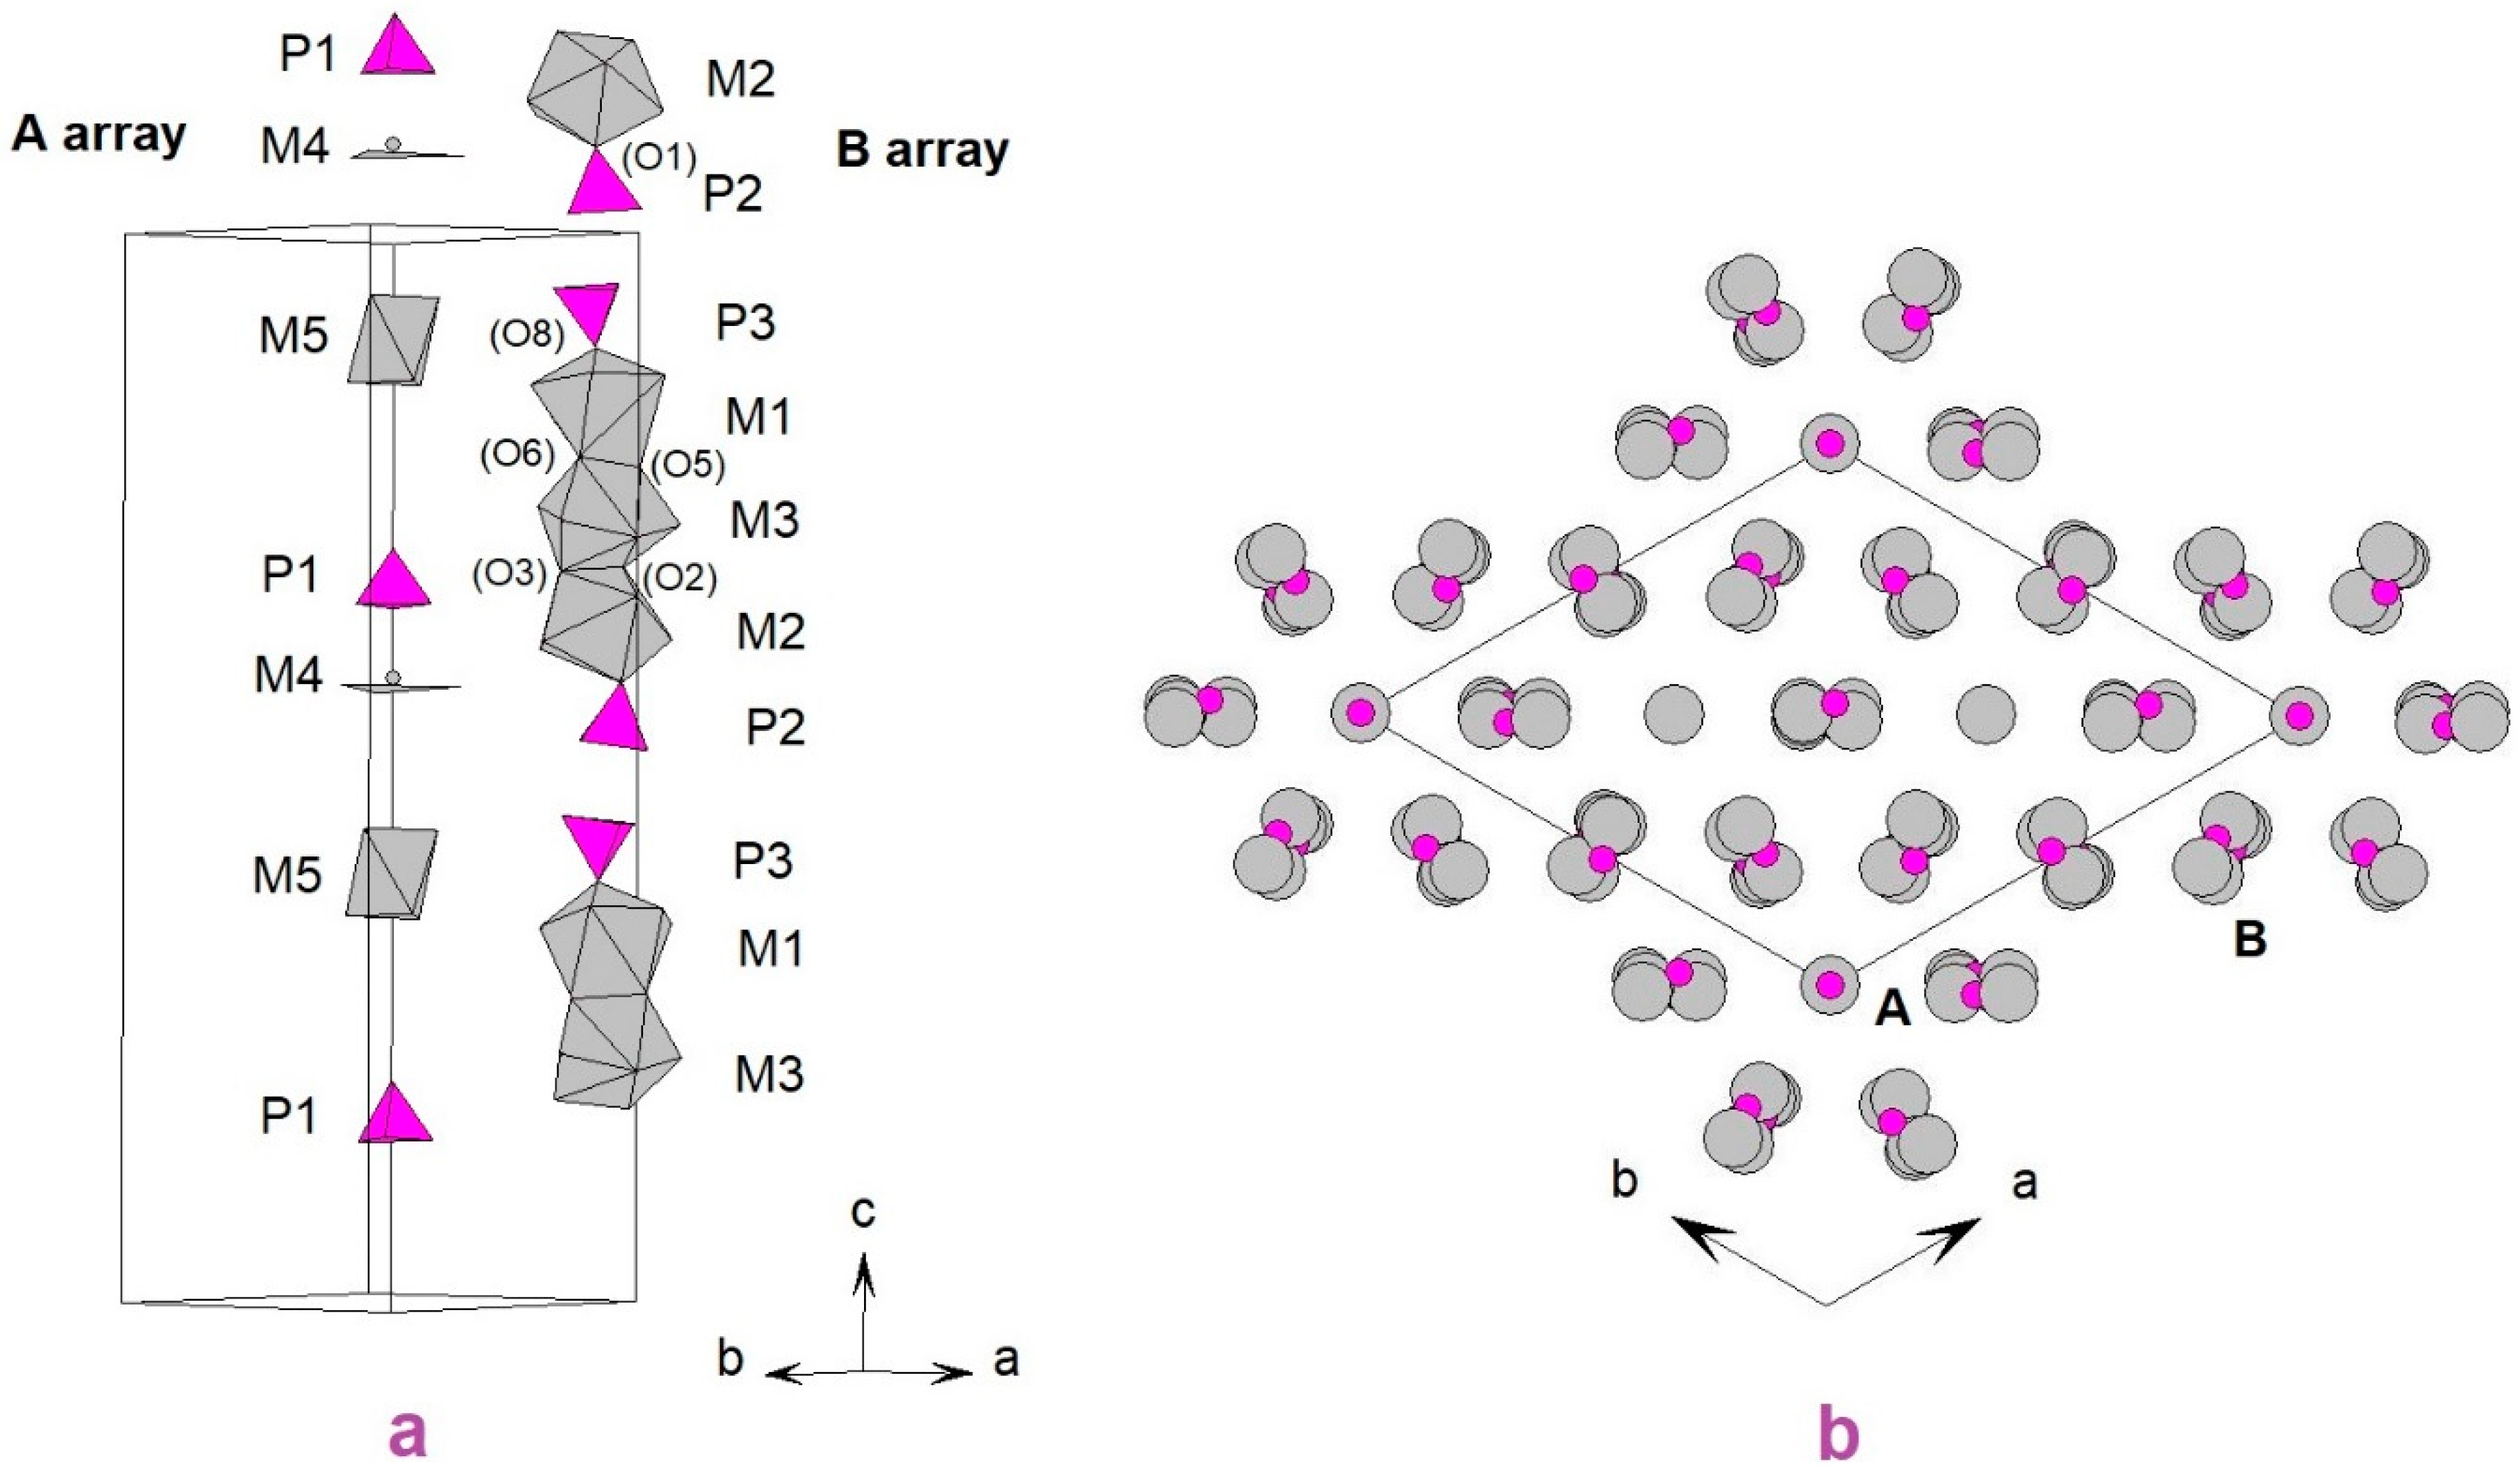
3.2.2. Three-Dimensional Framework

The three-dimensional framework of Me β-TCP can be described by the repetition of two columnar arrays of polyhedra, labeled as A and B types, down to the crystallographic c axis. The A array is formed by —P1—M4—M5—P1— polyhedra sequence, while the B array is made up by —P3—M1—M3—M2—P2—P3— sequence (Figure 5a). On their turn, every A array is surrounded by six B arrays, and every B array by two A and four B arrays (Figure 5b). In the A column, the x and y atomic coordinates of the M4, M5, and P1 sites have zero value (Table 3), indicating a reasonably linear distribution of the atoms and a discrete polyhedra sequence with no shared oxygen atoms among P1O4, M4O3, and M5O6 groups (Figure 5a). On the other hand, in the B array, the x and y atomic coordinates of the M1, M2, M3, P2, and P3 sites indicate a rather distorted path. Unlike the A array, in B, some polyhedra are joined together: M2O8 and P2O4 groups are linked by the O1 sharing corner, and M1O7 and P3O4 groups are linked by the O8 sharing corner. The M3O8 group is linked with M1O7 and M2O8 polyhedra by sharing the O5-O6 and O2-O3 edges, respectively (Figure 5a). In addition, the B array, made up of two phosphorous tetrahedra and six cationic polyhedra, shows a denser structure than the A one, composed of four PO4 tetrahedra and six cationic polyhedra (Figure 5a). Every A array is joined to the surrounding six B arrays via multiple sharing vertices coming from P1, M4, and M5 polyhedra. Specifically, P1O4 shares O9 with M2O8 and M1O7 coming from two adjacent B arrays, and the O10 vertex with the M3O8 group. Owing to the P1 symmetry site (Table 3), such sharing vertices are repeated three times, as shown in Figure 6a. The triangular M4O3 group shares its O1 vertex with M2O8 and P2O4 groups coming from the same A array, and with M3O8 group from another A array. The three sharing vertices, repeated three times for the site symmetry of M4, are shown in Figure 6b. M5O6 octahedra shares the O4 and the O7 vertices. The first O4 with, clockwise, two M2O8 groups and one P2O4 tetrahedron and the second O7 with, clockwise, two M1O7 groups and one P1O4 tetrahedron. All the shared groups belong to different B arrays. The two triads of sharing vertices of M5O6 octahedron, repeated three times for symmetry, are depicted in Figure 6c.
The β-Ca3(PO4)2 crystal structure has its natural counterpart in the terrestrial Ca18Mg2(PO4)12(PO3OH)2 whitlockite mineral, a = b = 10.3612(6) Å, c = 37.096(4) Å, and V = 3448.88 Å3 [12], and in the de-hydrogenated extra-terrestrial Ca18Na2Mg2(PO4)14 merrillite a = b = 10.3444(3), c = 37.0182(11) Å, and V = 3430.5(2) Å3 [13]. With respect to the determination of the sites occupied by dopants, different scenarios are possible: In whitlockite, Mg2+ (and in lower amounts, Fe2+) replaces Ca2+ at the M5 site and no modifications in the number of sites are observed [12]; in merrillite, Na+ is refined in the M4 site, and Mg2+ (and in lower amount Fe2+) in M5 [13].
When a trivalent cation enters the β-TCP structure, a lowering in the number of sites is observed, with the loss of the M4 site deficient in Ca, as described in Ca9Cr3+(PO4)7 [47] and Ca9Fe3+(PO4)7 [48]. In these compounds, the replacing cation was refined in the M5 site. If the rare earth elements (RE3+) enter the β-TCP structure, the cations replace Ca2+ in the M1-M3 or M1, M2, and M5 sites, with an evident trend in the occupancy values as a function of the RE3+ atomic numbers; specifically, decreasing in M3 for all RE3+, increasing in M1 and M2 for low RE (La→Gd), and slightly decreasing for high RE (Dy→Lu). Finally, in the M5 site, the low RE3+ are not present, while increasing occupancy values are observed for high RE elements [15].

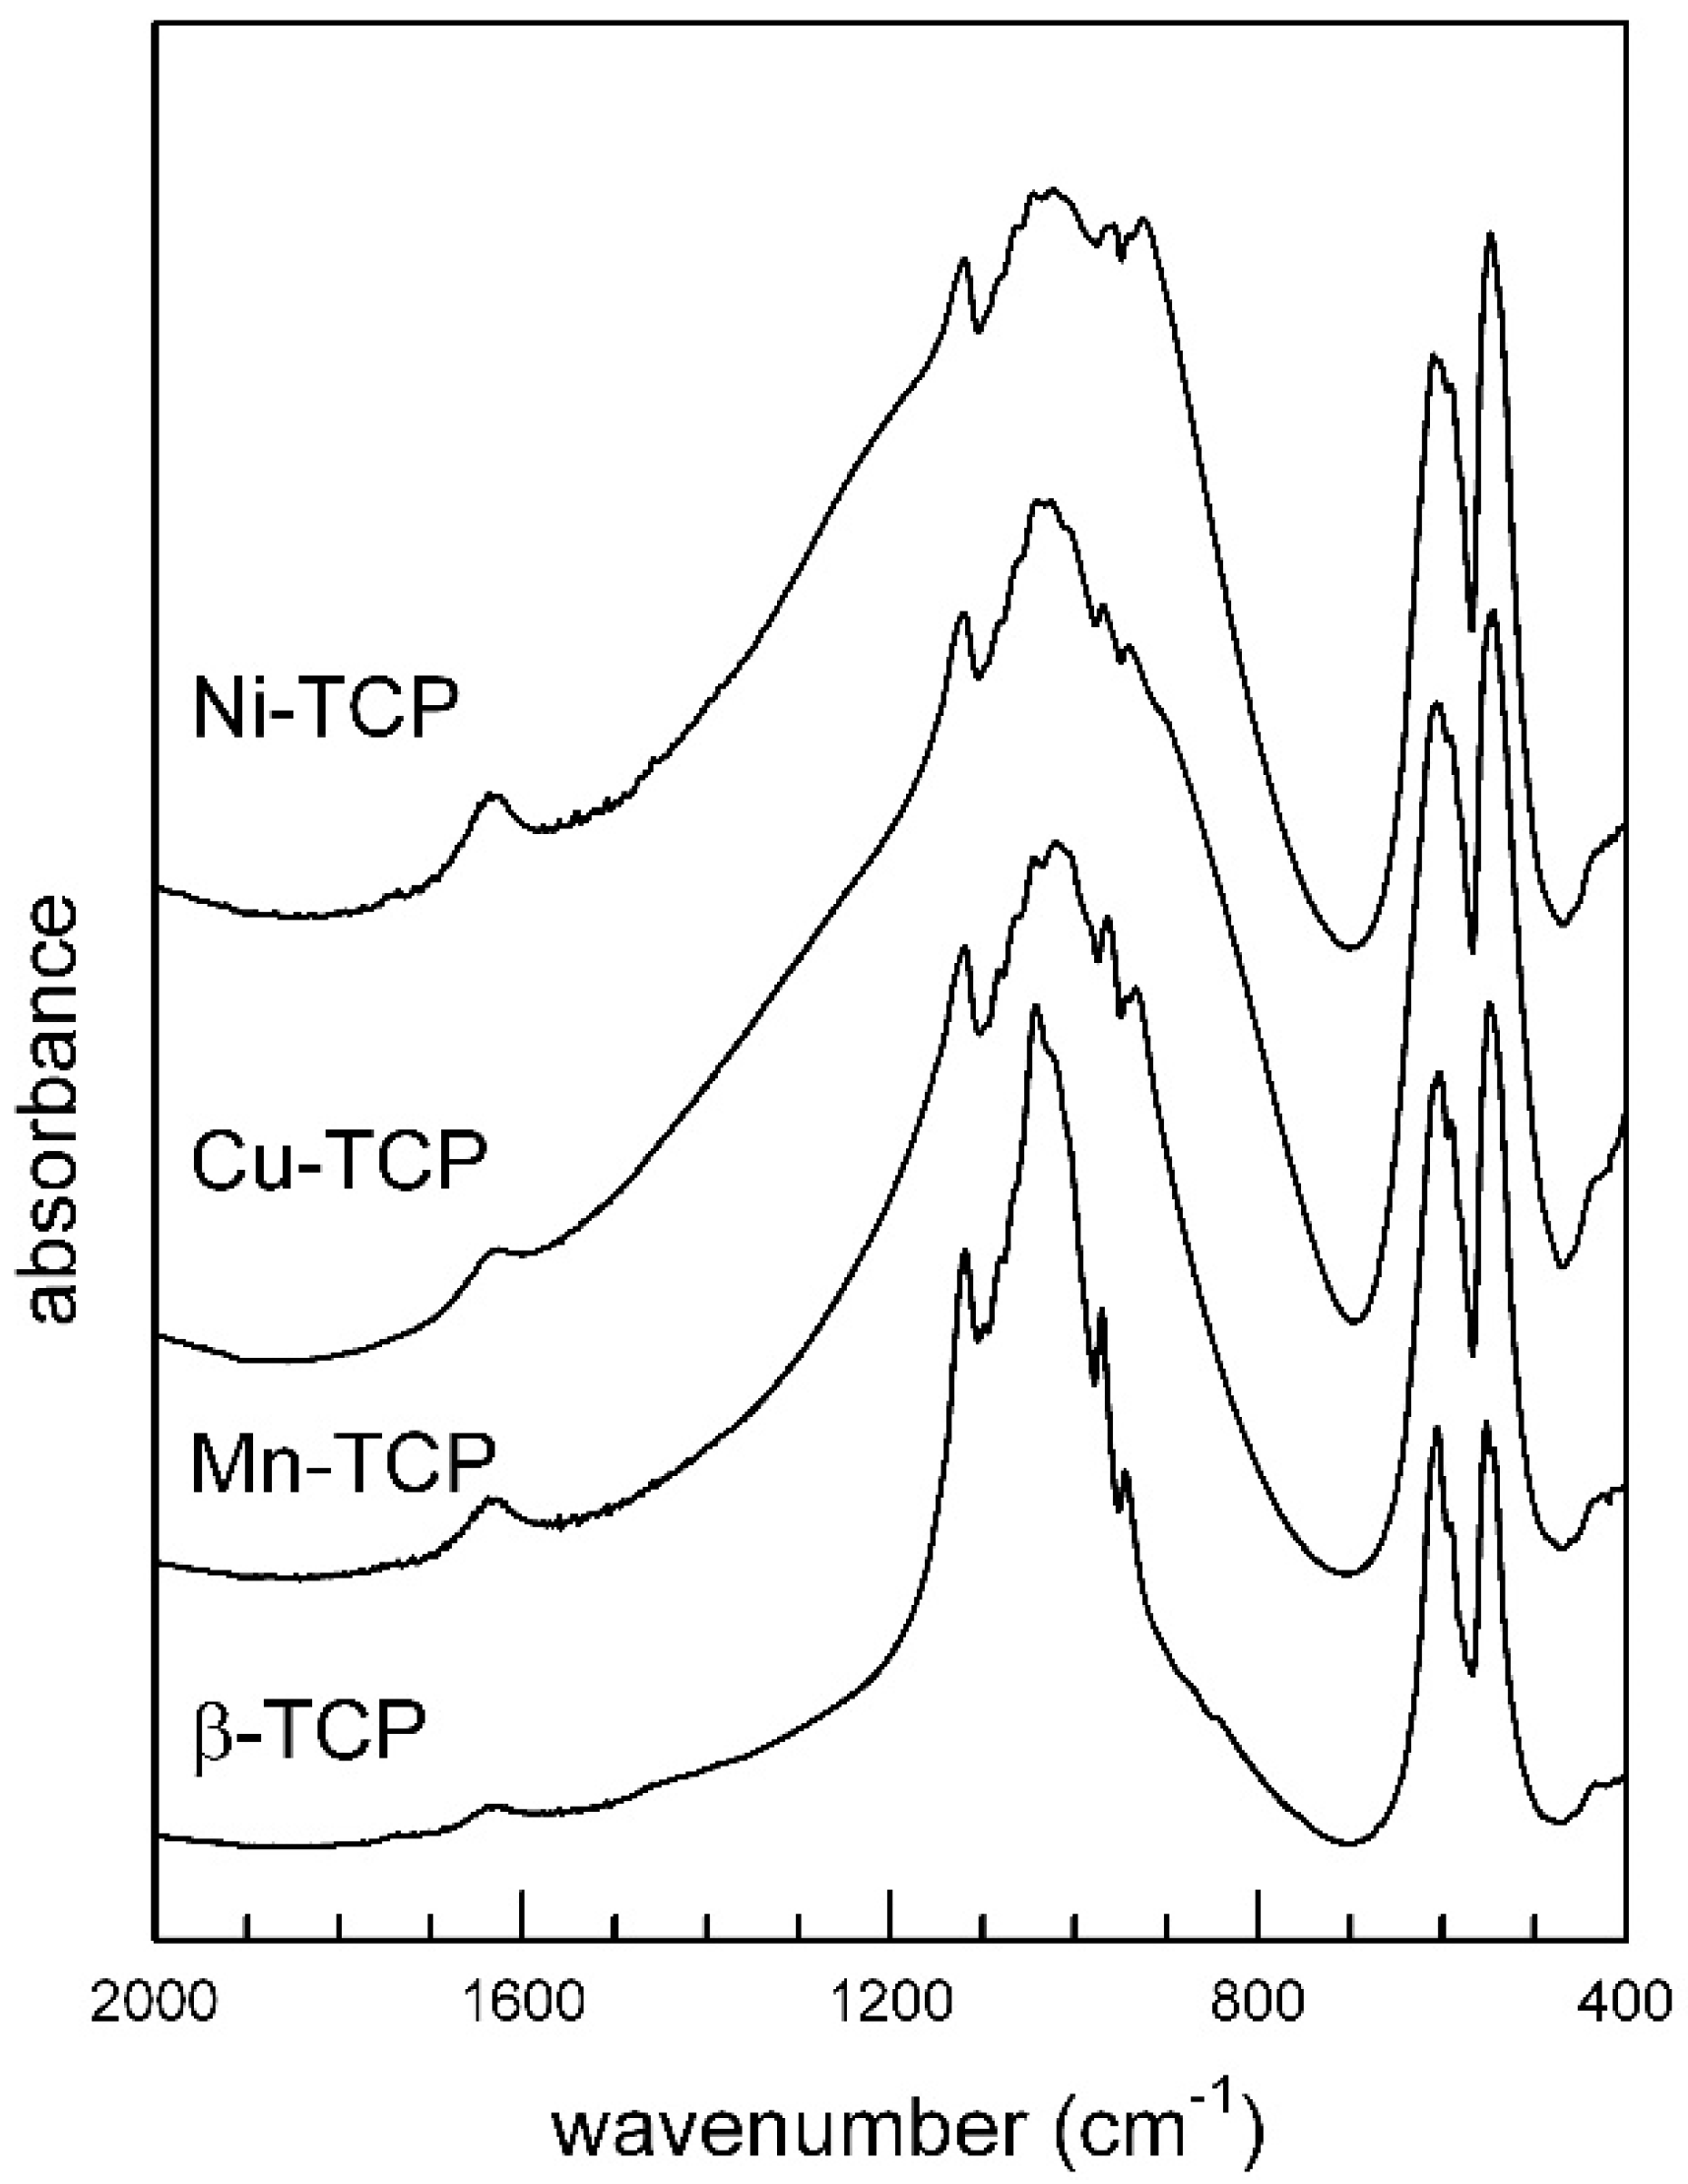
3.3. FTIR Spectroscopy

The powder FTIR spectra of Mn, Ni, and Cu β-TCP compounds were studied in the 2000–400 cm−1 wavenumber region and shown in Figure 7, where they are compared with pure β-TCP [15]. Measured band positions (wavenumbers, cm−1) are listed in Table 5. Note that all spectra were collected in the full MIR range 4000–400 cm−1, however no absorptions due to structural OH/H2O (except for the typical moisture of the KBr pellet) were observed, thus in the following, only the range <2000 cm−1 is displayed.
The FTIR spectrum of β-TCP has been widely investigated in terms of site-symmetry and factor group analysis [49,50]. According to the literature, the free phosphate ion (PO4)3− (ideal Td point symmetry) has four modes of vibration [49,50,51]: The antisymmetric stretching ν3 at 1082 cm−1, the symmetric stretching ν1 at 980 cm−1, the antisymmetric bending ν4 at 567 cm−1, and the symmetric bending ν2 at 420 cm−1. In accordance with selection rules, the triply degenerate antisymmetric stretching and bending modes (F2) are both Raman and infrared active, whereas the non-degenerate symmetric stretching (A1) and the doubly degenerate symmetric bending (E) are Raman active only. When the symmetry of the (PO4)3− ion is lowered from Td shifts of the absorption/scattering bands with respect to the ideal values reported above, band splittings and appearance of non active IR/Raman modes are observed [51].
The FTIR spectra of Ca2.90Me2+0.10(PO4)2 compounds (Figure 7) are very similar to the spectrum of pure β-TCP and show several absorption bands that are assigned to P–O stretching and O–P–O bending modes. The band multiplicities (Figure 7) show that the local symmetry of the (PO4)3− group in β-TCP is in fact reduced from Td to C1 [50]. In addition, three independent PO4 groups are present in the structure, thus greatly increasing the number of observable bands. At least seven FTIR intense peaks are resolved in the antisymmetric stretching 1200–1000 cm−1 range (Table 5). Four relatively intense components occur as symmetric stretching modes on the lower wavenumber side of the main broad absorption, in the 970–900 cm−1 range. The antisymmetric bending modes in the 700–500 cm−1 range (ν4, Table 5) are also intense in the spectrum, while in the water stretching region of the FTIR spectra (not shown in Figure 7), a broad and intense band in the 3000–3600 cm−1 range is due to absorbed water [52].
The X-ray structure refinement study described above shows that the substitution of Mn, Ni, and Cu intothe β-TCP structure follows the mechanism described in [14], without symmetry modifications, and in agreement with this, the infrared spectrum in the phosphate framework mode region (Figure 7) show only slight shifts in the band positions (Table 5) and minor modifications in the relative band intensities. The multiplicity of resolvable peaks remains virtually constant (Table 5), the only notable difference being observed in the band widths that are clearly larger in Me2+-substituted compounds. This is in agreement with the expected local cation disorder that is typically correlated to a substitutional broadening [53] of the IR absorptions.

3.4. Luminescence Spectroscopy

A luminescence spectroscopy study of all the Me2+ β-TCP under investigation was performed. The Mn-TCP sample was found to be efficiently luminescent, emitting broad-band red light upon excitation in the 300–500 nm range (Figure 8a). The emission spectrum is assigned to the 4G(T1g)→6S transition of Mn2+ ions located in octahedral centers [54,55]. This transition in high symmetry is strongly (spin- and symmetry-) forbidden, resulting in a very long decay time. In the present case, the room temperature decay is nearly exponential, with a decay constant (25 ms) that is comparable with the values commonly found for Mn2+ in cubic (or slightly distorted) sites, such as in the case of calcite CaCO3 (close to 40 ms at room temperature) [54]. The long decay time observed in the present study (Figure 8b) indicates that in Mn-TCP, the energy migration among Mn2+ ions to killer impurities is not efficient.
The Ni-TCP sample did not provide any measurable luminescence signal in the visible region at room temperature. The Cu-TCP sample was also found to be strongly luminescent when excited in the UV region at room temperature. The emission spectrum measured upon excitation at 277 nm, and the excitation ones taken with observation at 482 nm are shown in Figure 9a. The spectra are composed of broad and structureless features peaking around 280 (excitation) and 490 nm (emission), corresponding to 35,700 and 20,400 cm−1, respectively. The band profiles are approximately Gaussian, and the Stokes shift is not far from 15,000 cm−1. The luminescence spectrum is similar to the ones reported and discussed by [56] for the Cu+ ion present as impurity in β-TCP and assigned to a partly forbidden s→d transition [57]. In the present case, copper had been introduced as a divalent Cu2+ dopant of the crystalline material, but clearly some (probably partial) reduction has occurred in the synthetic procedure, giving rise to the luminescent Cu+ species. The decay curve of the luminescence upon pulsed excitation is shown in Figure 9b in a semi-log plot. The profile is almost exponential with a faster component at short times. The fit of the exponential tail gives a decay time of 38 µs, close to the values reported by [58] at room temperature for phosphate glasses doped with Cu+.

4. Conclusions

In this work, we synthesized β-TCP compounds doped with Me divalent cations (Me = Mn, Ni, and Cu), and studied the resulting products via a combination of methodologies. SEM-EDS showed the run products, consisting of subspherical microcrystalline aggregates, to be in composition, and having the nominal stoichiometry. Rietveld refinement of the structure from X-ray powder diffraction data showed that all Me-substituted phosphate compounds crystallizes in a rhombohedral R3c whitlockite-type structure. Analysis of the site occupancies at the available octahedral sites shows a strong tendency of Mn, Ni, and Cu to order at the energetically more favorable M5 octahedron. This feature is in line with previous findings showing that the substitution of cations smaller than Ca, at least at low concentrations, does not involve major structural modifications. The FTIR spectra show slight band shifts of the phosphate modes correlated to the evolving size of the replacing cation. Luminescence spectroscopy showed significant luminescence properties and consistent decay times for Mn and Cu phases and revealed a partial reduction from Cu2+ to Cu+ specie.

Author Contributions

All the authors conceived and designed the main ideas together, supervised the whole work, and wrote the text; A.E.K. and M.E. contributed in the synthesis of the inorganic phosphates; M.R. contributed in SEM-EDS analysis; A.A., R.R., and F.C. contributed in PXRD data collections and Rietveld refinements; G.D.V. contributed in FTIR spectroscopy; V.P. contributed in luminescence spectroscopy.

Acknowledgments

Research developed within the activities of CNR (Italy)–CNRST (Morocco) bilateral project 2016-17 ‘Novel Ca9RE(PO4)7 biomaterials: synthesis and multi-methodological characterization via X-ray techniques’ reference CNR 1588/16. F.C. and V.P. are grate to Marco Bettinelli (University of Verona, Italy) for his precious suggestments on TCP characterization.

Conflicts of Interest

The authors declare no conflict of interest. The founding sponsors had no role in the design of the study; in the collection, analyses, or interpretation of data; in the writing of the manuscript, and in the decision to publish the results.

References

  1. Dos Santos, M.L.; dos Santos Riccardi, C.; de Almeida Filho, E.; Guastaldi, A.C. Calcium phosphates of biological importance based coatings deposited on Ti-15Mo alloy modified by laser beam irradiation for dental and orthopedic applications. Ceram. Int. 2018, 44, 22432–22438. [Google Scholar] [CrossRef]
  2. Dorozkhin, S.V. Calcium Orthophosphates bioceramics. Ceram. Int. 2015, 41, 13913–13966. [Google Scholar] [CrossRef]
  3. Habraken, W.; Habibovic, P.; Epple, M.; Bohner, M. Calcium phosphates in biomedical applications: Materials for the future? Mater. Today 2016, 19, 69–87. [Google Scholar] [CrossRef]
  4. Hughes, J.M.; Rakovan, J.F. Structurally robust, chemically diverse: Apatite and apatite supergroup minerals. Elements 2015, 11, 165–170. [Google Scholar] [CrossRef]
  5. Renaudin, G.; Gomes, S.; Nedelec, J.-M. First-row transition metal doping in calcium phosphate bioceramics: A detailed crystallographic study. Materials 2017, 10, 92. [Google Scholar] [CrossRef]
  6. Agarwalla, A.; Puzzitiello, R.; Garcia, G.H.; Forsythe, B. Application of a Beta-Tricalcium Phosphate Graft to Minimize Bony Defect in Bone–Patella Tendon–Bone Anterior Cruciate Ligament Reconstruction. Arthrosc. Tech. 2018, 7, e725–e729. [Google Scholar] [CrossRef] [PubMed]
  7. Guo, X.; Liu, X.; Gao, H.; Shi, X.; Zhao, N.; Wang, Y. Hydrothermal growth of whitlockite coating on β-tricalcium phosphate surfaces for enhancing bone repair potential. J. Mater. Sci. Technol. 2018, 34, 1054–1059. [Google Scholar] [CrossRef]
  8. Ogawa, K.; Miyaji, H.; Kato, A.; Kosen, Y.; Momose, T.; Yoshida, T.; Nishida, E.; Miyata, S.; Murakami, S.; Takita, H.; et al. Periodontal tissue engineering by nano beta-tricalcium phosphate scaffold and fibroblast growth factor-2 in one-wall infrabony defects of dogs. J. Periodont. Res. 2016, 51, 758–767. [Google Scholar] [CrossRef] [Green Version]
  9. Bessière, A.; Lecointre, A.; Benhamou, R.A.; Suard, E.; Wallez, G.; Viana, B. How to induce red persistent luminescence in biocompatible Ca3(PO4)2. J. Mater. Chem. C 2013, 1, 1252–1259. [Google Scholar] [CrossRef]
  10. Bessière, A.; Benhamou, R.A.; Wallez, G.; Lecointre, A.; Viana, B. Site occupancy and mechanisms of thermally stimulated luminescence in Ca9Ln(PO4)7 (Ln = lanthanide). Acta Mater. 2012, 19, 6641–6649. [Google Scholar] [CrossRef]
  11. Piccinelli, F.; Trevisani, M.; Plaisier, J.R.; Bettinelli, M. Structural study of Yb3+, Eu3+ and Pr3+ doped Ca9Lu(PO4)7. J. Rare Earths 2015, 33, 977–982. [Google Scholar] [CrossRef]
  12. Hughes, J.M.; Jolliff, B.L.; Rakovan, J.F. The crystal chemistry of whitlockite and merrillite and the dehydrogenation of whitlockite to merrillite. Am. Mineral. 2008, 93, 1300–1305. [Google Scholar] [CrossRef]
  13. Xie, X.; Yang, H.; Gu, X.; Downs, R.T. Chemical composition and crystal structure of merrillite from the Suizhou meteorite. Am. Mineral. 2015, 100, 2753–2756. [Google Scholar] [CrossRef]
  14. El Khouri, A.; Elaatmani, M.; Della Ventura, G.; Sodo, A.; Rizzi, R.; Rossi, M.; Capitelli, F. Synthesis, structure refinement and vibrational spectroscopy of new rare-earth tricalcium phosphates Ca9RE(PO4)7 (RE = La, Pr, Nd, Eu, Gd, Dy, Tm, Yb). Ceram. Int. 2017, 43, 15645–15653. [Google Scholar] [CrossRef]
  15. Capitelli, F.; Rossi, M.; El Khouri, A.; Elaatmani, M.; Corriero, N.; Sodo, A.; Della Ventura, G. Synthesis, structural model and vibrational spectroscopy of lutetium tricalcium phosphate Ca9Lu(PO4)7. J. Rare Earths 2018, 36, 1162–1168. [Google Scholar] [CrossRef]
  16. Tahiti, A.A.; El Bali, B.; Lachkar, M.; Piniella, J.F.; Capitelli, F. Crystal structure of new lanthanide diphosphates KLnP2O7·2(H2O) (Ln = Gd, Tb, Yb). Z. Kristallogr. 2006, 221, 173–177. [Google Scholar] [CrossRef]
  17. Capitelli, F.; El Bali, B.; Essehli, R.; Lachkar, M.; Da Silva, I. New hybrid diphosphates Ln2(NH2(CH2)2NH2)2(HP2O7)2⋅4H2O [Ln = Eu, Tb, Er]: Synthesis, single crystal and powder X-ray crystal structure. Z. Kristallogr. 2006, 221, 788–794. [Google Scholar] [CrossRef]
  18. Matsunaga, K.; Kubota, T.; Toyoura, K.; Nakamura, A. First-principles calculations of divalent substitution of Ca(2+) in tricalcium phosphates. Acta Biomater. 2015, 23, 329–337. [Google Scholar] [CrossRef]
  19. Mayer, I.; Cohen, S.; Gdalya, S.; Burghaus, O.; Reinen, D. Crystal structure and EPR study of Mn-doped β-tricalcium phosphate. Mater. Res. Bull. 2008, 43, 447–452. [Google Scholar] [CrossRef]
  20. Belik, A.A.; Izumi, F.; Stefanovich, S.Yu.; Lazoryak, B.I.; Oikawa, K. Chemical and structural properties of a whitlockite-like phosphate, Ca9FeD(PO4)7. Chem. Mater. 2002, 14, 987–995. [Google Scholar] [CrossRef]
  21. Belik, A.A.; Morozov, V.A.; Khasanov, S.S.; Lazoryak, B.I. Crystal structures of new double calcium and cobalt phosphates. Mater. Res. Bull. 1998, 33, 987–995. [Google Scholar] [CrossRef]
  22. Lazoryak, B.I.; Khan, N.; Morozov, V.A.; Belik, A.A.; Khasanov, S.S. Preparation, structure determination, and redox characteristics of new calcium copper phosphates. J. Solid State Chem. 1999, 145, 345–355. [Google Scholar] [CrossRef]
  23. Zhu, G.; Ci, Z.; Shi, Y.; Que, M.; Wang, Q.; Wang, Y. Synthesis, crystal structure and luminescence characteristics of a novel red phosphor Ca19Mg2(PO4)14:Eu3+ for light emitting diodes and field emission displays. J. Mater. Chem. C 2013, 1, 5960–5969. [Google Scholar] [CrossRef]
  24. Bohner, M.; Tiainen, H.; Michel, P.; Döbelin, N. Design of an inorganic dual-paste apatite cement using cation exchange. J. Mater. Sci. Mater. Med. 2015, 26, 1–13. [Google Scholar] [CrossRef] [PubMed]
  25. El Bali, B.; Boukhari, A.; Holt, E.M.; Aride, J. Calcium nickel orthophosphate: Crystal structure of Ca8.5Ni9.5(PO4)12. Z. Kristallogr. 1995, 210, 838–842. [Google Scholar] [CrossRef]
  26. Lii, K.-H.; Shih, P.-F.; Chen, T.-M. AM3(P2O7)2 (A = alkaline-earth metals; M = Fe, Co, Ni): diphosphates containing infinite chains of edge-sharing MO6 octahedra. Inorg. Chem. 1993, 32, 4373–4377. [Google Scholar] [CrossRef]
  27. Funke, M.; Blum, M.; Glaum, R.; El Bali, B. Beiträge zum Koordinationsverhalten von Oxidionen in anorganischen Feststoffen. IV [1] Darstellung, Kristallstruktur und spektroskopische Charakterisierung von NiP4O11 und CaNiP2O7. Z. Anorg. Chem. 2004, 630, 1040–1047. [Google Scholar] [CrossRef]
  28. Capitelli, F.; Harcharras, M.; Assaaoudi, H.; Ennaciri, A.; Moliterni, A.G.G.; Bertolasi, V. Crystal structure of new hexahydrate dicobalt pyrophosphate Co2P2O7·6H2O: Comparison with Co2P2O7·2H2O, α-, β- and γ- Co2P2O7. Z. Kristallogr. 2003, 218, 345–350. [Google Scholar] [CrossRef]
  29. Capitelli, F.; Chita, G.; Ghiara, M.R.; Rossi, M. Crystal chemical investigation of Fe3(PO4)2∙8H2O vivianite minerals. Z. Kristallogr. 2012, 227, 92–101. [Google Scholar] [CrossRef]
  30. Rossi, M.; Ghiara, M.R.; Chita, G.; Capitelli, F. Crystal-chemical and structural characterization of fluorapatites in ejecta from Somma-Vesuvius volcanic complex. Am. Mineral. 2011, 96, 1828–1837. [Google Scholar] [CrossRef]
  31. Dorozkhin, S.V. Calcium Orthophosphates: Occurrence, properties and major applications. Bioceram. Dev. Appl. 2014, 4. [Google Scholar] [CrossRef]
  32. Belik, A.A.; Yanov, O.V.; Lazoryak, B.I. Synthesis and crystal structure of Ca9Cu1.5(PO4)7 and reinvestigation of Ca9.5Cu(PO4)7. Mater. Res. Bull. 2001, 36, 1863–1871. [Google Scholar] [CrossRef]
  33. Rietveld, H.M. A profile refinement method for nuclear and magnetic structures. J. Appl. Cryst. 1969, 2, 65–71. [Google Scholar] [CrossRef]
  34. Altomare, A.; Cuocci, C.; Giacovazzo, C.; Moliterni, A.; Rizzi, R.; Corriero, N.; Falcicchio, A. EXPO2013: A kit of tools for phasing crystal structures from powder data. J. Appl. Cryst. 2013, 46, 1231–1235. [Google Scholar] [CrossRef]
  35. Horiba Jobin, Y. DAS6 Fluorescence Decay Analysis Software User Guide: Version 2744.F.; Edison: New Jersey, NJ, USA, 2008; pp. 29–31. [Google Scholar]
  36. Yashima, M.; Sakai, A.; Kamiyama, T.; Hoshikawa, A. Crystal structure analysis of β-tricalcium phosphate Ca3(PO4)2 by neutron powder diffraction. J. Solid State Chem. 2003, 175, 272–277. [Google Scholar] [CrossRef]
  37. Sakae, T.; Yamamoto, H.; Mishima, H.; Matsumoto, T.; Kozawa, Y. Morphology and chemical composition of dental calculi mainly composed of whitlockite. Scanning Microsc. 1989, 3, 855–860. [Google Scholar]
  38. Fadeeva, I.V.; Gafurov, M.R.; Filippov, Y.Y.; Davydova, G.A.; Savintseva, I.V.; Fomin, A.S.; Petrakova, N.V.; Antonova, O.S.; Akhmetov, L.I.; Gabbasov, B.F.; et al. Copper-substituted tricalcium phosphates. Dokl. Chem. 2016, 471, 384–387. [Google Scholar] [CrossRef]
  39. Altomare, A.; Campi, G.; Cuocci, C.; Eriksson, L.; Giacovazzo, C.; Moliterni, A.; Rizzi, R.; Werner, P.-E. Advances in powder diffraction pattern indexing: N-TREOR09. J. Appl. Cryst. 2009, 42, 768–775. [Google Scholar] [CrossRef]
  40. Groom, C.R.; Bruno, I.J.; Lightfoot, M.P.; Ward, S.C. The Cambridge Structural Database. Acta Cryst. B 2016, 72, 171–179. [Google Scholar] [CrossRef]
  41. Inorganic Crystal Structure Database (ICSD); Version 2018–2; Fachinformationszentrum: Karlsruhe, Germany, 2018.
  42. Henning, P.A.; Adolfsson, E.; Grins, J. The Chalcogenide Phosphate Apatites Ca10(PO4)6S, Sr10(PO4)6S, Ba10(PO4)6S and Ca10(PO4)6Se. Z. Kristallogr. 2000, 215, 226–230. [Google Scholar] [CrossRef]
  43. Mayer, I.; Gdalya, S.; Burghaus, O.; Reinen, D. A spectroscopic and structural study of M(3d)2+-doped β-tricalcium phosphate—The binding properties of Ni2+ and Cu2+ in the pseudo-octahedral Ca(5)O6 host-sites. Z. Anorg. Chem. 2009, 635, 2039–2045. [Google Scholar] [CrossRef]
  44. Altomare, A.; Corriero, N.; Cuocci, C.; Falcicchio, A.; Moliterni, A.; Rizzi, R. OChemDb: The free on-line Open Chemistry Database portal for searching and analysing crystal structure information. J. Appl. Cryst. 2018, 51, 1229–1236. [Google Scholar] [CrossRef]
  45. Shannon, R.D. Revised effective ionic radii and systematic studies of interatomic distances in halides and chalcogenides. Acta Crystallogr. A 1976, 32, 751–767. [Google Scholar] [CrossRef]
  46. Yin, X.; Stott, M.J.; Rubio, A. α and β-tricalcium phosphate: A density functional study. Phys. Rev. B 2003, 68, 205205. [Google Scholar] [CrossRef]
  47. Zatovsky, I.V.; Strutynska, N.Y.; Baumer, V.N.; Shishkin, O.V.; Slobodyanik, N.S. The whitlockite-related phosphate Ca9Cr(PO4)7. Acta Crystallogr. E 2007, 63, i180–i181. [Google Scholar] [CrossRef]
  48. Lazoryak, B.I.; Morozov, V.A.; Belik, A.A.; Khasanov, S.S.; Shekhtman, V.S. Crystal structures and characterization of Ca9Fe(PO4)7and Ca9FeH0.9(PO4)7. J. Solid State Chem. 1996, 122, 15–21. [Google Scholar] [CrossRef]
  49. De Aza, P.N.; Guitián, F.; Santos, C.; De Aza, S.; Cuscó, R.; Artús, L. Vibrational Properties of Calcium Phosphate Compounds. 2. Comparison between Hydroxyapatite and β-Tricalcium Phosphate. Chem. Mater. 1997, 9, 916–922. [Google Scholar] [CrossRef]
  50. Jillavenkatesa, A.; Condrate, R.A., Sr. The Infrared and Raman Spectra of α- and β-Tricalcium Phosphate (Ca3(PO4)2). Spectrosc. Lett. 1998, 31, 1619–1634. [Google Scholar] [CrossRef]
  51. Ross, S.D. Phosphates and Other Oxy-Anions of Group V. In Mineralogical Society Monograph 4: The Infrared Spectra of Minerals; Farmer, V.C., Ed.; Mineralogical Society of Great Britain and Ireland: London, UK, 1974. [Google Scholar]
  52. Meejoo, S.; Maneeprakorn, W.; Winotai, P. Phase and thermal stability of nanocrystalline hydroxyapatite prepared via microwave heating. Thermochim. Acta 2006, 447, 115–120. [Google Scholar] [CrossRef]
  53. Strens, R.G.J. The Common Chain, Ribbon, and Ring Silicates. In Mineralogical Society Monograph 4: The Infrared Spectra of Minerals; Farmer, V.C., Ed.; Mineralogical Society of Great Britain and Ireland: London, UK, 1974. [Google Scholar]
  54. Aguilar, G.M.; Osendi, M.I. Fluorescence of Mn2+ in CaCO3. J. Lumin. 1982, 27, 365–375. [Google Scholar] [CrossRef]
  55. Flores, J.M.C.; Caldino, G.U.; Hernández, A.J.; Camarillo, G.E.; Cabrera, B.E.; Del Castillo, H.; Speghini, A.; Bettinelli, M.; Murrieta, S.H. Study of Mn2+ luminescence in Zn(PO3)2 glasses. Phys. Status Solidi C 2007, 4, 922–925. [Google Scholar] [CrossRef]
  56. Wanmaker, W.L.; Bakker, C. Luminescence of Copper-Activated Calcium and Strontium Orthophosphates. J. Electrochem. Soc. 1959, 106, 1027–1032. [Google Scholar] [CrossRef]
  57. Verwey, J.W.M.; Coronado, J.M.; Blasse, G. The luminescence of Cu(I) in strontium tetraborate. J. Solid State Chem. 1991, 92, 531–536. [Google Scholar] [CrossRef]
  58. Boutinaud, P.; Duloisy, E.; Pedrini, C.; Moine, B.; Parent, C.; Le Flem, G. Fluorescence properties of Cu+ ion in phosphate glasses of the BaLiPO4-P2O5 system. J. Solid State Chem. 1991, 94, 236–243. [Google Scholar] [CrossRef]
Figure 1. SEM micrographs of: (a) Aggregates of Mn-TCP crystals with compact and porous aggregates; (b) detail of aggregates of Mn-TCP; (c) morphology of microcrystals of Ni-TCP with detail of irregular aggregates; (d) particular of subspherical microcrystals of Ni-TCP with detail of growth layers and cavities between the crystals; (e) irregular aggregates of Cu-TCP; (f) aggregates of Cu-TCP composed of rounded crystals with detail of the cavities.
Crystals 09 00288 g001
Figure 2. Rietveld plot of Ni β–TCP phase: Observed diffraction profile (blue line), calculated profile (red line), and difference profile (violet line).
Crystals 09 00288 g002
Figure 3. Coordination environments around the M1–M5 cationic sites in Me β–TCP.
Crystals 09 00288 g003
Figure 4. Bond lengths investigation within inorganic structures performed via open chemistry database (OChemDb) [43] for Mn–O, Ni–O, and Cu–O distances.
Crystals 09 00288 g004
Figure 5. Framework of Me β-TCP structure: Detail of the ‘A’ and ‘B’ arrays (a) and view down c (b).
Crystals 09 00288 g005
Figure 6. ‘A’ array in Me β-TCP structure: details of sharing vertices of P1O4) (a); M4O3 (b); and M5O6 (c) with polyhedra from ‘B’ array.
Crystals 09 00288 g006
Figure 7. FTIR spectra in the wavenumber range (2000–400 cm−1) of Me2+ β–TCP studied compounds in comparison with pure β–TCP [15].
Crystals 09 00288 g007
Figure 8. Mn β-TCP structure: Emission/excitation spectra (a) and decay time (b).
Crystals 09 00288 g008
Figure 9. Cu β-TCP structure: Emission/excitation spectra (a) and decay time (b).
Crystals 09 00288 g009
Table 1. Main acquisition and structure refinement parameters for Me β-Ca3(PO4)2 tricalcium phosphate (β–TCP) (FMLQ = full matrix least squares; Pearson VII [34]).
Crystal FormulaCa2.90Mn0.10(PO4)2Ca2.90Ni0.10(PO4)2Ca2.90Cu0.10(PO4)2
Formula weight363.35363.79364.45
Colorcolorlesscolorlesscolorless
Temperature (K)293293293
Wavelength (Å)1.540561.540561.54056
2θ range; step (deg)8–120°; (0.02)8–120°; (0.02)8–120°; (0.02)
System, space groupRhombohedral, R3cRhombohedral, R3cRhombohedral, R3c
a = b (Å)10.41012(19)10.39447(10)10.40764(8)
c (Å)37.2984(14)37.2901(8)37.3158(6)
V3)3500.52(16)3489.22(9)3500.48(7)
Z; Densitycalc. (Mg·m−3)21; 3.1021; 3.1221; 3.11
Refinement methodFMLQFMLQFMLQ
Profile functionPearson VIIPearson VIIPearson VII
Bragg refl., parameters587; 81587; 79587; 79
Rp; Rwp; Rexp (%)2.93; 4.43; 3.972.56; 4.04; 3.921.85; 2.82; 4.71
RF; RBragg (%)10.34; 16.768.09; 11.275.72; 7.90
Table 2. Semi-quantitative EDS analyses for Ca2.90Me0.10(PO4)2 (Me = Mn, Ni, Cu) samples expressed in wt % (CaO, MeO, P2O5) and atoms per formula unit (Ca, Me, P). Crystal formula is based on five cations.
Mn-TCPNi-TCPCu-TCP
CaO51.8(8)51.7(5)51.1(1)
MeO2.5(1)2.7(3)2.9(2)
P2O545.7(8)45.6(7)45.9(3)
Tot.99.999.999.9
Ca2.872.872.85
Me0.110.110.12
P2.012.012.03
Table 3. Refined fractional atomic coordinates, Wyckoff site, isotropic displacement atomic parameters, and occupancy factors for Ca2.9Ni0.1(PO4)2.
SitexyzUisoOcc
Ca118b0.1435(5)0.2761(5)0.34080.0013(2)1
Ca218b0.2837(4)0.1296(6)0.4739(1)0.0035(2)1
Ca318b0.4813(4)0.5450(4)0.4007(1)0.0018(2)1
Ca46a2/31/30.4253(3)0.0090(2)1/2
Ca56a000.4082(2)0.0006(2)0.69(2)
Ni56a000.4082(2)0.0006(2)0.31(2)
P16a2/31/30.5065(2)0.0038(4)1
P218b−0.1945(7)−0.3539(5)0.3755(2)0.0023(4)1
P318b0.1939(6)0.3447(6)0.4404(2)0.0000(4)1
O118b0.4009(12)0.1493(12)0.4165(4)0.0200(4)1
O218b−0.1007(16)−0.4270(18)0.3607(4)0.0087(4)1
O318b0.2886(16)0.2757(17)0.5205(4)0.0165(4)1
O418b−0.0894(19)−0.1789(12)0.3702(4)0.0060(4)1
O518b0.3512(16)0.3964(14)0.4535(4)0.0074(4)1
O618b0.1127(17)0.4287(18)0.4595(4)0.0252(4)1
O718b0.0976(16)0.1752(13)0.4499(4)0.0117(4)1
O818b0.1912(13)0.3686(9)0.3985(3)0.0094(4)1
O918b0.5146(11)0.1948(10)0.4945(5)0.0101(4)1
O106a2/31/30.5490(5)0.0087(4)1
Table 4. Bond distances (Å) and bond valence parameters/sum (BVP/BVS, expressed in valence units = v.u.) within Ca2.90Me0.10(PO4)2 (Me = Mn, Ni, Cu) samples. BVP/BVS values for M5 site calculated according to the single cationic occupancies of the M5 site: Mn = 0.32(3)%, Ni = 0.31(2)%, Cu = 0.33(1)%.
Mn-TCPNi-TCPCu-TCP
BondDistanceBVPBVSDistanceBVPBVSDistanceBVPBVS
M1-O82.331(12)0.37 2.309(10)0.4 2.383(9)0.33
M1-O92.434(19)0.28 2.455(9)0.27 2.477(13)0.25
M1-O42.48(2)0.25 2.478(14)0.25 2.489(17)0.24
M1-O42.386(19)0.322.352.411(18)0.32.332.481(12)0.252.06
M1-O52.420(17)0.29 2.435(17)0.28 2.457(12)0.27
M1-O32.430(15)0.29 2.45(2)0.27 2.479(11)0.25
M1-O62.255(16)0.46 2.249(18)0.47 2.313(11)0.39
<M1-O>2.39 2.4 2.44
M2-O72.39(2)0.32 2.385(19)0.32 2.343(9)0.36
M2-O72.47(2)0.26 2.430(12)0.28 2.434(16)0.28
M2-O92.287(19)0.42 2.276(13)0.43 2.355(11)0.35
M2-O52.661(16)0.152.342.612(16)0.182.402.672(15)0.152.18
M2-O32.322(15)0.38 2.290(17)0.42 2.349(14)0.36
M2-O22.311(17)0.39 2.348(16)0.36 2.441(13)0.28
M2-O12.435(18)0.28 2.422(14)0.29 2.418(12)0.29
M2-O62.706(14)0.14 2.76(2)0.12 2.803(16)0.1
<M2-O>2.45 2.44 2.48
M3-O82.505(11)0.23 2.503(9)0.24 2.503(11)0.24
M3-O82.643(17)0.16 2.634(12)0.17 2.614(15)0.17
M3-O102.542(7)0.21 2.526(7)0.22 2.529(5)0.22
M3-O52.411(19)0.31.832.451(15)0.271.862.414(14)0.31.85
M3-O32.36(2)0.35 2.349(15)0.36 2.371(15)0.34
M3-O22.526(16)0.22 2.535(18)0.22 2.561(11)0.2
M3-O12.618(17)0.17 2.609(14)0.18 2.659(13)0.15
M3-O62.594(18)0.18 2.534(15)0.22 2.514(12)0.23
<M3-O>2.53 2.52 2.52
M4-O12.431(14)0.29 2.472(12)0.26 2.524(11)0.22
M4-O12.431(14)0.290.862.472(12)0.260.762.524(11)0.220.67
M4-O12.431(14)0.29 2.472(12)0.26 2.524(11)0.22
<M4-O>2.43 2.47 2.52
M5-O72.194(19)0.47 2.217(17)0.42 2.296(13)0.36
M5-O42.18(2)0.482.852.144(16)0.522.822.165(14)0.452.43
M5-O42.18(2)0.48 2.144(16)0.52 2.165(14)0.45
<M5-O>2.19 2.18 2.23
P1-O101.52(2)1.28 1.58(2)1.09 1.562(15)1.16
P1-O91.589(15)1.08 1.580(11)1.1 1.509(12)1.34
P1-O91.589(15)1.084.511.580(11)1.114.411.509(12)1.345.17
P1-O91.589(15)1.08 1.580(11)1.1 1.509(12)1.34
<P1-O>1.57 1.58 1.52
P2-O41.606(16)1.03 1.598(11)1.05 1.536(10)1.25
P2-O31.61(2)1.03 1.637(18)0.95 1.571(14)1.13
P2-O21.663(18)0.883.861.60(2)1.044.021.514(18)1.324.84
P2-O11.644(18)0.92 1.625(14)0.98 1.571(13)1.14
<P2-O>1.63 1.62 1.62
P3-O71.562(16)1.16 1.571(13)1.13 1.544(16)1.21
P3-O81.562(14)1.17 1.583(12)1.1 1.521(10)1.29
P3-O51.56(2)1.164.531.524(17)1.294.231.481(12)1.445.05
P3-O61.60(2)1.05 1.65(2)0.92 1.581(12)1.1
<P3-O>1.57 1.58 1.53
Table 5. Measured absorption in the FTIR spectra and relative assignments for Ca2.90Me0.10(PO4)2 (Me = Mn, Ni, Cu) in comparison with data for pure β-TCP [15].
Mn-TCPNi-TCPCu-TCPβ-TCP
1121111911211118ν3 (P-O)
1096109610981098
1081108110811080
1063106210621064
1043104410411042
1021102310241022
1005100510051007
965
945
933
966
957
940
924
969
957
945
933
969
943
ν1 (P-O)
610
603
589
579
554
546
609
602
590
580
547
609
604
590
580
546
610
606
591
579
552
544
ν4 (P-O) O-P-O

