Calcium Carbonate Mineralization in a Surface-Tension-Confined Droplets Array

1
Materials Genome Institute, Shanghai University, Shanghai 200444, China
2
Key Laboratory of Biorheological Science and Technology of the Ministry of Education, College of Bioengineering, Chongqing University, Chongqing 400044, China
3
College of Science, Shanghai University, Shanghai 200444, China
4
Nano Science and Technology Program, Hong Kong University of Science and Technology, Clear Water Bay, Kowloon, Hong Kong, China
*
Authors to whom correspondence should be addressed.
Crystals 2019, 9(6), 284; https://doi.org/10.3390/cryst9060284
Submission received: 2 April 2019
/
Revised: 24 May 2019
/
Accepted: 29 May 2019
/
Published: 30 May 2019
(This article belongs to the Special Issue Biological Crystallization)
Abstract
:Calcium carbonate biomimetic crystallization remains a topic of interest with respect to biomineralization areas in recent research. It is not easy to conduct high-throughput experiments with only a few macromolecule reagents using conventional experimental methods. However, the emergence of microdroplet array technology provides the possibility to solve these issues efficiently. In this article, surface-tension-confined droplet arrays were used to fabricate calcium carbonate. It was found that calcium carbonate crystallization can be conducted in surface-tension-confined droplets. Defects were found on the surface of some crystals, which were caused by liquid flow inside the droplet and the rapid drop in droplet height during the evaporation. The diameter and number of crystals were related to the droplet diameter. Polyacrylic acid (PAA), added as a modified organic molecule control, changed the CaCO3 morphology from calcite to vaterite. The material products of the above experiments were compared with bulk-synthesized calcium carbonate by scanning electron microscopy (SEM), Raman spectroscopy and other characterization methods. Our work proves the possibility of performing biomimetic crystallization and biomineralization experiments on surface-tension-confined microdroplet arrays.
1. Introduction
The inorganic-organic advanced hybrid materials formed by the biomineralization process have excellent physical and chemical properties, such as good wear resistance and extremely high fracture toughness and strength, which are unmatched by those of synthetic materials [1,2,3]. Calcium carbonate (CaCO3) is one of the most abundant biominerals in nature [4,5,6,7]. The preparation of highly regulated CaCO3 with fine structures under ambient conditions has attracted much attention [8,9,10]. Biomineralized calcium carbonate products have good biocompatibility and can be used not only as structural support for organisms [2] but also as biosensors [11], controlled released drug carriers [12,13], and so on. Nucleation and template effects in the context of CaCO3 synthesis and crystalline phase changes have been studied for years [14,15]. During the biomineralization process, both the water-soluble fraction and the insoluble matrix of organic materials are considered to play essential roles [16]. Researchers have been able to control the morphology, nucleation, growth, and alignment of inorganic particles by using specific templates or macromolecules [17,18] The design and preparation of organic matrices (soluble and insoluble) has become an active area of biomineralization research [19,20]. Interactions between ionic surfactants and water-soluble polymers in aqueous solution have been studied with various techniques for decades [15,21].
However, conventional experiments to study the biomineralization of calcium carbonate are usually carried out in a beaker, which consumes a substantial amount of biomacromolecule reagents and makes it difficult to conduct high-throughput experiments. Some research groups have implemented advances in microfabrication techniques to create microstructure environments in which they can employ multiple strategies to control crystallization [22,23,24]. A reversibly sealed T-junction microfluidic device was fabricated by Yin et al. to investigate the influence of extrapallial (EP) fluid proteins in the polymorph control of crystal formation in mollusc shells [25]. Gong et al.’s research provided a new approach to biomimetic crystallization by using crystal hotels [26]. Zeng et al.’s work demonstrated a microfluidic approach towards the study of the formation and transformation of ACC (amorphous calcium carbonate) by using microfluidic technology [27]. However, these experiments were mainly carried out in microfluidic chips, which constrained the methods of characterization and hindered the use of high-throughput experiments.
In this work, calcium carbonate biomimetic crystallization experiments were conducted on a surface-tension-confined droplet array, which is a facile, controllable and high-throughput method to fabricate droplet arrays with controlled size, geometry and position on a patterned surface. Droplet arrays with different diameters from 50 µm to 700 µm were fabricated and used to carry out CaCO3 crystallization experiments. The diameter and number of the CaCO3 crystals were related to the droplet diameter and crystal surface defects were found on the crystals. In previous reports, some research groups have used ionic surfactant polyacrylic acid (PAA) to change the morphology of CaCO3 crystals [21,28]. The crystallization of CaCO3 particles from aqueous solutions in the absence and presence of PAA was studied in this work. It was found that different concentrations of PAA result in different morphologies of vaterite, such as dumbbells. The material products of the above experiments were compared with bulk-calculated calcium carbonate by scanning electron microscopy (SEM), Raman spectroscopy and other characterization methods.
2. Materials and Methods
2.1. Chemicals and Materials
AZ9260 photoresist and AZ400K developer were purchased from Suzhou Wenhao Microfluidic Technology Co., Ltd. (Suzhou, China). 1H,1H,2H,2H-Perfluorooctyltriethoxysilane (POTS) was obtained from Sigma–Aldrich (USA). Calcium chloride anhydrous and poly acrylic acid (PAA) with an average molecular weight of ca. 2000 were purchased from Aladdin (Shanghai, China). Sodium carbonate and other chemicals were obtained from Sinopharm Chemical Reagent Co., Ltd. (Shanghai, China). Deionized water (18.2 MΩ cm, S30CF, Master Touch, Shanghai, China) was used to prepare aqueous solutions. Silicon wafer substrates were purchased from Ningbo Sibranch International Trading Co., Ltd. (Ningbo, China).
2.2. Fabrication of Surface-Tension-Confined Droplet Arrays
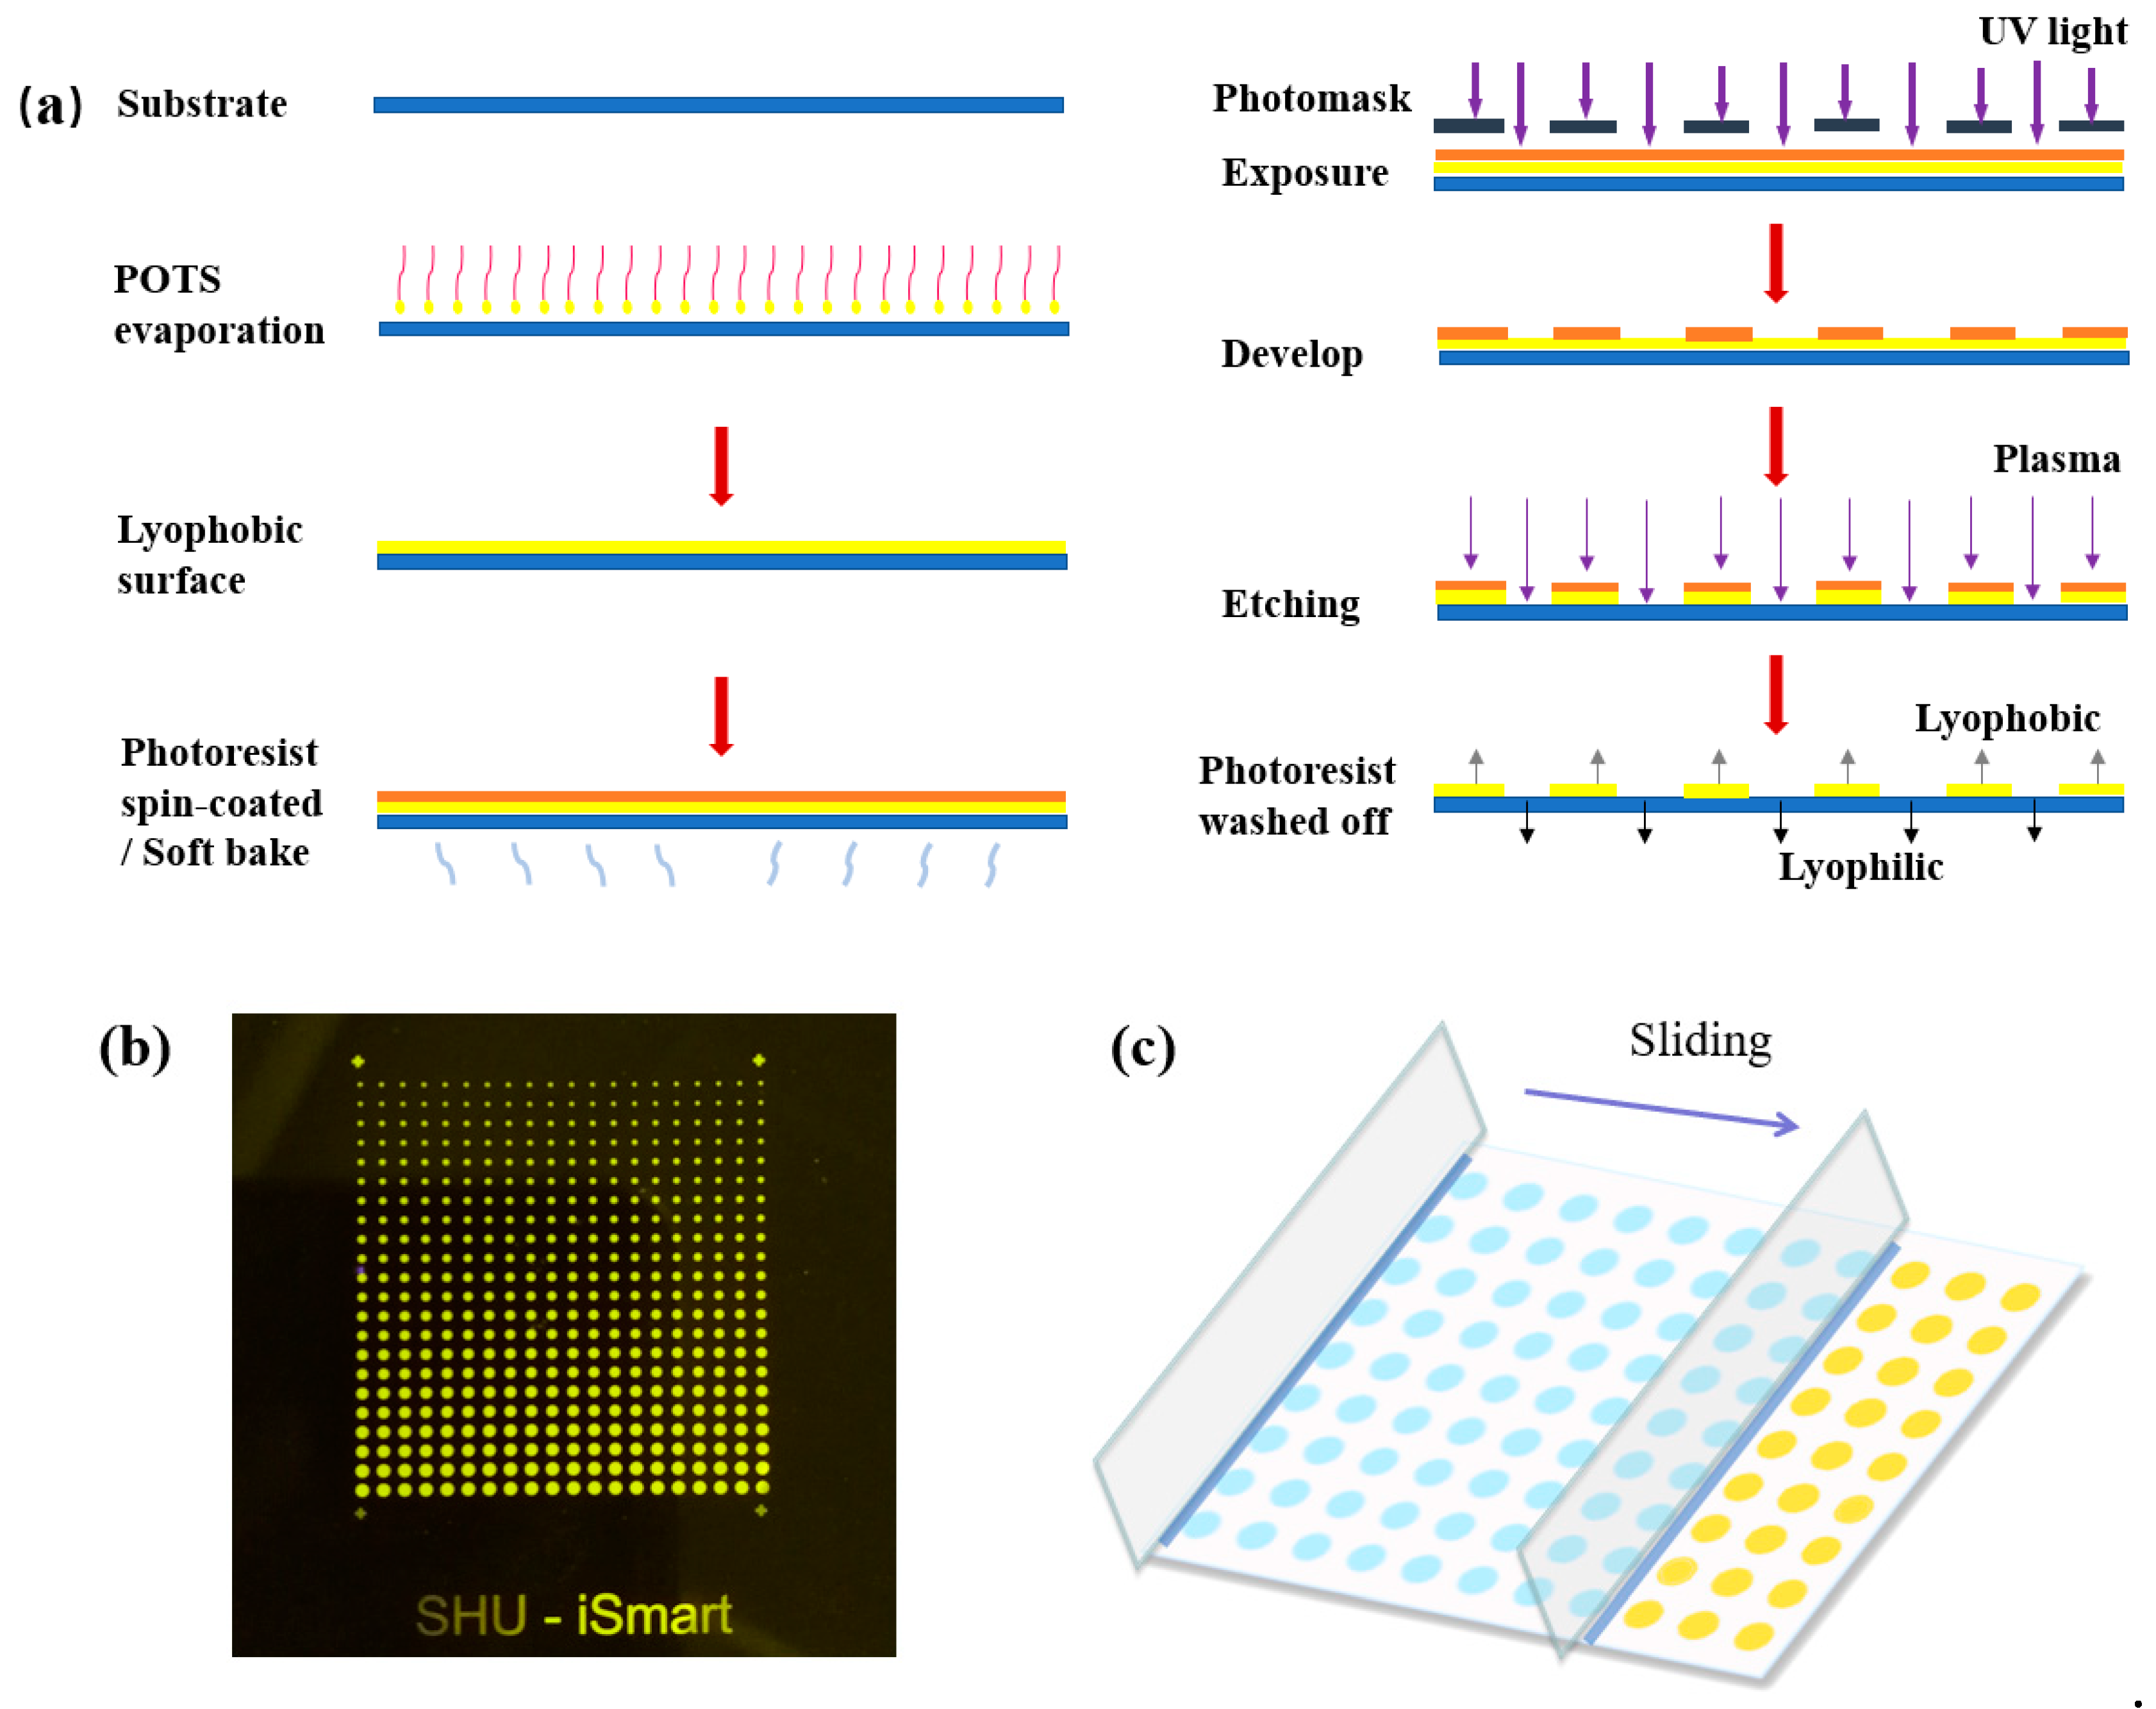
A schematic diagram of STC (surface-tension-confined) technology is shown in Figure 1a. First, nonwettable substrates were fabricated. An air plasma cleaner (PDC-002, Harrick Plasma) was used to clean the glass substrates or silicon wafers, and then the POTS was evaporated onto the substrates at 120 °C for 1 h in an oven (FD115, Binder, Germany). Second, wettable patterns on the nonwettable surface were prepared. AZ9260 photoresist was spin-coated onto the substrate at 500 rpm for 6 s and subsequently at 2400 rpm for 60 s. After that, the coated substrate was baked on a hotplate at a constant temperature of 105 °C for 330 s. After baking, a designed photomask (Figure 1b) was placed on the substrate (several photomasks were designed) which was then exposed it to UV (Ultraviolet) light (MJB4, SUSS MicroTech). Next, the patterned substrate was developed in AZ400K aqueous solution (AZ400K: H2O = 1:2) for 150 s, after which deionized water was used to remove the residual developer. Subsequently, the developed substrate was treated with plasma for two more minutes to make the exposed area selectively wettable. The air plasma not only removed the contamination but also oxidized the exposed surface. Finally, the substrate was washed with acetone and ethyl alcohol to remove the photoresist coating on the silicon wafer. We have published a detailed description of this process [29].
2.3. Fabrication of CaCO3
CaCO3 crystals were formed in small droplets that were generated on the STC chip. Equal volumes (100 µL) of equimolar aqueous solutions of calcium chloride (0.1 M) and sodium carbonate (0.1 M) prepared in deionized water in advance were first mixed on the chip. After setting up the sliding speed and slit height well, we used a piece of glass to slide the solutions from left to the right at a constant speed, as controlled by a custom-designed stepping motor (Figure 1c). Then, a long liquid strip was formed by capillary force. Next, we placed the STC chip into a petri dish in a constant temperature & humidity chamber (LHS-80HC-11, Bluepard, Shanghai, China) at 25 °C and 80% humidity. After 24 h of growth, the device was removed and dried on a 35 °C hot plate for 3 days. In this work, calcium carbonate was fabricated under two conditions, without PAA and with PAA mixed with CaCl2 & Na2CO3. PAA was used at three concentrations: 0.1 mg/mL, 0.2 mg/mL and 0.4 mg/mL.
To compare the material products of the experiment described above with the bulk-synthesized calcium carbonate, a parallel comparison experiment was performed in a beaker. We mixed equal volumes (1 mL) of 0.1 M CaCl2 and 0.1 M Na2CO3 solutions in a beaker in an ultrasonic water bath for 5 min. The remaining steps were performed as in the previous experiment and the conditions were controlled in the same way.
2.4. Characterization
The calcium carbonate crystal morphology was studied by field-emission scanning electron microscopy (FE-SEM, Regulus-8230, Hitachi, Tokyo, Japan) and an optical microscope (LV100ND, Nikon, Tokyo, Japan). Room-temperature Raman spectra were obtained using a standard micro-area Raman system. One droplet in ten was randomly selected for each size of droplet, and the crystals formed in the droplet were observed and counted using an optical microscope. The volumes of the droplets were calculated based on the equation of spherical cap. The process of droplet evaporation was observed under the microscope.
3. Results and Discussions
Calcium carbonate crystals were synthesized using a surface-tension-confined droplet array, and their morphology was changed by adding PAA. In addition, the results were analyzed and compared with that of calcium carbonate synthesized in the bulk phase.
3.1. Microdroplet Diameter Control
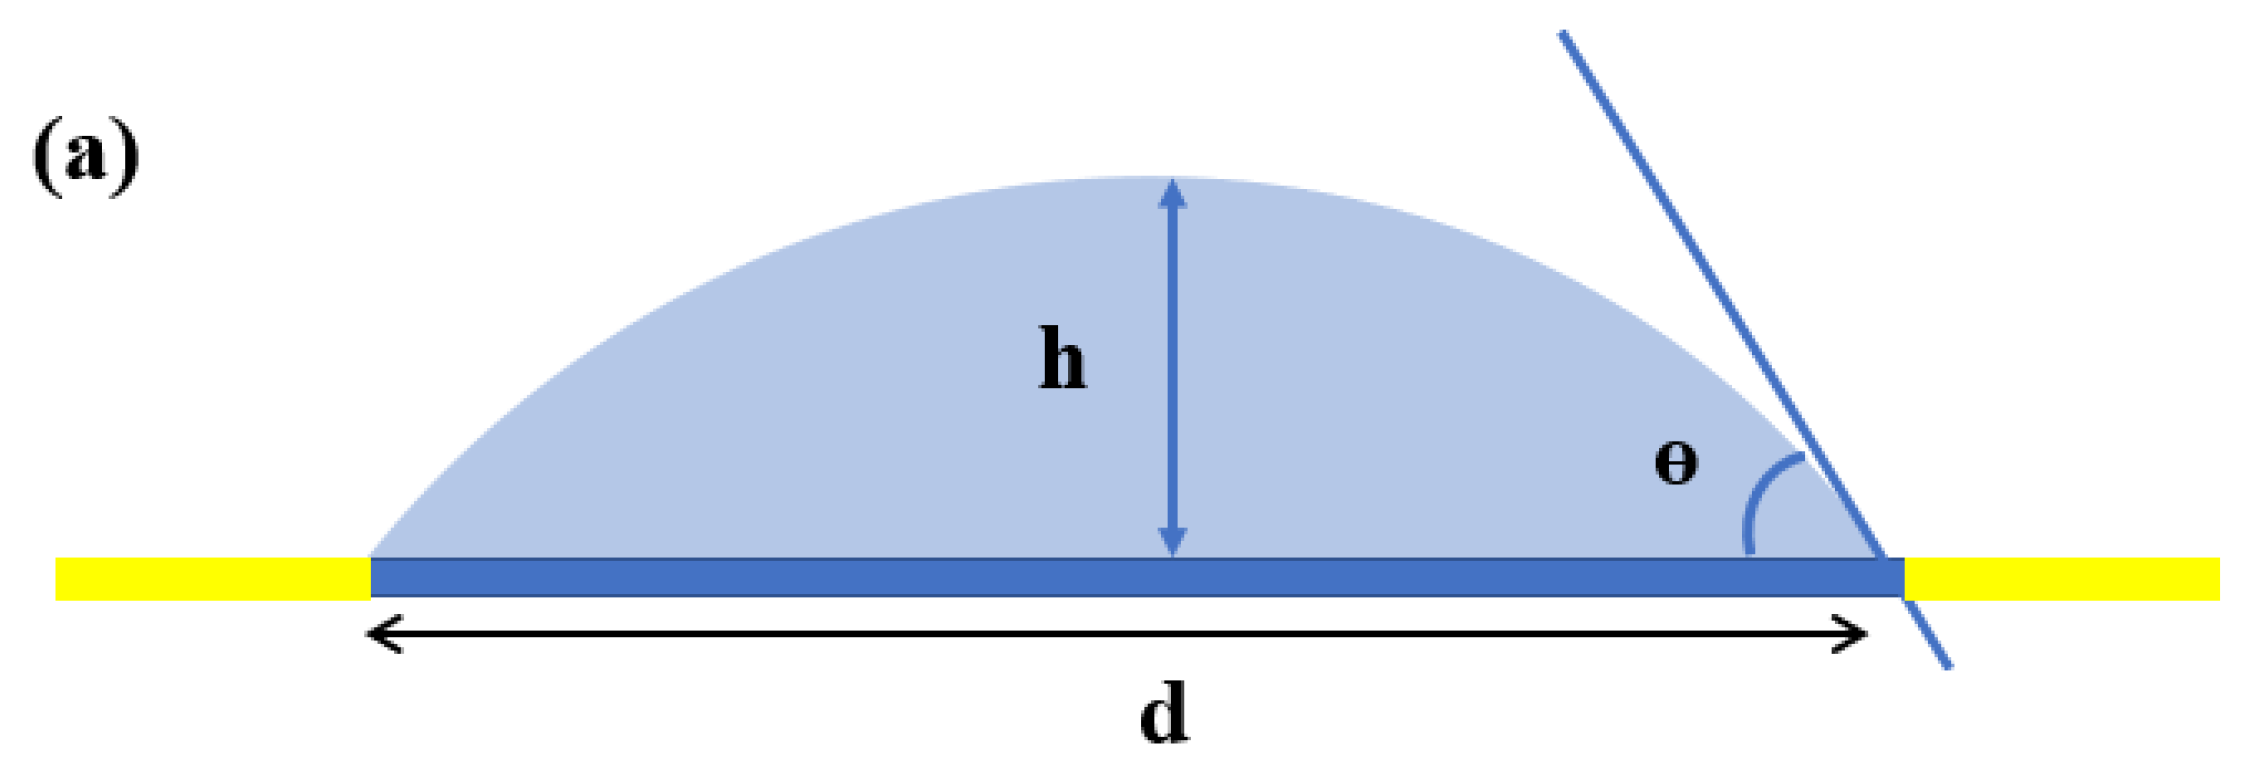
Calcium carbonate was synthesized in droplets with different diameters from 50 µm to 700 µm and observed using an optical microscope. In the surface-tension-confined microdroplets, the relationship between the contact angle and droplet diameter was reported in previous articles [30,31], from which the contact angle data are used in this part. The height and volume of the droplets can be calculated using Equations (1) and (2), respectively, which are based on the geometry of the droplet as a spherical cap. A cross-sectional view of a surface tension-confined droplet can be seen in Figure 2a, where d is the diameter of the droplet, h is the height of the droplet, v is the volumes of the droplet, and θ is the contact angle of the droplet. The relationship between the droplet diameter and liquid volume can be seen in Figure 2b. The volume of the droplet greatly affects the time required for complete evaporation. Figure 2c shows the time required for droplets of different diameters to evaporate completely. The volume of the droplets whose diameters are smaller than 100 µm is less than 200 picoliters. Thus, the solution evaporated less than 5 s-before the crystal growth and no crystals were observed in most of the droplets (more than 80%).
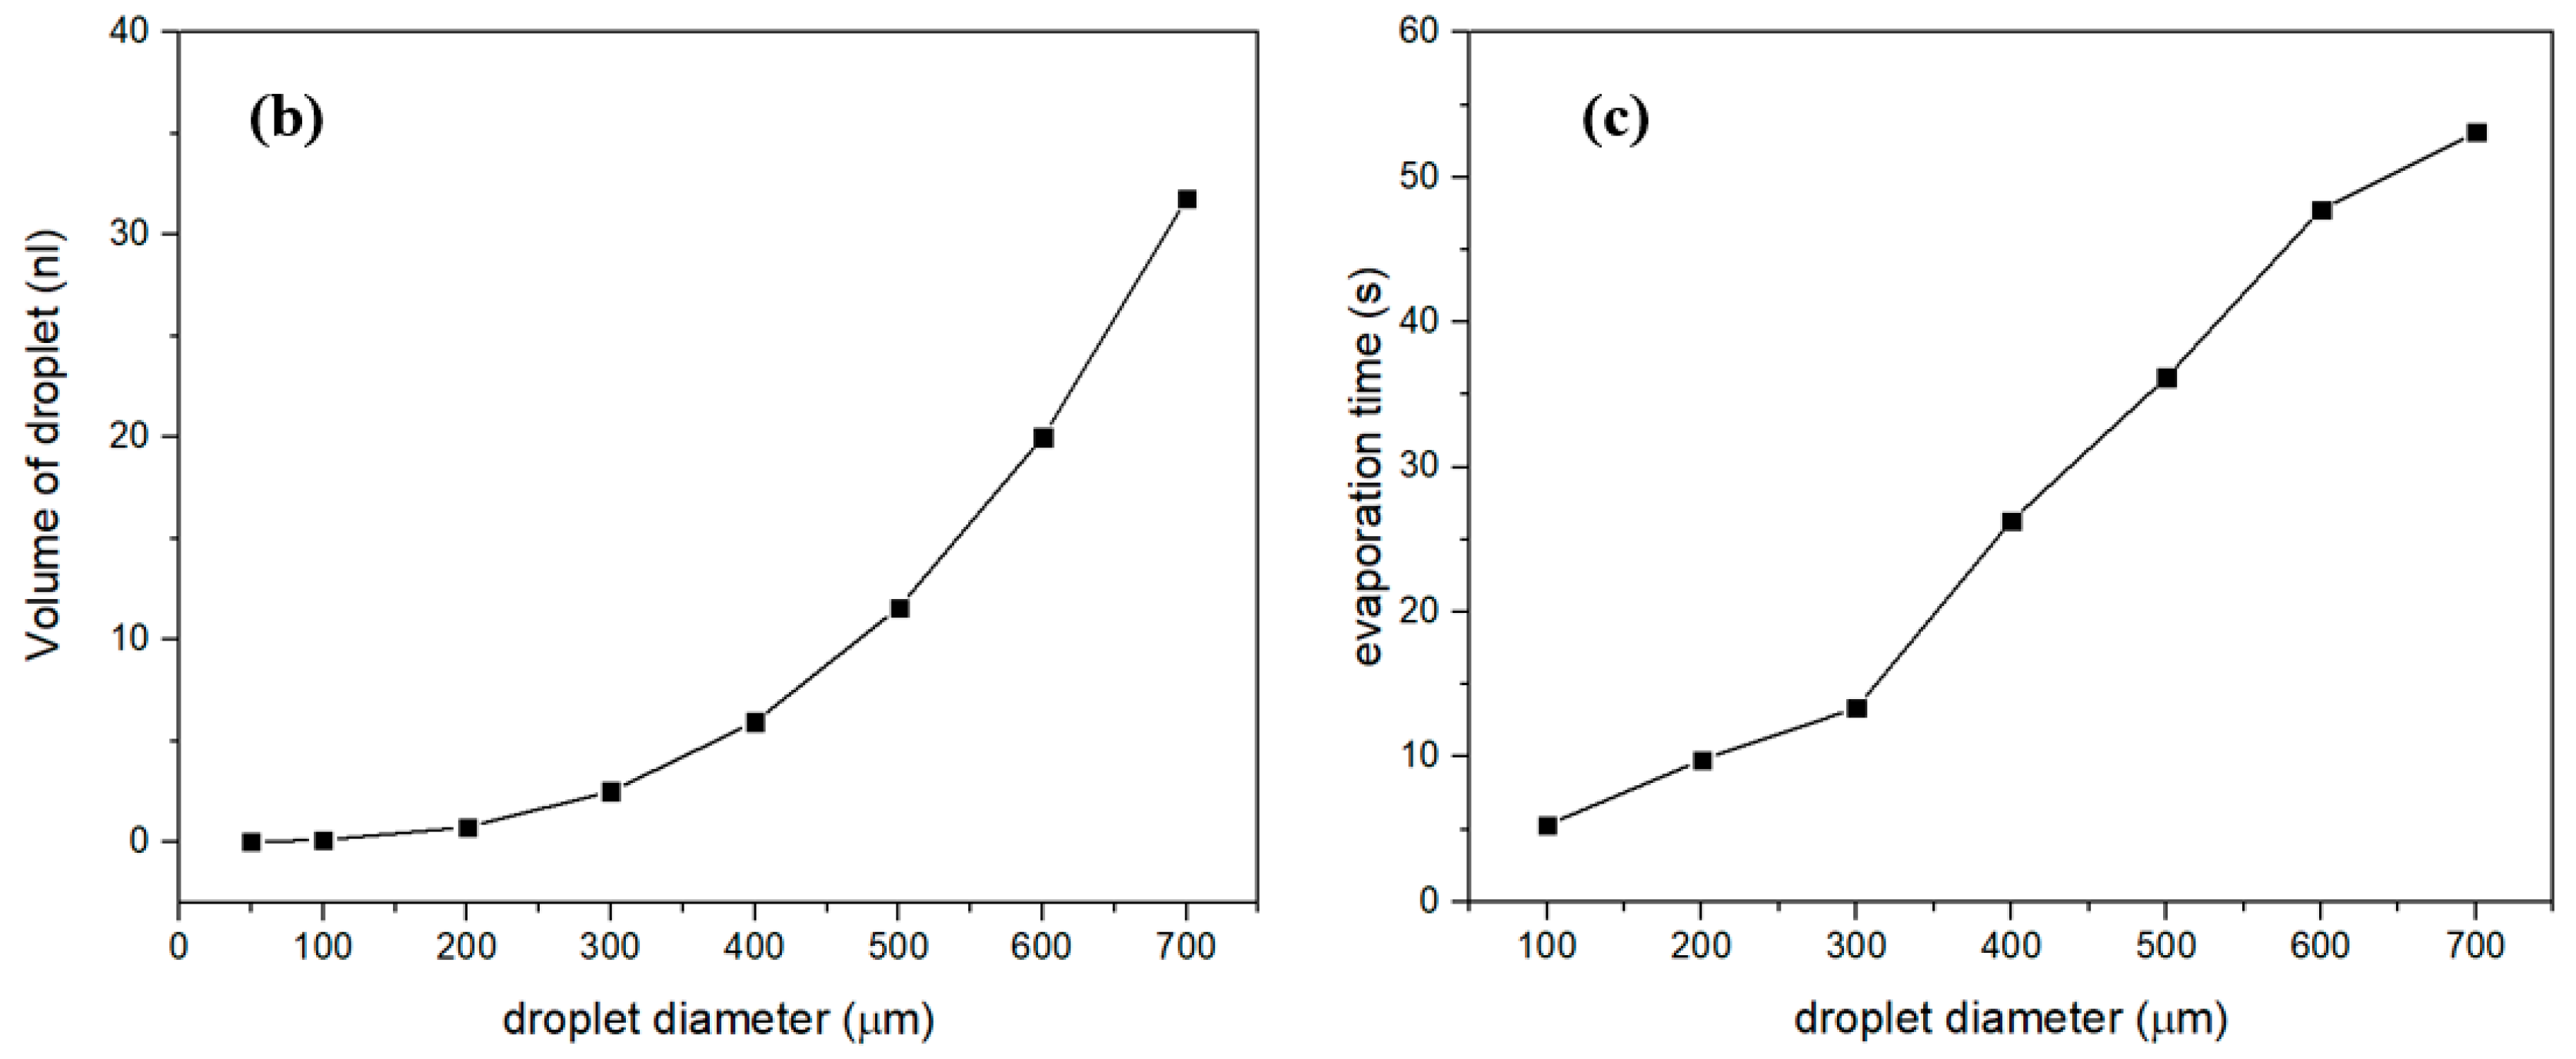
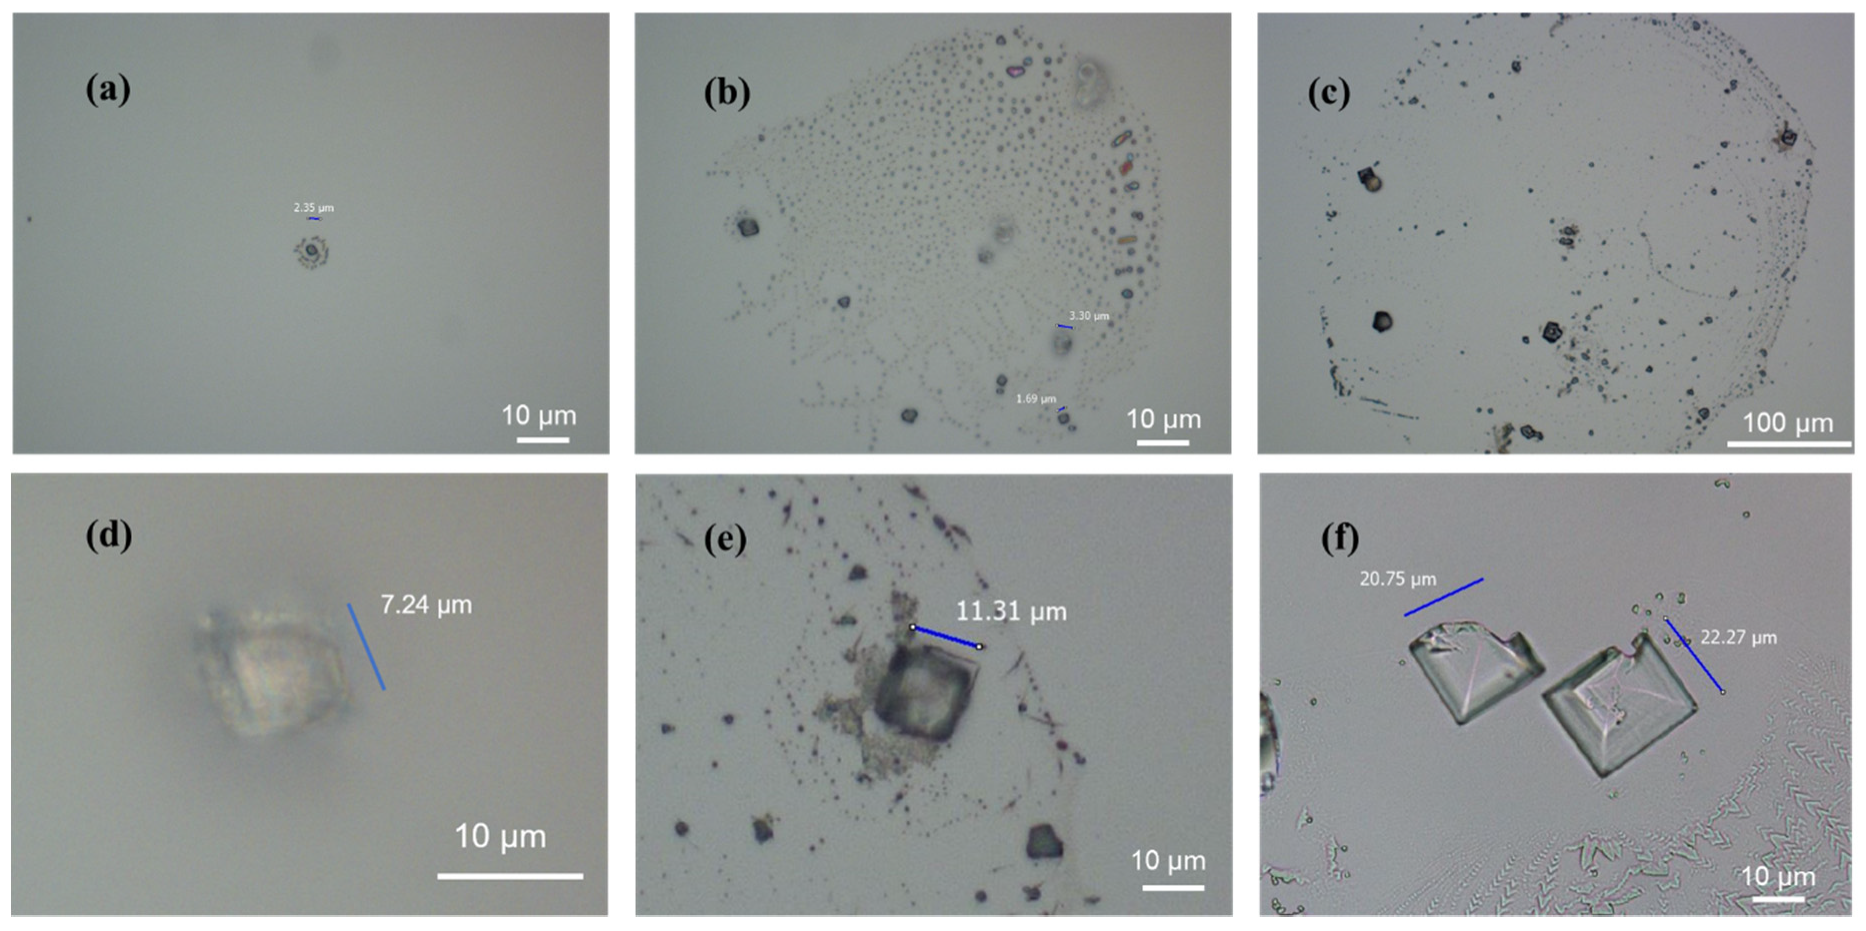
As shown in Figure 3a, only one crystal of calcium carbonate with a size of less than 3 µm was observed in the 50 µm droplets. The CaCO3 crystal was surrounded by amorphous precipitation and sodium chloride particles as a by-product of the reaction. Since the experiment was conducted in droplets on an open platform, all products remained on the surface except for volatile gases. The reaction by-product NaCl precipitates could exist only around the CaCO3 crystal on the substrate after the solution in the droplets volatilized. As shown in Figure 3c, we observed more than 17 crystals of different sizes from 3 µm to 12 µm in a 400 µm droplet. Four crystals of CaCO3 with diameters larger than 10 µm and approximately 10 crystals with diameters of approximately 3 µm were observed. The size of the crystal observed in the droplet was related to the droplet diameter. As shown in Figure 3d, the largest crystal size in a 300 µm diameter droplet is 7.24 µm, and in the image shown in Figure 3f we observed two crystals of over 20 µm in a 700 µm diameter droplet.
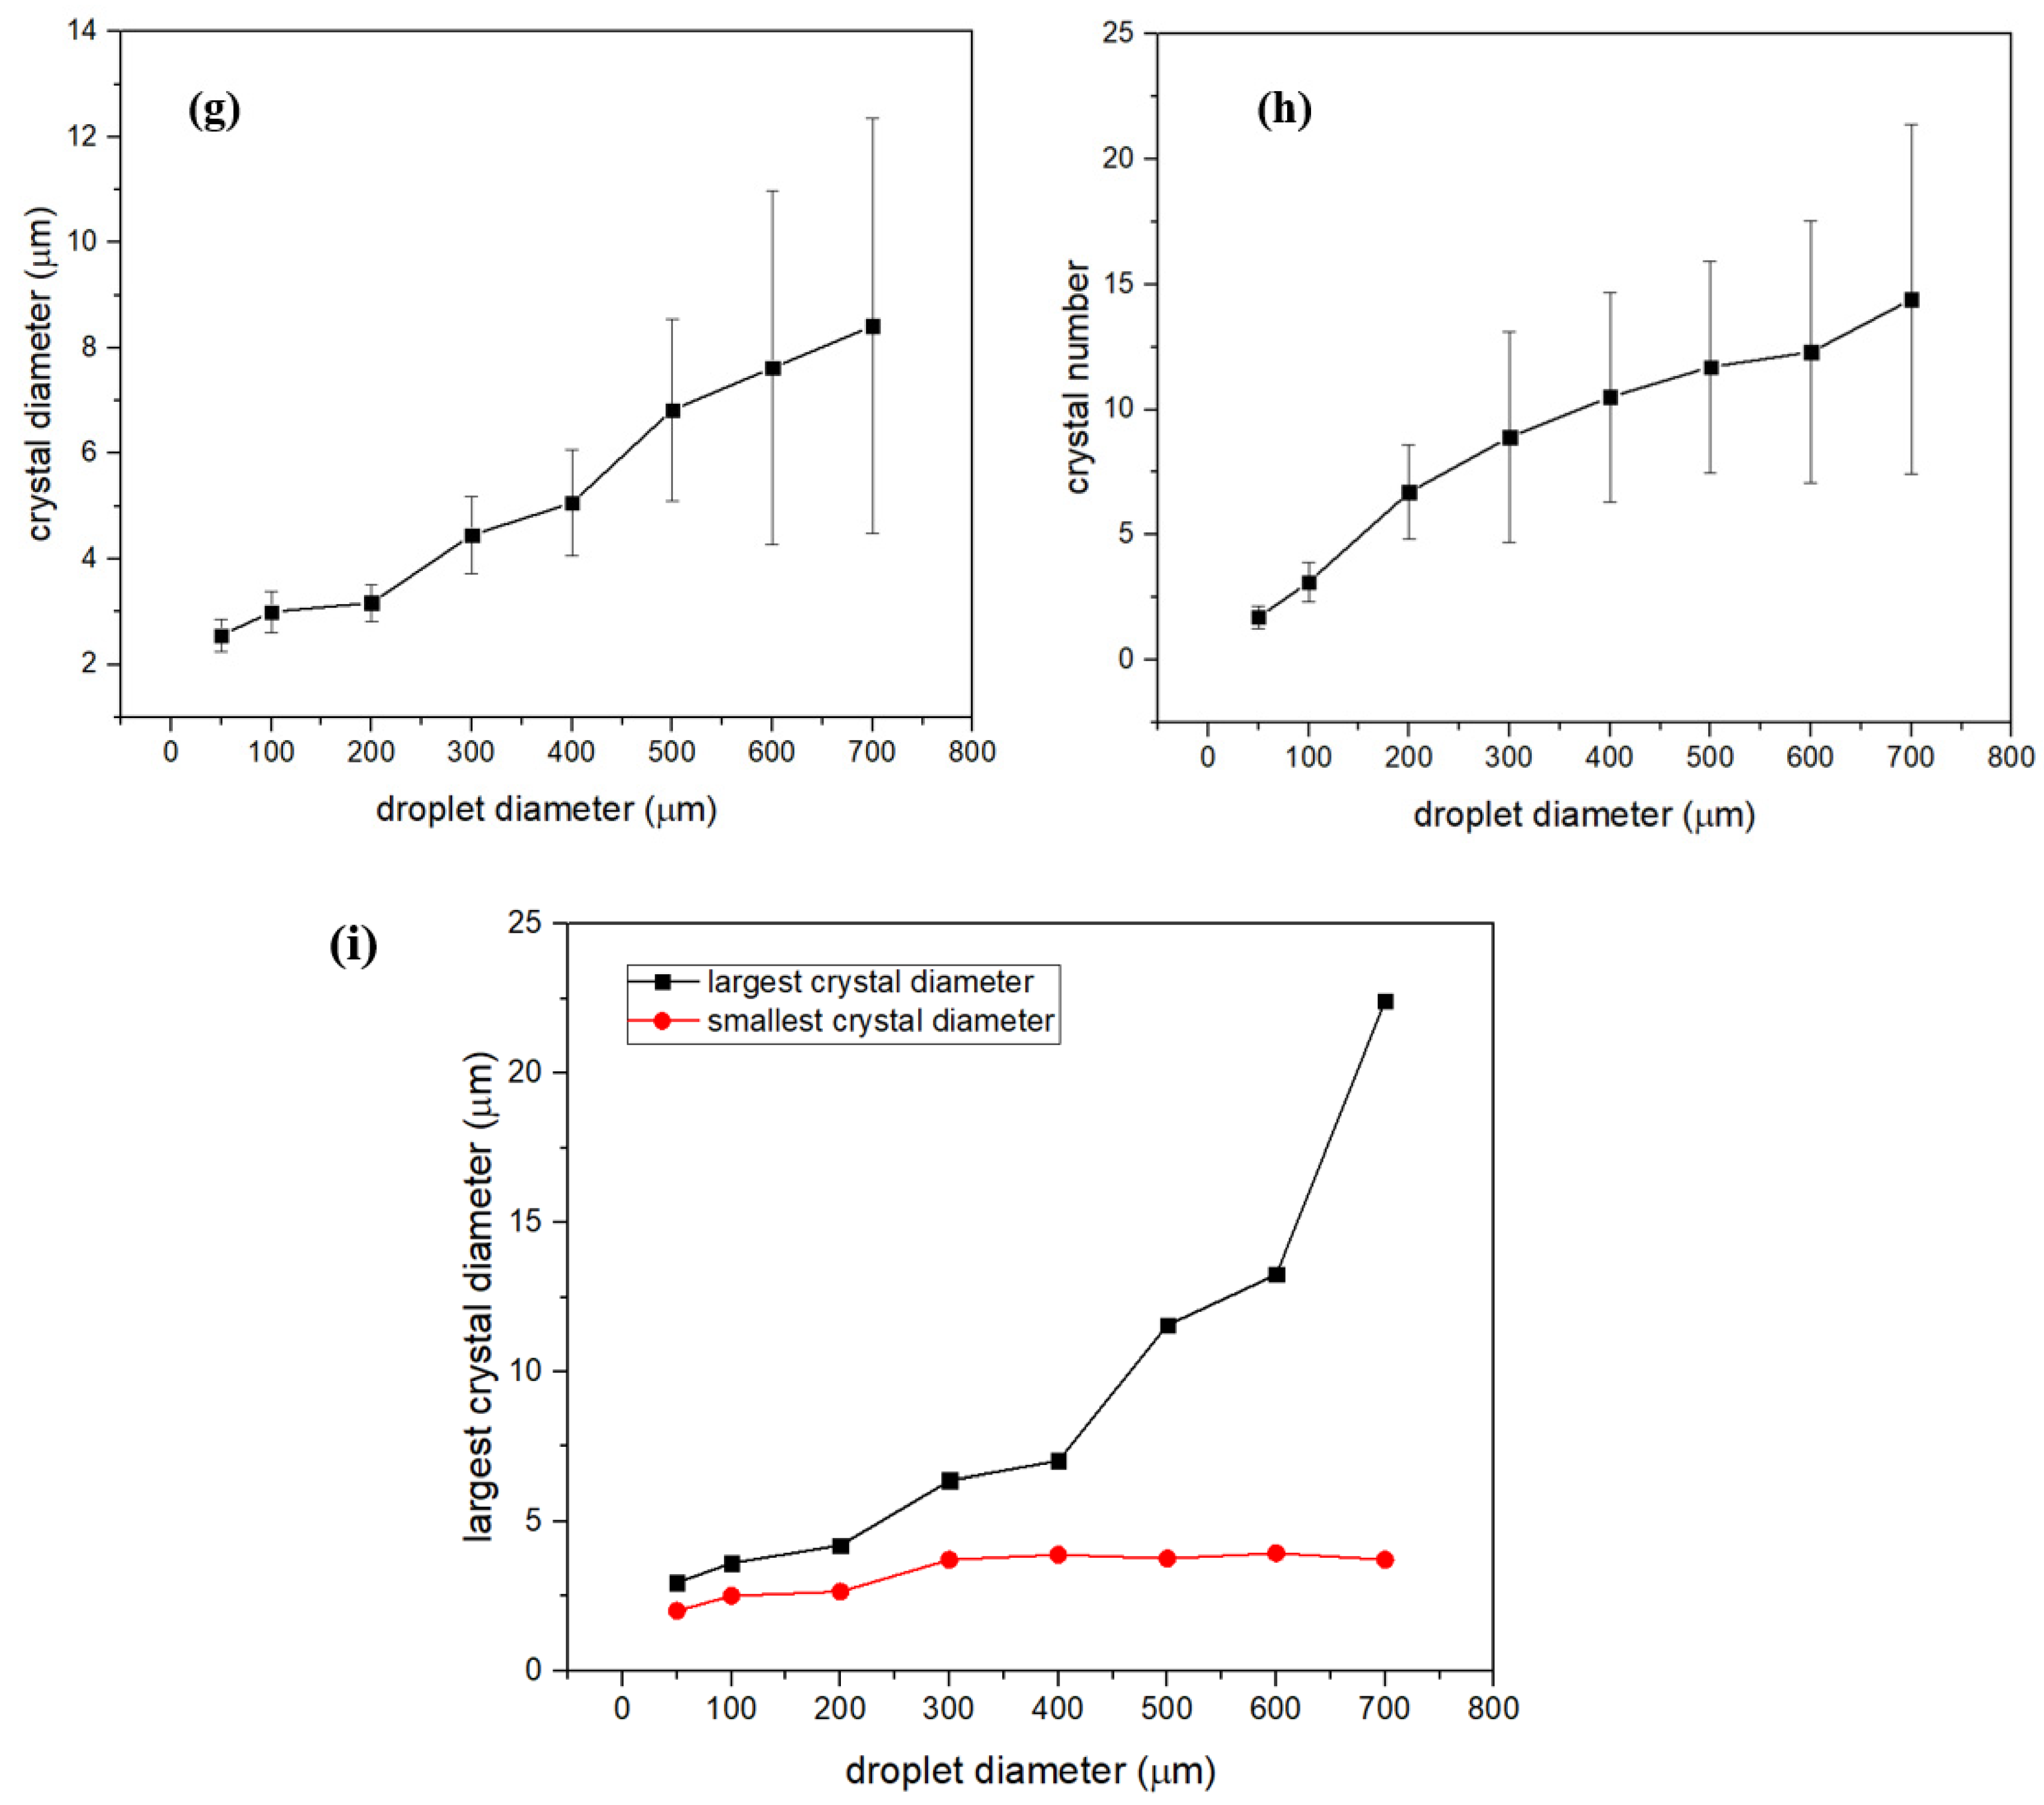
Statistically, it can clearly be seen that the size and number of CaCO3 crystals are positively correlated with droplet diameter. As the diameter of the droplets increased from 50 µm to 700 µm, the average diameter of the crystals in the droplets grew from 3.17 µm to 8.42 µm (Figure 3g). As shown in Figure 3h, more crystals can be observed in the droplet as the droplet diameter became larger. As the droplet diameter increased from 50 μm to 700 μm, the maximum crystal diameter of the crystal formed in the droplets increased from 2.96 μm to 22.42 μm while the diameter of the smallest crystal was stabilized between 2–4 μm (Figure 3i). The size and number of crystals formed in droplets of 200 µm diameter are relatively stable. The size and number of crystals formed in the droplets were more dispersed as the diameter of the droplet increased. It can be explained that there is a competitive relationship between nucleation and crystal growth in droplets when the ions start to react. In the small droplets, since the liquid is an anisotropic environment and volatilizes faster, the relationship between crystal growth and nucleation is unbalanced.
3.2. Crystals Formed without PAA
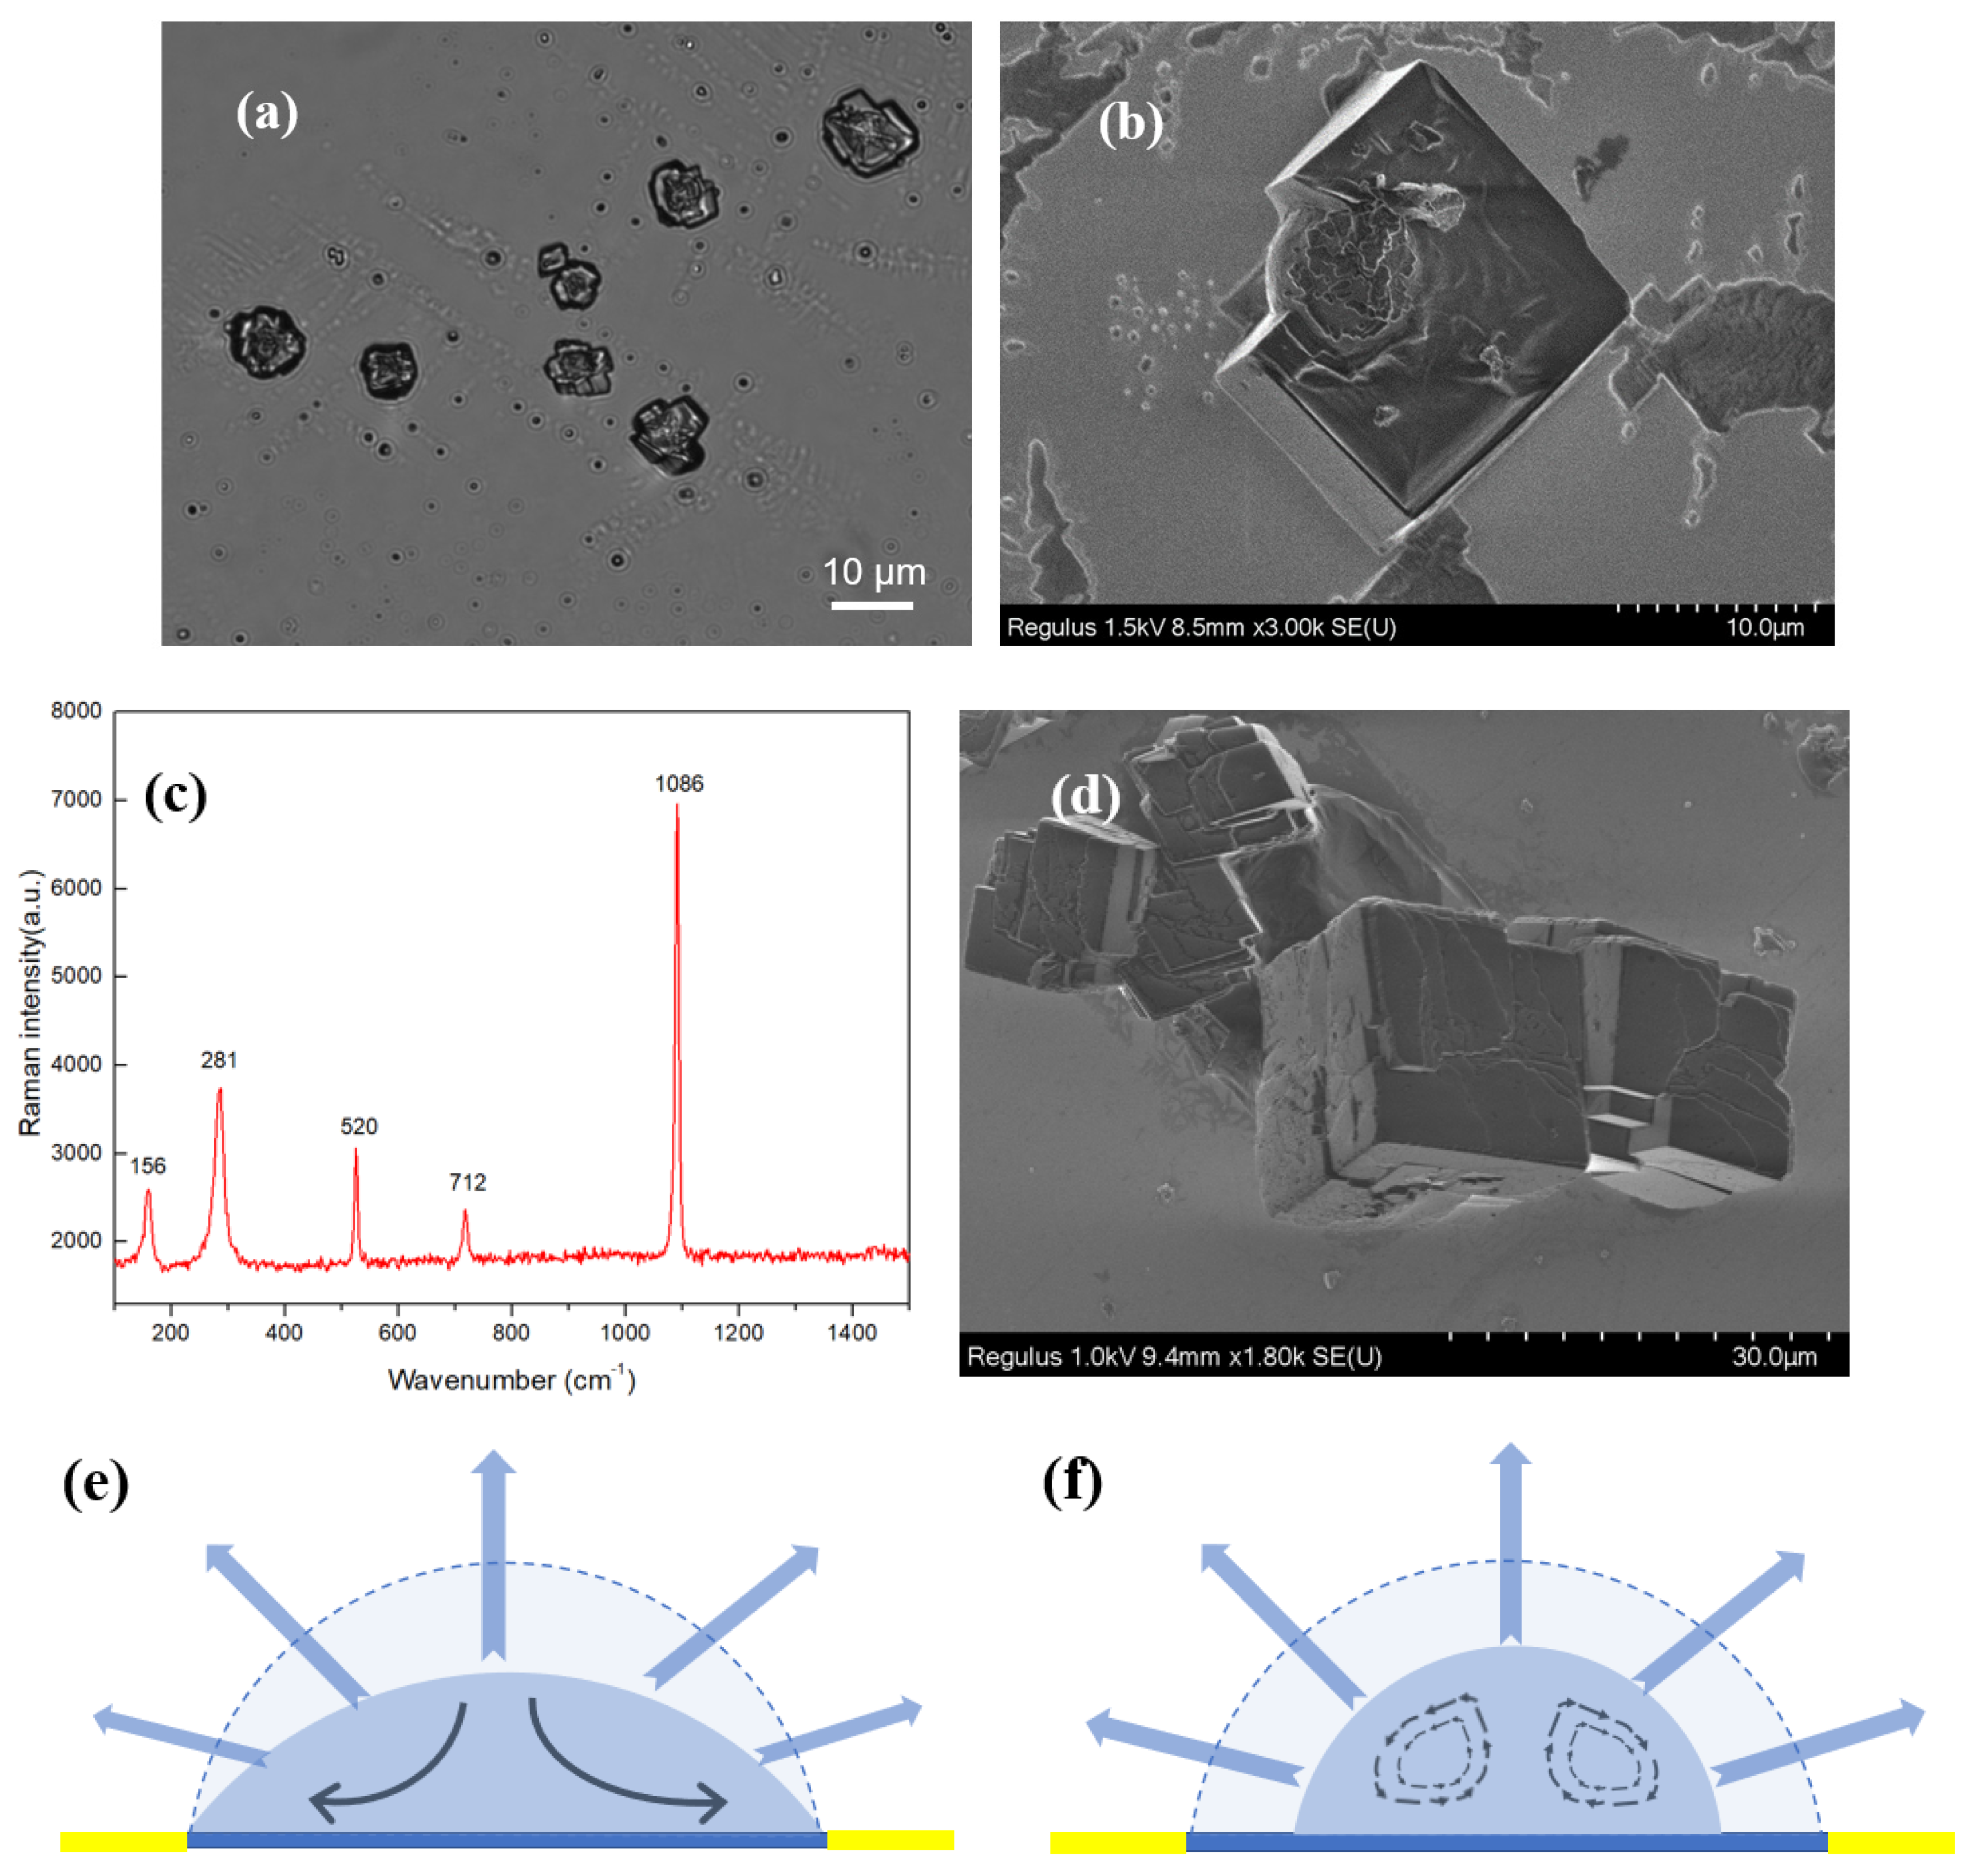
SEM and representative Raman spectrum were used to further study the morphology and structure of CaCO3 crystals formed in droplets. As shown in Figure 4a, several crystals of different sizes can be seen, and there are defects in the surface of some crystals. We used SEM to observe the crystals more clearly (Figure 4b). The majority of crystals were formed in cubic-shaped, corresponding to representative calcite spectra in the Raman spectrum [32] (Figure 4c). Among them, the peak at 520 cm−1 belonged to the silicon substrate. Compared with the synthesis of CaCO3 crystals in the bulk phase (Figure 4d), the synthesis of CaCO3 crystals in microdroplets has a greater chance of producing crystal surface defects. The effect of evaporation of droplets generated on the surface on the crystallization of materials has been studied in previous researchers’ work, and we analyzed the causes of defects on the surface of calcium carbonate crystals based on their conclusions [33,34,35]. We supposed that the growth of crystals in microdroplets coexists with the volatilization of solution, which makes the evaporation rate of the microdroplets have a large effect on the crystal growth. Two kinds of droplet evaporation mode are shown in Figure 4e,f. In the experiment, droplets were first evaporated by a constant contact radius evaporation process and then evaporated in a constant contact angle or a mixture of two evaporation modes. The volatilization of the liquid caused the height of the droplet to decrease before the diameter shrink, resulting in insufficient ion accumulation of the upper crystal plane. We suspect that capillary flow and Marangoni flow play an important role in the evaporation progress of the sessile droplets as well [36]. Due to the existence of capillary flow and Marangoni flow during liquid volatilization, ions diffuse to the bottom of the microdroplets. These effects may result in insufficient ion accumulation in the upper layer of the crystal, which causes defects on the crystal surface.
3.3. Crystals Formed with PAA
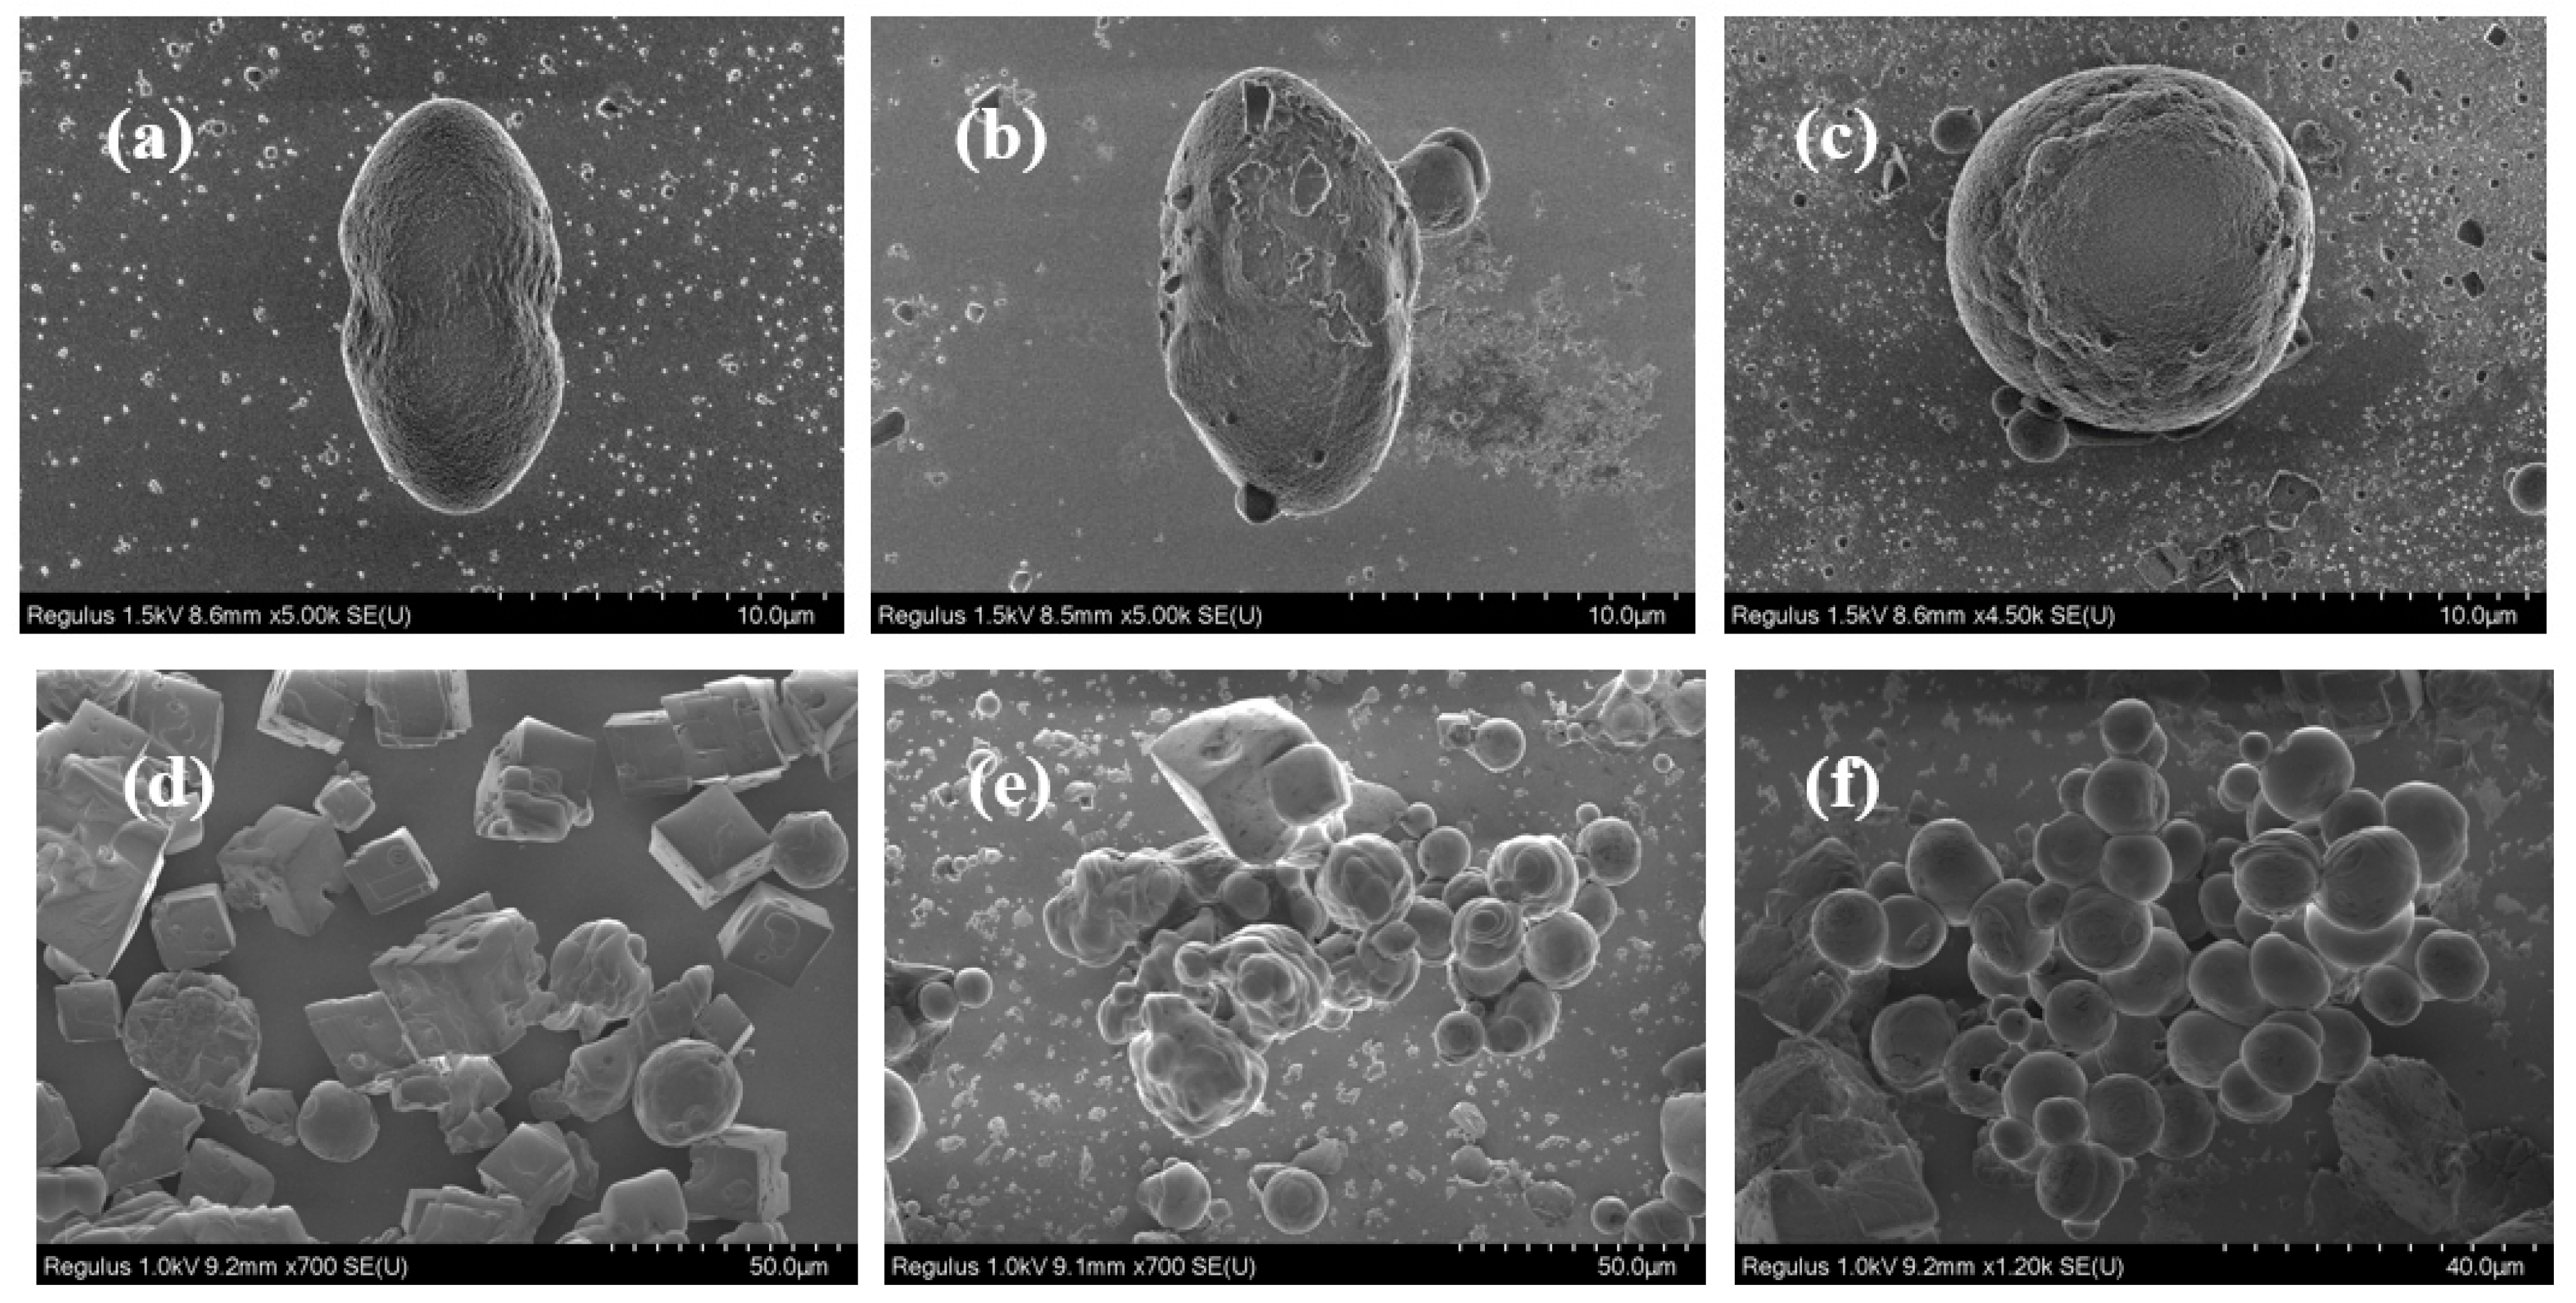
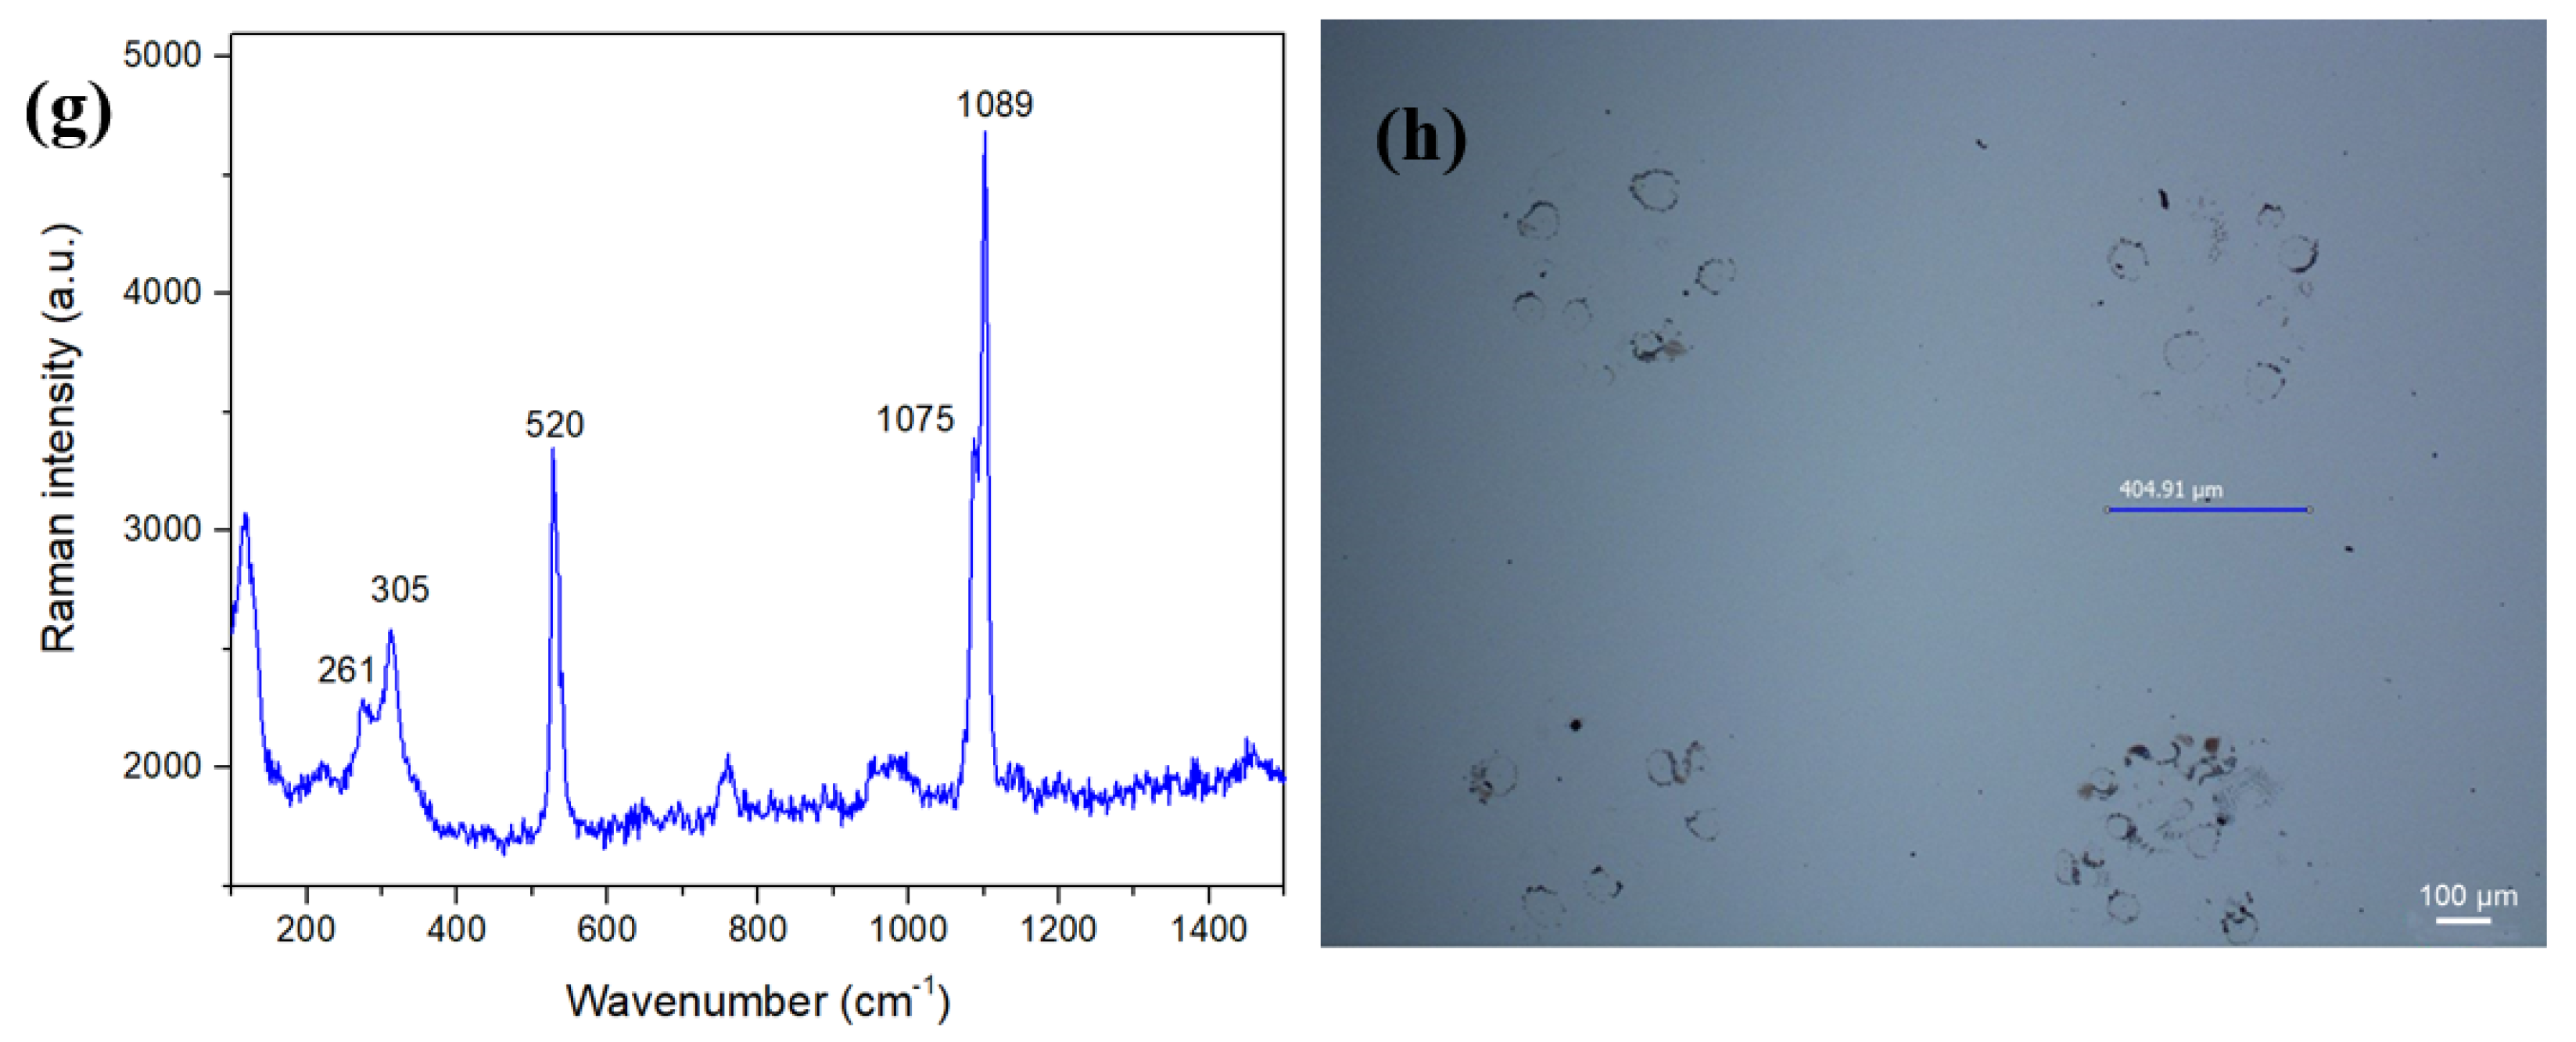
We further studied the crystallization of CaCO3 particles from aqueous solutions in the presence of PAA. PAA (0.1 mg/mL) causes CaCO3 crystals to aggregates to into a dumbbell shape (Figure 5a). The shape of the crystal becomes more rounded and grows into a spherical shape when the concentration of PAA rises (Figure 5b,c). The addition of PAA in bulk synthesis can also affect the growth of calcium carbonate. The increase of PAA concentration causes the proportion of spherical calcium carbonate to increase, and the spherical crystal is more rounded (Figure 5d–f). PAA changes both the nucleation frequency and the growth habit of crystals. In addition, the sphere-shaped crystals that formed in droplets show they Raman spectrum of vaterite [32] (Figure 5g). This polymer (PAA) concentration affects the crystallization and aggregation behavior of calcium carbonate. It has been reported in the literature that a bridging flocculation mechanism applies [37], which indicates that the morphology of the calcium carbonate microspheres is controlled by the bridging effect of polymers on nanosized particles. The structure of carboxylic acid in PAA is hydrophilic, while a large number of alkyl groups are hydrophobic, which makes PAA form a folded molecular structure in small droplets [38,39]. The carboxyl group induces calcium ion binding through electrostatic interactions to form a spherical template. The spherical template reduces the surface energy of vaterite CaCO3, thereby stabilizing the CaCO3 in the vaterite phase and preventing its conversion to thermodynamically stable calcite [14]. During the subsequent growth process, the steady-state phase of the vaterite nanoparticles is linked by the PAA molecular chain to form a vaterite carbonate microsphere with a particle size of 5–10 microns. Pan et al. observed a similar erosion behavior of calcite rhombs when only PAA was used [15], giving rise to rough rhombs with uneven surfaces due to strong interactions between PAA carboxyl acid groups and CaCO3. Their experiments resulted in similar mean diameters of the calcite grains, even if the latter were transformed into hollow spheres with the addition of surfactants. As seen from the Figure 5h, the position of the crystallization in the droplet changes after the addition of the PAA. Small droplets are easily split into microdroplets before volatilization due to the changes of the solution surface activity caused by the surfactant PAA. The ions in the liquid are dispersed to the periphery of the droplets, so that the formed crystals are deposited around the droplets to form the morphology shown in Figure 5h.
4. Conclusions
In this work, calcium carbonate was synthesized by using a surface-tension-confined droplets array, and PAA was used to change the morphology of calcium carbonate. Our approach took advantage of STC technology, which is a facile, controllable and high-throughput method to fabricate droplet arrays with controlled size, geometry and position on a patterned surface. Calcite formed in the small droplets without PAA, and the crystal size and number were positively correlated with the droplet diameter. The size and number of the crystals formed in the droplet became more dispersed as the diameter of the droplet increased. The maximum crystal diameter of the crystal formed in the droplet increased from 2.96 μm to 22.42 μm while the diameter of the smallest crystal is stabilized between 2–4 μm as the droplet diameter increased. It has been found that calcite formed in small droplets tends to exhibit defects on the surface of the crystal compared to the case of bulk-synthesized calcium carbonate, which is related to the height of the droplets and the mode of liquid evaporation. Vaterite was formed and the position of crystallization in the droplet changed when the ionic surfactant PAA was added. Since a silicon wafer is used as the substrate, some preparation steps can be simpler when CaCO3 is characterized by Raman spectroscopy and SEM—just cut the wafer to the appropriate shape. The 200 µm diameter droplet will be selected for CaCO3 biomineralization experiments in future work because of the relatively stable crystal size and quantity formed. With this droplet diameter we can make a 100*100 array chip on a 4-inch silicon wafer, providing 10,000 volumes of 0.7 nanoliter droplets formed. This step will help us to achieve high-throughput CaCO3 biomimetic crystallization and biomineralization experiments with less reagent consumption in subsequent work.
Author Contributions
Z.H. performed all the experiments, interpreted the results and prepared the manuscript. J.W and M.Z helped to designed and directed the experiments. Z.X participated in the discussion and helped write the manuscript. W.W. supervised this work.
Funding
This research was funded by the National Natural Science Foundation (Grants No. 11674210) of China.
Acknowledgments
The authors wish to thank Y Gu, C Sun, H Du, J Liu for their characterization assistance and discussions.
Conflicts of Interest
The authors declare no conflict of interest.
References
- Matsumura, S.; Kajiyama, S.; Nishimura, T.; Kato, T. Formation of Helically Structured Chitin/CaCO3 Hybrids through an Approach Inspired by the Biomineralization Processes of Crustacean Cuticles. Small 2015, 11, 5127–5133. [Google Scholar] [CrossRef]
- Jin, W.; Jiang, S.; Pan, H.; Tang, R. Amorphous Phase Mediated Crystallization: Fundamentals of Biomineralization. Crystals 2018, 8, 48. [Google Scholar] [CrossRef]
- Mann, S. Molecular tectonics in biomineralization and biomimetic materials chemistry. Nature 1993, 365, 499–505. [Google Scholar] [CrossRef]
- Pokroy, B.; Zolotoyabko, E.; Adir, N. Purification and Functional Analysis of a 40 kD Protein Extracted from the Strombus decorus persicus Mollusk Shells. Biomacromolecules 2006, 7, 550–556. [Google Scholar] [CrossRef] [PubMed]
- Sun, W.; Jayaraman, S.; Chen, W.; Persson, K.A.; Ceder, G. Nucleation of metastable aragonite CaCO3 in seawater. Proc. Natl. Acad. Sci. USA 2015, 112, 3199–3204. [Google Scholar] [CrossRef] [PubMed]
- Zou, Z.; Habraken, W.J.E.M.; Matveeva, G.; Jensen, A.C.S.; Bertinetti, L.; Hood, M.A.; Sun, C.; Gilbert, P.U.P.A.; Polishchuk, I.; Pokroy, B.; et al. A hydrated crystalline calcium carbonate phase: Calcium carbonate hemihydrate. Science 2019, 363, 396–400. [Google Scholar] [CrossRef] [PubMed]
- Cusack, M.; Freer, A. Biomineralization: Elemental and organic influence in carbonate systems. Chem. Rev. 2008, 108, 4433–4454. [Google Scholar] [CrossRef] [PubMed]
- Shahlori, R.; McDougall, D.R.; Waterhouse, G.I.N.; Yao, F.; Mata, J.P.; Nelson, A.R.J.; McGillivray, D.J. Biomineralization of Calcium Phosphate and Calcium Carbonate within Iridescent Chitosan/Iota-Carrageenan Multilayered Films. Langmuir 2018, 34, 8994–9003. [Google Scholar] [CrossRef]
- Kuang, W.; Liu, Z.; Yu, H.; Kang, G.; Jie, X.; Jin, Y.; Cao, Y. Investigation of internal concentration polarization reduction in forward osmosis membrane using nano-CaCO3 particles as sacrificial component. J. Membr. Sci. 2016, 497, 485–493. [Google Scholar] [CrossRef]
- Li, M.; Chen, Y.; Mao, L.B.; Jiang, Y.; Liu, M.F.; Huang, Q.; Yu, Z.; Wang, S.; Yu, S.H.; Lin, C.; et al. Seeded Mineralization Leads to Hierarchical CaCO3 Thin Coatings on Fibers for Oil/Water Separation Applications. Langmuir 2018, 34, 2942–2951. [Google Scholar] [CrossRef]
- Bujduveanu, M.-R.; Yao, W.; Le Goff, A.; Gorgy, K.; Shan, D.; Diao, G.-W.; Ungureanu, E.-M.; Cosnier, S. Multiwalled Carbon Nanotube-CaCO3Nanoparticle Composites for the Construction of a Tyrosinase-Based Amperometric Dopamine Biosensor. Electroanalysis 2013, 25, 613–619. [Google Scholar] [CrossRef]
- Dong, Z.; Feng, L.; Hao, Y.; Chen, M.; Gao, M.; Chao, Y.; Zhao, H.; Zhu, W.; Liu, J.; Liang, C.; et al. Synthesis of Hollow Biomineralized CaCO3-Polydopamine Nanoparticles for Multimodal Imaging-Guided Cancer Photodynamic Therapy with Reduced Skin Photosensitivity. J. Am. Chem. Soc. 2018, 140, 2165–2178. [Google Scholar] [CrossRef]
- Hanafy, N.A.N.; El-Kemary, M.; Leporatti, S. Reduction diameter of CaCO3 crystals by using poly acrylic acid might improve cellular uptake of encapsulated curcumin in breast cancer. J. Nanomed. Res. 2018, 7, 235–239. [Google Scholar] [CrossRef]
- Sommerdijk, N.A.J.M.; With, G. Biomimetic CaCO3 Mineralization using Designer Molecules and Interfaces. Chem. Rev. 2008, 108, 4499–4550. [Google Scholar] [CrossRef] [PubMed]
- Pan, Y.; Guo, Y.-P.; Zhao, X.; Wang, Z. Influence of Surfactant-polymer Complexes on Crystallization and Aggregation of CaCO3. Chem. Res. Chin. Univ. 2012, 28, 737–742. [Google Scholar]
- Liu, M.-F.; Lu, Z.; Zhang, Z.; Xiao, C.; Li, M.; Huang, Y.-X.; Liu, X.Y.; Jiang, Y. Correlations of crystal shape and lateral orientation in bioinspired CaCO3 mineralization. CrystEngComm 2018, 20, 5241–5248. [Google Scholar] [CrossRef]
- Xu, A.W.; Antonietti, M.; Cölfen, H.; Fang, Y.P. Uniform Hexagonal Plates of Vaterite CaCO3 Mesocrystals Formed by Biomimetic Mineralization. Adv. Funct. Mater. 2006, 16, 903–908. [Google Scholar] [CrossRef]
- Meier, A.; Kastner, A.; Harries, D.; Wierzbicka-Wieczorek, M.; Majzlan, J.; Büchel, G.; Kothe, E. Calcium carbonates: Induced biomineralization with controlled macromorphology. Biogeosciences 2017, 14, 4867–4878. [Google Scholar] [CrossRef]
- He, L.; Xue, R.; Song, R. Formation of calcium carbonate films on chitosan substrates in the presence of polyacrylic acid. J. Solid State Chem. 2009, 182, 1082–1087. [Google Scholar] [CrossRef]
- Shen, Y.; Nyström, G.; Mezzenga, R. Amyloid Fibrils form Hybrid Colloidal Gels and Aerogels with Dispersed CaCO3 Nanoparticles. Adv. Funct. Mater. 2017, 27, 1700897. [Google Scholar] [CrossRef]
- Ouhenia, S.; Chateigner, D.; Belkhir, M.A.; Guilmeau, E.; Krauss, C. Synthesis of calcium carbonate polymorphs in the presence of polyacrylic acid. J. Cryst. Growth 2008, 310, 2832–2841. [Google Scholar] [CrossRef]
- Aizenberg, J.; Black, A.J.; Whitesides, G.M. Control of crystal nucleation by patterned self-assembled monolayers. Nature 1999, 398, 495–498. [Google Scholar] [CrossRef]
- Li, L.; Sanchez, J.R.; Kohler, F.; Røyne, A.; Dysthe, D.K. Microfluidic Control of Nucleation and Growth of CaCO3. Cryst. Growth Des. 2018, 18, 4528–4535. [Google Scholar] [CrossRef]
- Komatsu, S.; Ikedo, Y.; Asoh, T.A.; Ishihara, R.; Kikuchi, A. Fabrication of Hybrid Capsules via CaCO3 Crystallization on Degradable Coacervate Droplets. Langmuir 2018, 34, 3981–3986. [Google Scholar] [CrossRef] [PubMed]
- Yin, H.; Ji, B.; Dobson, P.S.; Mosbahi, K.; Glidle, A.; Gadegaard, N.; Freer, A.; Cooper, J.M.; Cusack, M. Screening of Biomineralization using Microfluidics. Anal. Chem. 2009, 81, 473–478. [Google Scholar] [CrossRef] [PubMed]
- Gong, X.; Wang, Y.W.; Ihli, J.; Kim, Y.Y.; Li, S.; Walshaw, R.; Chen, L.; Meldrum, F.C. The Crystal Hotel: A Microfluidic Approach to Biomimetic Crystallization. Adv. Mater. 2015, 27, 7395–7400. [Google Scholar] [CrossRef] [PubMed] [Green Version]
- Zeng, Y.; Cao, J.; Wang, Z.; Guo, J.; Lu, J. Formation of Amorphous Calcium Carbonate and Its Transformation Mechanism to Crystalline CaCO3 in Laminar Microfluidics. Cryst. Growth Des. 2018, 18, 1710–1721. [Google Scholar] [CrossRef]
- Tang, Y.; Yang, W.; Yin, X.; Liu, Y.; Yin, P.; Wang, J. Investigation of CaCO3 scale inhibition by PAA, ATMP and PAPEMP. Desalination 2008, 228, 55–60. [Google Scholar] [CrossRef]
- Lin, Y.; Wu, Z.; Gao, Y.; Wu, J.; Wen, W. High-throughput controllable generation of droplet arrays with low consumption. Appl. Surf. Sci. 2018, 442, 189–194. [Google Scholar] [CrossRef]
- Lin, Y.; Wu, Z.; Zhang, M.; Wu, J.; Wen, W. Lateral Size Scaling Effect during Discontinuous Dewetting. Adv. Mater. Int. 2018, 5, 1800729. [Google Scholar] [CrossRef]
- Wu, H.; Chen, X.; Gao, X.; Zhang, M.; Wu, J.; Wen, W. High-Throughput Generation of Durable Droplet Arrays for Single-Cell Encapsulation, Culture, and Monitoring. Anal. Chem. 2018, 90, 4303–4309. [Google Scholar] [CrossRef]
- Dandeu, A.; Humbert, B.; Carteret, C.; Muhr, H.; Plasari, E.; Bossoutrot, J.M. Raman Spectroscopy—A Powerful Tool for the Quantitative Determination of the Composition of Polymorph Mixtures: Application to CaCO3 Polymorph Mixtures. Chem. Eng. Technol. 2006, 29, 221–225. [Google Scholar] [CrossRef]
- Shahidzadeh, N.; Schut, M.F.; Desarnaud, J.; Prat, M.; Bonn, D. Salt stains from evaporating droplets. Sci Rep. 2015, 5, 10335. [Google Scholar] [CrossRef]
- Shahidzadeh-Bonn, N.; Rafaı, S.; Bonn, D.; Wegdam, G. Salt Crystallization during Evaporation: Impact of Interfacial Properties. Langmuir 2008, 24, 8599–8605. [Google Scholar] [CrossRef] [PubMed]
- Przybylek, M.; Cysewski, P.; Pawelec, M.; Ziolkowska, D.; Kobierski, M. On the origin of surface imposed anisotropic growth of salicylic and acetylsalicylic acids crystals during droplet evaporation. J. Mol. Model. 2015, 21, 49. [Google Scholar] [CrossRef]
- Wu, Z.; Lin, Y.; Xing, J.; Zhang, M.; Wu, J. Surface-tension-confined assembly of a metal–organic framework in femtoliter droplet arrays. RSC Adv. 2018, 8, 3680–3686. [Google Scholar] [CrossRef]
- Pan, Y.; Zhao, X.; Guo, Y.; Lv, X.; Ren, S.; Yuan, M.; Wang, Z. Controlled synthesis of hollow calcite microspheres modulated by polyacrylic acid and sodium dodecyl sulfonate. Mater. Lett. 2007, 61, 2810–2813. [Google Scholar] [CrossRef]
- Schmidt, B.V.; Fechler, N.; Falkenhagen, J.; Lutz, J.F. Controlled folding of synthetic polymer chains through the formation of positionable covalent bridges. Nat. Chem. 2011, 3, 234–238. [Google Scholar] [CrossRef]
- Guan, L.; Xu, H.; Huang, D. The investigation on states of water in different hydrophilic polymers by DSC and FTIR. J. Polym. Res. 2010, 18, 681–689. [Google Scholar] [CrossRef]
Figure 1.
(a) Schematic illustration of the process followed to fabricate high-throughput surface-tension-confined microarrays. (b) Picture of lithographic mask with a spot gradient from 200 µm to 700 µm. (c) Schematic illustration of the sliding process, which forms the droplet array by sliding a liquid strip on the patterned substrate.

Figure 2.
(a) Cross-sectional view of a surface-tension-confined droplet. (b) The relation between the droplet volume and droplet diameter. (c) The time required for evaporation of droplets with different diameters (25 °C, 30%RH).
Figure 2.
(a) Cross-sectional view of a surface-tension-confined droplet. (b) The relation between the droplet volume and droplet diameter. (c) The time required for evaporation of droplets with different diameters (25 °C, 30%RH).


Figure 3.
Optical micrograph of CaCO3 formed in microdroplets at different diameters and statistical data graph: (a) 50 µm, (b) 100 µm, (c) 400 µm. (d), (e), (f) crystals formed in the droplet with 300 µm, 400 µm, 700 µm respectively. (g) The relation between average diameter of crystals and droplet diameter. (h) The relation between average amount of crystals and droplet diameter. (i) The relation largest & smallest crystal diameter of crystals and droplet diameter. Scale bars in (a), (b), (d), (e), (f) is 10 μm, Scale bars in (c) is 100 μm.


Figure 4.
(a) Optical micrograph of CaCO3 crystals formed in droplets; (b) Scanning electron microscopy (SEM) image of one crystal formed on a 400 µm diameter droplet. (c) Representative Raman spectrum of crystals with cubic-shaped, which shows its polymorph of calcite at 156, 281, 712, and 1086 cm−1; (d) SEM image of crystals formed by bulk phase synthesis. (e) Constant contact radius evaporation and internal capillary flow. (f) Constant contact angle evaporation, internal Marangoni flow.

Figure 5.
SEM images of crystals formed in a droplet with a polyacrylic acid (PAA) content of (a) 0.1 mg/mL, (b) 0.2 mg/mL and (c) 0.4 mg/mL; SEM images of crystals formed on bulk phase synthesis with PAA(d) 0.1 mg/mL, (e) 0.2 mg/mL and (f) 0.4 mg/mL; (g) Representative Raman spectrum of sphere-shaped crystals, which has the characteristic peaks of vaterite at 261, 305, 1075, and 1089 cm−1; (h) Optical micrograph of CaCO3 crystals formed in 400 µm diameter droplets.


© 2019 by the authors. Licensee MDPI, Basel, Switzerland. This article is an open access article distributed under the terms and conditions of the Creative Commons Attribution (CC BY) license (http://creativecommons.org/licenses/by/4.0/).
Share and Cite
MDPI and ACS Style
He, Z.; Xia, Z.; Zhang, M.; Wu, J.; Wen, W. Calcium Carbonate Mineralization in a Surface-Tension-Confined Droplets Array. Crystals 2019, 9, 284. https://doi.org/10.3390/cryst9060284
AMA Style
He Z, Xia Z, Zhang M, Wu J, Wen W. Calcium Carbonate Mineralization in a Surface-Tension-Confined Droplets Array. Crystals. 2019; 9(6):284. https://doi.org/10.3390/cryst9060284
Chicago/Turabian StyleHe, Zhong, Zengzilu Xia, Mengying Zhang, Jinbo Wu, and Weijia Wen. 2019. "Calcium Carbonate Mineralization in a Surface-Tension-Confined Droplets Array" Crystals 9, no. 6: 284. https://doi.org/10.3390/cryst9060284
Note that from the first issue of 2016, this journal uses article numbers instead of page numbers. See further details here.