Birefringence Gradient and Exposure Energy of Hf:Yb:Nd:LiNbO3 Crystals with Various [Li]/[Nb] Ratios


1
College of Science, Harbin University of Science and Technology, Harbin 150080, China
2
Department of the Applied Chemistry, Harbin Institute of Technology, Harbin 150001, China
*
Author to whom correspondence should be addressed.
Crystals 2018, 8(7), 266; https://doi.org/10.3390/cryst8070266
Submission received: 4 May 2018
/
Revised: 30 May 2018
/
Accepted: 5 June 2018
/
Published: 27 June 2018
Abstract
:A series of Hf:Yb:Nd:LiNbO3 crystals with different [Li]/[Nb] ratios (0.946, 1.05, 1.20, and 1.38) were grown using the Czochralski method. X-ray diffraction phase results of the samples show that the LiNbO3 doped Hf4+, Yb3+, and Nd3+ only have a slight change in the lattice constant. The birefringence gradient of the HfYbNd4 sample measured using the birefringence gradient method was 3.3 × 10⁻⁵ ∆R/cm−1, which was the best optical uniformity. The optical damage resistance ability was measured using the light-induced scattering exposure energy flus threshold method. When the [Li]/[Nb] ratios in the melt achieve 1.38, the exposure energy achieves 120.74 J/cm2, which is approximately 87 times higher than HfYbNd1.
1. Introduction
Lithium niobate crystal is an optically functional material that combines the advantages of piezoelectric, acousto-optic, photorefractive, and nonlinear properties [1,2,3]. However, in practical applications, pure LiNbO3 crystals cannot achieve the desired result due to the existence of the photorefractive damage. In recent years, many methods have been used to improve the optical properties of crystals, in which doping anti-photorefractive ions are the most promising method [4]. It was demonstrated that anti-photorefractive ions, such as Mg, Sc, and In, can significantly improve the optical damage resistance of LiNbO3 [5,6,7,8]. Zhen et al. reported that In3+-doped Nd:LiNbO3 can significantly improve the optical damage resistance [9]. In the early years, some scholars discovered that the optical damage resistance properties of Er3+-doped Sc:LiNbO3 have been unexpectedly improved [10]. There are many places worth investigating to improve the optical damage resistance by doping with ions.
As is known to all, rare-earth (RE) ions doped into LiNbO3 materials have comprehensive applications in optical amplifiers, optical communication, laser devices, and so on. Among many rare-earth (RE) ions, Nd3+ ion has attracted considerable attention, due to its symmetry and abundant energy levels [11]. Although up-conversion luminescent of Nd:LiNbO3 crystals has been observed, the absorption of Nd:LiNbO3 crystals at pumping wavelength is weak [12,13]. Hence, Yb3+ ions, as sensitized ions, had been incorporated into the melt to improve the up-conversion luminescence efficiency of the crystals [14,15]. The spectral properties of Yb:Nd:LiNbO3 crystals have been reported and demonstrated for their potential in practical applications [16]. In order to improve the light-induced scattering of the crystal, it is necessary to incorporate light-induced scattering ions in the melt. Therefore, incorporating HfO2 in the melt is more suitable for this test. Hf4+ is a tetravalent ion whose ionic valency is higher than other damage-resistant dopants, so the optical properties of Hf4+-doped Yb:Nd:LiNbO3 crystals may be different from those doped with other damage resistant dopants ions [17,18]. Hf4+ may become a promising light-induced scattering ion [19].
In this report, a series of Hf:Yb:Nd:LiNbO3 crystals with different [Li]/[Nb] ratios were grown by Czochralski method. The Hf:Yb:Nd:LiNbO3 crystals were measured by X-ray diffraction technology, and their defects were analyzed in detail. The optical homogeneity and light-induced scattering of the samples were measured using the birefringence gradient method and light-induced scattering exposure energy flux threshold method, respectively.
2. Experiment
Using the Czochralski method to produce a series of Hf (2 mol %):Yb (1 mol %):Nd (1 mol %):LiNbO3 crystals with different [Li]/[Nb] ratios, Li2CO3, Nb2O5, HfO2, Yb2O3, and Nd2O3 with the purity of 99.99% were used as raw materials. The [Li]/[Nb] ratios were selected to be 0.946, 1.05, 1.20, and 1.38 in the melt, which were labeled as HfYbNd1, HfYbNd2, HfYbNd3, and HfYbNd4, respectively. The ingredients were thoroughly mixed for 24 h and then heated. Then, the mixture was heated to 750 °C for two hours to remove CO2 and sintered at 1050 °C for 10 h to form polycrystalline. Controlling the temperature is the main point of crystal growth, and finding the suitable temperature for seeding is the prerequisite for the perfect crystal growth. As the [Li]/[Nb] ratios in the melt changes, the speed of pulling and rotation of seed are different. The pulling speeds were 1.8 mm/h, 1.3 mm/h, 0.8 mm/h, and 0.3 mm/h, and the seed rotation rates were 15 rpm, 18 rpm, 21 rpm, and 24 rpm, for HfYbNd1, HfYbNd2, HfYbNd3, and HfYbNd4, respectively [20,21]. After growth, the crystals were cooled down to room temperature at a rate of 60 °C/h and polarized to obtain high quality single crystals. Then, the crystals were sliced into a thin wafer along the y-axis that had a diameter of 10 × 20 × 2 mm (x × z × y). The wafers were double-sided polished to optical grade.
3. Results and Discussion
3.1. XRD Diffraction Analysis
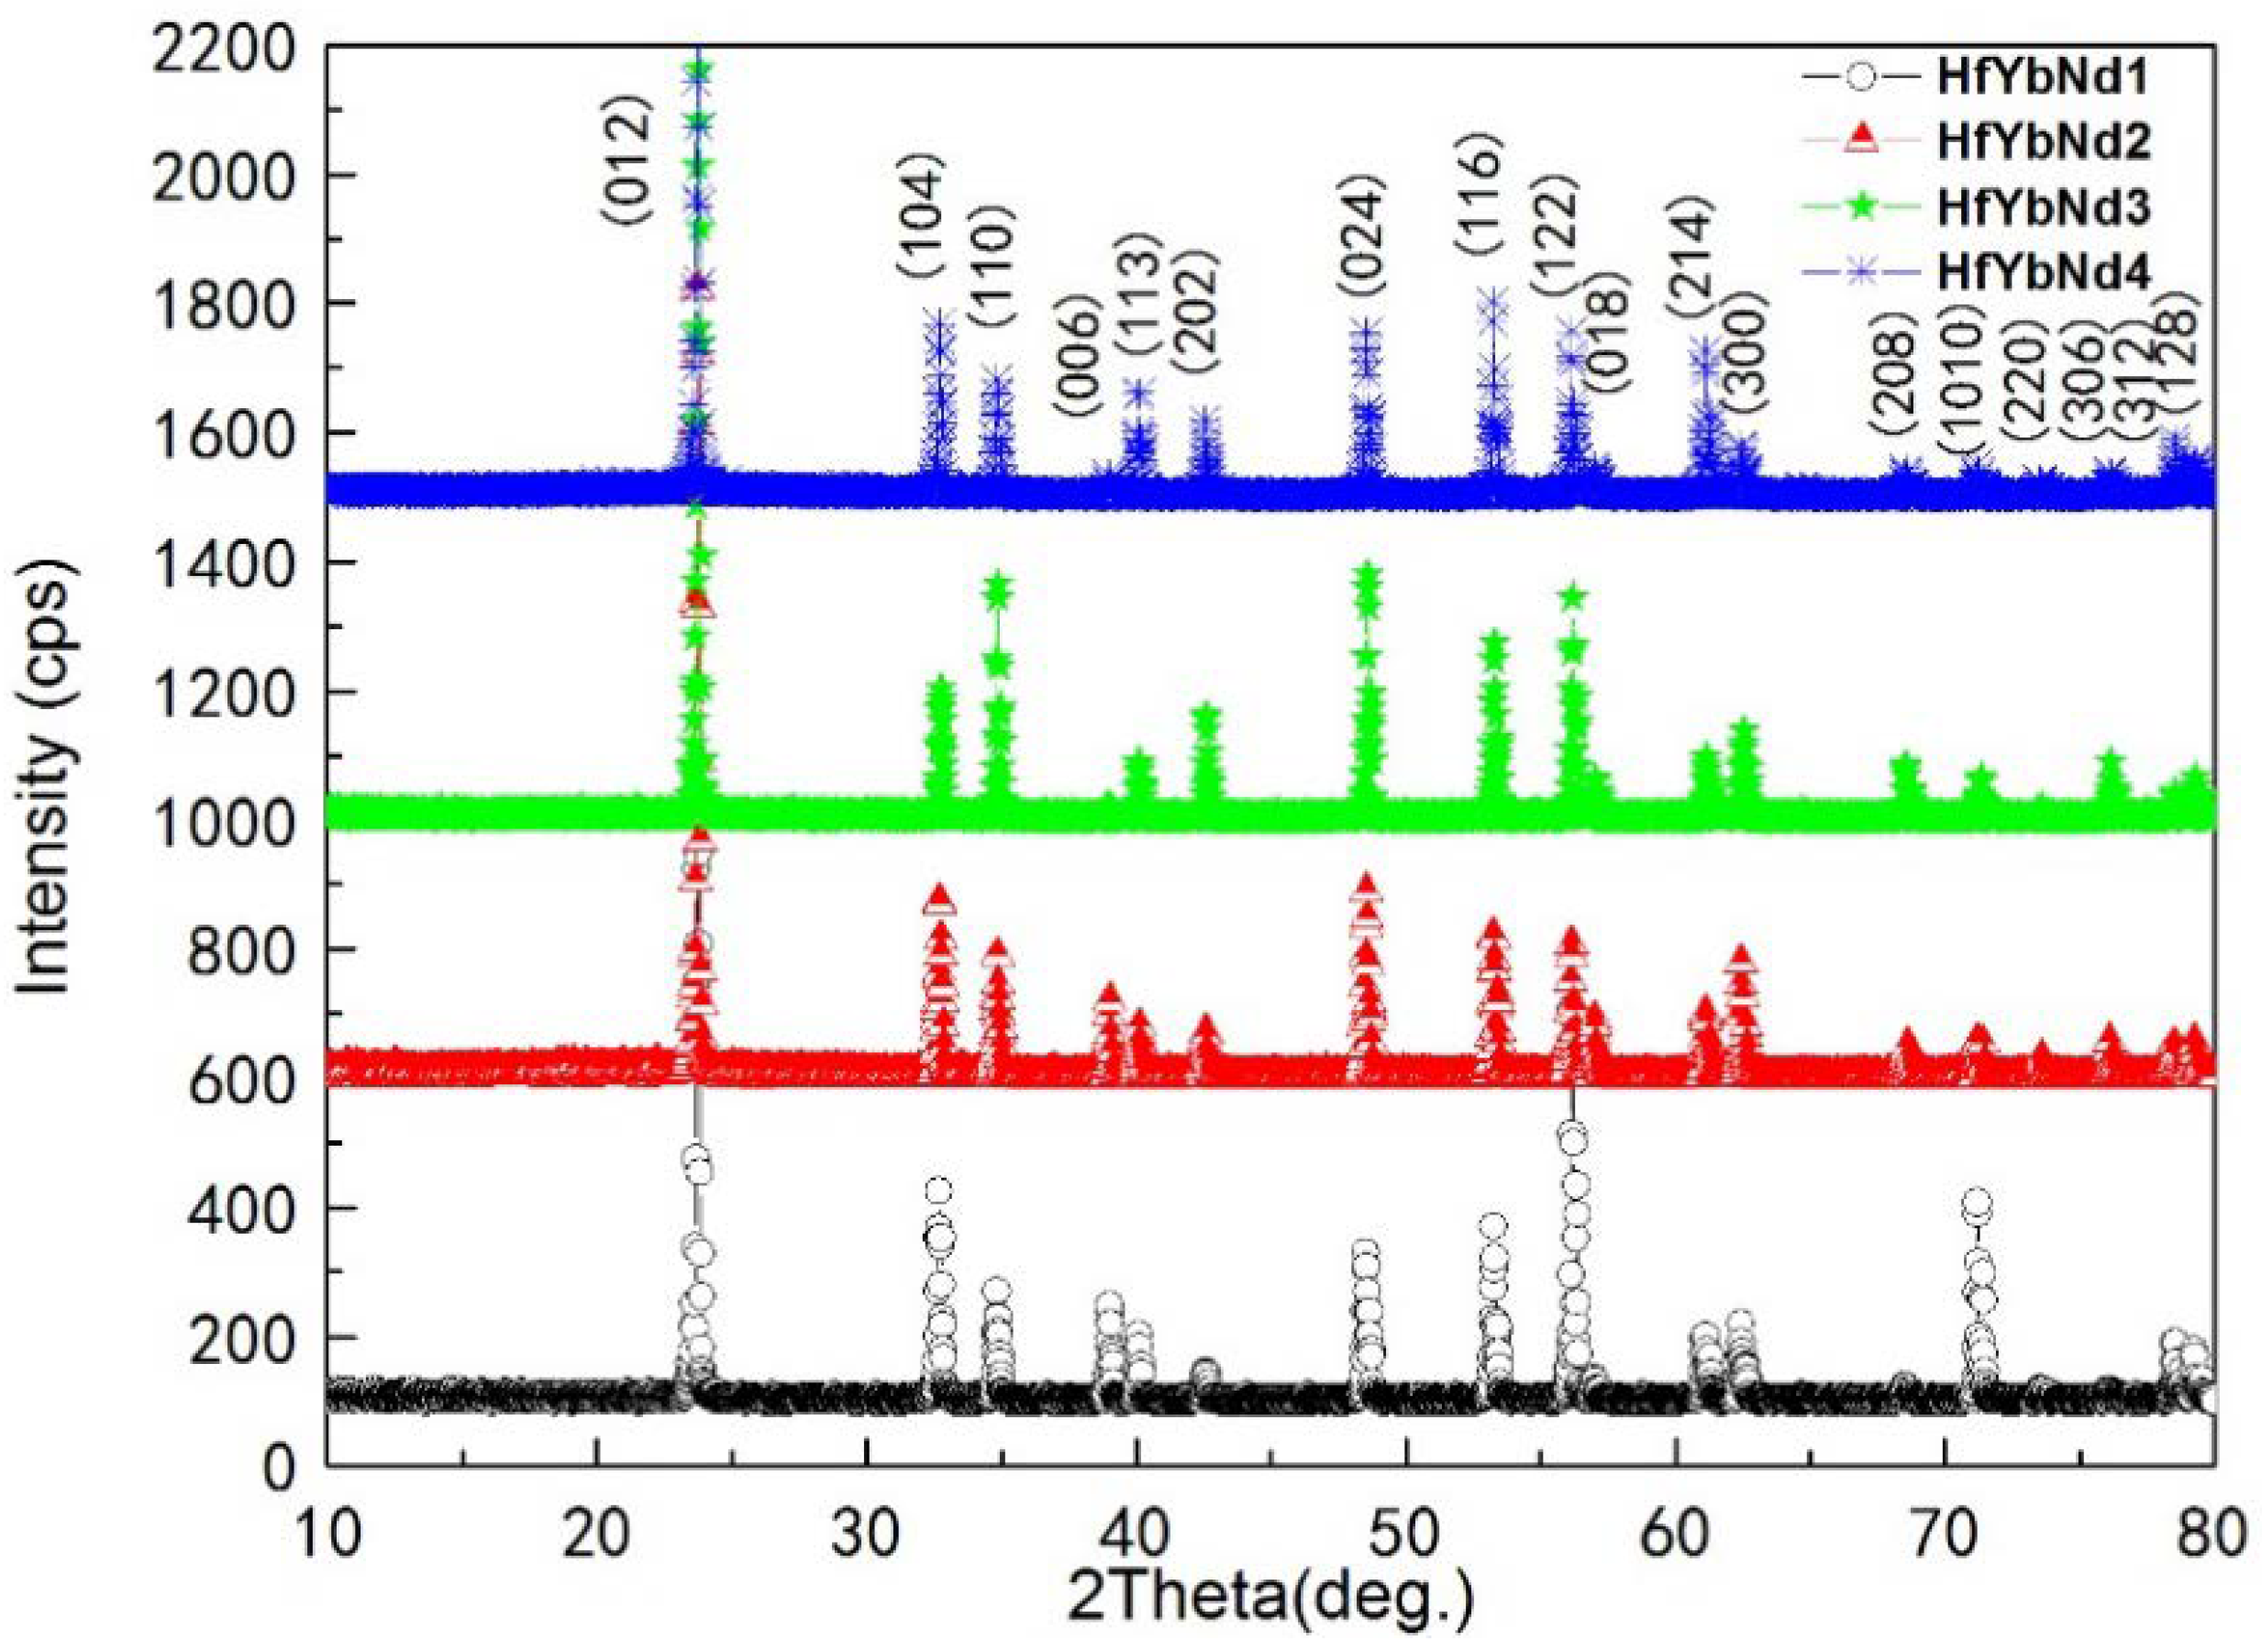
In order to study the influence of the [Li]/[Nb] ratios’ change on the structure of the Hf:Yb:Nd:LiNbO3 crystals, the samples were tested using X-ray powder diffraction. The test was performed on a XRD-6000 X-ray powder diffractometer manufactured by SHIMADZU Corporation. The XRD patterns of Hf:Yb:Nd:LiNbO3 crystals with four sets of [Li]/[Nb] ratios are shown in Figure 1.
As can be seen from Figure 1, the diffraction peak positions of the four samples are substantially the same. There is no new diffraction peak generated as the [Li]/[Nb] ratios changes. This indicates that doping Hf4+, Yb3+, and Nd3+, or changing [Li]/[Nb] ratios, will not change the internal structure of LiNbO3 crystals. This verified that after adding the Hf, Yb, and Nd ions to crystal lattice of LiNbO3, the structure did not change dramatically, in which new phase did not produce and the crystal still belonged to the trigonal system [22]. Based on the ion radius approximation principle in the crystal field theory, the doped ion entered crystal lattice by replacing the Li+ and Nb5+ ion instead of occupying the slot among crystal lattice. However, the ionic radius of Hf4+, Yb3+, Nd3+, Li+, and Nb5+ are 0.071 nm, 0.0868 nm, 0.0883 nm, 0.076 nm, and 0.064 nm, respectively. Since the doping ions and the substitution ions have different radii, the lattice constant and the atomic position slightly change, and the position of the diffraction peak also changes.
According to the results, the lattice constants of the four samples are calculated by the least square method, and the unit cell volume is calculated according to the following formula.
in which a and c represent the lattice constants of the a-axis and the c-axis of the Hf:Yb:Nd:LiNbO3 crystals, respectively. The calculated results are shown in Table 1. It can be seen from the figure that the trend of the lattice constant of all the samples increases first and then decreases with the increase of [Li]/[Nb] ratios. Based on the Li vacancy defect model of congruent LiNbO3 [23], there are many intrinsic defects including anti-site Nb () and Li vacancy () in congruent LiNbO3 crystals with [Li]/[Nb] ratio of 0.946 [24]. Doping Hf4+, Yb3+, and Nd3+ ions would substitute and occupy to form ,, and due to the larger radius of doped ions, resulting in the lattice expansion and unit cell volume increasing. As the [Li]/[Nb] ratios increase, the content of Li in the crystals gradually increases, and the newly added Li+ replace the in the lattice. The polarization of Li+ is less than Nb5+ ions, which causes the oxygen octahedron expand, so the unit cell volume increases [25]. However, when the [Li]/[Nb] ratios reach 1.20, the unit cell volume decreases. This can be understood as the gradual reduction of ; the polarization of Hf4+ is much greater than of Li+ and Nb5+, which results in a decrease in the unit cell volume. Furthermore, when the [Li]/[Nb] ratio reaches up to 1.38, gets completely replaced, and Hf4+, Yb3+ and Nd3+ enters normal Li site. Because Hf4+, Yb3+, and Nd3+ have stronger polarization abilities than Li+, the unit cell volume further decreases.
V = a2c × cos 30°
3.2. Optical Homogeneity
Optical homogeneity refers to the degree of change in the refractive index of the crystal. Optical homogeneity was measured using the birefringence gradient method [26]. The experimental setup for measuring the light-induced scattering of the Hf:Yb:Nd:LiNbO3 crystals with different [Li]/[Nb] ratios is shown in Figure 2.
Using He-Ne laser as the light source (λ = 632.8 nm), the beam becomes linearly polarized after passing through the polarizer; the polarization direction is the Y direction, and the optical axis of the crystal is 45° to the polarization direction. Linear polarized light enters the crystal and splits into o light and e light. Since the propagation speeds of o and e light are different in the crystal, the light leaving the crystal is elliptically polarized. X, Y direction is exactly 1/4 wave plate fast axis direction, which is also the long axis of the ellipse. Therefore, the light emitting from the quarter-wave plate is linearly polarized light and the angle between the polarization direction and the y-axis is φ. So, the analyzer should be rotated from the positive and negative position; φ angle can make the output very small, which is called extinction angle [27]. The birefringence gradient is expressed as follows:
The symbols in the above formula represent the meanings, respectively: d stands for light length, is the length of the distance between two points in the scanning direction, λ represents the wavelength of the laser, and is the difference of the extinction angles between two points. Besides, the transmitted light intensity (I) can be described from the following equation:
represents the incident light intensity. So, the expression of can be calculated as follows:
, represent the light intensity, whose distance is in the scanning direction, respectively. In this case, the birefringence gradient becomes readily available. The values measured by this method are shown in Table 2.
As can be seen from Table 2, as the [Li]/[Nb] ratios of the Hf:Yb:Nd:LiNbO3 crystals increase, the birefringence gradient values of the four samples gradually become smaller. The birefringence gradient value of HfYbNd1 is the largest, and the birefringence gradient value of HfYbNd4 is the smallest. The optical homogeneity of the crystal is characterized by the birefringence gradient. The optical homogeneity becomes worse as the birefringence gradient increases. Table 2 also introduces the birefringence gradient of two Mg:LiNbO3 crystals with different [Li]/[Nb] ratios. It can be seen that the birefringence gradient increases as the [Li]/[Nb] ratios increases. However, its smaller set of data is also bigger than HfYbNd4. The results show that the optical homogeneity of the Hf:Yb:Nd:LiNbO3 crystals become better with the increase of [Li]/[Nb] ratios. Additionally, compared to the doping of some other ions, the optical homogeneity of Hf:Yb:Nd:LiNbO3 has certain advantages.
3.3. Light-Induced Scattering
The optical damage resistance of Hf:Yb:Nd:LiNbO3 with different [Li]/[Nb] ratios was measured using light-induced scattering exposure flux threshold energy method. The experimental setup of light-induced scattering measurement is shown in Figure 3. An extraordinary polarized light is projected onto the sample and using tunable neutral density filter (NF) to change the incident intensity. Two photo-detectors (D1, D2) are used to receive the intensities of the pump and reference beams (P, R), respectively.
Figure 4 shows the exposure time dependence on the transmitted intensity of Hf:Yb:Nd:LiNbO3 crystals. The relationship between the light-induced scattering intensity (Is) and the transmitted light intensity at the start of incidence (IT0) and at the time of t (ITt) is as follows. Besides, the strength of the light-induced scattering of doped LiNbO3 crystals is described by Rs, which is the ratio of the light-induced scattering intensity (Is) to the incident light intensity (IT0).
Is = IT0 − ITt
Rs = Is/IT0
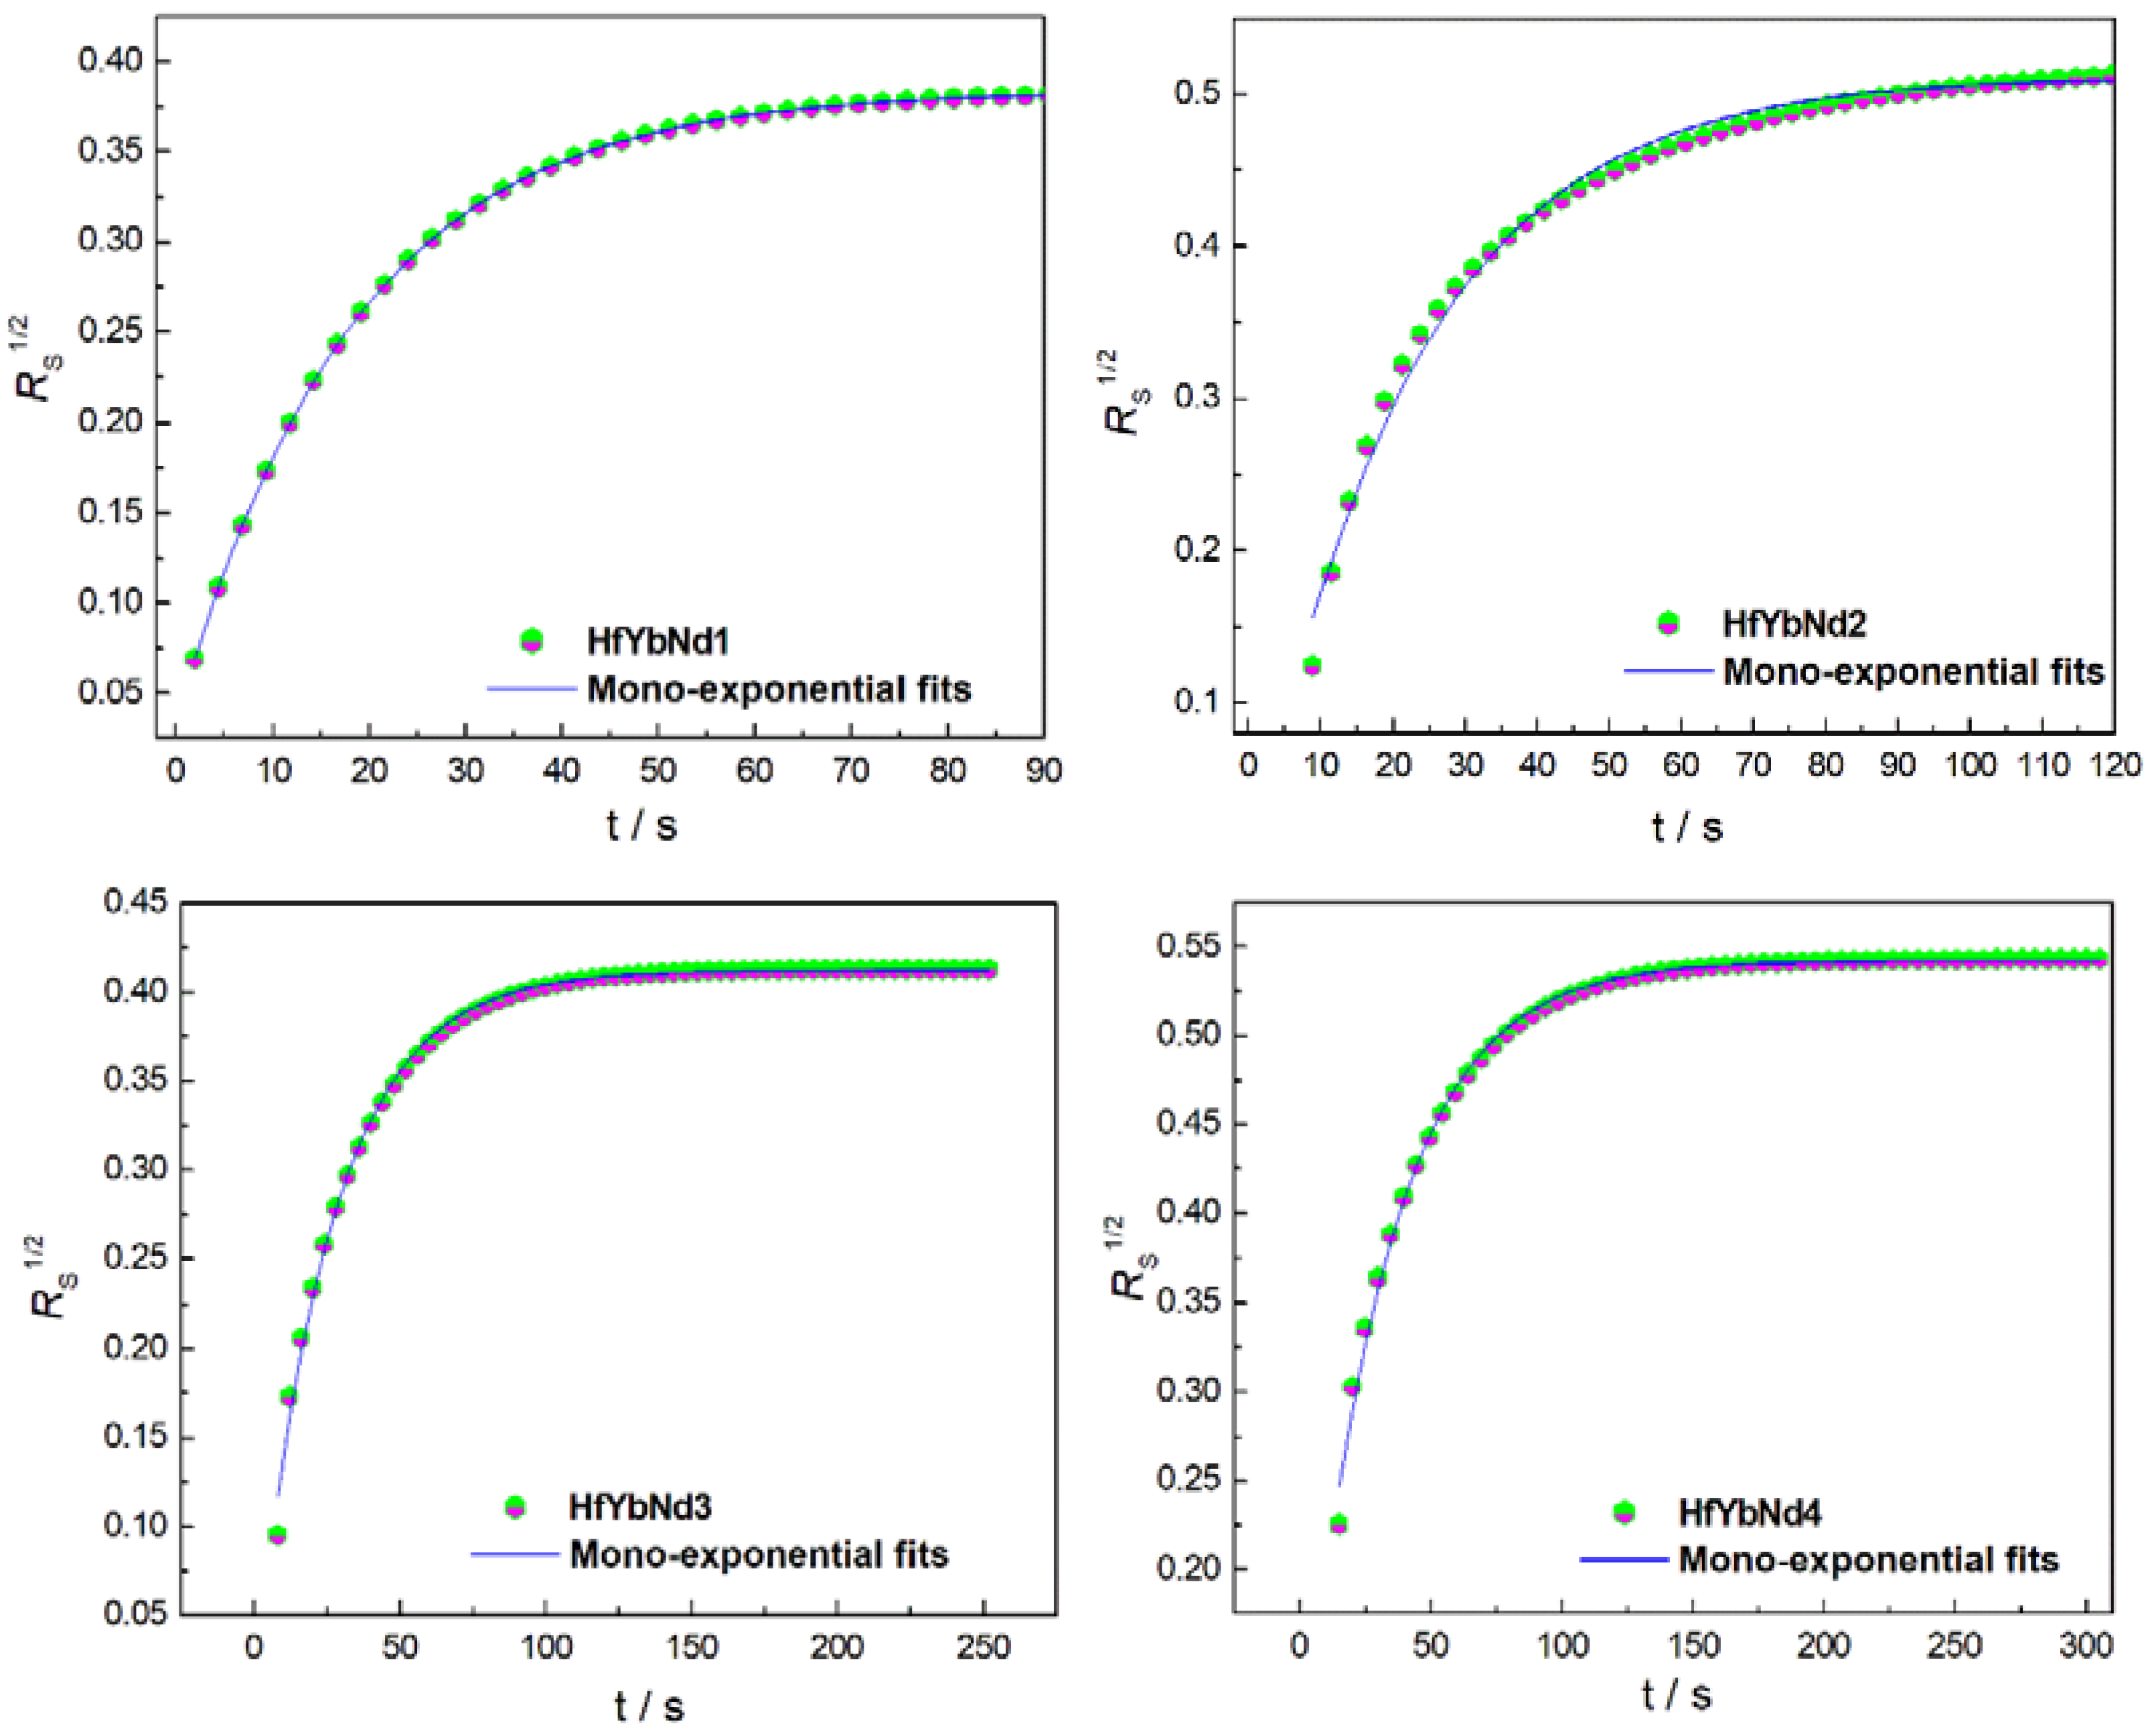
The dependence of the scattering ratio of Hf:Yb:Nd:LiNbO3 crystals on exposure time is shown in Figure 5. Saturation scattering ratio (RS,sat) and scattering time constant is represented by (τ), the intensity of the laser light passing through the lens by (I0), the effective light incident upon the crystal by (Ieff), and the intensity of the light reflected by the crystal by (IR); the approach to incidence of an effective exposure energy flow to the crystal (Er) can be obtained from the following equations [28,29]:
Table 3 shows that the exposure energy is also greatly improved, especially the exposure energy of sample HfYbNd4, which reaches up to 120.74 J/cm2, which is much larger than the other samples. The exposure energy of HfYbNd4 is about 87-fold that of HfYbNd1. It is concluded from the analysis that the sample HfYbNd4 has the best performance to suppress the light-induced scattering. In addition, the measured light scattering parameters were compared with what other scholars have done. It can be seen that the exposure energy of HfYbNd3 has exceeded the group for comparison. This proves that our research is valuable.
The light-induced scattering was caused by the intrinsic defects ( and ) in LiNbO3 crystal. Hf4+, Yb3+, and Nd3+ ions doped into LiNbO3 crystal take up to form ,, and . But there is still a lot of and in Hf:Yb:Nd:LiNbO3 crystal. As the [Li]/[Nb] ratios increase, the will gradually decrease. However, comparing HfYbNd1 with HfYbNd2, the newly added Li+ only replaces a small amount of , so its exposure energy increases slightly. When the [Li]/[Nb] ratio increases to 1.20, intrinsic defects such as and in Hf:Yb:Nd:LiNbO3 crystals are greatly reduced, so that the photorefractive center is reduced. This has a direct impact on the photoelectric effect of the crystal, leading the exposure energy of HfYbNd3 to increase drastically compared with HfYbNd1. As the [Li]/[Nb] ratios increase to 1.38, and in the crystal are completely replaced by Li+. At the same time Hf4+, Yb3+ and Nd3+ ions will also be driven to the Nb site, in the form of , , and . Because of its negative ion, the ability to capture ions will be greatly reduced, and the crystal will remain neutral. Due to the disappearance of the photorefractive center, the photorefractive effect in the crystal will be weakened. Hence, the ability of the crystal to resist light damage is greatly enhanced. Therefore, exposure energy of Hf:Yb:Nd:LiNbO3 crystal is increased by two orders of magnitude via increasing the concentration of Li+, which further leads to the improvement of the optical damage resistance of Hf:Yb:Nd:LiNbO3 crystal.
4. Conclusions
In summary, Hf:Yb:Nb:LiNbO3 crystals with different [Li]/[Nb] ratios (0.946, 1.05, 1.20, and 1.38) were grown. The XRD diffraction pattern proves that Hf4+, Yb3+, and Nd3+ ions enter the crystal by replacing the Li or Nb sites. By analyzing the results of the birefringence gradient test, it is concluded that HfYbNd4 with the smallest birefringence gradient of 3.3 × 10⁻⁵ ∆R/cm−1 has the best optical homogeneity. Obtained by the light-induced scattering experiment, it can be concluded that sample HfYbNd4 has the strongest light-induced scattering, whose exposure energy reaches 120.74 J/cm2. It is approximately 87-fold that of the HfYbNd1 ([Li]/[Nb] = 0.94) in magnitude. These results offer some guidance for developing new materials in the future.
Author Contributions
L.D. designed the experiments; Y.S., X.H. and L.W. performed the experiments; L.D., Y.S., and Y.X. analyzed the data; L.D. and Y.S. wrote the paper.
Conflicts of Interest
The authors declare no conflict of interest.
References
- Subhadra, K.G.; Rao, K.K.; Sirdeshmukh, D.B. Systematic hardness studies on lithium niobate crystals. Bull. Mater. Sci. 2000, 23, 147–150. [Google Scholar] [CrossRef] [Green Version]
- Shur, V.Y.; Akhmatkhanov, A.R.; Baturin, I.S. Micro-and nano-domain engineering in lithium niobate. Appl. Phys. Rev. 2015, 2, 040604. [Google Scholar] [CrossRef]
- Wang, Y.; Jiang, Y.J. Crystal orientation dependence of piezoelectric properties in LiNbO3, and LiTaO3. Opt. Mater. 2003, 23, 403–408. [Google Scholar]
- Kamber, N.Y.; Xu, J.; Mikha, S.M.; Zhang, G.; Liu, S.; Zhang, G. Threshold effect of incident light intensity for the resistance against the photorefractive light-induced scattering in doped lithium niobate crystals. Opt. Commun. 2000, 176, 91–96. [Google Scholar] [CrossRef]
- Kong, Y.; Wen, J.; Wang, H. New doped lithium niobate crystal with high resistance to photorefraction—LiNbO3:In. Appl. Phys. Lett. 1995, 66, 280–281. [Google Scholar] [CrossRef]
- Jiao, Y.; Wang, X.; Zhang, Y.; Bo, F.; Kong, Y.; Xu, J.; Zhang, G. Fabrication of nano-scale domain structures in bulk Mg-doped LiNbO3 crystals. J. Phys. Conf. Ser. 2017, 867, 012018. [Google Scholar] [CrossRef]
- Yamamoto, J.K.; Yamagishi, K. The Growth and Characterization of Sc-Doped LiNbO3 (Crystal Growth of Lithium Niobate and Lithium Tantalate and their Photo-refraction). J. Jpn. Assoc. Cryst. Growth 2017, 20, 267–272. [Google Scholar]
- Qiao, H.; Xu, J.; Wu, Q.; Yu, X.; Sun, Q.; Zhang, X.; Zhang, X.; Zhang, G.; Volk, T.R. An increase of photorefractive sensitivity in In:LiNbO3 crystal. Opt. Mater. 2003, 23, 269–272. [Google Scholar] [CrossRef]
- Zhen, X.H.; Zhao, L.C.; Xu, Y.H. Structure defects and optical damage resistance in doubly doped In:Nd:LiNbO3 crystal waveguide substrates. Cryst. Res. Technol. 2003, 38, 903–907. [Google Scholar] [CrossRef]
- Li, A.; Sun, L.; Zheng, Z.; Liu, W.; Wu, W.; Yang, Y.; Lv, T. Spectroscopic properties of Er3+, in Sc:LiNbO3, crystal. Appl. Phys. A 2007, 89, 1005–1010. [Google Scholar] [CrossRef]
- Jia, C.L.; Li, S.; Song, X.X. Optical and structural properties of Nd:MgO:LiNbO3, crystal irradiated by 2.8-MeV He ions. Appl. Phys. B 2017, 123, 206. [Google Scholar] [CrossRef]
- Demirkhanyan, H.G.; Demirkhanyan, G.G.; Kokanyan, E.P.; Zargaryan, D.G.; Stoffel, M.; Rinnert, H.; Aillerie, M. Green up-conversion luminescence in LiNbO3:Yb3+-Er3+ crystal. Opt. Mater. 2016, 57, 79–84. [Google Scholar]
- Tang, Z.H.; Lin, S.P.; Ma, D.C.; Wang, B. Blue and green upconversion emissions of Zr:Nd:LiNbO3 single crystals. Int. J. Mod. Phys. B 2015, 29, 140–144. [Google Scholar] [CrossRef]
- Ruan, Y.F.; Tsuboi, T.; Du, T.M. Up-conversion of Er3+ ions in Er3+/Yb3+ co-doped YVO4 and LiNbO3 crystals. J. Synth. Cryst. 2004, 33, 524–530. [Google Scholar]
- Mokoena, T.P.; Linganiso, E.C.; Kumar, V.; Swart, H.C.; Cho, S.H.; Ntwaeaborwa, O.M. Up-conversion luminescence in Yb(3+)-Er(3+)/Tm(3+) co-doped Al2O3-TiO2 nano-composites. J. Colloid Interface Sci. 2017, 496, 87–99. [Google Scholar] [CrossRef] [PubMed]
- Sun, T.; Li, A.H.; Xu, C.; Xu, Y.-H.; Wang, R. Energy transfer properties of Nd3+→Yb3+, in Nd:Yb:LiNbO3, crystals. Opt. Laser Technol. 2014, 56, 322–325. [Google Scholar] [CrossRef]
- Sun, X.D.; Shi, H.X.; Luo, S.H.; Jiang, Y.; Meng, Q. Defect structure and optical damage resistance of Hf:Fe:LiNbO3 crystals with various [Li]/[Nb] ratios. Cryst. Res. Technol. 2010, 45, 249–253. [Google Scholar] [CrossRef]
- Li, S.; Liu, S.; Kong, Y.; Deng, D.; Gao, G.; Li, Y.; Gao, H.; Zhang, L.; Hang, Z.; Chen, S.; et al. The optical damage resistance and absorption spectra of LiNbO3:Hf crystals. J. Phys. Condens. Matter 2006, 18, 3527. [Google Scholar] [CrossRef]
- Volk, T.; Maximov, B.; Chernaya, T.; Rubinina, N.; Wohlecke, M.; Simonov, V. Photorefractive properties of LiNbO3:Zn crystals related to the defect structure. Appl. Phys. B 2001, 72, 647–652. [Google Scholar] [CrossRef]
- Liu, B.; Bi, J.; Li, C.; Xu, Y. Growth and photo-damage resistance of Hf:LiNbO3 crystals. J. Chin. Ceram. Soc. 2008, 36, 1586–1589. [Google Scholar]
- Kitamura, K. Stoichiometric LiNbO3 single crystal growth by double crucible Czochralski method using automatic powder supply system. J. Cryst. Growth 2012, 116, 327–332. [Google Scholar] [CrossRef]
- Palatnikov, M.N.; Sidorov, N.V.; Makarova, O.V.; Manukovskaya, D.V.; Aleshina, L.A.; Kadetova, A.V. Concentration threshold effect on properties of zinc-doped lithium niobate crystals. J. Am. Ceram. Soc. 2017, 100, 3703–3711. [Google Scholar] [CrossRef]
- Li, D.; Liu, C.; Yan, Z.; Han, X.; Wang, L.; Tan, C.; Xu, Y. Effect of dopant concentration on the spectra characteristic in Zr4+ doped Yb:Nd:LiNbO3 crystals. J. Rare Earths 2017, 35, 761–766. [Google Scholar]
- Fang, S.; Qiao, Y.; Zhang, X.; Ling, F. Increased optical damage resistance in Ce:Cu:LiNbO3 by doping with Sc2O3 for quasi-nonvolatile holographic storage. Phys. Status Solidi 2010, 204, 833–838. [Google Scholar] [CrossRef]
- Long, S.W.; Ma, D.C.; Zhu, Y.Z.; Lin, S.P.; Wang, B. Effects of Zr4+ co-doping on the spectroscopic properties and yellow light emissions of Dy3+ in LiNbO3 single crystals. Opt. Mater. Express 2016, 6, 3354–3365. [Google Scholar] [CrossRef]
- Bogumił Boleslaw, J.L. A Study of Optical Uniformity of Lithium Niobate and Paratellurite Crystals by the Method of Conoscopy. Acta Phys. Pol. 2015, 127, 84–86. [Google Scholar]
- Zhang, T.; Wang, B.; Zhao, Y.Q.; Fang, S.-Q.; Ma, D.-C.; Xu, Y.-H. Optical homogeneity and second harmonic generation in Li-rich Mg-doped LiNbO3, crystals. Mater. Chem. Phys. 2004, 88, 97–101. [Google Scholar] [CrossRef]
- Sun, X.; Luo, S.; Wang, J.; Shi, H.; Jiang, Y. The threshold effect of incident exposure energy flux for photorefractive light-induced scattering in doped lithium niobate crystals. Opt. Mater. 2009, 31, 1678–1683. [Google Scholar] [CrossRef]
- Dai, L.; Tan, C.; Yan, Z.; Xu, Y. Influence of [Li]/[Nb] ratios (0.85, 0.94, 1.05, 1.20 and 1.38) on dopant occupancy and light-induced scattering of Hf:Yb:Ho:LiNbO3. J. Alloys Compd. 2016, 683, 108–113. [Google Scholar] [CrossRef]
- Dai, L.; Xu, C.; Qian, Z.; Li, J.; Li, D.; Xu, Y. Influence of In3+ ions concentration on the defect structure and light-induced scattering of Ce:Mn:LiNbO3, crystals. J. Lumin. 2013, 134, 255–259. [Google Scholar] [CrossRef]
Figure 1.
The X-ray diffraction pattern of Hf:Yb:Nd:LiNbO3 crystals with different [Li]/[Nb] ratios.
Figure 1.
The X-ray diffraction pattern of Hf:Yb:Nd:LiNbO3 crystals with different [Li]/[Nb] ratios.

Figure 2.
Experimental arrangement for measuring optical homogeneity. P, Polarizer; W, λ/4 wave plate; A, Analyzer; D, Detector.
Figure 2.
Experimental arrangement for measuring optical homogeneity. P, Polarizer; W, λ/4 wave plate; A, Analyzer; D, Detector.

Figure 3.
Experimental setup of light-induced scattering measurement.

Figure 4.
Exposure time dependence on the transmitted intensity of Hf:Yb:Nd:LiNbO3 crystals.

Figure 5.
Exposure time dependence of the scattering ratio of Hf:Yb:Nd:LiNbO3 crystals.


Table 1.
Lattice constant of crystal samples.
| Crystals | A = b/nm | Δa/nm | c/nm | Δc/nm | V/nm3 | ΔV/nm3 |
|---|---|---|---|---|---|---|
| Pure LiNbO3 | 0.51462 | 0 | 1.38524 | 0 | 0.31771 | 0 |
| HfYbNd1 | 0.51478 | 0.00016 | 1.39061 | 0.00537 | 0.31914 | 0.00143 |
| HfYbNd2 | 0.51492 | 0.00030 | 1.39487 | 0.00963 | 0.32029 | 0.00258 |
| HfYbNd3 | 0.51498 | 0.00036 | 1.38591 | 0.00067 | 0.31831 | 0.00060 |
| HfYbNd4 | 0.51435 | −0.00027 | 1.38105 | −0.00419 | 0.31642 | −0.00129 |
Table 2.
The birefringence gradient of Hf:Yb:Nd:LiNbO3 crystals.
| Sample | (∆R/cm−1) | Reference |
|---|---|---|
| HfYbNd1 | 8.4 × 10⁻⁵ | This work |
| HfYbNd2 | 6.8 × 10⁻⁵ | This work |
| HfYbNd3 | 5.7 × 10⁻⁵ | This work |
| HfYbNd4 | 3.3 × 10⁻⁵ | This work |
| Mg:LiNbO3([Li]/[Nb] = 0.946) | 4.8 × 10⁻⁵ | [27] |
| Mg:LiNbO3([Li]/[Nb] = 1.08) | 10 × 10−5 | [27] |
Table 3.
Light-induced scattering parameters of Hf:Yb:Nd:LiNbO3 crystals, illumination light intensity (I), effective incident intensity (Ieff), exposure time(τ), and total exposure energy (Er).
Table 3.
Light-induced scattering parameters of Hf:Yb:Nd:LiNbO3 crystals, illumination light intensity (I), effective incident intensity (Ieff), exposure time(τ), and total exposure energy (Er).
| Crystals | τ (s) | I (mW/cm2) | Ieff (mW/cm2) | Er (J/cm2) | Reference |
|---|---|---|---|---|---|
| HfYbNd1 | 35.48 | 45.51 | 38.89 | 1.38 | This work |
| HfYbNd2 | 71.23 | 158.51 | 135.48 | 9.65 | This work |
| HfYbNd3 | 117.89 | 855.59 | 731.27 | 86.21 | This work |
| HfYbNd4 | 268.16 | 526.8 | 450.25 | 120.74 | This work |
| In(1 mol %):Ce:Mn: LiNbO3 | 62.82 | 1462.56 | 212.51 | 13.35 | [30] |
| In(1.5 mol %):Ce:Mn: LiNbO3 | 128.19 | 1601.51 | 232.70 | 29.83 | [30] |
© 2018 by the authors. Licensee MDPI, Basel, Switzerland. This article is an open access article distributed under the terms and conditions of the Creative Commons Attribution (CC BY) license (http://creativecommons.org/licenses/by/4.0/).
Share and Cite
MDPI and ACS Style
Dai, L.; Shao, Y.; Han, X.; Wang, L.; Xu, Y. Birefringence Gradient and Exposure Energy of Hf:Yb:Nd:LiNbO3 Crystals with Various [Li]/[Nb] Ratios. Crystals 2018, 8, 266. https://doi.org/10.3390/cryst8070266
AMA Style
Dai L, Shao Y, Han X, Wang L, Xu Y. Birefringence Gradient and Exposure Energy of Hf:Yb:Nd:LiNbO3 Crystals with Various [Li]/[Nb] Ratios. Crystals. 2018; 8(7):266. https://doi.org/10.3390/cryst8070266
Chicago/Turabian StyleDai, Li, Yu Shao, Xianbo Han, Luping Wang, and Yuheng Xu. 2018. "Birefringence Gradient and Exposure Energy of Hf:Yb:Nd:LiNbO3 Crystals with Various [Li]/[Nb] Ratios" Crystals 8, no. 7: 266. https://doi.org/10.3390/cryst8070266
Note that from the first issue of 2016, this journal uses article numbers instead of page numbers. See further details here.