Evolution of Interatomic and Intermolecular Interactions and Polymorphism of Melamine at High Pressure


1
Department of Geology & Geophysics, School of Ocean and Earth Science and Technology, University of Hawaii at Mānoa, 1680 East West Road, POST Bldg., Honolulu, HI 96822, USA
2
Hawaii Institute of Geophysics and Planetology, School of Ocean and Earth Science and Technology, University of Hawaii at Mānoa, 1680 East West Road, POST Bldg., Honolulu, HI 96822, USA
3
Center for Advanced Radiation Sources, University of Chicago, Argonne National Laboratory, 9700 S. Cass Ave., Bldg. 434, Argonne, IL 60439, USA
*
Author to whom correspondence should be addressed.
Crystals 2018, 8(7), 265; https://doi.org/10.3390/cryst8070265
Submission received: 1 June 2018
/
Revised: 20 June 2018
/
Accepted: 21 June 2018
/
Published: 27 June 2018
(This article belongs to the Special Issue High-Pressure Studies of Crystalline Materials)
Abstract
:Melamine (C3H6N6; 1,3,5-triazine-2,4,6-triamine) is an aromatic substituted s-triazine, with carbon and nitrogen atoms forming the ring body, and amino groups bonded to each carbon. Melamine is widely used to produce laminate products, adhesives, and flame retardants, but is also similar chemically and structurally to many energetic materials, including TATB (2,4,6-triamino-1,3,5- trinitrobenzene) and RDX (1,3,5-trinitroperhydro-1,3,5-triazine). Additionally, melamine may be a precursor in the synthesis of superhard carbon-nitrides, such as β-C3N4. In the crystalline state melamine forms corrugated sheets of individual molecules, which are stacked on top of one another, and linked by intra- and inter-plane N-H hydrogen bonds. Several previous high-pressure X-ray diffraction and Raman spectroscopy studies have claimed that melamine undergoes two or more phase transformations below 25 GPa. Our results show no indication of previously reported low pressure polymorphism up to approximately 30 GPa. High-pressure crystal structure refinements demonstrate that the individual molecular units of melamine are remarkably rigid, and their geometry changes very little despite volume decrease by almost a factor of two at 30 GPa and major re-arrangements of the intermolecular interactions, as seen through the Hirshfeld surface analysis. A symmetry change from monoclinic to triclinic, indicated by both dramatic changes in diffraction pattern, as well as discontinuities in the vibration mode behavior, was observed above approximately 36 GPa in helium and 30 GPa in neon pressure media. Examination of the hydrogen bonding behavior in melamine’s structure will allow its improved utilization as a chemical feedstock and analog for related energetic compounds.
1. Introduction
The six-membered aromatic ring of s-triazine, particularly when substituted with nitro (-NO2) groups, is a structural motif often found among molecular energetic materials [1]. Melamine, (C3N6H6, 1,3,5-triazine-2,4,6-triamine) is a simple and very stable heterocyclic aromatic molecule based on the s-triazine ring. At ambient conditions melamine forms a crystalline molecular solid with monoclinic symmetry, with space group P21/a, in which intermolecular interactions are dominated by N-H···N hydrogen bonds. At ambient conditions individual melamine molecules are linked to others via eight N-H hydrogen bonds, balanced between donor and acceptor roles. The superstructure of melamine forms corrugated sheets of individual melamine molecules, where kinked planes of molecules are stacked on top of one another. When used as a salt or mixed with resins, melamine is an effective fire retardant, in part due to the release of flame-smothering nitrogen gas when burned [2]. When combined with formaldehyde, melamine forms a very durable thermosetting plastic used in a broad variety of kitchenware and household goods [3]. Despite its stability and flame-retardant properties, melamine is also very closely related, both structurally and chemically, to the widely used molecular explosives RDX (hexahydro-1,3,5-trinitro-1,3,5-triazine), TATB (2,4,6-triamino-1,3,5-trinitrobenzene), and to 2,4,6-trinitro-1,3,5-triazine, a hypothetical new explosive [4] which has not yet been successfully synthesized [5,6]. As a curiously stable cousin of these explosives, melamine is a worthwhile target of investigation in the search for new energetic materials with enhanced safety and stability while maintaining sufficient explosive potential [7].
The primary motivation for studying the high-pressure behavior of melamine ultimately stems from its intermediate position between energetic species and ultra-hard materials; for instance, melamine may be a functional precursor for synthesis of a hypothetical β-C3N4 phase, with a β-Si3N4 structure, predicted to be a super-hard material [8]. Melamine appears to be a good reagent for the high-pressure, high-temperature solid state reactions where carbon nitrides are formed; however, the transformations it exhibits are rather complex, and the products strongly depend on the conditions of pyrolysis and presence of catalysts. Montigaud et al. [9] demonstrated that pyrolysis of melamine at 2.5 GPa and 800 °C in presence of hydrazine leads to formation of a bi-dimensional honeycomb-type structure close to those expected for the theoretical graphitic-like g-C3N4. Similar syntheses successfully producing g-C3N4 and closely related byproducts utilizing pure melamine have also been achieved [8,10]. Synthesis of C-N nanotubes was also observed in high-pressure catalytic pyrolysis of melamine with NaN3-Fe-Ni at 35 MPa and 650 °C [11]. Interestingly, another recent high-pressure pyrolysis experiments at 5 GPa and 800 °C showed formation of a different molecular crystalline monoclinic solid [12].
Given the complexity of coupled high temperature and pressure pyrolysis, a good starting point for understanding the reaction potential of melamine is through a thorough examination of the compression mechanism. One of the first high-pressure studies of melamine to 4.0 GPa utilized infrared spectroscopy [13], and while noting number of important band frequency shifts, it did not report any discontinuous changes in the compression behavior. In contrast, a Raman study to 8.7 GPa in alcohol pressure medium reported discontinuities in the pressure-dependence of some modes, possibly indicating two phase transitions at 2 and 6 GPa [14]. Indeed, a later synchrotron energy dispersive (EDX) powder diffraction study to 14.7 GPa in alcohol pressure medium [15] seemed to confirm the notion of the two low pressure phase transitions, where a new triclinic phase was suggested to form at 1.3 GPa, and transform to an orthorhombic polymorph above 8.2 GPa. The resolution and sensitivity of the EDX experiments, however, were not sufficient to constrain the structures of the new phases, as less than ten indexable diffraction peaks were observed. Recently, Liu et al. [16] carried out a Raman spectroscopy experiment with melamine powder without pressure medium to 25 GPa, but did not confirm any of the earlier reported discontinuities. A soft mode behavior was observed for one of the N-H vibrations, and N-H vibration peaks gradually disappeared above 10 GPa. A detailed Raman, far-IR, and angular-dispersive X-ray diffraction study conducted by Galley et al. reported three potential phase transitions of powdered melamine with KBr as a pressure-transmitting medium, two of which were observed previously [15,17], with an additional high-pressure phase forming at 16 GPa. As with previous spectroscopic studies, it was observed that the modes associated with N-H stretching, particularly at 3116 and 3325 cm−1, broaden significantly with pressure. This study also documented irreversible amorphization of the sample, attributed to weakening of the internal bonds, which could foster polymerization of the sample.
In each of these previous experiments, the effects of non-hydrostatic stress, hydrogen-bond interactions between melamine and polar solvent-based pressure media, or inter-grain interactions exist. In order to re-examine the details of compression behavior of melamine and reconcile the different results of previous studies we have conducted a combined X-ray diffraction and Raman spectroscopy investigation using high quality single crystal samples in quasihydrostatic noble gas pressure transmitting media.
2. Materials and Methods
The high-pressure X-ray diffraction and Raman spectroscopy experiments took place over several experimental sessions between 2010 and 2015, where experiments were conducted at the Advanced Photon Source (APS) at Argonne National Laboratory. Data were collected at the 13-IDD and 16-IDB beamlines of GeoSoilEnviro-CARS (GSECARS) and the High Pressure Collaborative Access Team (HPCAT), with gas-loading of diamond anvil cells and Raman measurements conducted at GSECARS [18]. Prior to each experiment, melamine powder of >99% purity was recrystallized from saturated aqueous solution, and crystals approximately 10 × 30 × 30 μm in diameter were loaded into symmetric type diamond anvil cell equipped with conical Boehler-Almax type anvils and backing plates [19]. These crystals were accompanied by chips of ruby as a pressure calibrant, with helium (2010) or neon (2015) as a pressure transmitting medium. Diffraction data were collected with Kickpatrick–Baez mirror-focused monochromatic X-rays (λ = 0.3344 at GSECARS and 0.4066 Å at HPCAT), focused onto the sample crystals. At each pressure point, the sample was rotated during X-ray exposure around the ω-axis of the instrument, with diffraction images collected at three detector positions, each perpendicular to the X-ray beam, and differing by 7 cm detector translation. For the 2015 experiment, the internal pressure was changed without removing the cell from the instrument, using a gas-driven membrane device with a Druck PACE 5000 electronic valve controller. Pressure was measured by the ruby fluorescence method [20] during pressurization and after a complete diffraction data set was collected.
Diffraction images collected during each experiment were analyzed using the ATREX IDL software package [21], where peak intensities were corrected for Lorenz and polarization effects. Peaks were indexed using cell_now [22], while the orientation matrix was refined and unit cell parameters were obtained using RSV [21]. Integrated peak intensities were used for the structure refinement. Refinements were conducted using SHELXL [23] with isotropic atomic displacement parameters and full site occupancies for all atoms. Amino hydrogens were constrained using the riding hydrogen model of AFIX 94, preventing the H-N-H angle from varying from 120°, but allowing some variance in the N-H bond distance and no limitations on the rotation angle of each amino group. Due to limitations on accurately reporting donor-hydrogen distances determined by X-ray diffraction, donor-acceptor distances are primarily used to gauge intermolecular interactions. No additional constraints or restraints were utilized to fix bond distances or the character of the central triazine ring. Equation of state results, such as bulk modulus and its pressure derivatives (K and K′), as well as linear compressibilities were determined with EOSFit7-GUI [24], fitting experimental unit cell values with a third-order Vinet equation of state [25,26]. Additional analysis, including hydrogen bond geometries and Hirshfeld surface generation, was conducted using Olex2 [27] and CrystalExplorer [28], respectively.
For Raman experiments, a separate symmetric Princeton-type diamond anvil cell was prepared. We used low-fluorescence, modified brilliant cut diamond anvils with 0.3 mm culets, mounted on WC backing plates. The gasket preparation technique was identical to the one used for the X-ray diffraction experiments. One good optical quality, single crystal of melamine, approximately 15 × 50 × 50 μm, and two small ruby spheres were loaded in neon pressure medium. Raman spectra were collected over a total spectral range of 250–3700 relative cm−1 with a holographic 1800 gr/mm grating, utilizing the green line of a 200 mW Ar+ laser (λ = 514.532 nm) for excitation, and a Horiba Triax 550 Spectrograph, equipped with a liquid nitrogen-cooled Princeton Instruments CCD detector, at the GSECARS Raman Spectroscopy Lab. Sample Raman spectra were collected every 3–5 GPa from 1 GPa up to 33.1(1) GPa in three separate spectral ranges of 250–1200 relative cm−1, 1400–1900 relative cm−1, and 3100–3650 relative cm−1. Raman data were processed in Spectragryph 1.2.8 [29], where individual adaptive baseline subtractions were applied to each spectrum to better compare between pressure steps.
3. Results
3.1. X-ray Diffraction
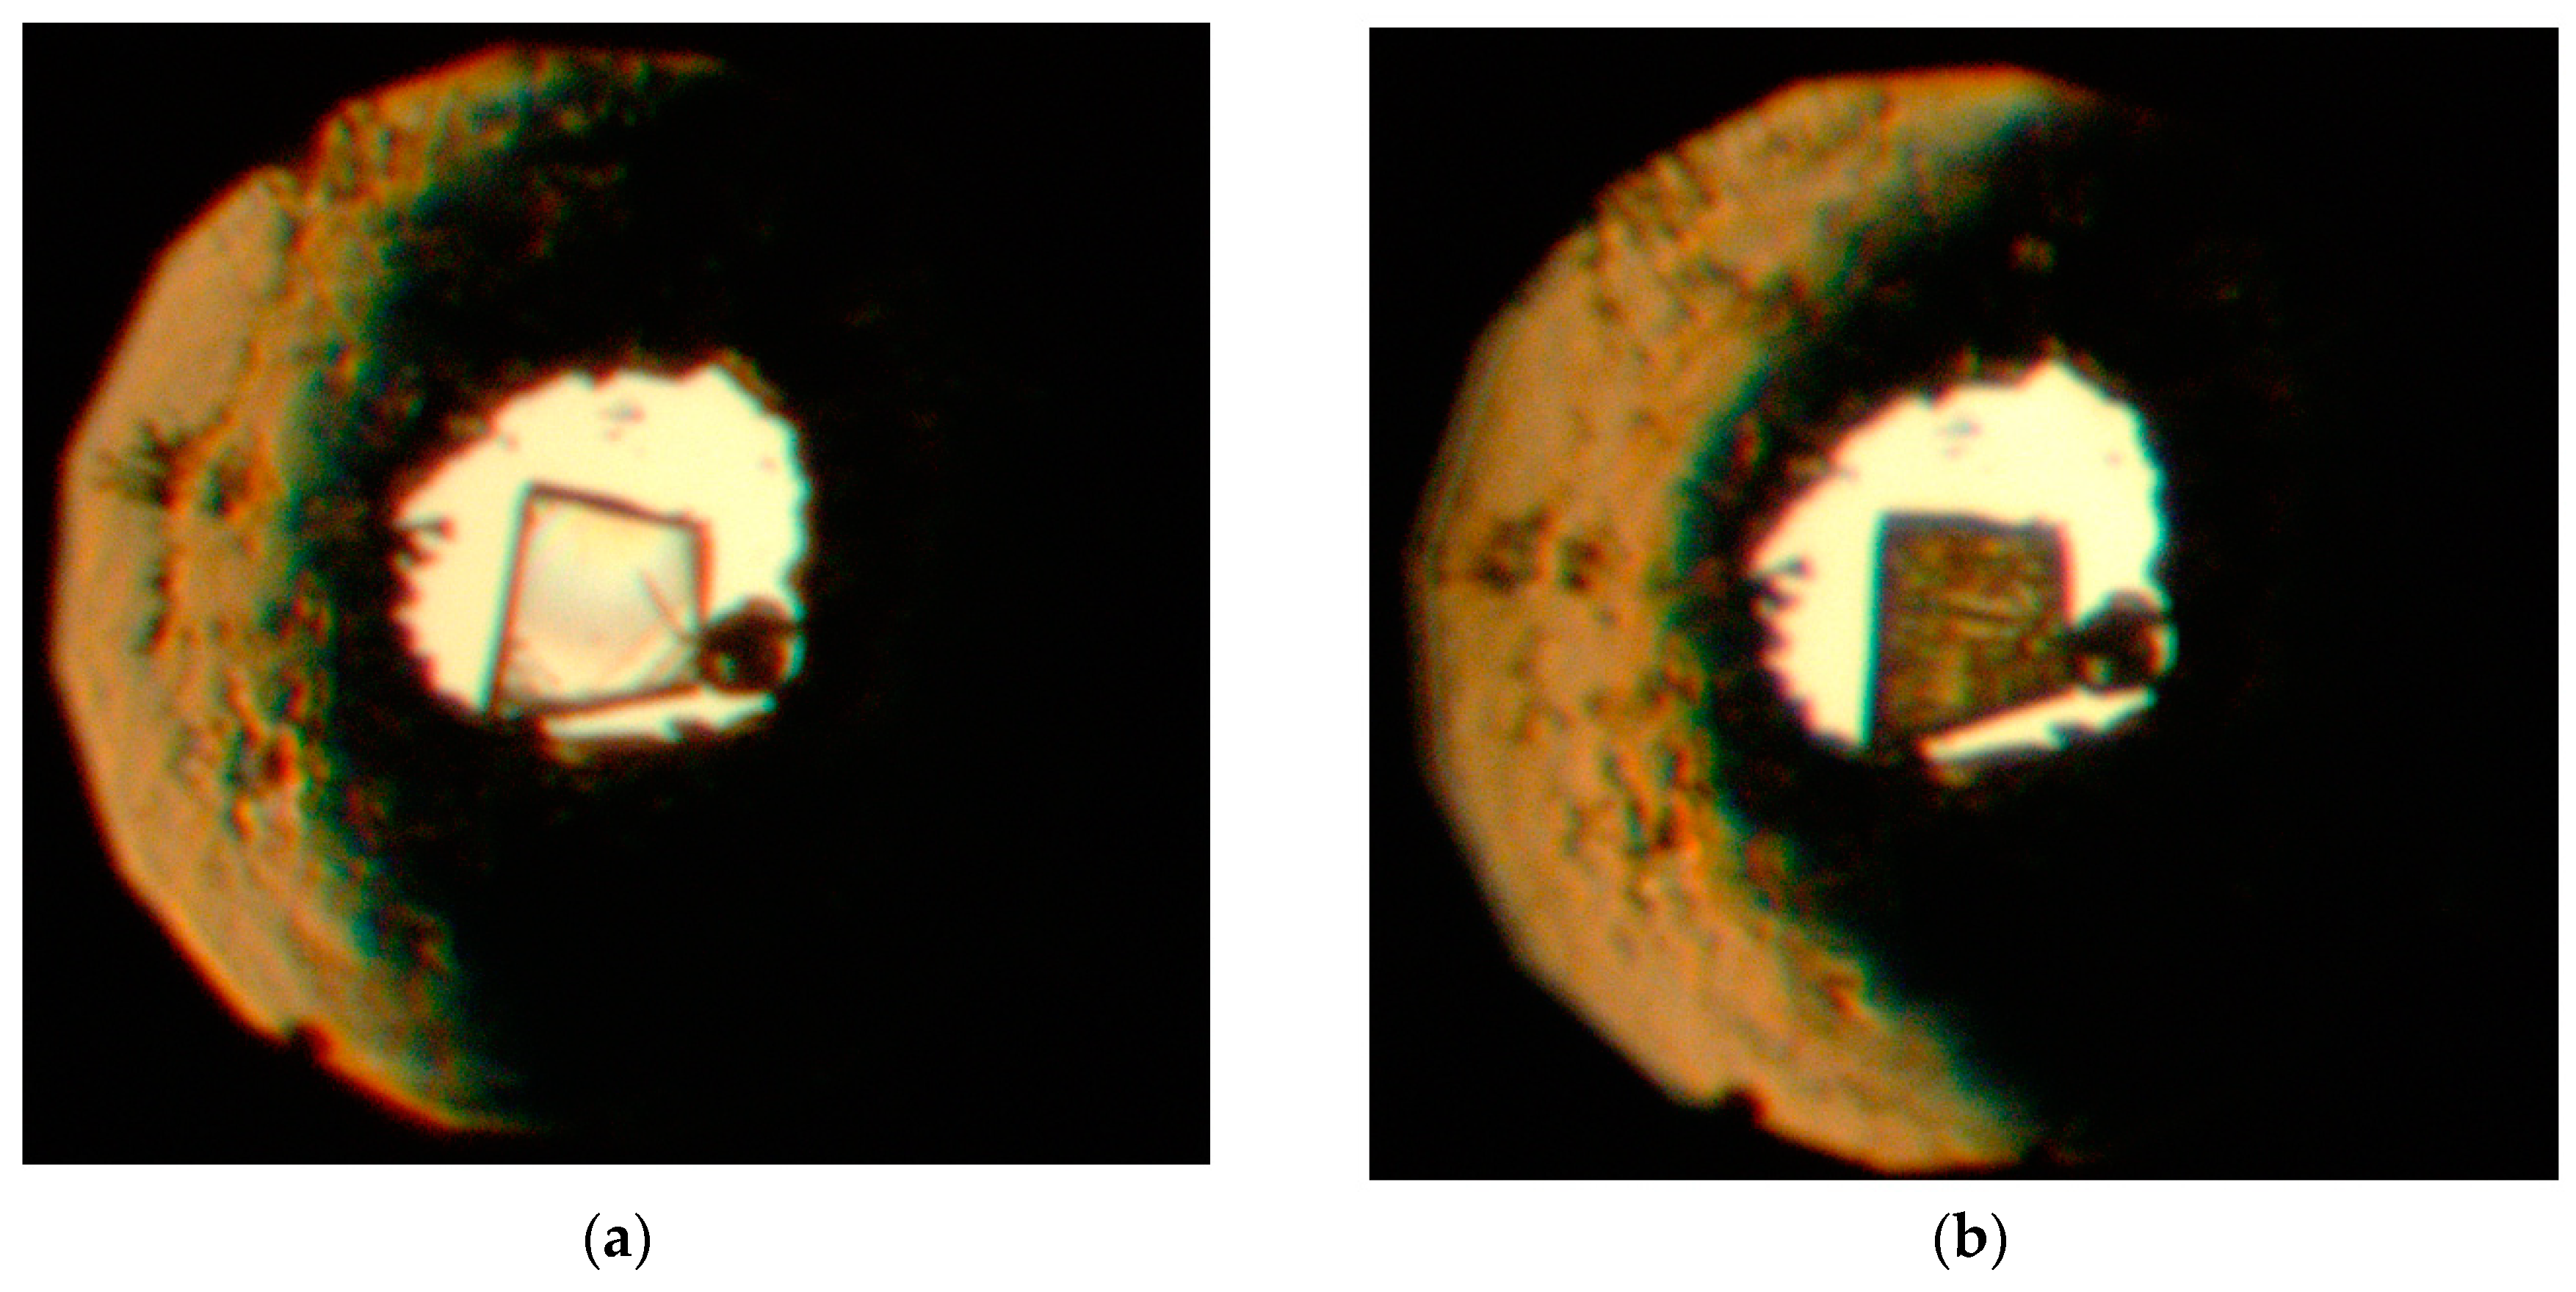
After initial compression and gas-loading with helium to 0.96(5) GPa, the unit cell parameters of melamine were a = 10.410(6) Å, b = 7.465(2) Å, c = 7.086(6) Å, and β = 113.89(4)° in the space group setting of P21/a. Multiple data sets, between 2010 and 2015, provide nineteen pressure points where the compressional effects on the structure of melamine was observed. All nineteen data points were used for equation of state fitting, whereas seventeen were of sufficient data quality to permit hydrogen bonding geometry analysis. The crystal structures obtained during the compression pathway show little deviation in the overall molecular geometry with pressure. At 0.96(5) GPa, each individual melamine unit is connected to its neighbors via eight N-H···N hydrogen bonds, as is the case at ambient pressure, forming layers of melamine molecules, approximately parallel to (010), that are hydrogen bonded within, and also linked to neighboring layers (Figure 1a). Additionally, in neighboring layers, there are pairs of melamine molecules whose central rings lie within parallel planes and overlap. Neighboring pairs of molecules are offset by 33.8(9) degrees, forming the corrugated structural motif. With each pressure step up to 36.2(1) GPa, full structure refinement was conducted, initially based on the structure of melamine reported from ambient pressure neutron diffraction experiments [30]. Selected data collection and refinement information from initial and final pressure steps for this structure are listed in Table 1. The evolution of unit cell parameters with pressure is listed in Table 2. Equation of state and linearized axial compressibilities are depicted in Figures 4 and 5, with the accompanying F-f plot depicted in Figure A1. Additional information, including fractional atomic coordinates, symmetry operators, and selected bond lengths and angles are listed in Appendix A Table A1, Table A2, Table A3 and Table A4. On compression beyond 36.2(1) GPa in helium or 31.8(1) GPa in neon, a reversible phase transition to a twinned triclinic polymorph (where a = 6.08(1) Å, b = 7.267(2) Å, c = 7.82(1) Å, and α = 78.25(4)°, β = 80.1(2)°, γ = 80.48(4)° at 38.9(1) GPa) was seen, with pronounced changes in the diffraction pattern, as shown in Figure 2. This transition was reversible, however, further compression past approximately 45 GPa in helium resulted in irreversible amorphization, accompanied by loss of diffraction signal and easily identifiable change of the color and opacity of the crystal (Figure 3).
3.2. Equation of State and Bond Compressibility
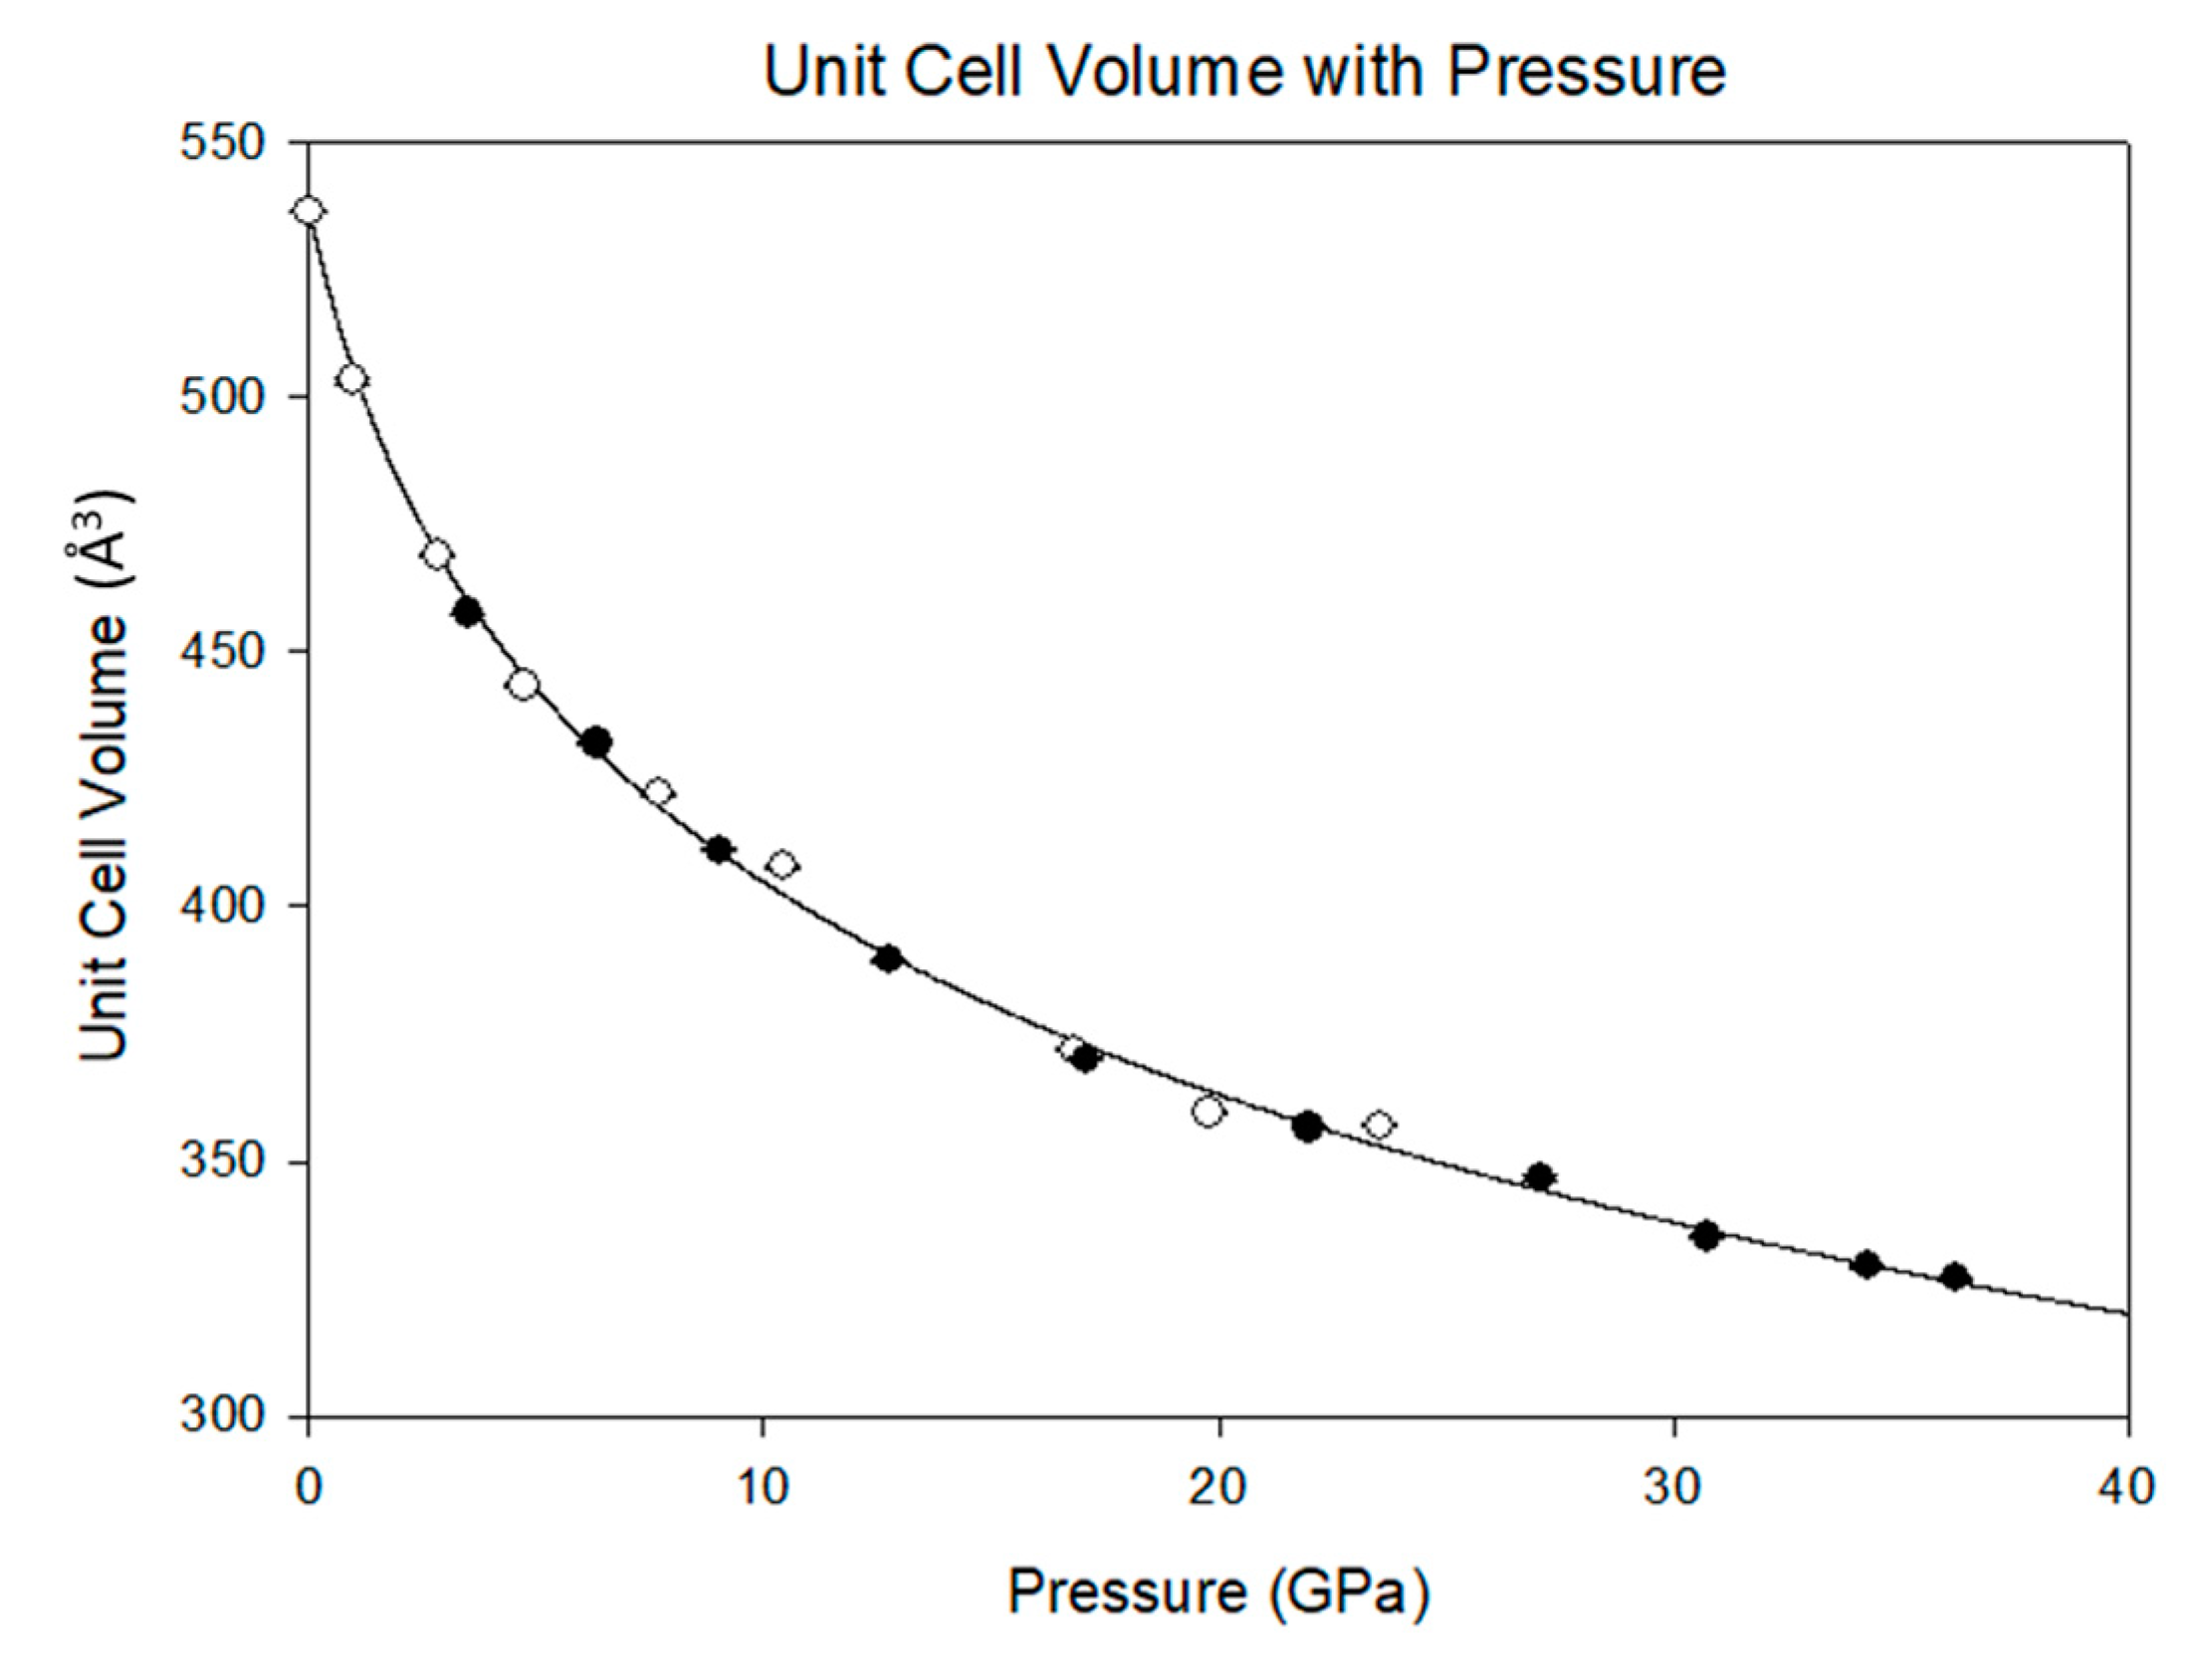
Previously, Ma et al. [15] documented the P-V equation of state of melamine, but only to approximately 15 GPa. Although that study describes a transformation to a triclinic structure below 2 GPa, there exist similarities between that study and the current results. In both cases, there is a precipitous drop in the unit cell volume below 5 GPa. However, in the present study, there is no evidence of a phase transformation. Rather, there is a smooth and continuous reduction in the unit cell volume that is well described by the Vinet equation of state [25,26].
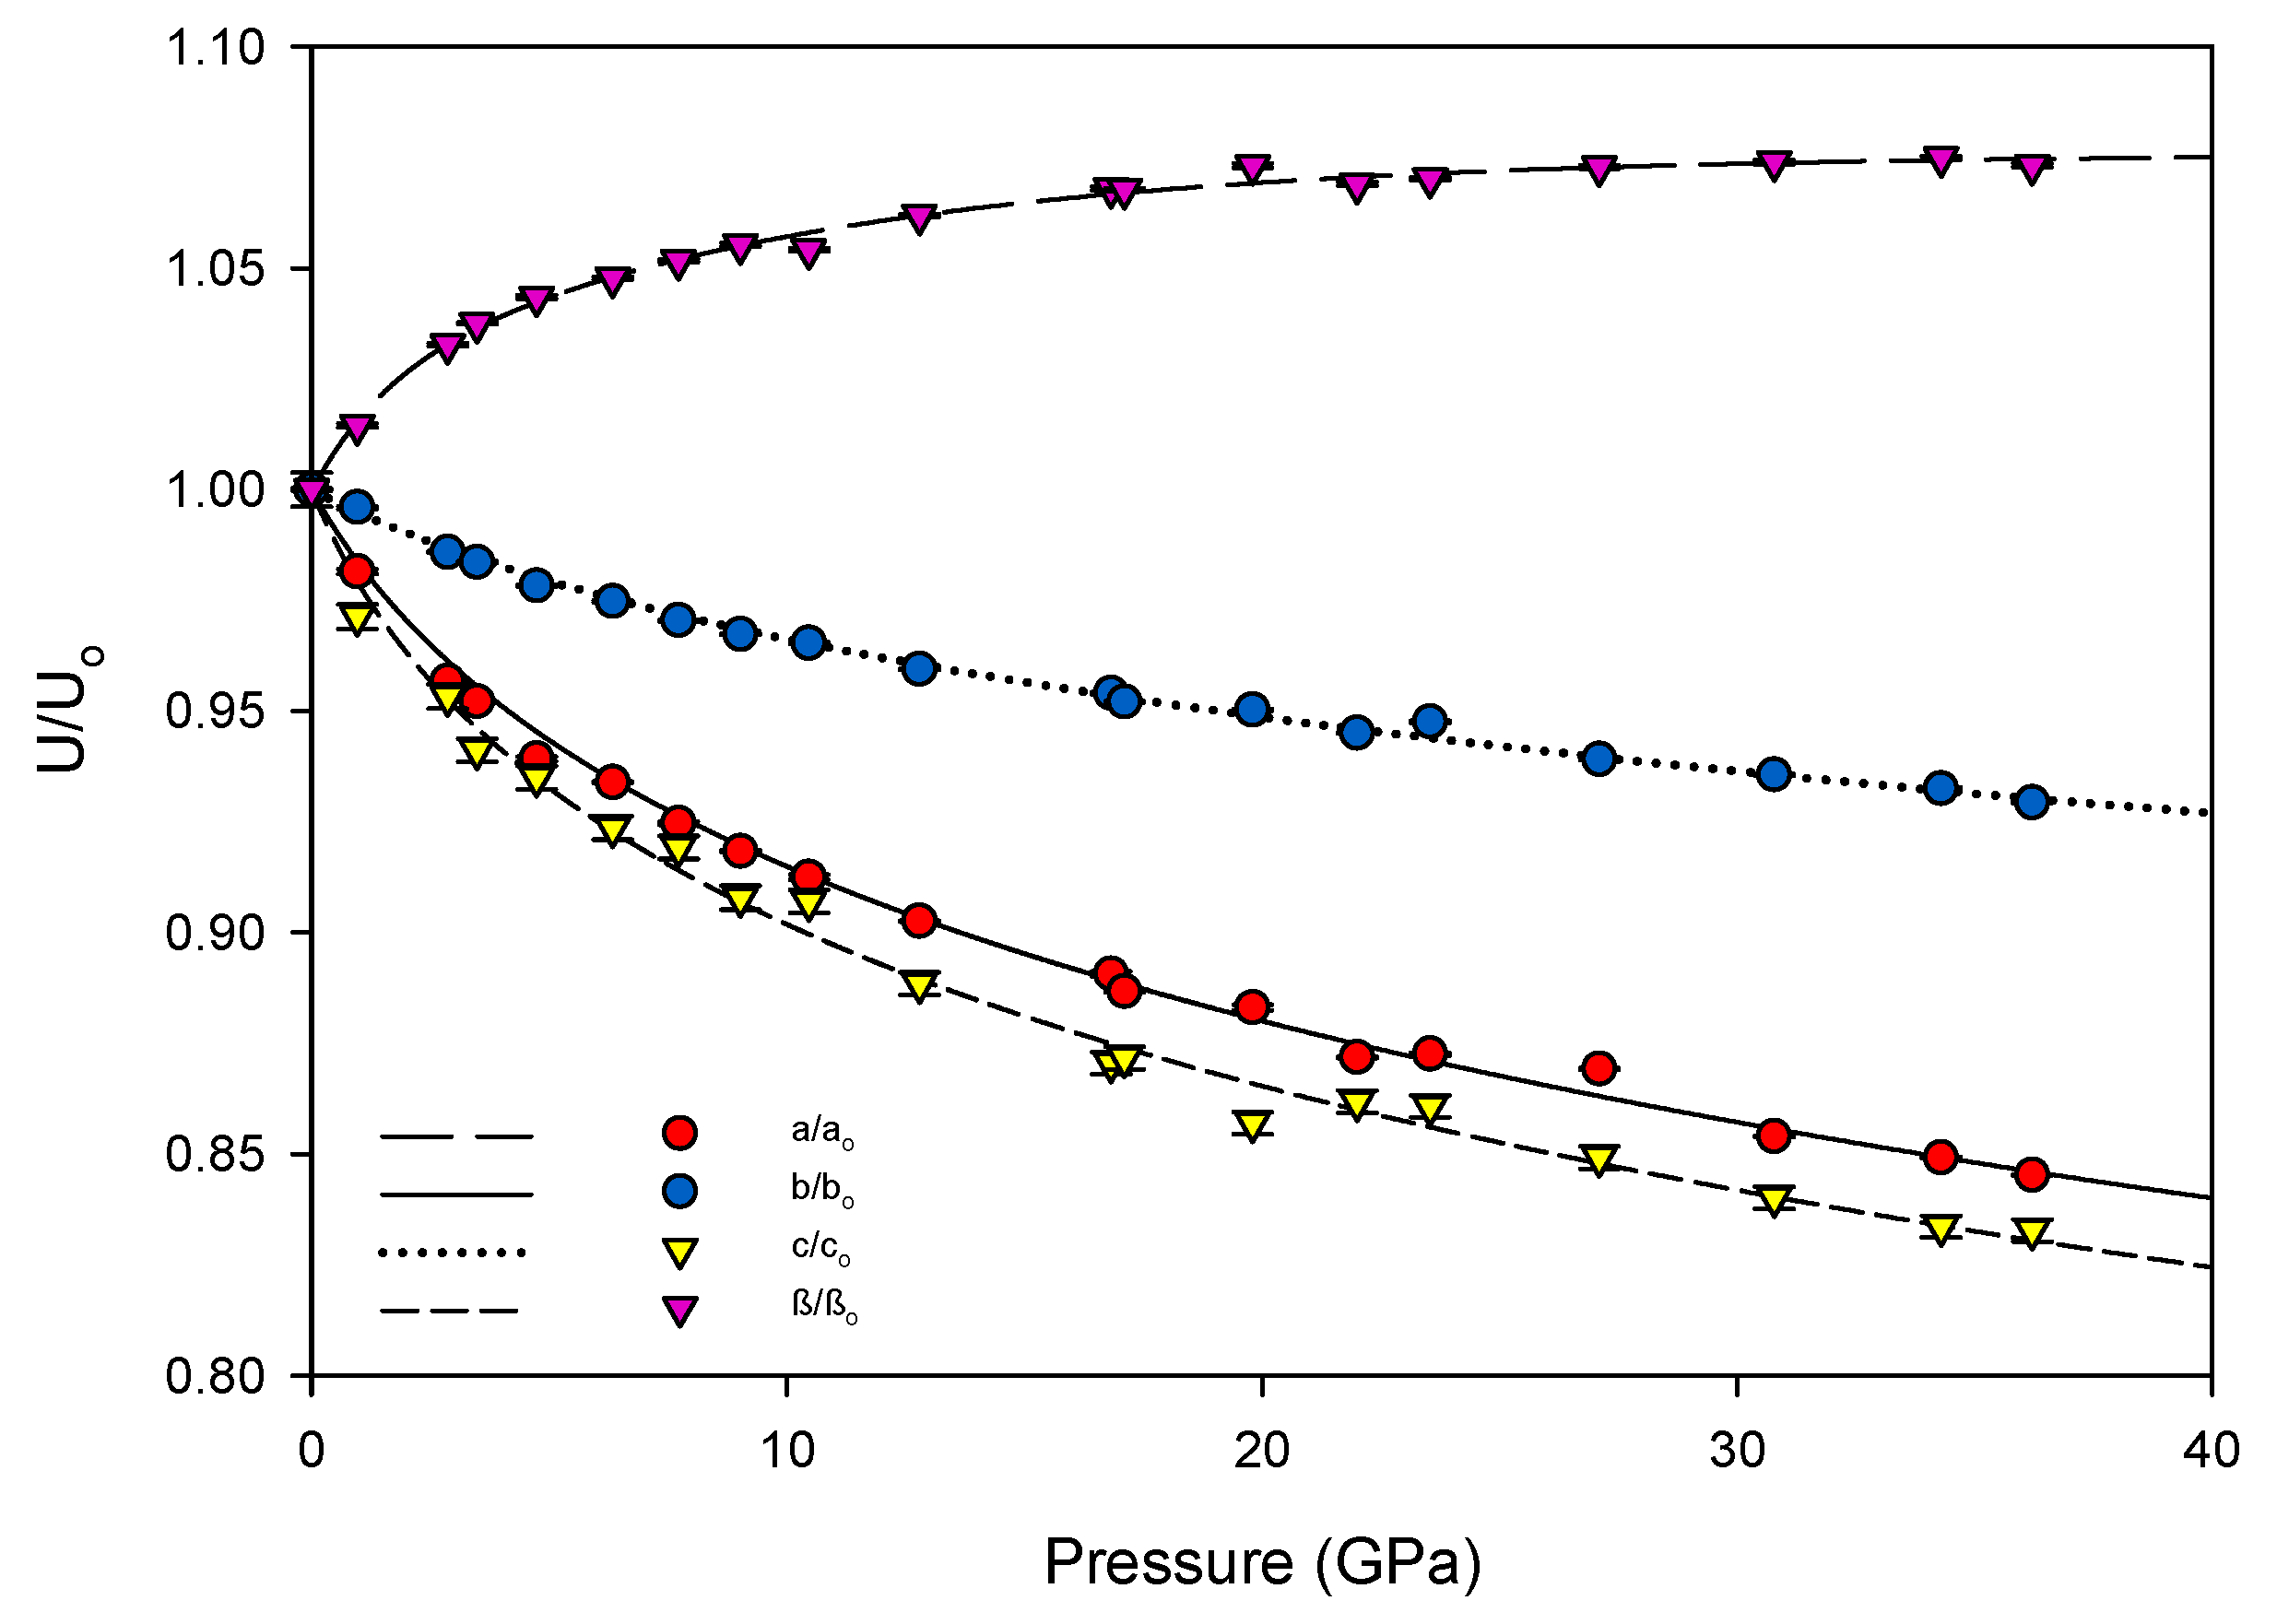
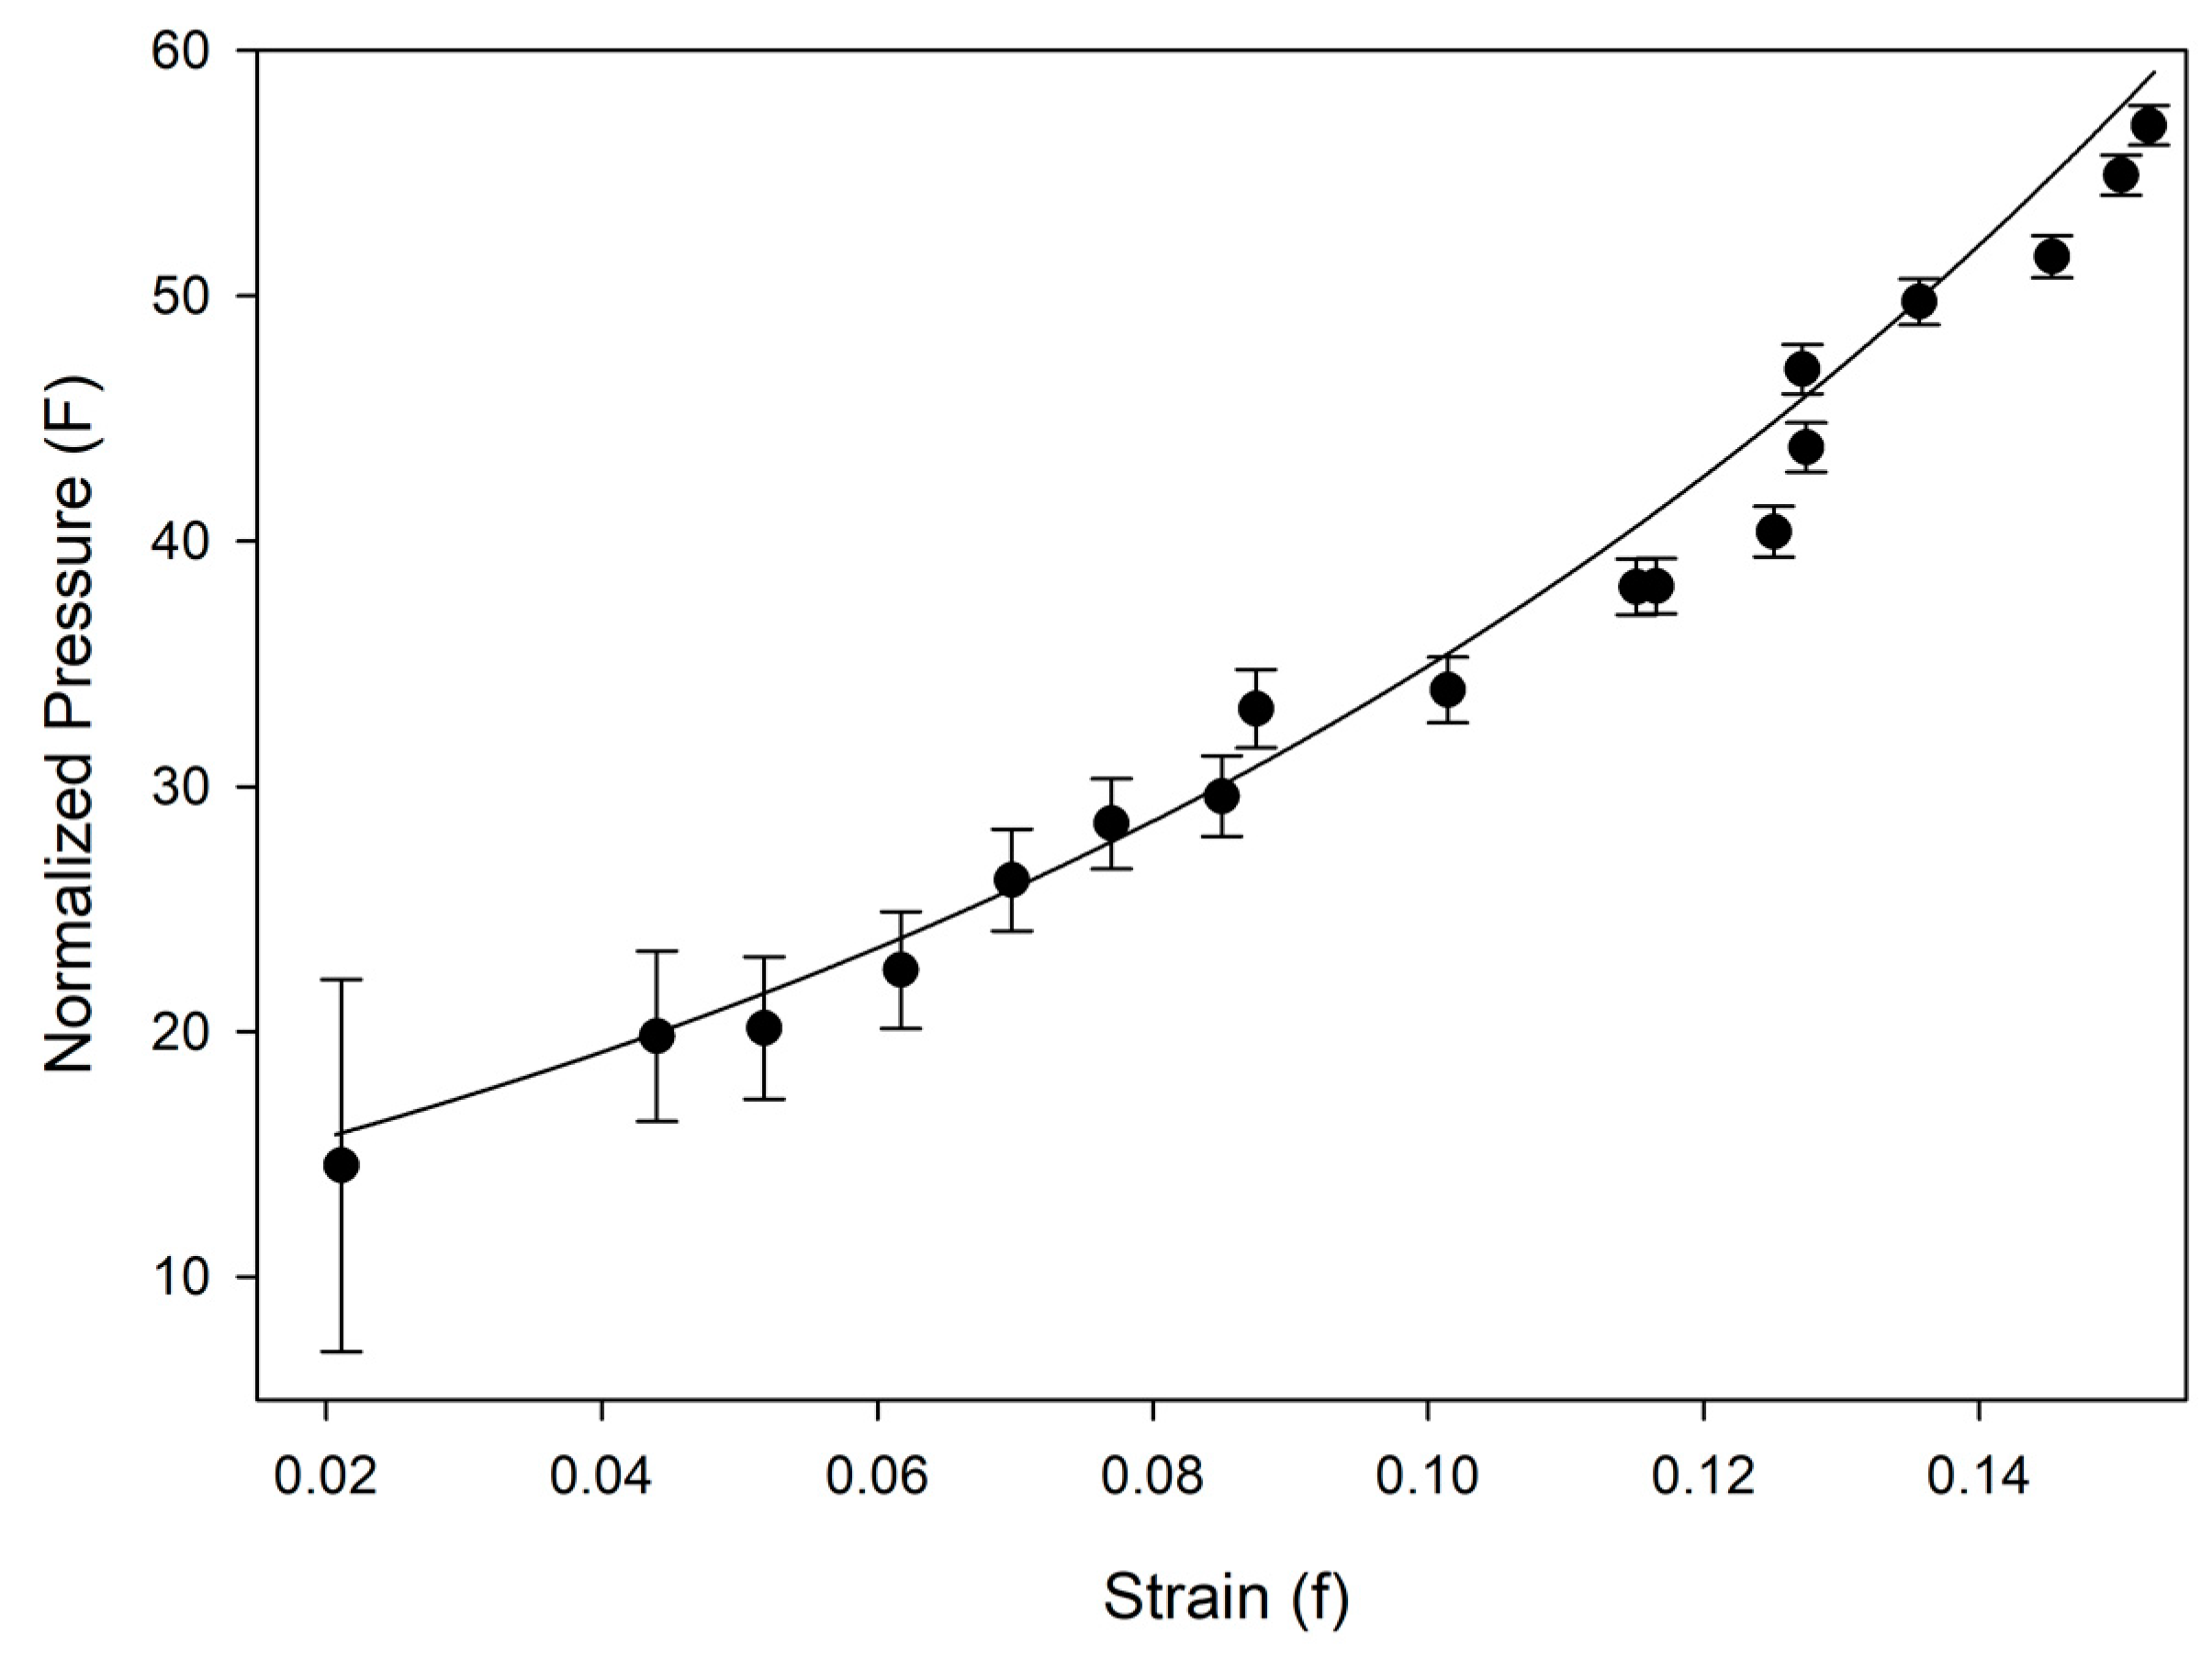
where , V0 is the initial cell volume, K0 is the isothermal bulk modulus, and K′ is its derivative when the pressure is equal to zero. The output of this equation of state, with V0 fixed to the ambiently determined value of 536.7(2) Å3, is K0 = 12.9(8) GPa, and K′ = 7.4(3). The linear axial compressibilities (defined as βl0 = 1/3Kl0) [31] were determined using a linearized version of the Vinet equation. The increase of the unit cell’s β angle was well-described by a three-parameter exponential rise-to-maximum function. The progression of each of these values with pressure can be seen in Figure 4 and Figure 5. By 36.2(1) GPa the unit cell volume has experienced a 40 percent collapse, driven primarily by the shortening of the a and c axes. As each axis shrinks the β angle opens, reflecting the shift of molecules with respect to one another, rising to a predicted maximum of 120.7(1) degrees at 40 GPa.
When comparing the bulk moduli other common six-membered ring molecules such as benzene (5.5 GPa) or aniline (5.44 GPa), as well as extended structures with ring motifs such as graphite (33.8 GPa), the compressibility of melamine is closer to the former [32,33,34]. This can be readily explained by the type of dominating intermolecular interactions and arrangement of molecules with respect to each other, where graphite is held more rigidly in covalently-bonded planar sheets, while individual benzene or aniline molecules are not covalently bonded to their neighbors. Both polymorphs of aniline also form extended stacked layers held together by hydrogen bonding, where its singular amino group participates in N-H···N and N-H···π hydrogen bonds [33,35]. Individual aniline units do not experience significant structural or energetic modification in pressure, yet its hydrogen bonds decrease in length to the point of destabilization [35]. Benzene does not share hydrogen atoms below a theorized point of metallization [32,36], and π-π interactions act as the driving intermolecular interaction with increasing pressure. For solid benzene-III, a recent theoretical study [36] suggested that at 50 GPa, despite an almost two-fold reduction in unit cell volume, the intramolecular bond lengths stay basically unchanged. A similar situation appears to occur with melamine: while the intramolecular deformation is minimal, intermolecular hydrogen bonds accommodate pressure changes within the crystal without departing from the original space group and basic structure.
In comparison to energetic materials, the bulk modulus of melamine is analogous to or slightly less than β-HMX (12.4 GPa), α-RDX (13.9 GPa), and TATB (16.2 GPa) [37]. Interestingly, these values were obtained using powder X-ray diffraction techniques in methanol-ethanol-water, argon, and hexane pressure media, respectively [38,39,40]. The use of powders, as well as non-hydrostatic and non-inert pressure media likely introduces similar uncertainties and irregularities as those encountered with prior high-pressure experiments of melamine. Significant variations in compressibility for these compounds, including elastic constants and phase transformation behavior, have been shown to greatly depend on the hydrostatic character of the pressure media [41,42]. Hydrogen bonding has also been demonstrated to be the driving interaction in crystalline networks of RDX and TATB, where intermolecular hydrogen bonding networks could be disrupted by participating polar-solvent pressure media or inter-grain boundaries [43]; when compressional hydrostaticity is ensured, highly energetic molecules like TATB have been shown to remain crystalline past 100 GPa [44].
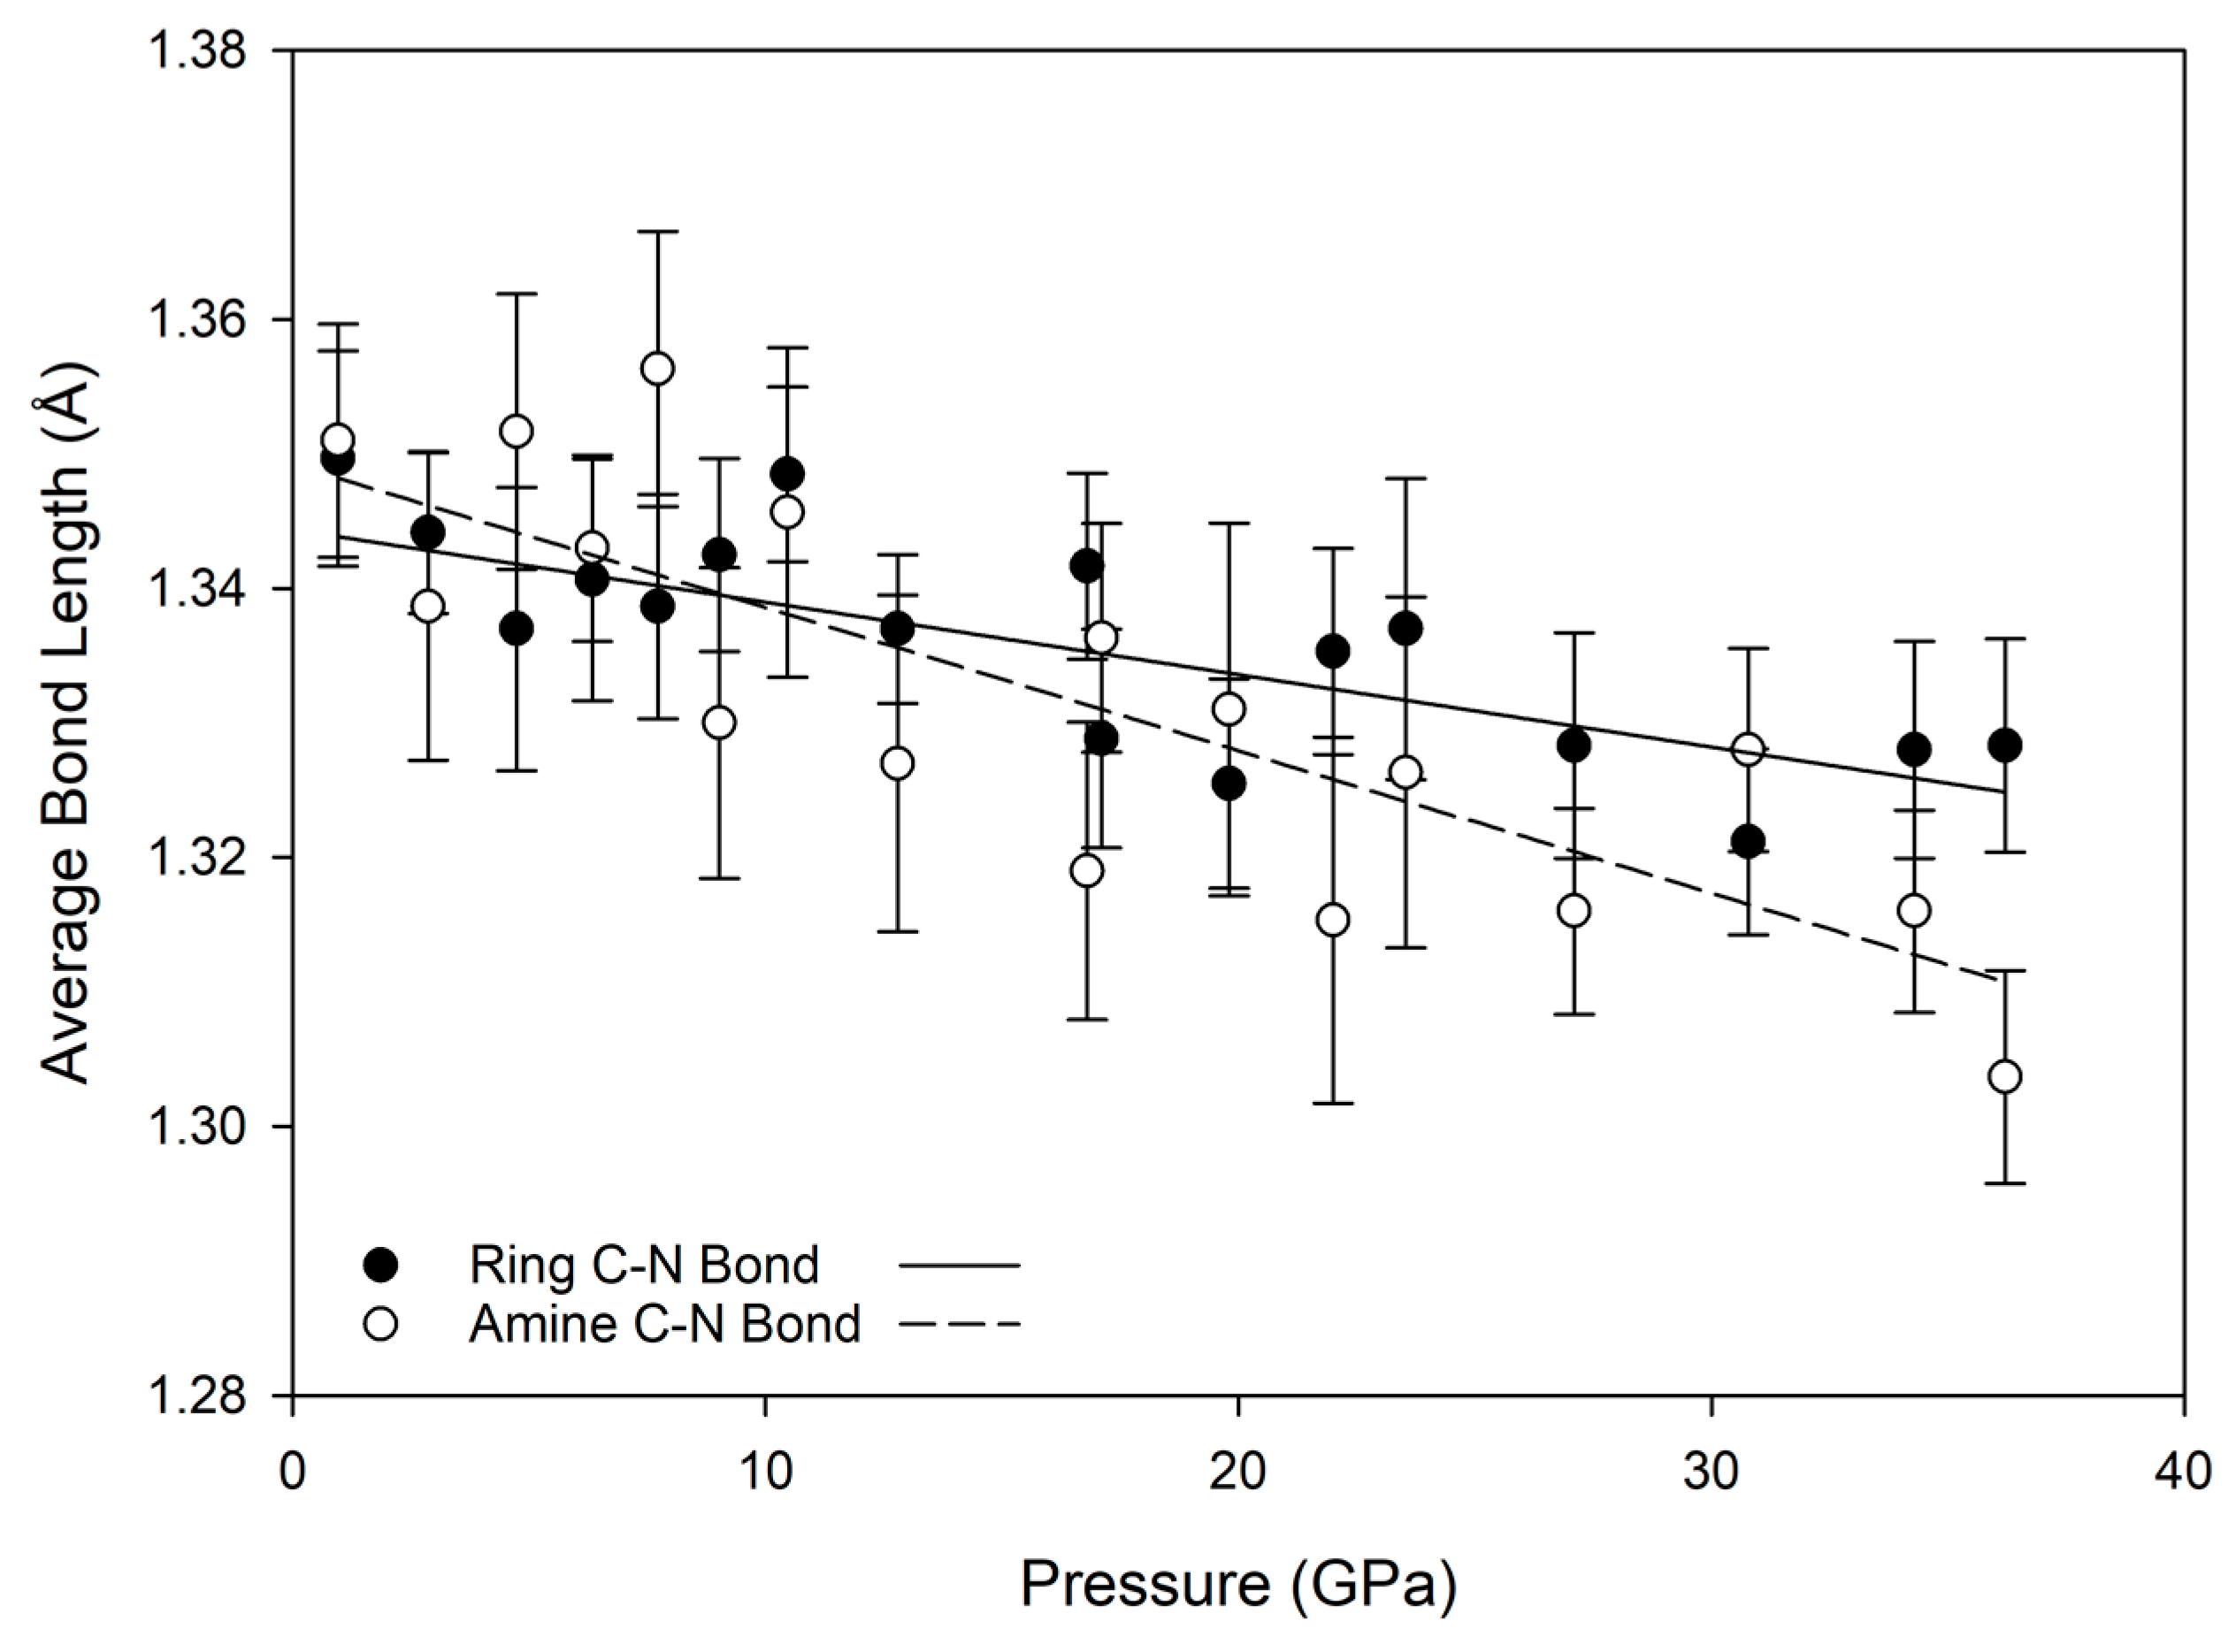
For inorganic substances and minerals, a very common notion for understanding a compression mechanism is the Rigid Unit Mode model, in which it is assumed that each subunit (i.e., tetrahedra or octahedra) is very stiff compared to the framework in which it resides [45]. As a result, rotation of whole units is preferable to alteration of bond lengths within a unit. Although it is an organic molecule, within this frame of reference melamine subunits (primarily the aromatic s-triazine ring and amine nitrogen) can be considered as the inflexible subunit, and are relatively unchanged with pressure. In contrast, intermolecular hydrogen bonds greatly compress and shift position with pressure, and individual NH2 units have some ability to rotate, in order to accommodate pressure changes and avoid repulsive H-H interactions. This is evident from the relative lack of change in carbon-nitrogen bond lengths with substantial increases in pressure, as shown in Figure 6; for both ring and amine carbon-nitrogen bonds, the bond length decrease is less than about 0.05 Å, while the donor-acceptor lengths of hydrogen bonds decrease by nearly 0.5 Å over the same compression path.
The compressional behavior of melamine from the perspective of an individual molecular unit can also be visualized through Hirshfeld surfaces. This method of crystal analysis condenses properties such as interatomic angles and distances, crystal packing schemes, and intermolecular interactions into models that can be easily and qualitatively interpreted, yet are derived from quantitative analysis [46,47]. Hirshfeld surfaces are differentiated from other molecular surface representations such as electron density maps or van der Waals surfaces by accounting for both a molecule and its proximity to its nearest neighbors, making it well-suited for the analysis of molecular crystals. Two surfaces, the shape index and normalized contact distance (dnorm), are particularly useful for describing the packing of molecular crystals such as melamine.
The shape index is a Hirshfeld surface that identifies concave or convex areas of a molecule’s surface based on charge density. Red areas indicate concave areas, whereas blue indicates convex. For the purpose of examining compressional behavior, any change in the intramolecular geometry is distinguishable by changes in color. For melamine, the relative lack of change between low and high pressure is apparent (Figure 7), mirroring the small changes in covalent bond lengths and overall inflexibility of the aromatic component with pressure.
Hirshfeld surfaces of the normalized contact distances tell the other half of the story, and are shown in Figure 8; this parameter describes the internal (di) and external (de) contact distances of the Hirshfeld surface to the nearest atomic nucleus, normalized by the van der Waals (vdW) radii of the atoms involved. The result is a surface where intermolecular contacts longer than the sum of the atoms’ vdW radii are displayed in blue, and contacts shorter than the vdW radii are displayed in red. At low pressures, this highlights the points of contact for the N-H···N hydrogen bonds, where the bond contracts the intermolecular distance. As pressure increases, contact points with distances shorter than the vdW radii appear on the previously non-interacting amine nitrogen and atoms of the central ring.
3.3. Hydrogen Bonding Behavior with Pressure
At ambient and low-pressure conditions, individual melamine molecules are linked with neighbors through pairs of complementary hydrogen bonds connecting amino hydrogens exclusively to ring-based nitrogen atoms. In previous ambient-pressure X-ray and neutron diffraction studies, it was observed that of the six symmetry independent hydrogen atoms in NH2 groups, only four strongly participate in hydrogen bonding [30]. The two remaining hydrogen atoms are subject to hindrances that prevent strong hydrogen bonding interactions, and are denoted in this study as H3 and H5. In the case of H5, the hydrogen atom is in close contact with another H5 on a neighboring molecule, and repulsive interaction occurs as distance decreases. For H3, steric hindrance prevents it from being sufficiently close to a ring nitrogen acceptor atom, allowing only weak interaction with a NH2 group on a neighboring molecule. Each ring nitrogen atom also acts as a hydrogen bond acceptor for a total of four bonds per ring, with one nitrogen (denoted here as N4) acting as acceptor for two bonds (Figure 1a).
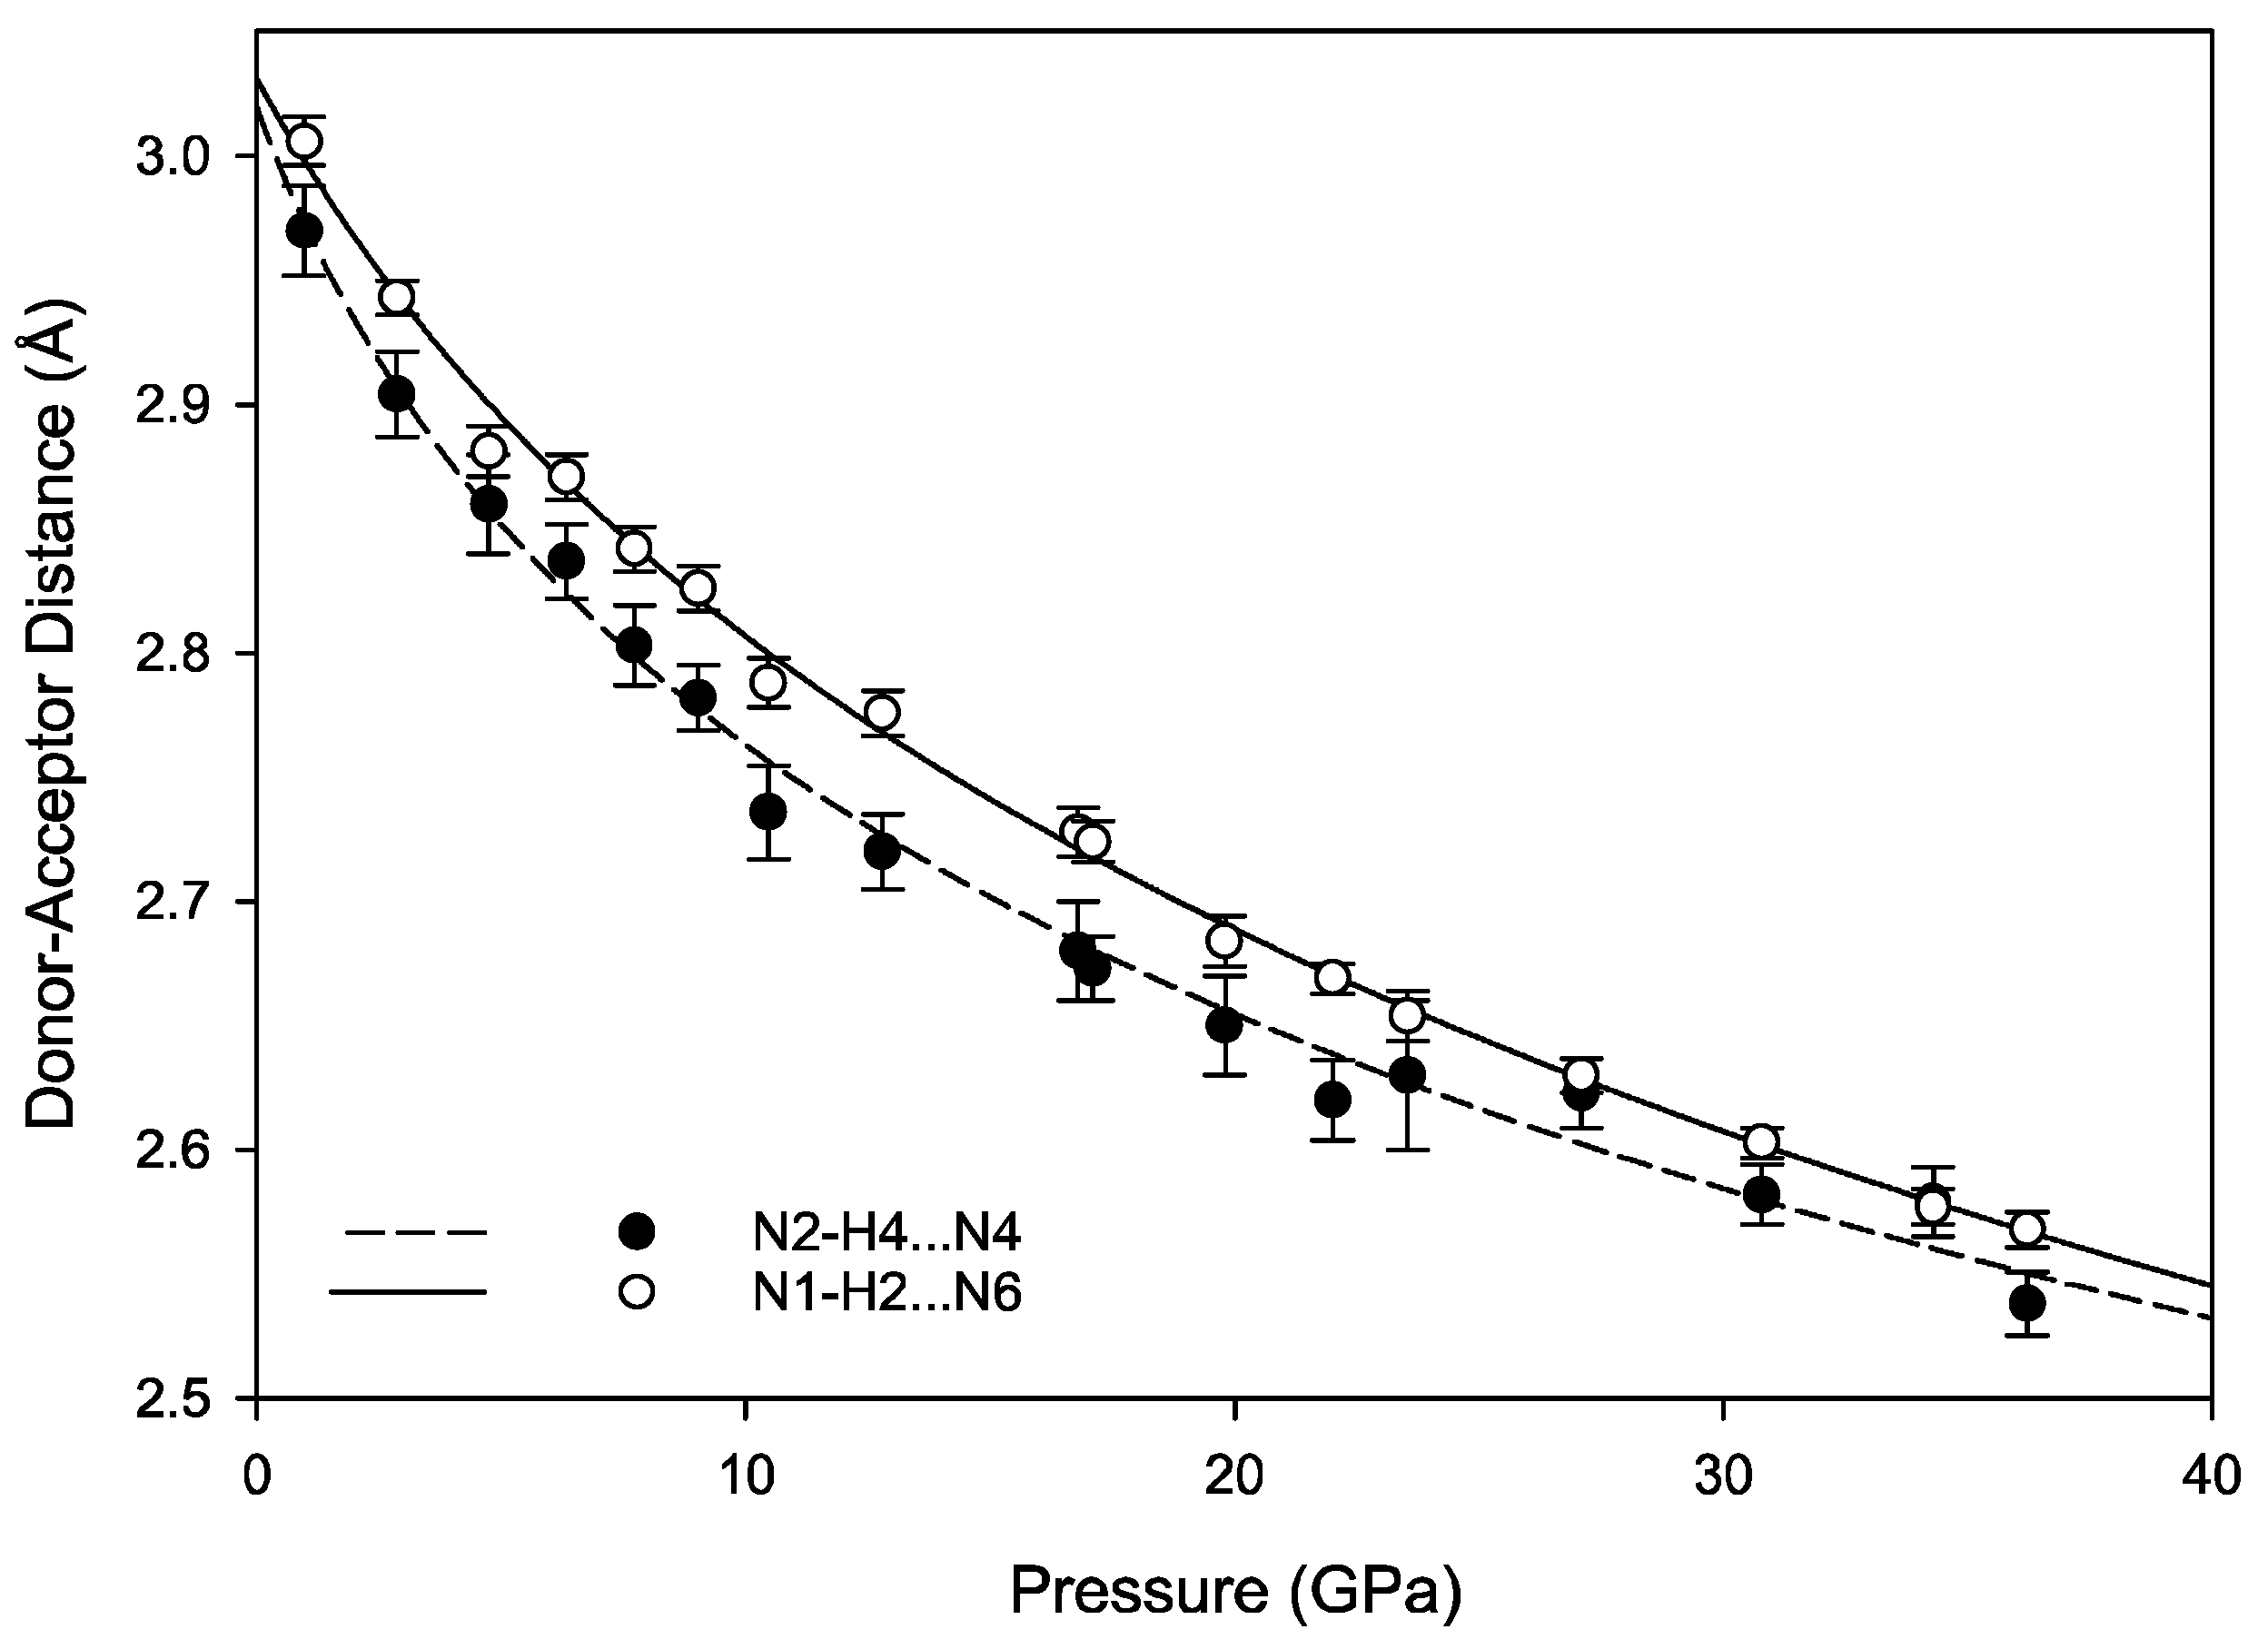
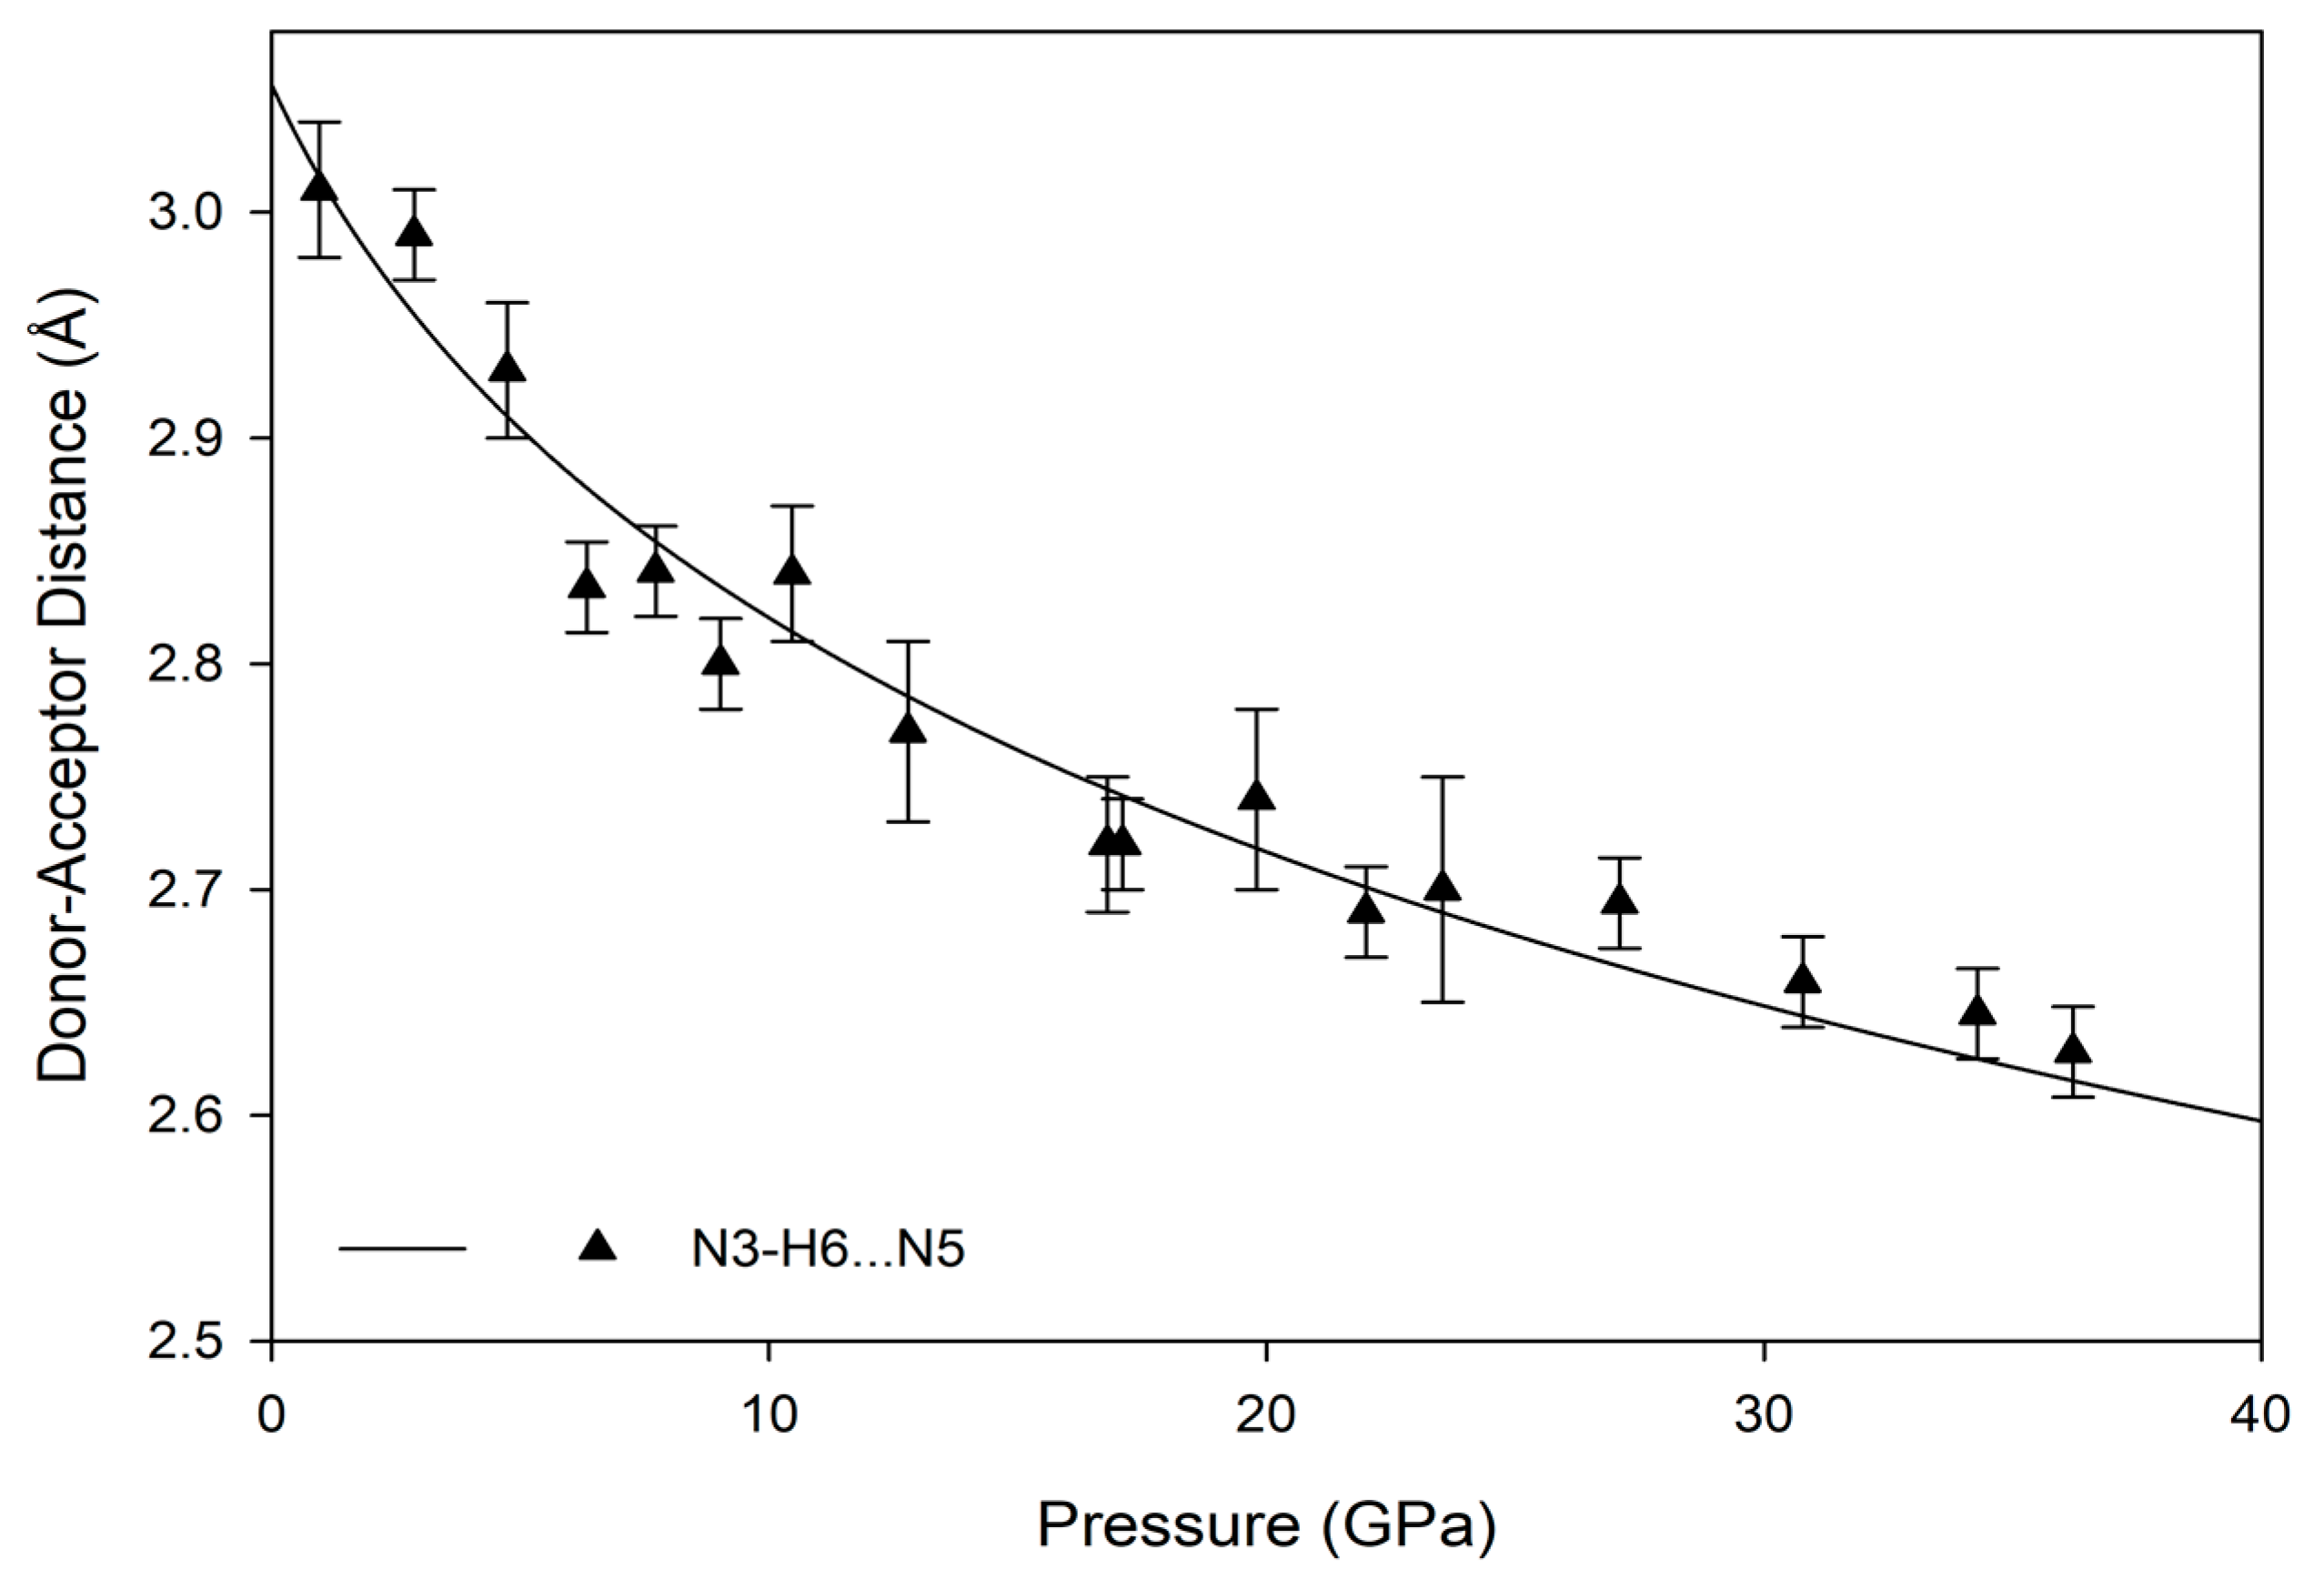
The hydrogen bonds in melamine can also be distinguished by whether they link molecules within a given corrugated plane or between them; for instance, the decrease in donor-acceptor distance for intra-plane molecules decreases smoothly as a function of pressure akin to the behavior of the unit cell parameters, while the inter-plane behavior is less consistent (Figure 9 and Figure 10). This is likely caused by the larger influence of the intra-plane bonding, as there are more hydrogen bonds within a layer, as well as small amounts of rotation and torsion to accommodate the increased intra-layer bonding and repulsive interactions between close-contact hydrogens. Ultimately, the intermolecular hydrogen bonds are capable of significant shortening with response to pressure, without any significant changes in the pattern of the original hydrogen bonds. Compression through 36.2(1) GPa decreases donor-acceptor distances substantially, which increases the covalent character of a bond and increases its strength [48].
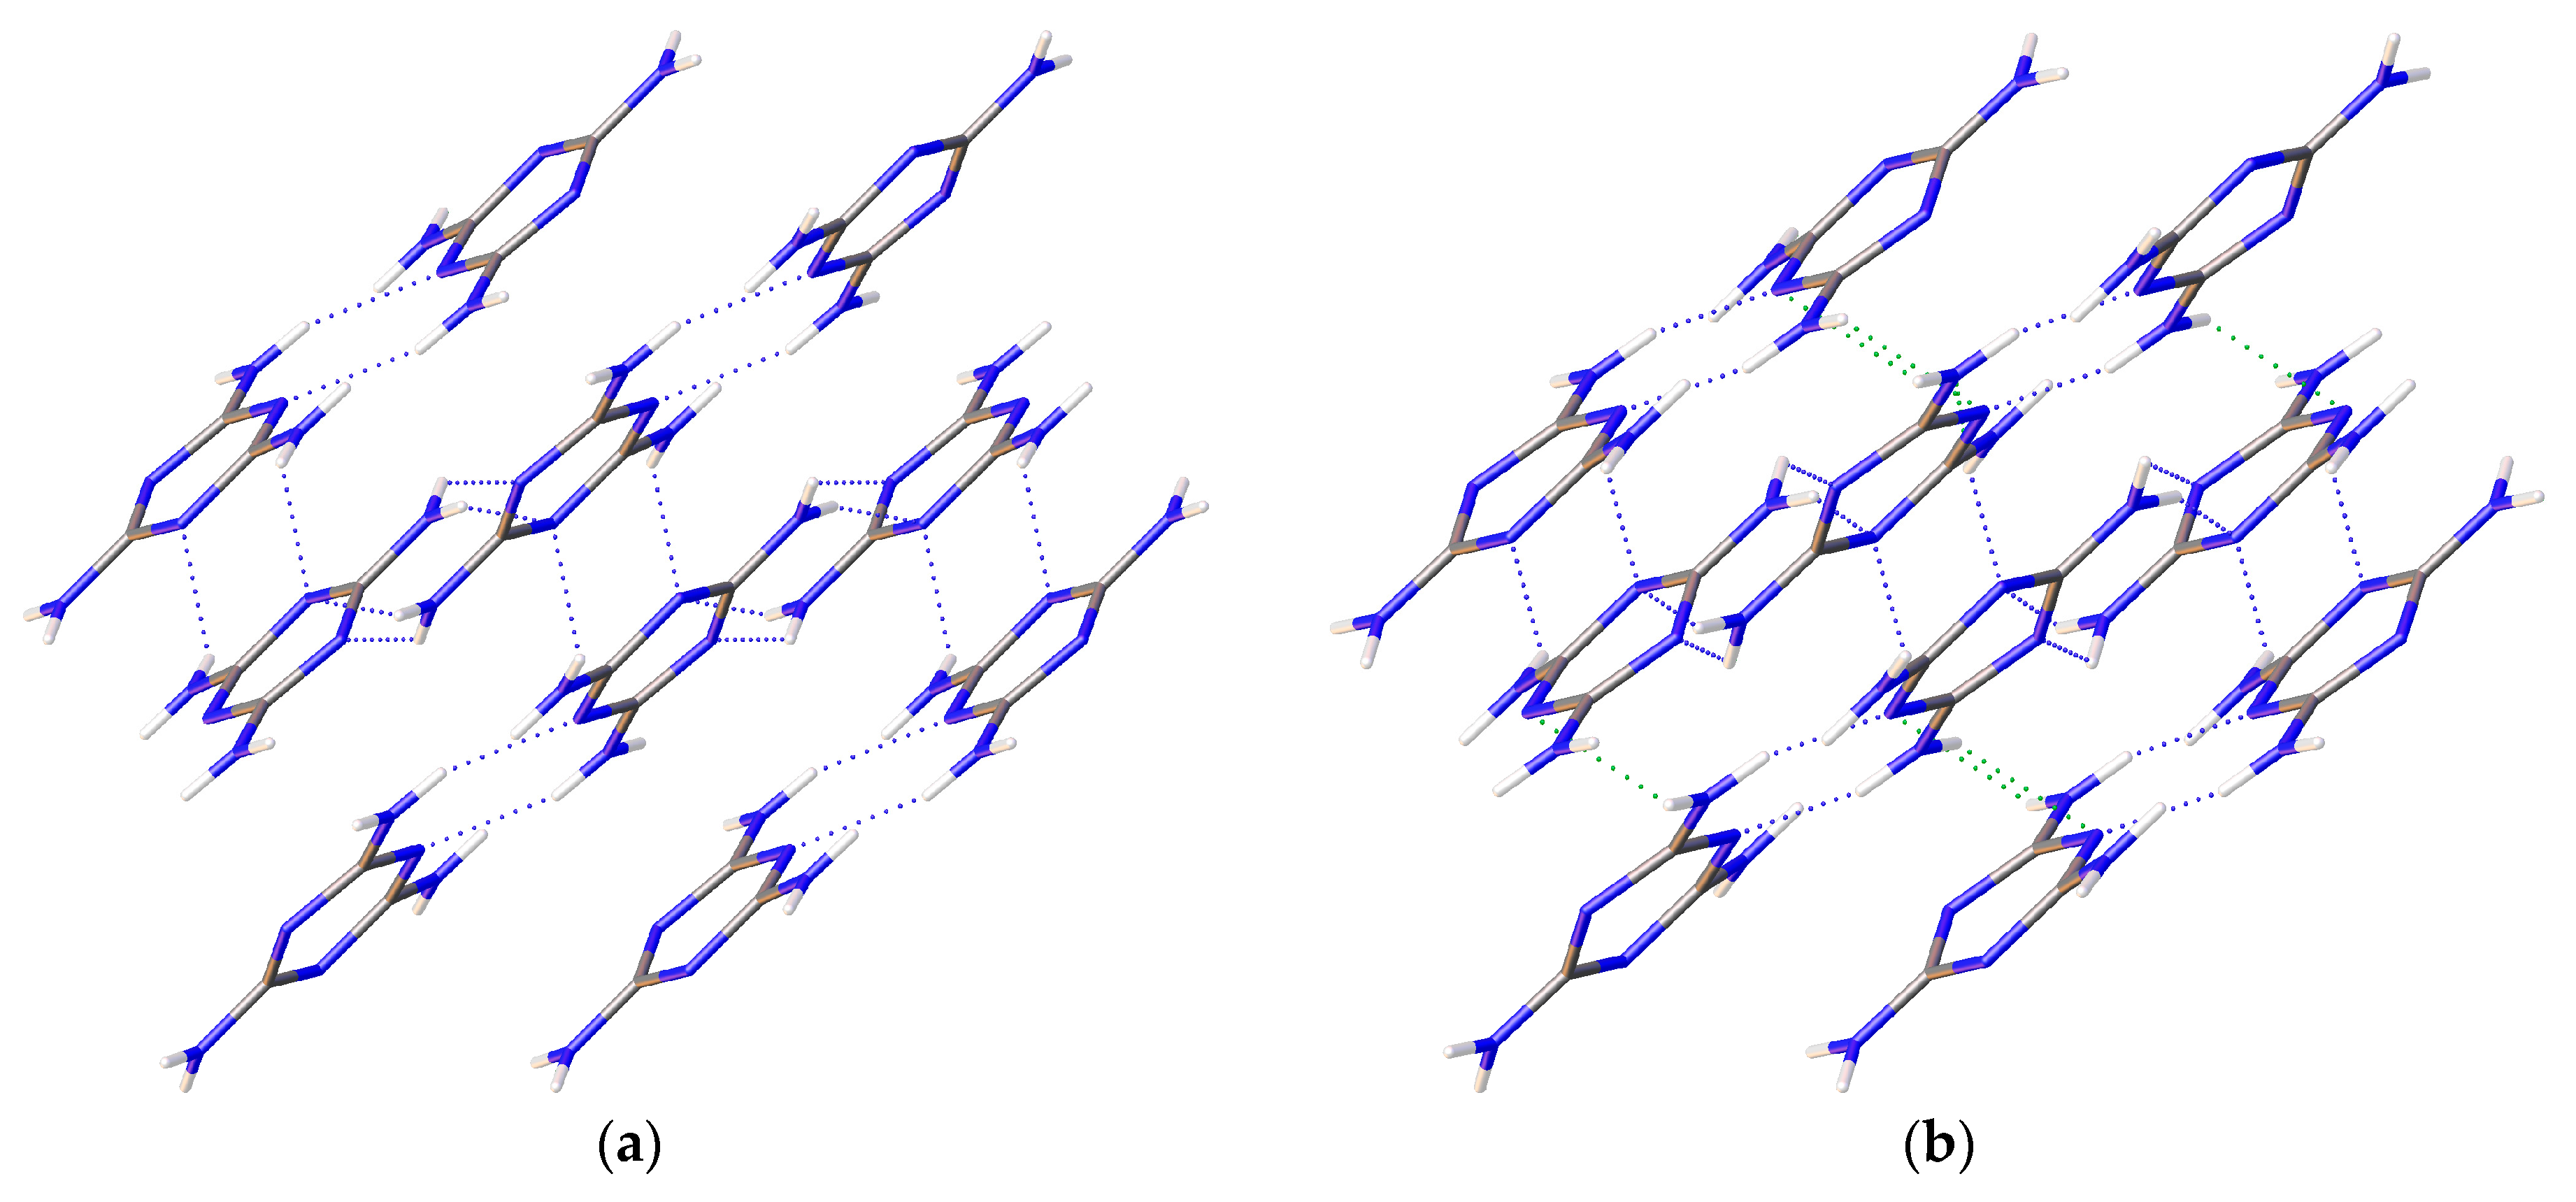
Notably, none of the original hydrogen bonds present at ambient pressures are broken below the phase transition pressure; instead, new hydrogen bonds between amino hydrogens and ring nitrogens form by 9.0(1) GPa and persist until at least 36.2(1) GPa (Figure 11). As pressure increases further, amino groups are pushed into close contact with one another, and interactions between oppositely aligned N-H atoms occur as each hydrogen is brought closer to an opposing nitrogen’s lone pair of electrons. These interactions, although primarily electrostatic in character, are stabilized by their anti-parallel orientation to one another, with pressure overriding unfavorably shallow D-H-A angles, steric crowding, and repulsive interactions. At 36.2(1) GPa, sufficiently short bond distances indicate bi- and tri-furcation of these bonds, as shown in Figure 1b, by the previously un-bonded H3 and H5 atoms.
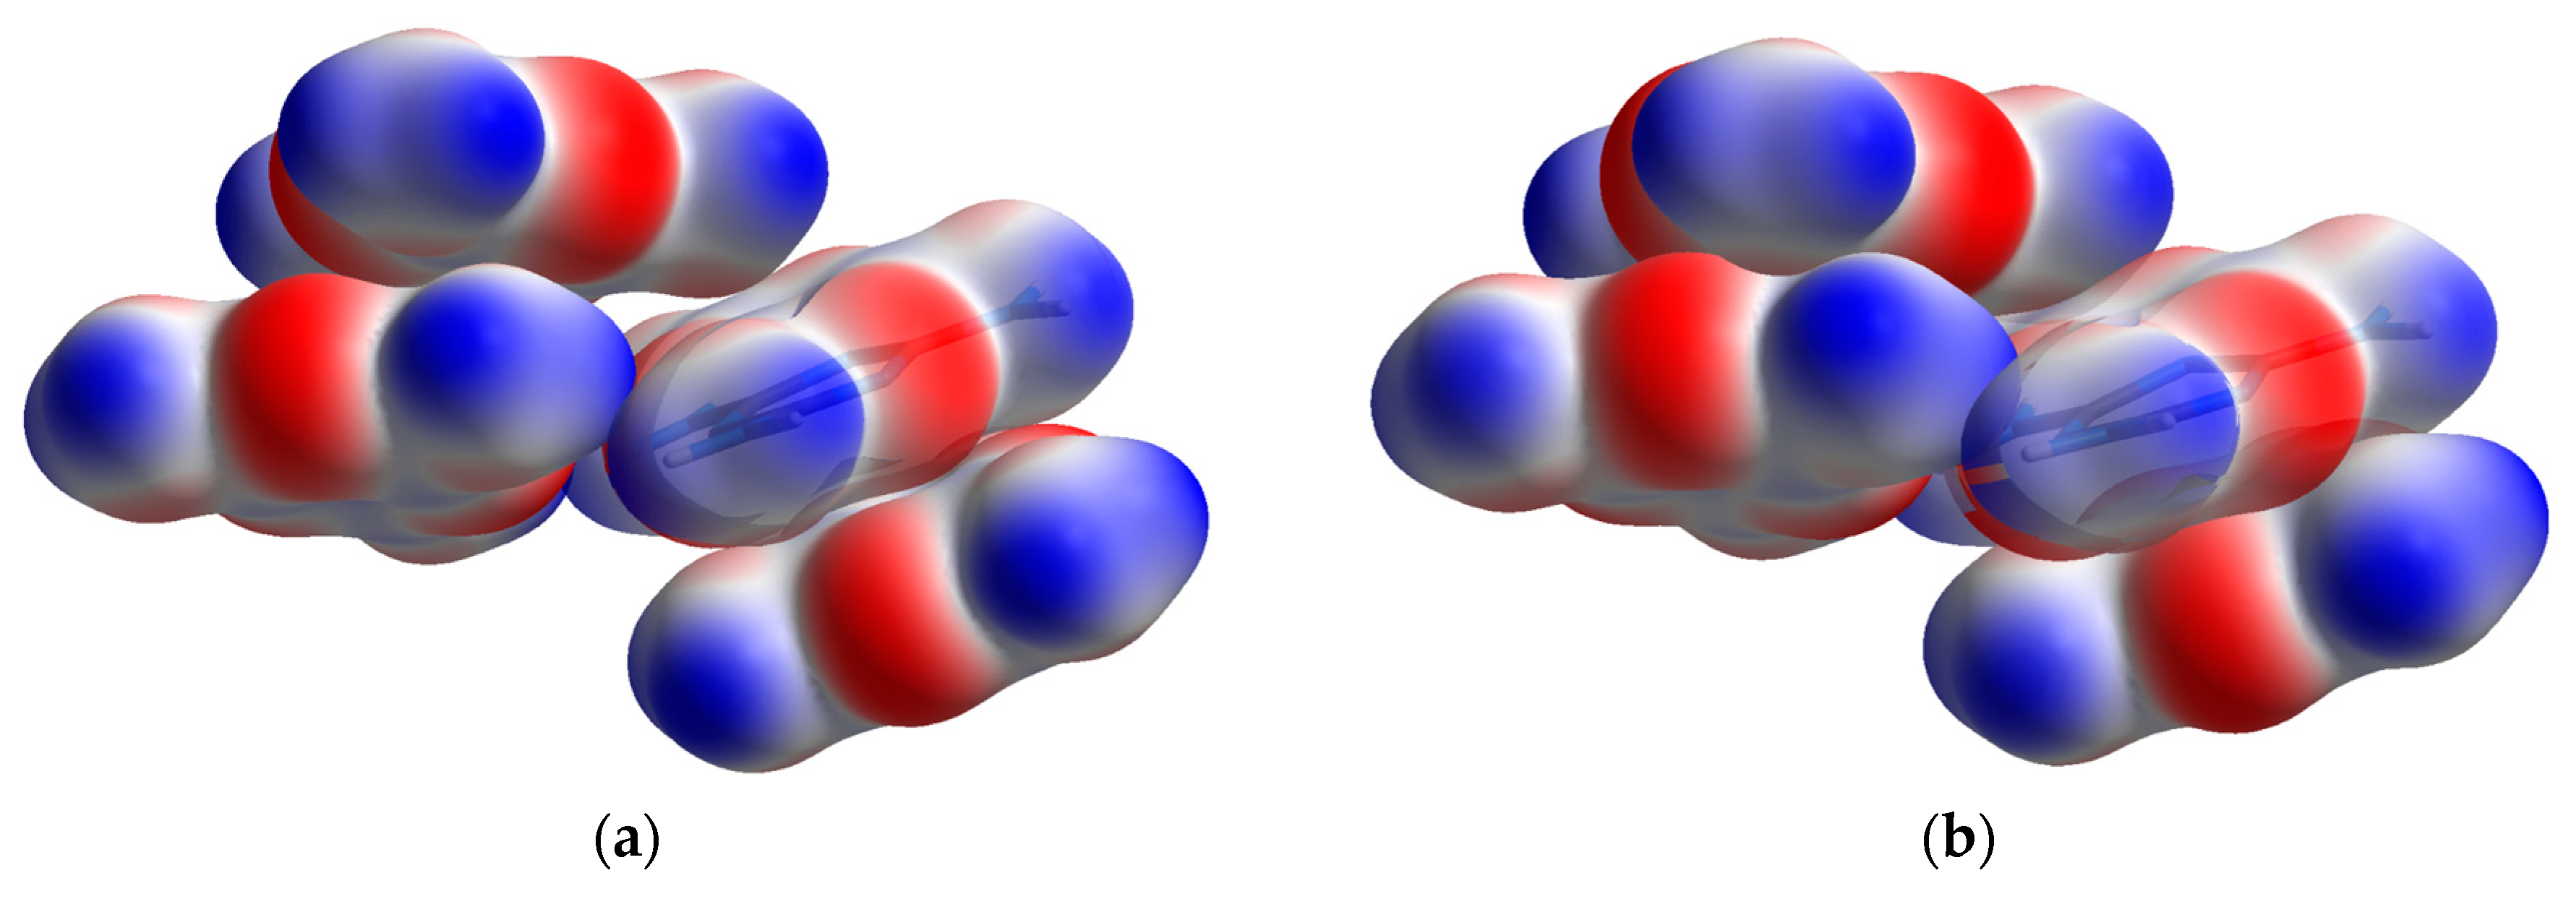
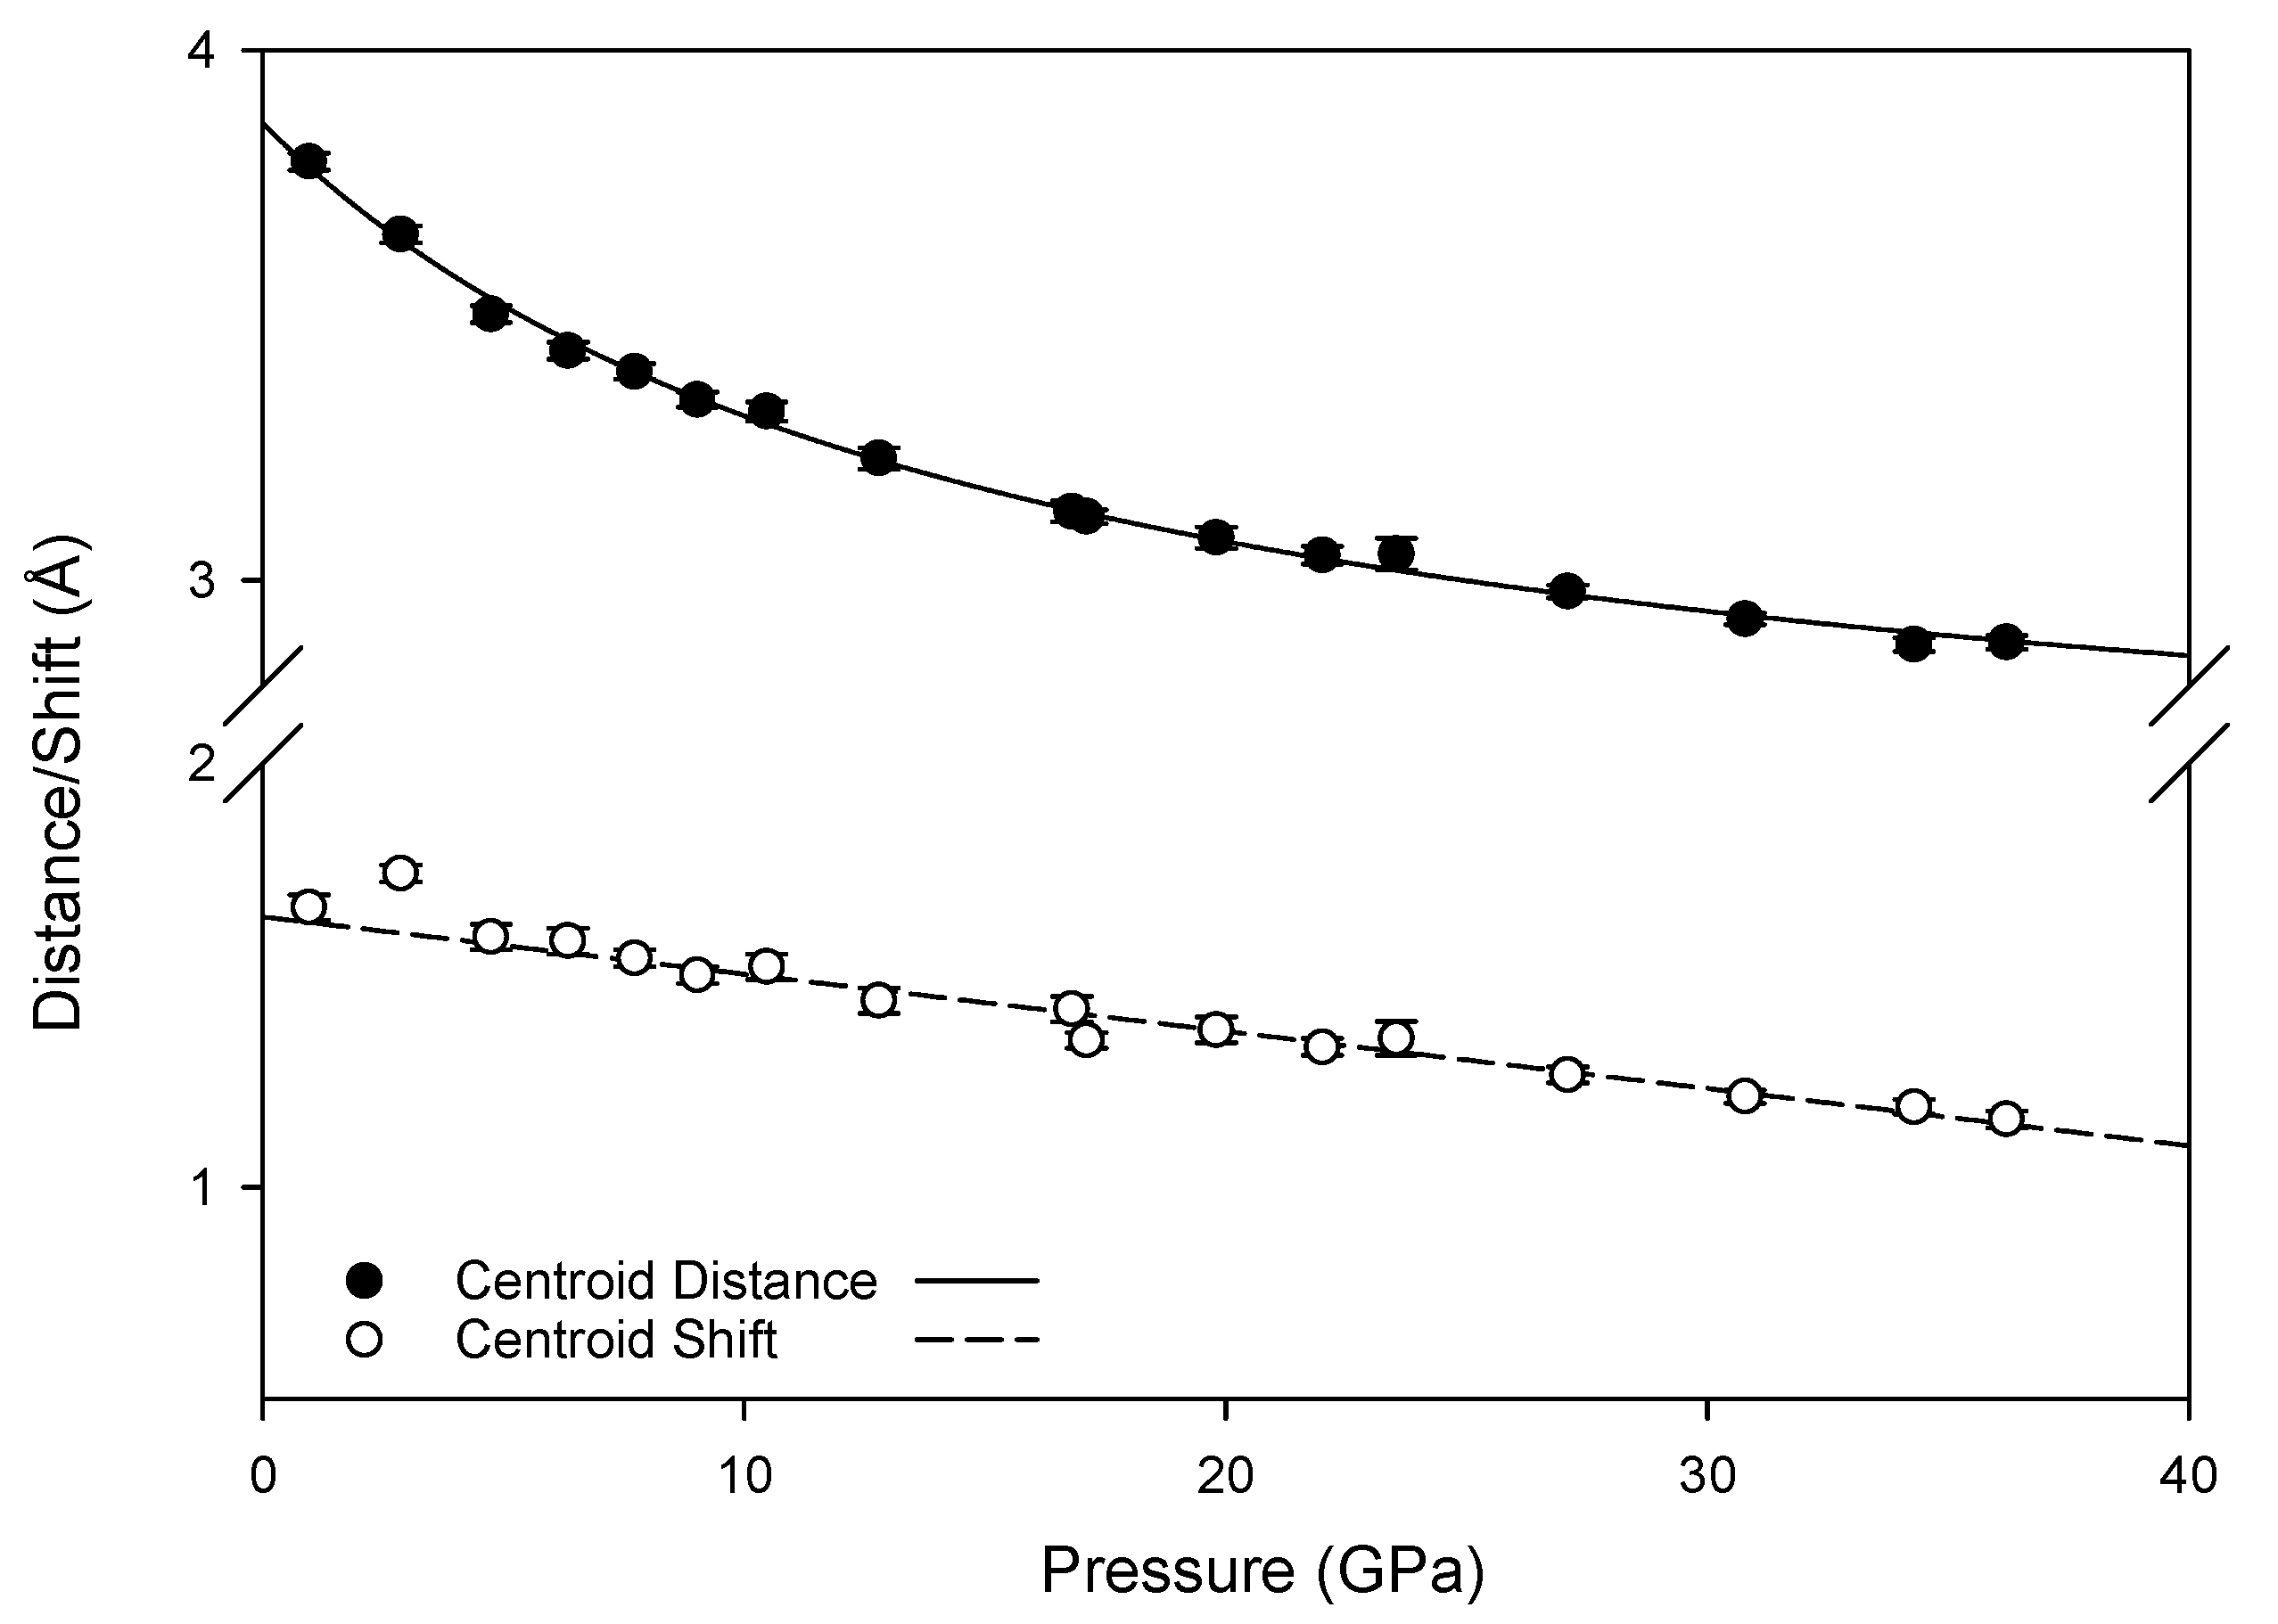
The new pressure-induced hydrogen bonds are not sufficiently strong to create a stable high-pressure configuration, as the transformation between monoclinic and triclinic phases is reversible. This is However, the new pressure-induced hydrogen bonds with ring nitrogen atoms may foster changes in the intermolecular interactions of π electrons in the high pressure phase; at ambient conditions, inter-layer hydrogen bonds link molecules where the centroid planes of the rings are parallel to one another, resulting in a skewed parallel-displaced arrangement where an electron-rich ring nitrogen is roughly aligned with a moderately electron-deficient ring center. At high pressures, the new hydrogen bonds also link molecules whose planes are at an offset to one another, introducing an interaction between these rings not experienced at lower pressures. Furthermore, compression reduces the distance and shift between the ring centroids (depicted in Figure A2), as well as reducing the angle between offset pairs of molecules (Figure 12), increasing the likelihood of extended interactions between multiple pairs of molecules. Although the term “π-π stacking” does not correctly describe the contact between neighboring melamine molecules [49,50], the distances and angles between ring centroids are within limits for attractive electrostatic π-σ interactions at both ambient and high pressures [49,51,52]. However, the N-H···N hydrogen bonds ultimately direct the supramolecular changes in the melamine crystal; this provides exceptional stability when compared to un-substituted s-triazine, which does not have the ability to act as a hydrogen bond donor [49,53,54].
3.4. Raman Spectroscopy
In general, Raman spectroscopy is an excellent tool for detecting pressure-induced structural phase transitions in solids, which usually manifest themselves as discontinuous changes in vibration mode behavior. For instance, symmetry lowering related to displacive phase transitions typically results in splitting of Raman peaks. The case of molecular crystals, however, is often more complicated than simple inorganic solids. The starting crystal symmetry is often lower, and the number of Raman modes can be very significant. At the same time, there are more types of competing interatomic and intermolecular interactions (e.g., hydrogen bonds, van der Waals forces, electrostatic interactions, charge transfer), which affect the vibration force constants. At high pressure the balance between these various interactions changes and may cause discontinuities in the Raman mode behavior unrelated to first-order structural phase transitions. An example of such was found in benzene, for which Raman experiments [55] described the existence of phase transitions between the II-III and III-IV phases at about 4 and 11 GPa. However, later studies combining both IR spectroscopy and powder X-ray diffraction cast doubt on tose proposed transitions, as the observed discontinuities and changes in vibrational modes did not correspond to symmetry-altering first-order structural changes [32].
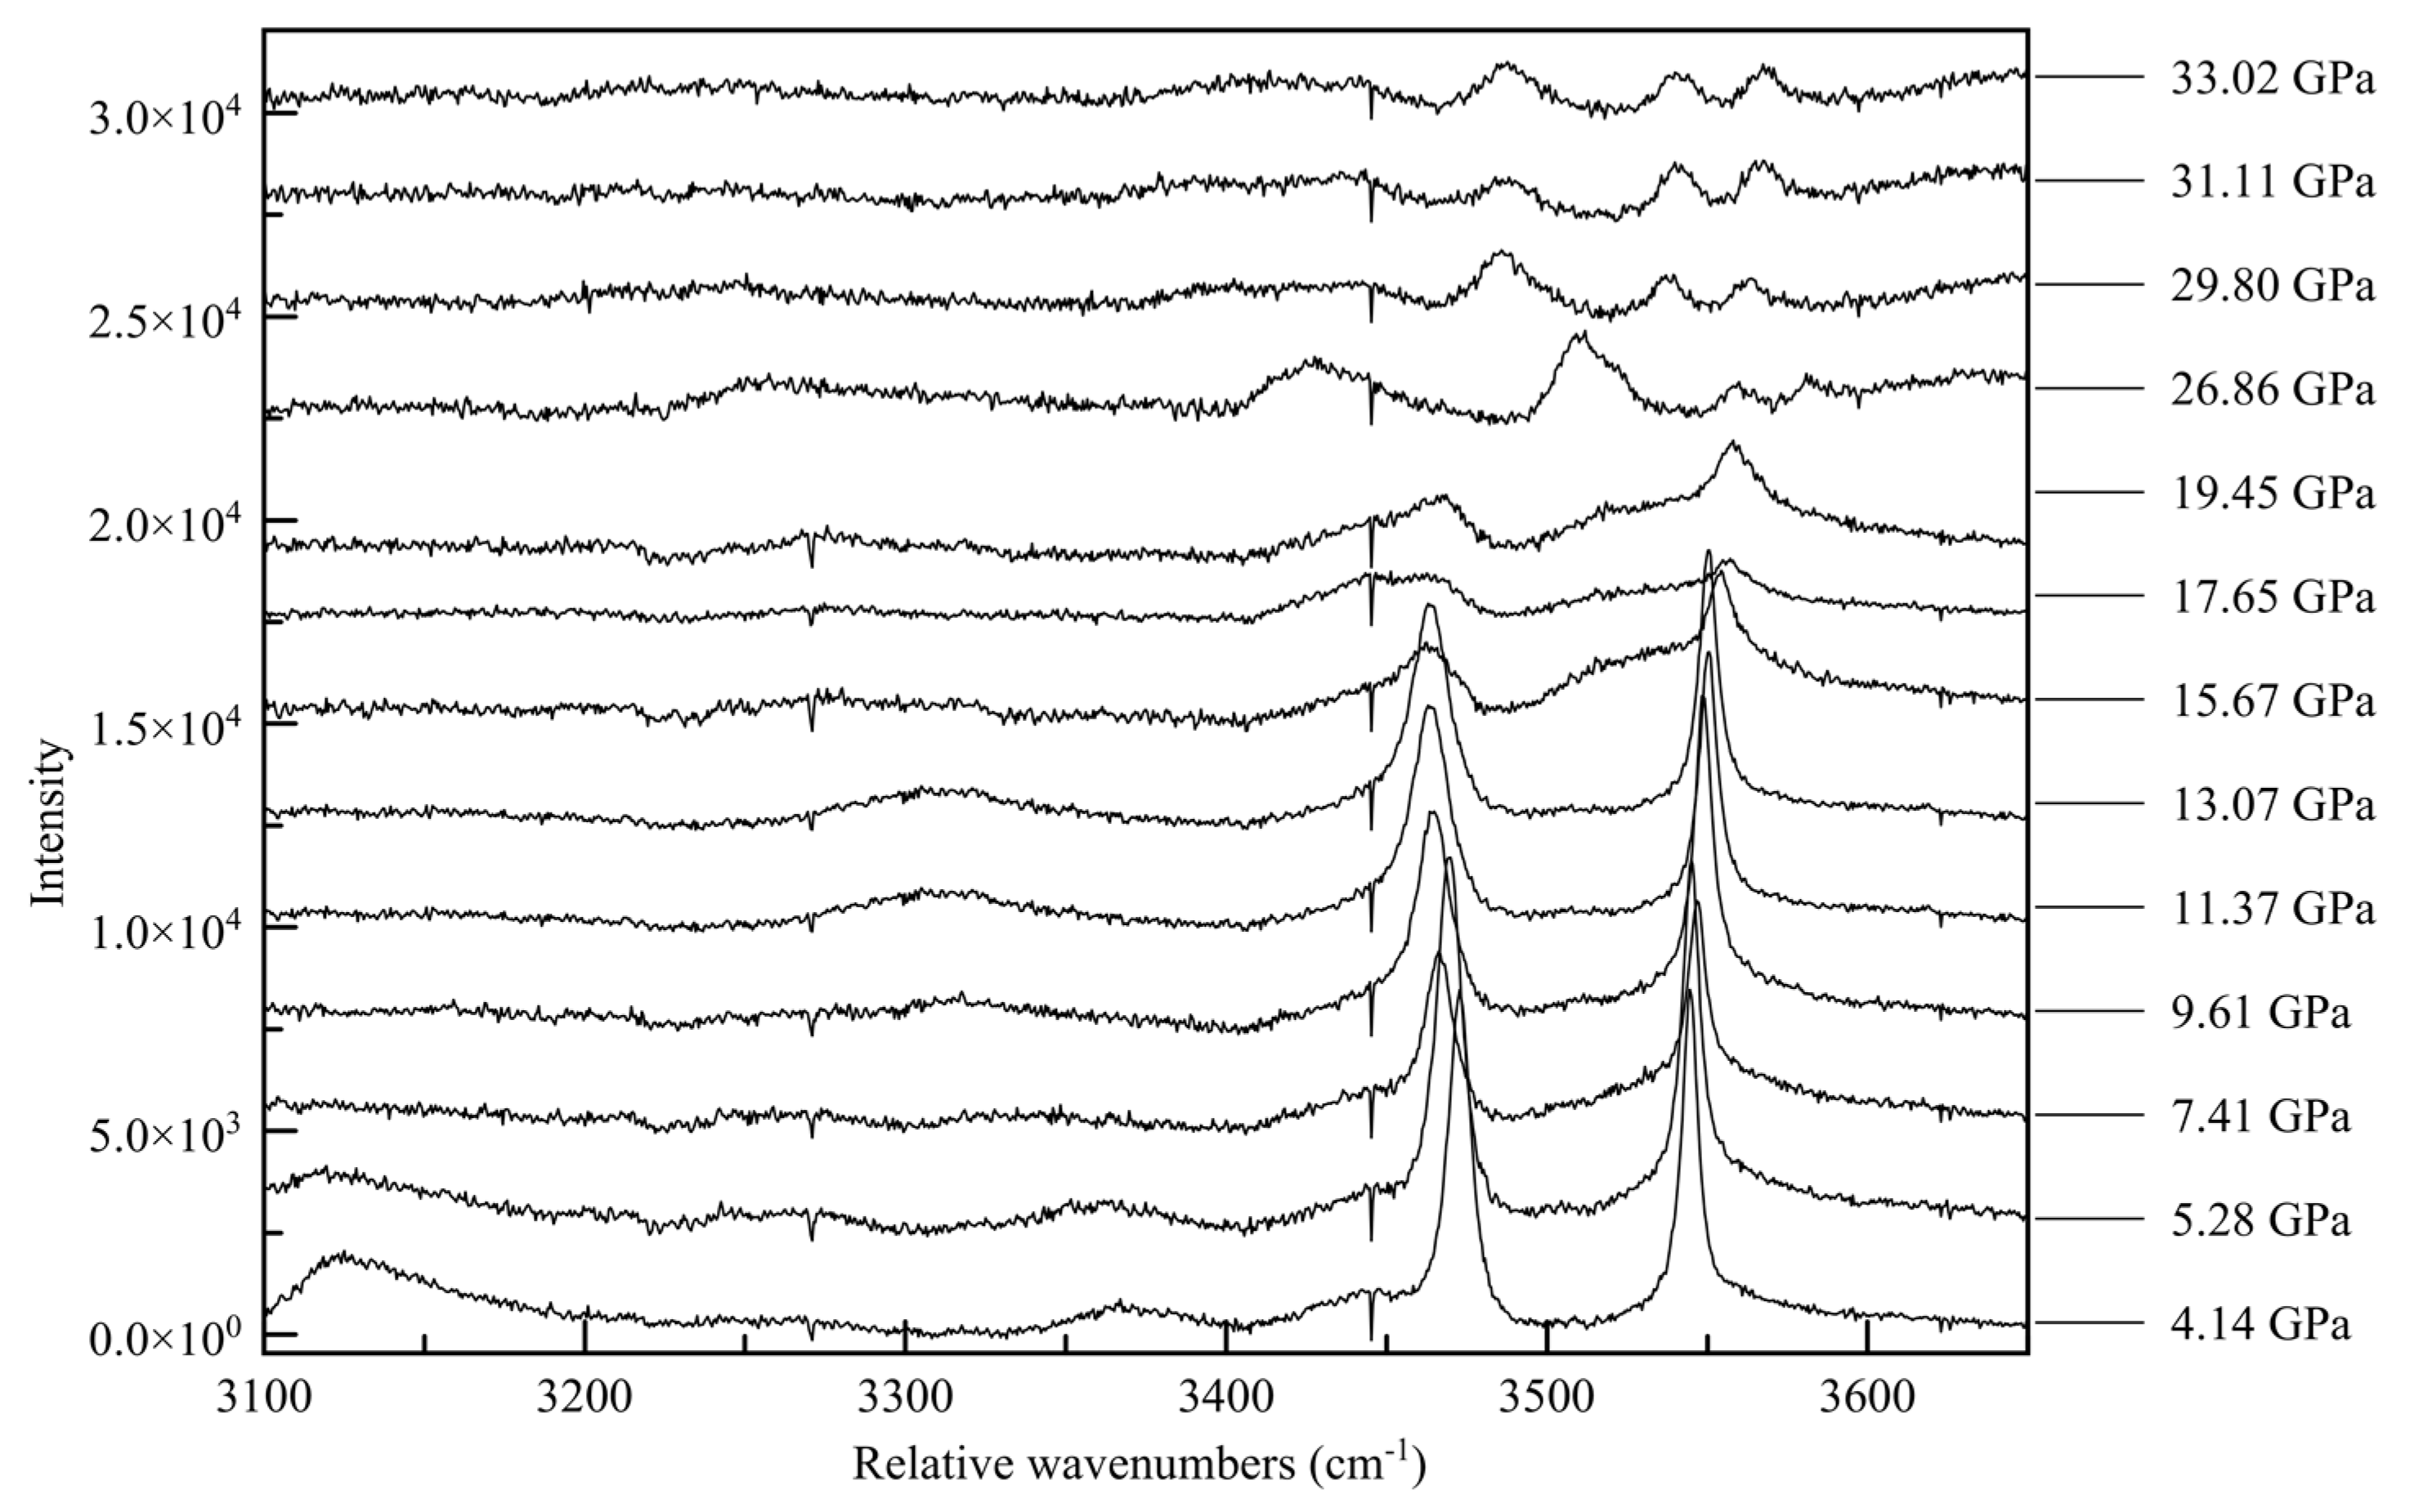
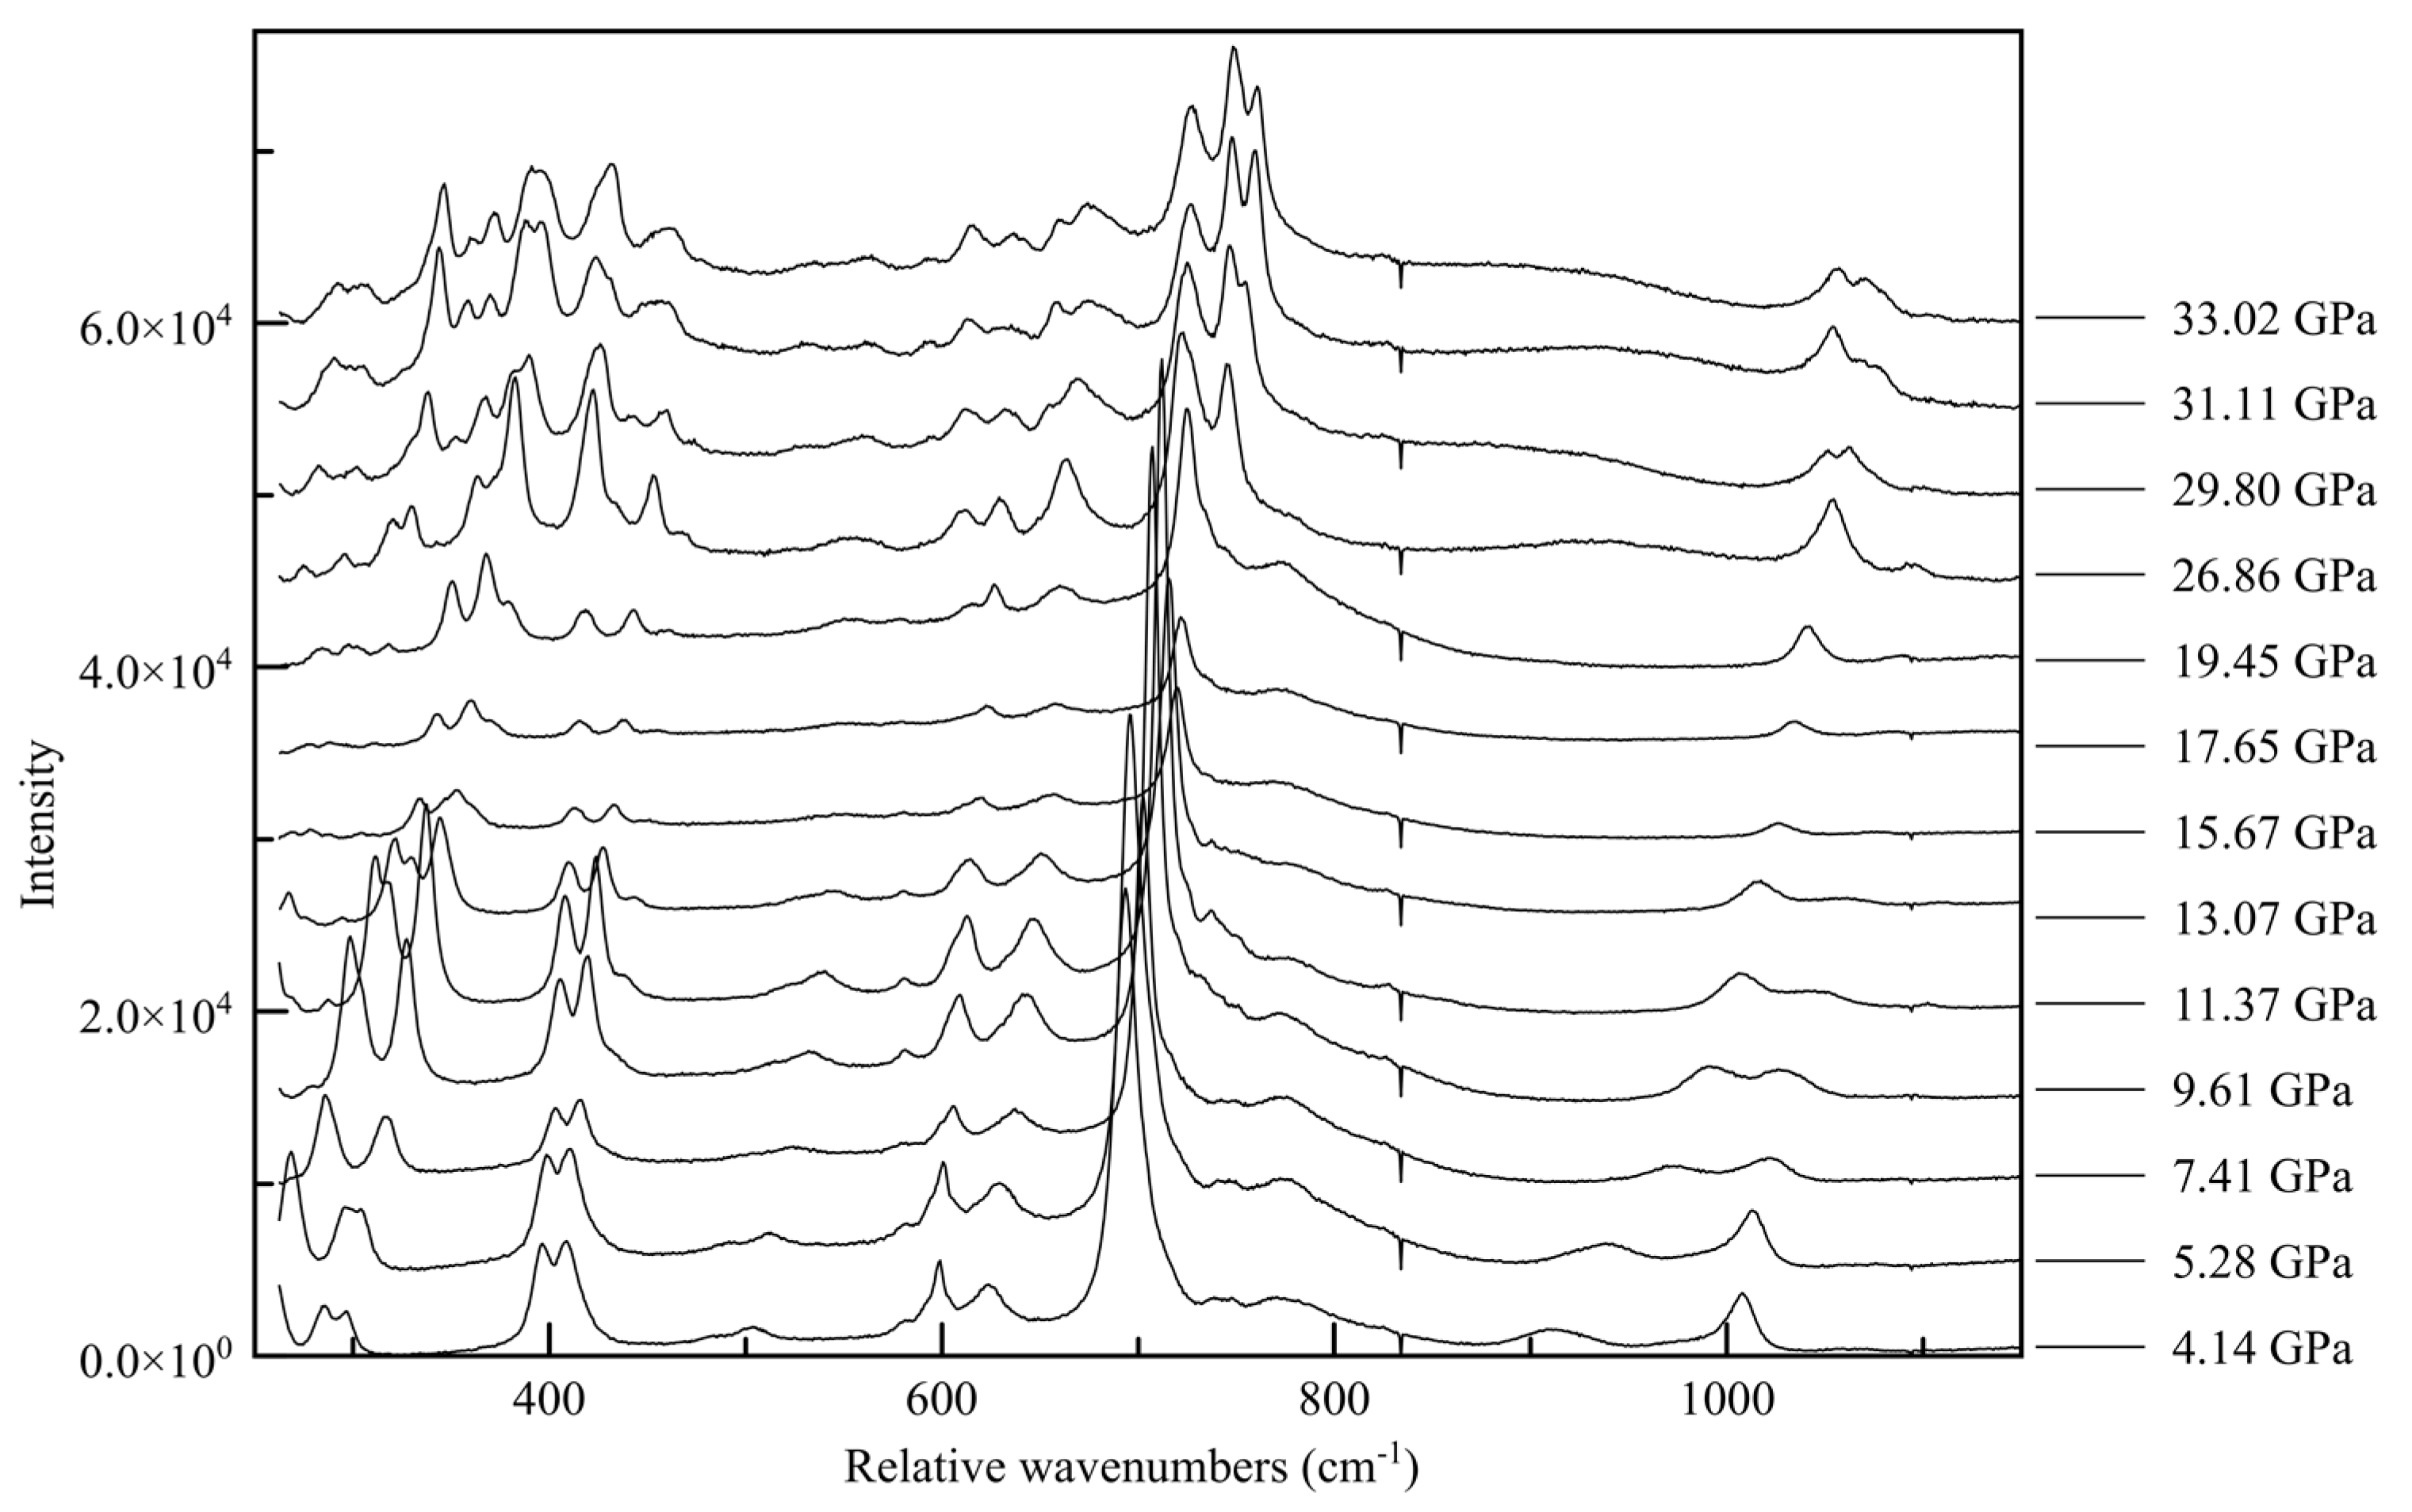
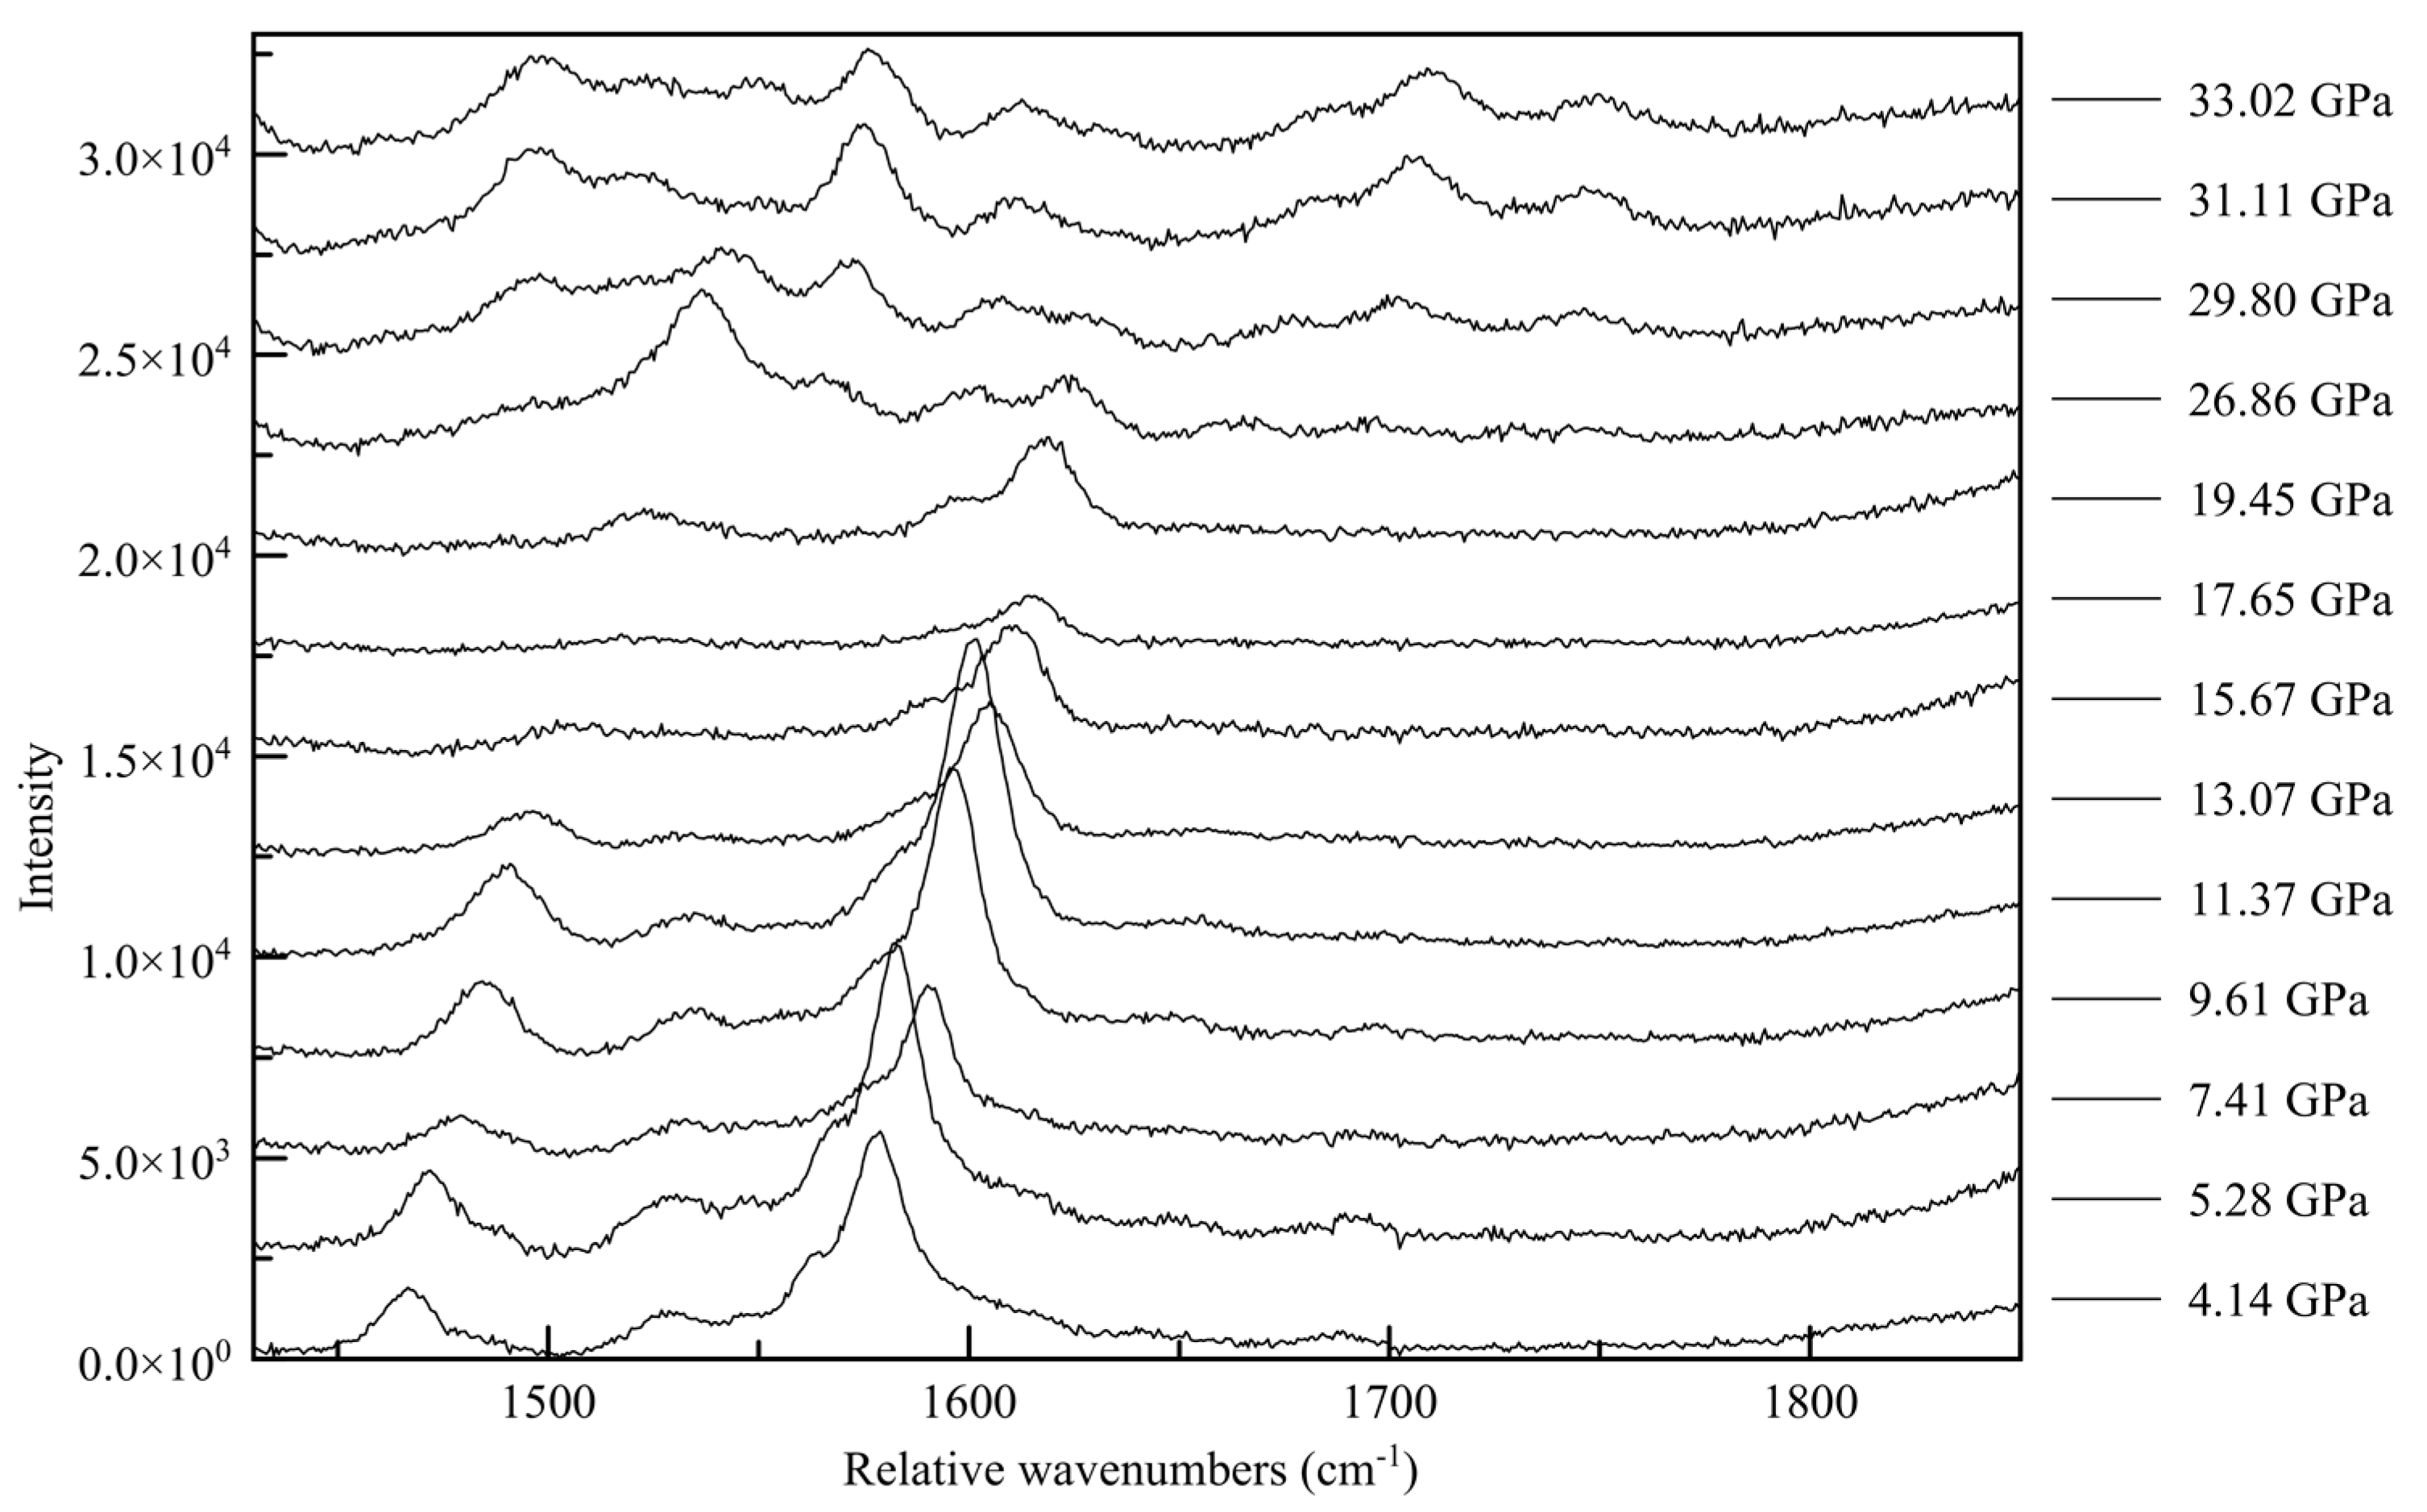
The ambient pressure Raman spectrum of melamine was first quantitatively interpreted in terms of mode assignment by Schneider and Schrader [56]. The assignment of the collective ring vibration modes can be made by analogy to the unsubstituted parent-molecule of s-triazine [57]. There are also several recent Raman studies of solid salts of melamine [58,59] that are useful in interpretation of individual vibration modes, such as those from hydrogen bonds. In the spectral range covered by our experiments, the Raman spectrum of melamine can be divided into three regions: the 250–1200 relative cm−1 is the collective ring vibration mode region, from 1400–1900 cm−1 is the C-NH2 vibration mode range, and the 3000–3700 cm−1 range is the N-H vibration mode range. This last region proves to be the most informative; at ambient pressure there are four distinct Raman peaks, at 3128, 3333, 3420, and 3471 relative cm−1 [16]. The two peaks at lower wavenumbers are very broad and quite asymmetric, whereas the peaks at higher wavenumbers are sharp and symmetric, as seen in Figure 13.
The non-uniformity of the hydrogen bonding interactions can also be seen in the Raman spectra. The sharp Raman peaks of 3420 and 3471 cm−1 at close to ambient pressure conditions can be associated with the non-hydrogen bonded N-H vibrations, such as from H3 and H5. The broad features, reminiscent of the O-H peak shapes in other hydrogen-bonded crystals, e.g., solid H2O, correspond to the two groups of hydrogen-bonded NH2. With increasing pressure, as intermolecular distances are reduced and hydrogens are forced into closer vicinity of nitrogen atoms, these peaks broaden and fade. As these previously non-interacting atoms are forced into hydrogen bonding interactions, the signal for each is muddied until the point of transition.
The changes in the Raman spectra accompanying the monoclinic-to-triclinic phase transition, observed in diffraction data at approximately 30 GPa in Ne and 38 GPa in He, are quite pronounced in all three spectral ranges, with the appearance of new spectral features often occurring slightly before the observed transition pressure. In the ring breathing mode range the high wave number component of the 750 cm−1 peak splits into a doublet, as does the 1100 cm−1 peak, shown in Figure 14. This is indicative of a change in the interaction between inter-layer molecules, potentially between newly crystallographically and energetically inequivalent ring systems after the phase transition [60,61,62]. In the C-N vibration range (Figure 15) a whole new family of peaks appear before the point of transition between 1500 and 1600 relative cm−1, with new peaks forming at approximately 1700 and 17900 rel cm−1 above approximately 30 GPa. This corroborates a change in the electronic state beginning at 26.86(5) GPa, culminating in a change in symmetry. Similarly, in the N-H range two new high wavenumber peaks appear between 3500 and 3600 cm−1 at approximately 30 GPa, and strengthen with increasing pressure.
4. Discussion and Conclusions
The compressional behavior of melamine closely resembles that of other hydrogen-bonded molecular solids, where individual molecular subunits and internal covalent bonds are not significantly altered with pressure [33,35,54,63,64]. Instead, hydrogen bonds can readily accommodate the increase in pressure, becoming more stable with decreasing donor-acceptor distances and linearization of donor-hydrogen-acceptor angles up to a critical pressure [48,65]. Melamine is notable for its extensive network of hydrogen bonds when compared to other substituted aromatics [54,63], which allows it to remain structurally stable over the same pressure range where many other molecular crystals irreversibly amorphize or decompose [44]. Additionally, this increase in hydrogen bonding stability (and by extension, covalent character) seems to overrule or direct other steric and electronic interactions that would otherwise exhibit more control over compressional behavior and reactivity. This is especially apparent when comparing against non-hydrogen bonded molecular crystals; for instance, although s-triazine shares the same fundamental aromatic ring system as melamine, its behavior is controlled by π interactions, resulting in susceptibility to electronic modification with pressure and increased reactivity [53,65,66], ultimately becoming irreversibly amorphous at 15.2 GPa. Similarly, benzene amorphizes into extended polyaromatic compounds at 23 GPa. Crystallinity is also generally limited to lower pressure ranges in molecular solids with limited or weak hydrogen bonding character; pyrimidine amorphizes at 22.4 GPa [67], pyrrole at 14.3 GPa [68], and pyridine at 22 GPa [69]. Each of these amorphization transitions is irreversible, indicating significant changes in the covalent bonding environment, often through ring-opening and polymerization [67].
In molecular crystals with extended hydrogen bonding networks (often with “rosette-type” hydrogen bonding geometry) such as melamine and its related adducts, as well as TATB, the pressure–stability relationship appears to be more complex. In a 1:2 melamine-boric acid adduct, a reversible amorphization transition was reported at 18 GPa, indicating a loss of periodicity but not chemical alteration [70]. For a 1:1 cyanuric acid-melamine adduct, an irreversible phase transition at 4.9 GPa to a quenchable crystalline phase of lower symmetry was reported [71]. This was accompanied by a pronounced change in the crystal’s opacity, not unlike what is seen in the irreversible amorphization of melamine. Surprisingly, TATB in hydrostatic helium was found to be stable up to at least 150 GPa, after experiencing several subtle, reversible phase transformations that produced visible color changes in the crystal [44].
In melamine, the phase transformations to the triclinic polymorph and amorphous phase occur at roughly double the pressure than other molecular solids, at upwards of 36 GPa in helium. The reversible transformation to the triclinic structure results from a rearrangement of the hydrogen bonding network in melamine, where electronic and electrostatic interactions not seen at ambient conditions are kept stable at high pressure but revert upon decompression. Upon further compression, the crystal can no longer accommodate these forced interactions, and an irreversible transition occurs to release the imposed stress on the structure. The large pressure stability field of melamine, combined with the interesting behavior of melamine adducts with pressure, indicate some potential for using melamine-based substituted triazines or adducts to design functional crystals held together by extensive pressure-stabilized hydrogen bonding networks.
Author Contributions
H.S. and P.D. performed the high-pressure X-ray diffraction experiments; P.D. and S.T. performed the high-pressure Raman spectroscopy experiments; H.S. and P.D. analyzed the X-ray and Raman data; S.T. assisted with sample preparation, all authors wrote the paper.
Funding
This study was funded by the Carnegie-DOE Alliance Center (CDAC) under cooperative agreement DE FC52-08NA28554. Development of the GSE_ADA software used for data analysis is supported by NSF grant EAR1440005. H.S. was supported by the U.S. Department of Energy and through CDAC. This project was performed at GeoSoilEnviroCARS (GSECARS Sector 13), and the High Pressure Collaborative Access Team (HPCAT Sector 16) of the Advanced Photon Source at Argonne National Laboratory. GeoSoilEnviroCARS is supported by the National Science Foundation—Earth Sciences (EAR-0622171) and Department of Energy—Geosciences (DE-FG02-94ER14466). Use of the COMPRES-GSECARS gas loading system was supported by COMPRES under NSF Cooperative Agreement EAR-1606856, by GSECARS through NSF grant EAR-1634415, and DOE grant DE-FG02-94ER14466. HPCAT operations are supported by DOE-NNSA under Award No. DE-NA0001974 and DOE-BES under Award No. DE-FG02-99ER45775, with partial instrumentation funding by NSF. Use of the Advanced Photon Source was supported by the U. S. Department of Energy, Office of Science, Office of Basic Energy Sciences, under Contract No. DE-AC02-06CH11357.
Conflicts of Interest
The authors declare no conflict of interest.
Appendix A

Table A1.
Selected bond lengths and angles for melamine at 36.21(5) GPa (2015_10). Amino C-N-H angles are set to 120° by the AFIX hydrogen bond command.
Table A1.
Selected bond lengths and angles for melamine at 36.21(5) GPa (2015_10). Amino C-N-H angles are set to 120° by the AFIX hydrogen bond command.
| Bonded Atoms | Length (Å) | Atoms in Angle | Angle (°) |
|---|---|---|---|
| C(1)-N(1) | 1.26(2) | N(1)-C(1)-N(6) | 121.5(6) |
| C(1)-N(6) | 1.345(17) | N(1)-C(1)-N(5) | 118.1(12) |
| C(1)-N(5) | 1.361(8) | N(6)-C(1)-N(5) | 120.4(14) |
| C(2)-N(2) | 1.302(14) | N(2)-C(2)-N(6) | 120.1(6) |
| C(2)-N(6) | 1.316(17) | N(2)-C(2)-N(4) | 115.8(11) |
| C(2)-N(4) | 1.345(8) | N(6)-C(2)-N(4) | 124.1(10) |
| C(3)-N(5) | 1.30(2) | N(5)-C(3)-N(4) | 125.8(8) |
| C(3)-N(4) | 1.317(15) | N(5)-C(3)-N(3) | 117.3(10) |
| C(3)-N(3) | 1.335(10) | N(4)-C(3)-N(3) | 116.9(14) |
Table A2.
Atomic coordinates (×104) and equivalent isotropic displacement parameters (A2 × 103) for carbon and nitrogen atoms melamine at 36.21(5) GPa (2015_10). Ueq is defined as one third of the trace of the orthogonalized Uij tensor.
Table A2.
Atomic coordinates (×104) and equivalent isotropic displacement parameters (A2 × 103) for carbon and nitrogen atoms melamine at 36.21(5) GPa (2015_10). Ueq is defined as one third of the trace of the orthogonalized Uij tensor.
| Atom | X | Y | Z | Ueq |
|---|---|---|---|---|
| C(1) | 1771(16) | 6196(8) | 290(40) | 11(1) |
| C(2) | 1307(16) | 4725(7) | 3230(40) | 9(1) |
| C(3) | 634(16) | 7829(8) | 2330(40) | 11(1) |
| N(1) | 2234(14) | 6180(7) | 1340(40) | 10(1) |
| N(2) | 1280(12) | 3193(7) | 4440(30) | 7(1) |
| N(3) | 252(13) | 9514(7) | 2970(30) | 10(1) |
| N(4) | 586(15) | 6305(7) | 3570(40) | 11(1) |
| N(5) | 1098(13) | 7850(7) | 610(30) | 10(1) |
| N(6) | 2005(14) | 4661(7) | 1780(40) | 11(1) |
Table A3.
Definitions of symmetry operators.
| Atom | Symmetry Operators | ||
|---|---|---|---|
| 1 | x, | y, | z − 1 |
| 2 | −x + 1/2, | y − 1/2, | −z |
| 3 | −x + 1/2, | y + 1/2, | −z |
| 4 | x, | y − 1, | z |
| 5 | −x + 1/2, | y − 1/2, | −z + 1 |
| 6 | −x, | −y + 1, | −z + 1 |
| 7 | x | Y + 1 | z |
| 8 | −x | −y + 2 | −z |
| 9 | −x | −y + 2 | −z + 1 |
Table A4.
Hydrogen bond D-H··A lengths and angles at 36.21(5) GPa (2015_10). Hydrogen bonds linking to neighboring triazine ring nitrogen atoms are displayed in bold.
Table A4.
Hydrogen bond D-H··A lengths and angles at 36.21(5) GPa (2015_10). Hydrogen bonds linking to neighboring triazine ring nitrogen atoms are displayed in bold.
| D-H··A Symmetry | d(D-H) | d(H··A) | <DHA | d(D··A) |
|---|---|---|---|---|
| N1-H1···N5_$2 | 0.935 | 1.792 | 155.72 | 2.672(8) |
| N1-H2···N6_$3 | 0.935 | 1.821 | 134.85 | 2.568(7) |
| N2-H3···N4_$5 | 0.865 | 2.16 | 126.5 | 2.763(12) |
| N2-H3···N6_$5 | 0.865 | 2.688 | 117.55 | 3.182(16) |
| N3-H6···N5_$8 | 0.886 | 1.89 | 139.51 | 2.628(18) |
| N2-H4···N4_$6 | 0.865 | 1.703 | 161.53 | 2.538(13) |
| N1-H1···N2_$1 | 0.935 | 2.481 | 120.73 | 3.067(18) |
| N1-H1···N3_$2 | 0.935 | 2.379 | 134.58 | 3.108(10) |
| N1-H2···N2_$3 | 0.935 | 2.477 | 127.01 | 3.131(14) |
| N2-H3···N1_$2 | 0.865 | 2.49 | 131.52 | 3.131(14) |
| N2-H3···N3_$4 | 0.865 | 2.152 | 122.47 | 2.717(10) |
| N2-H4···N3_$6 | 0.865 | 2.561 | 129.4 | 3.182(12) |
| N3-H6···N1_$3 | 0.886 | 2.546 | 121.95 | 3.108(10) |
| N3-H6···N2_$7 | 0.886 | 2.158 | 120.4 | 2.717(10) |
| N3-H5···N2_$6 | 0.886 | 2.565 | 127.35 | 3.182(12) |
| N3-H5···N3_$9 | 0.886 | 1.96 | 159.3 | 2.81(3) |
Figure A1.
F-f plot for data plotted with a third-order Vinet equation of state.
Figure A2.
Ring centroid-centroid distance and shift as a function of pressure. Centroid distance is the straight line distance between the centers of the rings, shift indicates the in-plane separation between the centers of ring planes.
Figure A2.
Ring centroid-centroid distance and shift as a function of pressure. Centroid distance is the straight line distance between the centers of the rings, shift indicates the in-plane separation between the centers of ring planes.
References
- Hiskey, M.A.; Chavez, D.E.; Naud, D.L. Insensitive High-Nitrogen Compounds; NTIS No: DE-2001-776133; Los Alamos National Lab.: Los Alamos, NM, USA, 2001. [Google Scholar]
- Xu, D.; Lu, H.; Huang, Q.; Deng, B.; Li, L. Flame-retardant effect and mechanism of melamine phosphate on silicone thermoplastic elastomer. RSC Adv. 2018, 8, 5034–5041. [Google Scholar] [CrossRef] [Green Version]
- Liu, A.Y.; Cohen, M.L. Prediction of new low compressibility solids. Science 1989, 245, 841–842. [Google Scholar] [CrossRef] [PubMed]
- Li, J. An ab initio theoretical study of 2,4,6-trinitro-1,3,5-triazine, 3,6-dinitro-1,2,4,5-tetrazine, and 2,5,8-trinitro-tri-s-triazine. Propellants Explos. Pyrotech. 2008, 33, 443–447. [Google Scholar] [CrossRef]
- Coburn, M.D.; Hayden, H.H.; Coon, C.L.; Mitchell, A.R. Synthesis of poly (S, S-dimethylsulfilimino) heterocycles. Synthesis 1986, 6, 490–492. [Google Scholar] [CrossRef]
- Hartman, G.D.; Schwering, J.E.; Hartman, R.D. Dimethyl sulfide ditriflate: A new reagent for the conversion of amino heterocycles to iminosulfuranes. Tetrahedron Lett. 1983, 24, 1011–1014. [Google Scholar] [CrossRef]
- Hejny, C.; Minkov, V.S. High-pressure crystallography of periodic and aperiodic crystals. IUCrJ 2015, 2, 218–229. [Google Scholar] [CrossRef] [PubMed] [Green Version]
- Ma, H.A.; Jia, X.P.; Chen, L.X.; Zhu, P.W.; Guo, W.L.; Guo, X.B.; Wang, Y.D.; Li, S.Q.; Zou, G.T.; Zhang, G.; et al. High-pressure pyrolysis study of C3N6H6: A route to preparing bulk C3N4. J. Phys. Condens. Matter 2002, 14, 11269–11273. [Google Scholar] [CrossRef]
- Montigaud, H.; Tanguy, B.; Demazeau, G.; Alves, I.; Courjault, S. C3N4: Dream or reality? Solvothermal synthesis as macroscopic samples of the C3N4 graphitic form. J. Mater. Sci. 2000, 35, 2547–2552. [Google Scholar] [CrossRef]
- Yao, L.D.; Li, F.Y.; Li, J.X.; Jin, C.Q.; Yu, R.C. Study of the products of melamine (C3N6H6) treated at high pressure and high temperature. Phys. Status Solidi 2005, 202, 2679–2685. [Google Scholar] [CrossRef]
- Wu, X.; Tao, Y.; Lu, Y.; Dong, L.; Hu, Z. High-pressure pyrolysis of melamine route to nitrogen-doped conical hollow and bamboo-like carbon nanotubes. Diam. Relat. Mater. 2006, 16, 164–170. [Google Scholar] [CrossRef]
- Yu, D.L.; He, J.L.; Liu, Z.Y.; Xu, B.; Li, D.C.; Tian, Y.J. Phase transformation of melamine at high pressure and temperature. J. Mater. Sci. 2008, 43, 689–695. [Google Scholar] [CrossRef]
- Hamann, S.D.; Linton, M. The influence of pressure on the infrared spectra of hydrogen bonded solids. III compounds with N-H…X bonds. Aust. J. Chem. 1976, 29, 1641–1647. [Google Scholar] [CrossRef]
- Zhao, Y.; Zhang, Z.; Cui, Q.; Liu, Z.; Li, D.; Zou, G. High pressure raman spectra of melamine (C3H6N6) and pressure induced transition. High Press. Res. 1990, 3, 233–235. [Google Scholar]
- Ma, H.A.; Jia, X.; Cui, Q.L.; Pan, Y.W.; Zhu, P.W.; Liu, B.B.; Liu, H.J.; Wang, X.C.; Liu, J.; Zou, G.T. Crystal structures of C3N6H6 under high pressure. Chem. Phys. Lett. 2003, 368, 668–672. [Google Scholar] [CrossRef]
- Liu, X.R.; Zinin, P.V.; Ming, L.C.; Acosta, T.; Sharma, S.K.; Misra, A.K.; Hong, S.M. Raman spectroscopy of melamine at high pressures. J. Phys. Conf. Ser. 2010, 215, 012045. [Google Scholar] [CrossRef] [Green Version]
- Pravica, M.; Kim, E.; Tkatchev, S.; Chow, P.; Xiao, Y. High-pressure studies of melamine. High Press. Res. 2010, 30, 65–71. [Google Scholar] [CrossRef]
- Rivers, M.L.; Prakapenka, V.B.; Kubo, A.; Pullins, C.; Hall, C.M.; Jacobsen, S.D. The compres/gsecars gas loading system for diamond anvil cells at the advanced photon source. High Press. Res. 2008, 28, 273–292. [Google Scholar] [CrossRef]
- Boehler, R.; De Hantsetters, K. New anvil designs in diamond-cells. High Press. Res. 2004, 24, 391–396. [Google Scholar] [CrossRef]
- Mao, H.K.; Xu, J.; Bell, P.M. Calibration of the ruby pressure gauge to 800 kbar under quasi-hydrostatic conditions. J. Geophys. Res. Solid Earth 1986, 91, 4673–4676. [Google Scholar] [CrossRef]
- Dera, P.; Zhuravlev, K.; Prakapenka, V.; Rivers, M.L.; Finkelstein, G.J.; Grubor-Urosevic, O.; Tschauner, O.; Clark, S.M.; Downs, R.T. High pressure single-crystal micro x-ray diffraction analysis with gse_ada/rsv software. High Press. Res. 2013, 33, 466–484. [Google Scholar] [CrossRef]
- Sheldrick, G.M. Cell_Now; Version 2008/4; Georg-August-Universität Göttingen: Göttingen, Germany, 2008. [Google Scholar]
- Sheldrick, G. A short history of shelx. Acta Crystallogr. Sect. A 2008, 64, 112–122. [Google Scholar] [CrossRef] [PubMed]
- Gonzalez-Platas, J.; Alvaro, M.; Nestola, F.; Angel, R. EosFit7-GUI: A new graphical user interface for equation of state calculations, analyses and teaching. J. Appl. Crystallogr. 2016, 49, 1377–1382. [Google Scholar] [CrossRef]
- Vinet, P.; Smith, J.R.; Ferrante, J.; Rose, J.H. Temperature effects on the universal equation of state of solids. Phys. Rev. B 1987, 35, 1945–1953. [Google Scholar] [CrossRef] [Green Version]
- Jeanloz, R. Universal equation of state. Phys. Rev. B 1988, 38, 805–807. [Google Scholar] [CrossRef]
- Dolomanov, O.V.; Bourhis, L.J.; Gildea, R.J.; Howard, J.A.K.; Puschmann, H. Olex2: A complete structure solution, refinement and analysis program. J. Appl. Crystallogr. 2009, 42, 339–341. [Google Scholar] [CrossRef]
- Wolff, S.K.; Grimwood, D.J.; McKinnon, J.J.; Turner, M.J.; Jayatilaka, D.; Spackman, M.A. Crystalexplorer (Version 3.1); University of Western Australia: Crawley, Australia, 2012. [Google Scholar]
- Menges, F. Spectragryph—Optical Spectroscopy Software, Version 1.2.8; Spectroscopy Ninja: Oberstdorf, Germany, 2018. [Google Scholar]
- Varghese, J.N.; O’Connell, A.M.; Maslen, E.N. The x-ray and neutron crystal structure of 2,4,6-triamino-1,3,5-triazine (melamine). Acta Cryst. 1977, B33, 2102–2108. [Google Scholar] [CrossRef]
- Hazen, R.M.; Downs, R.T. High-temperature and high-pressure crystal chemistry. In Reviews in Mineralogy and Geochemistry; Hazen, R.M., Downs, R.T., Eds.; Mineralogical Society of America: Washington, DC, USA, 2000; Volume 41. [Google Scholar]
- Ciabini, L.; Gorelli, F.A.; Santoro, M.; Bini, R.; Schettino, V.; Mezouar, M. High-pressure and high-temperature equation of state and phase diagram of solid benzene. Phys. Rev. B 2005, 72, 094108. [Google Scholar] [CrossRef]
- Nobrega, M.M.; Temperini, M.L.A.; Bini, R. Probing the chemical stability of aniline under high pressure. J. Phys. Chem. C 2017, 121, 7495–7501. [Google Scholar] [CrossRef]
- Hanfland, M.; Brister, K.; Syassen, K. Graphite under pressure: Equation of state and first-order raman modes. Phys. Rev. B 1989, 39, 12598–12603. [Google Scholar] [CrossRef]
- Funnell, N.P.; Dawson, A.; Marshall, W.G.; Parsons, S. Destabilisation of hydrogen bonding and the phase stability of aniline at high pressure. CrystEngComm 2013, 15, 1047–1060. [Google Scholar] [CrossRef] [Green Version]
- Wen, X.D.; Hoffmann, R.; Ashcroft, N.W. Benzene under high pressure: A story of molecular crystals transforming to saturated networks, with a possible intermediate metallic phase. J. Am. Chem. Soc. 2011, 133, 9023–9035. [Google Scholar] [CrossRef] [PubMed]
- Peiris, S.M.; Piermarini, G.J. Static Compression of Energetic Materials; Springer: Berlin, Germany, 2008; pp. 108–110. [Google Scholar]
- Yoo, C.S.; Cynn, H.; Howard, W.M.; Holmes, N. Equations of State of Unreacted High Explosives at High Pressures 11th International Detonation Symposium, Snowmass Village, CO, USA, 31 August–4 September 1998; Lawrence Livermore National Laboratory: Snowmass Village, CO, USA, 1998. [Google Scholar]
- Stevens, L.L.; Velisavljevic, N.; Hooks, D.E.; Dattelbaum, D.M. Hydrostatic compression curve for triamino-trinitrobenzene determined to 13.0 GPa with powder x-ray diffraction. Propellants Explos. Pyrotech. 2008, 33, 286–295. [Google Scholar] [CrossRef]
- Gump, J.C.; Peiris, S.M. Isothermal equations of state of beta octahydro-1,3,5,7-tetranitro-1,3,5,7-tetrazocine at high temperatures. J. Appl. Phys. 2005, 97, 053513. [Google Scholar] [CrossRef]
- Plisson, T.; Pineau, N.; Weck, G.; Bruneton, E.; Guignot, N.; Loubeyre, P. Equation of state of 1,3,5-triamino-2,4,6-trinitrobenzene up to 66 gpa. J. Appl. Phys. 2017, 122, 235901. [Google Scholar] [CrossRef]
- Millar, D.I.A. Energetic Materials at Extreme Conditions; Springer: Berlin/Heidelberg, Germany, 2012. [Google Scholar]
- Guo, F.; Zhang, H.; Hu, H.-Q.; Cheng, X.-L. Effects of hydrogen bonds on solid state tatb, rdx, and datb under high pressures. Chin. Phys. B 2014, 23, 046501. [Google Scholar] [CrossRef]
- Davidson, A.J.; Dias, R.P.; Dattelbaum, D.M.; Yoo, C.-S. “Stubborn” triaminotrinitrobenzene: Unusually high chemical stability of a molecular solid to 150 GPa. J. Chem. Phys. 2011, 135, 174507. [Google Scholar] [CrossRef] [PubMed]
- Dove, M.T.; Trachenko, K.O.; Tucker, M.G.; Keen, D.A. Rigid unit modes in framework structures: Theory, experiment and applications. Rev. Mineral. Geochem. 2000, 39, 1–33. [Google Scholar] [CrossRef]
- Spackman, M.A.; Jayatilaka, D. Hirshfeld surface analysis. CrystEngComm 2009, 11, 19–32. [Google Scholar] [CrossRef]
- McKinnon, J.J.; Jayatilaka, D.; Spackman, M.A. Towards quantitative analysis of intermolecular interactions with hirshfeld surfaces. Chem. Commun. 2007, 37, 3814–3816. [Google Scholar] [CrossRef]
- Gilli, G.; Gilli, P. The Nature of the Hydrogen Bond: Outline of a Comprehensive Hydrogen Bond Theory; Oxford University Press: Oxford, UK, 2009; pp. 36–61. [Google Scholar]
- Mooibroek, T.J.; Gamez, P. The s-triazine ring, a remarkable unit to generate supramolecular interactions. Inorg. Chim. Acta 2007, 360, 381–404. [Google Scholar] [CrossRef]
- Martinez, C.R.; Iverson, B.L. Rethinking the term “pi-stacking”. Chem. Sci. 2012, 3, 2191–2201. [Google Scholar] [CrossRef]
- Mishra, B.K.; Arey, J.S.; Sathyamurthy, N. Stacking and spreading interaction in n-heteroaromatic systems. J. Phys. Chem. A 2010, 114, 9606–9616. [Google Scholar] [CrossRef] [PubMed]
- Hunter, C.A.; Sanders, J.K.M. The nature of π-π interactions. J. Am. Chem. Soc. 1990, 112, 5525–5534. [Google Scholar] [CrossRef]
- Fanetti, S.; Citroni, M.; Bini, R. Tuning the aromaticity of s-triazine in the crystal phase by pressure. J. Phys. Chem. C 2014, 118, 13764–13768. [Google Scholar] [CrossRef]
- Fanetti, S.; Citroni, M.; Dziubek, K.; Nobrega, M.M.; Bini, R. The role of h-bond in the high-pressure chemistry of model molecules. J. Phys. Condens. Matter 2018, 30, 094001. [Google Scholar] [CrossRef] [PubMed]
- Thiery, M.M.; Kobashi, K.; Spain, I.L. Raman spectra of solid benzene under high pressure. Solid State Commun. 1985, 54, 95–97. [Google Scholar] [CrossRef]
- Schneider, J.R.; Schrader, B. Measurement and calculation of the infrared and raman active molecular and lattice vibrations of the crystalline melamine (1,3,5-triamino-s-triazine). J. Mol. Struct. 1975, 29, 1–14. [Google Scholar] [CrossRef]
- Larkin, P.J.; Makowski, M.P.; Colthup, N.B. The form of the normal modes of s-triazine: Infrared and raman spectral analysis and ab initio force field calculations. Spectrochim. Acta A 1999, 55, 1011–1020. [Google Scholar] [CrossRef]
- Marchewka, M.K. Infrared and raman spectra of the new melaminium salt: 2,4,6-triamino-1,3,5-triazin-1-ium hydrogenphthalate. Mater. Lett. 2004, 58, 843–848. [Google Scholar] [CrossRef]
- Marchewka, M.K. Infrared and raman spectra of melaminium chloride hemihydrate. Mater. Sci. Eng. 2002, B95, 214–221. [Google Scholar] [CrossRef]
- Goncharov, A.; Gregoryanz, E. Chapter 8—Solid nitrogen at extreme conditions of high pressure and temperature. In Chemistry at Extreme Conditions; Manaa, M.R., Ed.; Elsevier: Amsterdam, The Netherlands, 2005; pp. 241–267. [Google Scholar]
- Song, Y.; Hemley, R.J.; Mao, H.-K.; Herschbach, D.R. Chapter 6—Nitrogen-containing molecular systems at high pressures and temperature. In Chemistry at Extreme Conditions; Manaa, M.R., Ed.; Elsevier: Amsterdam, The Netherlands, 2005; pp. 189–222. [Google Scholar]
- Li, W.; Huang, X.; Bao, K.; Zhao, Z.; Huang, Y.; Wang, L.; Wu, G.; Zhou, B.; Duan, D.; Li, F.; et al. A novel high-density phase and amorphization of nitrogen-rich 1h-tetrazole (ch2n4) under high pressure. Sci. Rep. 2017, 7, 39249. [Google Scholar] [CrossRef] [PubMed]
- Shishkina, S.V.; Konovalova, I.S.; Shishkin, O.V.; Boyko, A.N. Acceptor properties of amino groups in aminobenzene crystals: Study from the energetic viewpoint. CrystEngComm 2017, 19, 6274–6288. [Google Scholar] [CrossRef]
- Szatyłowicz, H. Structural aspects of the intermolecular hydrogen bond strength: H-bonded complexes of aniline, phenol and pyridine derivatives. J. Phys. Org. Chem. 2008, 21, 897–914. [Google Scholar] [CrossRef]
- Citroni, M.; Fanetti, S.; Bazzicalupi, C.; Dziubek, K.; Pagliai, M.; Nobrega, M.M.; Mezouar, M.; Bini, R. Structural and electronic competing mechanisms in the formation of amorphous carbon nitride by compressing s-triazine. J. Phys. Org. Chem. C 2015, 119, 28560–28569. [Google Scholar] [CrossRef]
- Citroni, M.; Fanetti, S.; Bini, R. Pressure and laser-induced reactivity in crystalline s-triazine. J. Phys. Org. Chem. C 2014, 118, 10284–10290. [Google Scholar] [CrossRef]
- Li, S.; Li, Q.; Xiong, L.; Li, X.; Li, W.; Cui, W.; Liu, R.; Liu, J.; Yang, K.; Liu, B.; et al. Effect of pressure on heterocyclic compounds: Pyrimidine and s-triazine. J. Phys. Org. Chem. 2014, 141, 114902. [Google Scholar] [CrossRef] [PubMed]
- Li, W.; Duan, D.; Huang, X.; Jin, X.; Yang, X.; Li, S.; Jiang, S.; Huang, Y.; Li, F.; Cui, Q.; et al. Pressure-induced diversity of π-stacking motifs and amorphous polymerization in pyrrole. J. Phys. Org. Chem. C 2014, 118, 12420–12427. [Google Scholar] [CrossRef]
- Zhuravlev, K.K.; Traikov, K.; Dong, Z.; Xie, S.; Song, Y.; Liu, Z. Raman and infrared spectroscopy of pyridine under high pressure. Phys. Rev. B 2010, 82, 064116. [Google Scholar] [CrossRef]
- Wang, K.; Duan, D.; Wang, R.; Lin, A.; Cui, Q.; Liu, B.; Cui, T.; Zou, B.; Zhang, X.; Hu, J.; et al. Stability of hydrogen-bonded supramolecular architecture under high pressure conditions: Pressure-induced amorphization in melamine−boric acid adduct. Langmuir 2009, 25, 4787–4791. [Google Scholar] [CrossRef] [PubMed]
- Wang, K.; Duan, D.; Wang, R.; Liu, D.; Tang, L.; Cui, T.; Liu, B.; Cui, Q.; Liu, J.; Zou, B.; et al. Pressure-induced phase transition in hydrogen-bonded supramolecular adduct formed by cyanuric acid and melamine. J. Phys. Org. Chem. B 2009, 113, 14719–14724. [Google Scholar] [CrossRef] [PubMed]
Figure 1.
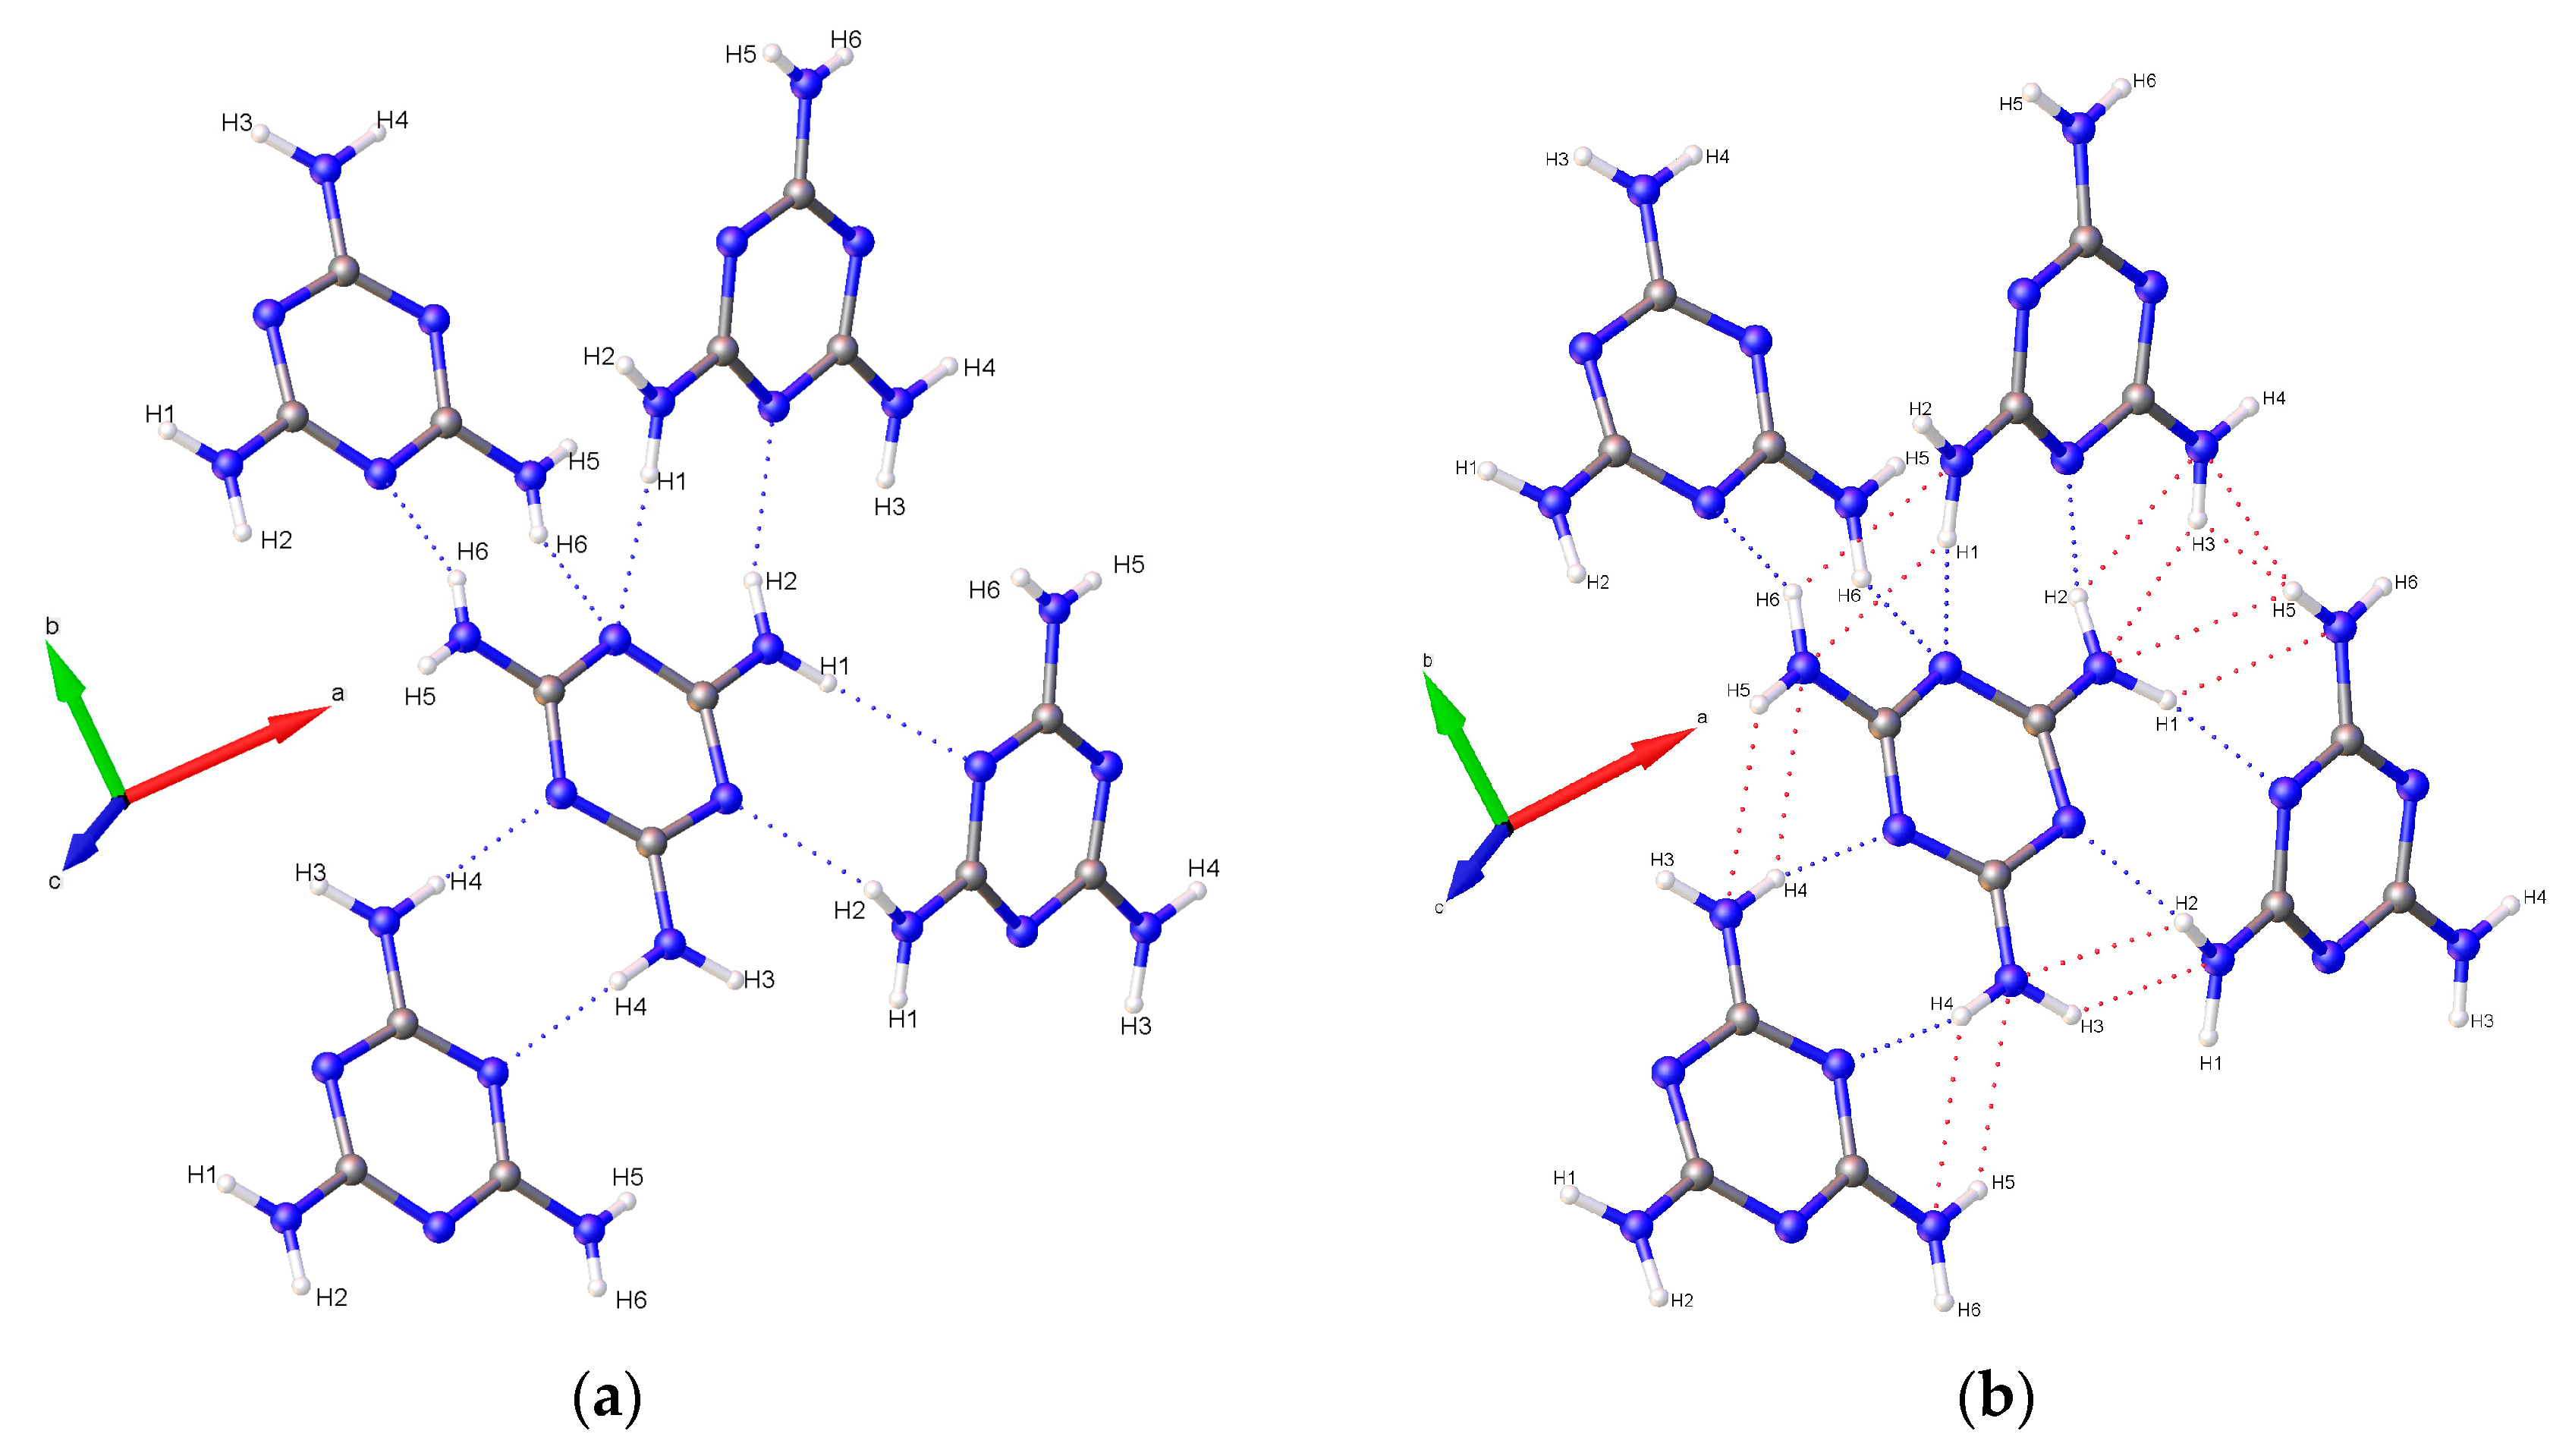
Hydrogen bonding network of melamine at (a) low (0.96(5) GPa) and (b) high (36.21(5) GPa) pressures. Potential hydrogen bonding interactions between anti-parallel amino N-H groups induced by pressure are displayed in red. Bonds behind and in front of the plane of view are omitted for clarity.
Figure 1.
Hydrogen bonding network of melamine at (a) low (0.96(5) GPa) and (b) high (36.21(5) GPa) pressures. Potential hydrogen bonding interactions between anti-parallel amino N-H groups induced by pressure are displayed in red. Bonds behind and in front of the plane of view are omitted for clarity.
Figure 2.
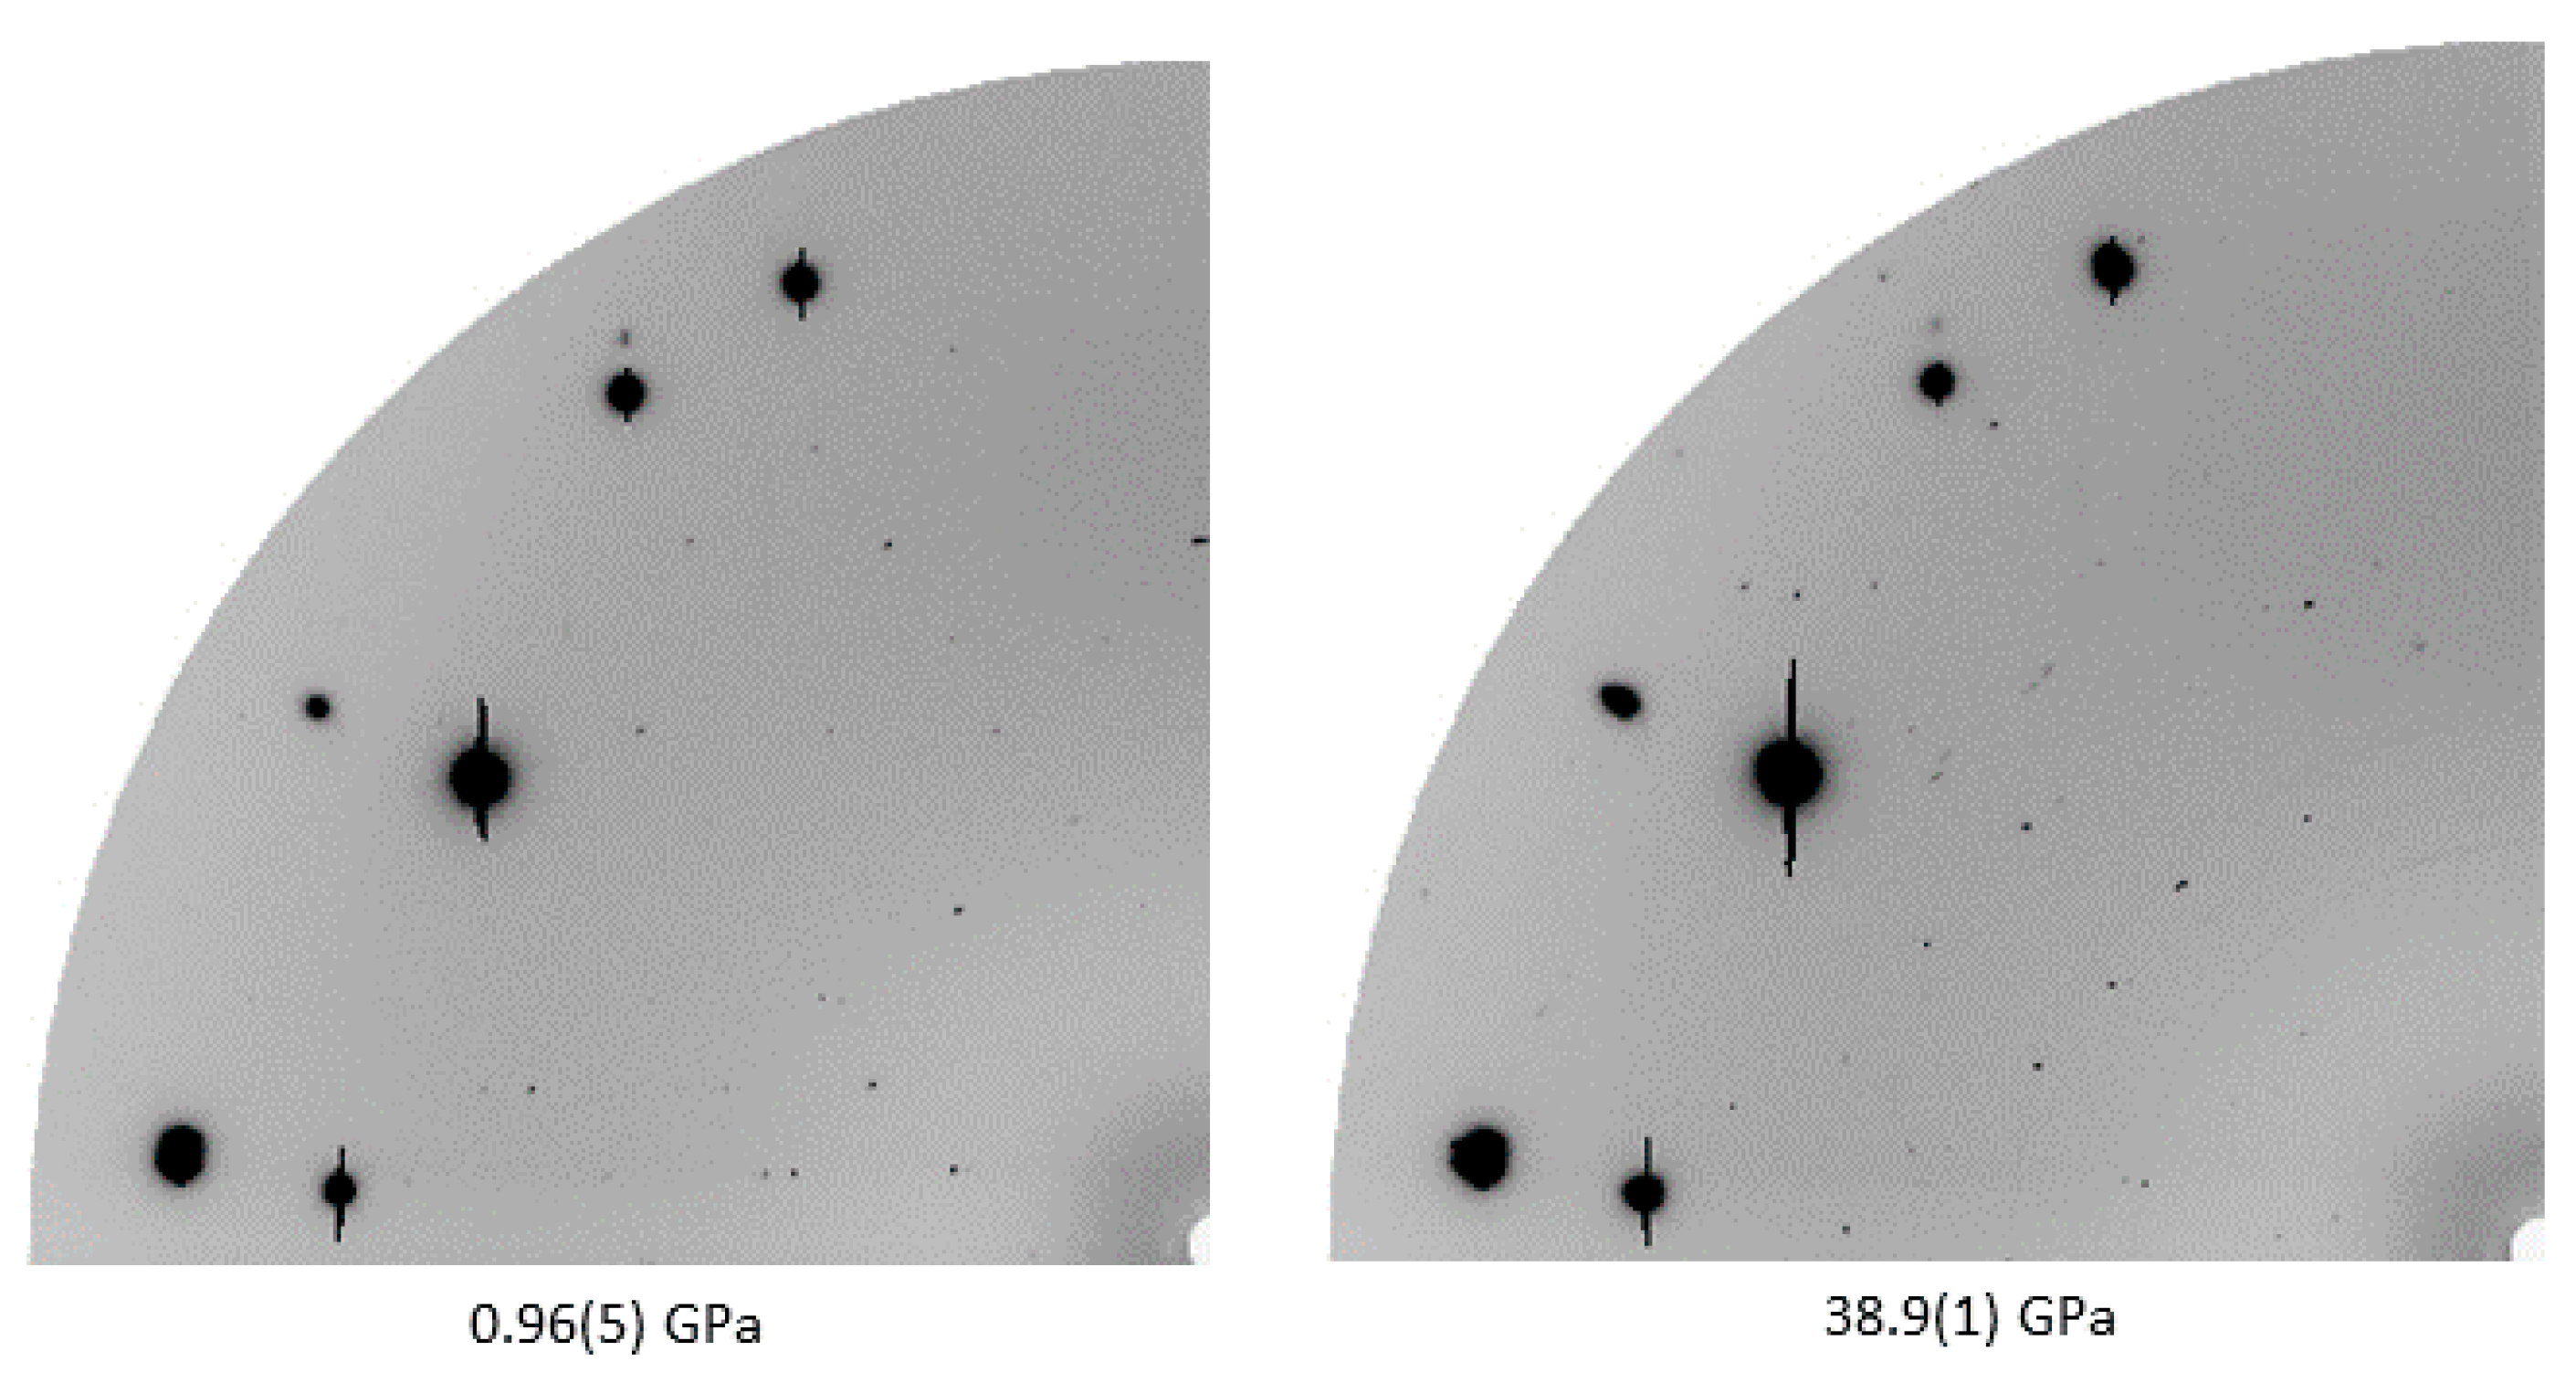
Diffraction patterns at the central detector position of low- and high-pressure phases of melamine, displaying the change in pattern before and after the reversible structural phase transition above 36 GPa in helium.
Figure 2.
Diffraction patterns at the central detector position of low- and high-pressure phases of melamine, displaying the change in pattern before and after the reversible structural phase transition above 36 GPa in helium.
Figure 3.
Visible changes in a melamine crystal before (a) and after (b) the irreversible high-pressure amorphization at 45 GPa in helium.
Figure 3.
Visible changes in a melamine crystal before (a) and after (b) the irreversible high-pressure amorphization at 45 GPa in helium.
Figure 4.
Evolution of unit cell volume of melamine with pressure. Data points were fitted with a third-order Vinet equation of state, V0 = 536.7(2) Å3, K0 = 12.9(8) GPa, and K′ = 7.4(3). Open circles indicate 2010 data collected in Ne, filled circles indicate 2015 data collected in He.
Figure 4.
Evolution of unit cell volume of melamine with pressure. Data points were fitted with a third-order Vinet equation of state, V0 = 536.7(2) Å3, K0 = 12.9(8) GPa, and K′ = 7.4(3). Open circles indicate 2010 data collected in Ne, filled circles indicate 2015 data collected in He.
Figure 5.
Evolution of normalized unit cell parameters of melamine with pressure. Linear axial compressibilities are βa0 = 6.54(5) × 10−3 GPa−1, βb0 = 1.89(1) × 10−3 GPa−1, and βc0 = 9.0(1) × 10−3 GPa−1.
Figure 5.
Evolution of normalized unit cell parameters of melamine with pressure. Linear axial compressibilities are βa0 = 6.54(5) × 10−3 GPa−1, βb0 = 1.89(1) × 10−3 GPa−1, and βc0 = 9.0(1) × 10−3 GPa−1.
Figure 6.
Average carbon-nitrogen bond lengths for ring and amine components of melamine. Each follows a loosely linear decrease in length with pressure.
Figure 6.
Average carbon-nitrogen bond lengths for ring and amine components of melamine. Each follows a loosely linear decrease in length with pressure.
Figure 7.
Hirshfeld surfaces displaying the shape index of melamine at low (0.96(5) GPa), (a) and high (36.21(5) GPa), (b) pressures. Concave areas, shown in red, correspond to areas where a complimentary neighboring molecule may interact.
Figure 7.
Hirshfeld surfaces displaying the shape index of melamine at low (0.96(5) GPa), (a) and high (36.21(5) GPa), (b) pressures. Concave areas, shown in red, correspond to areas where a complimentary neighboring molecule may interact.
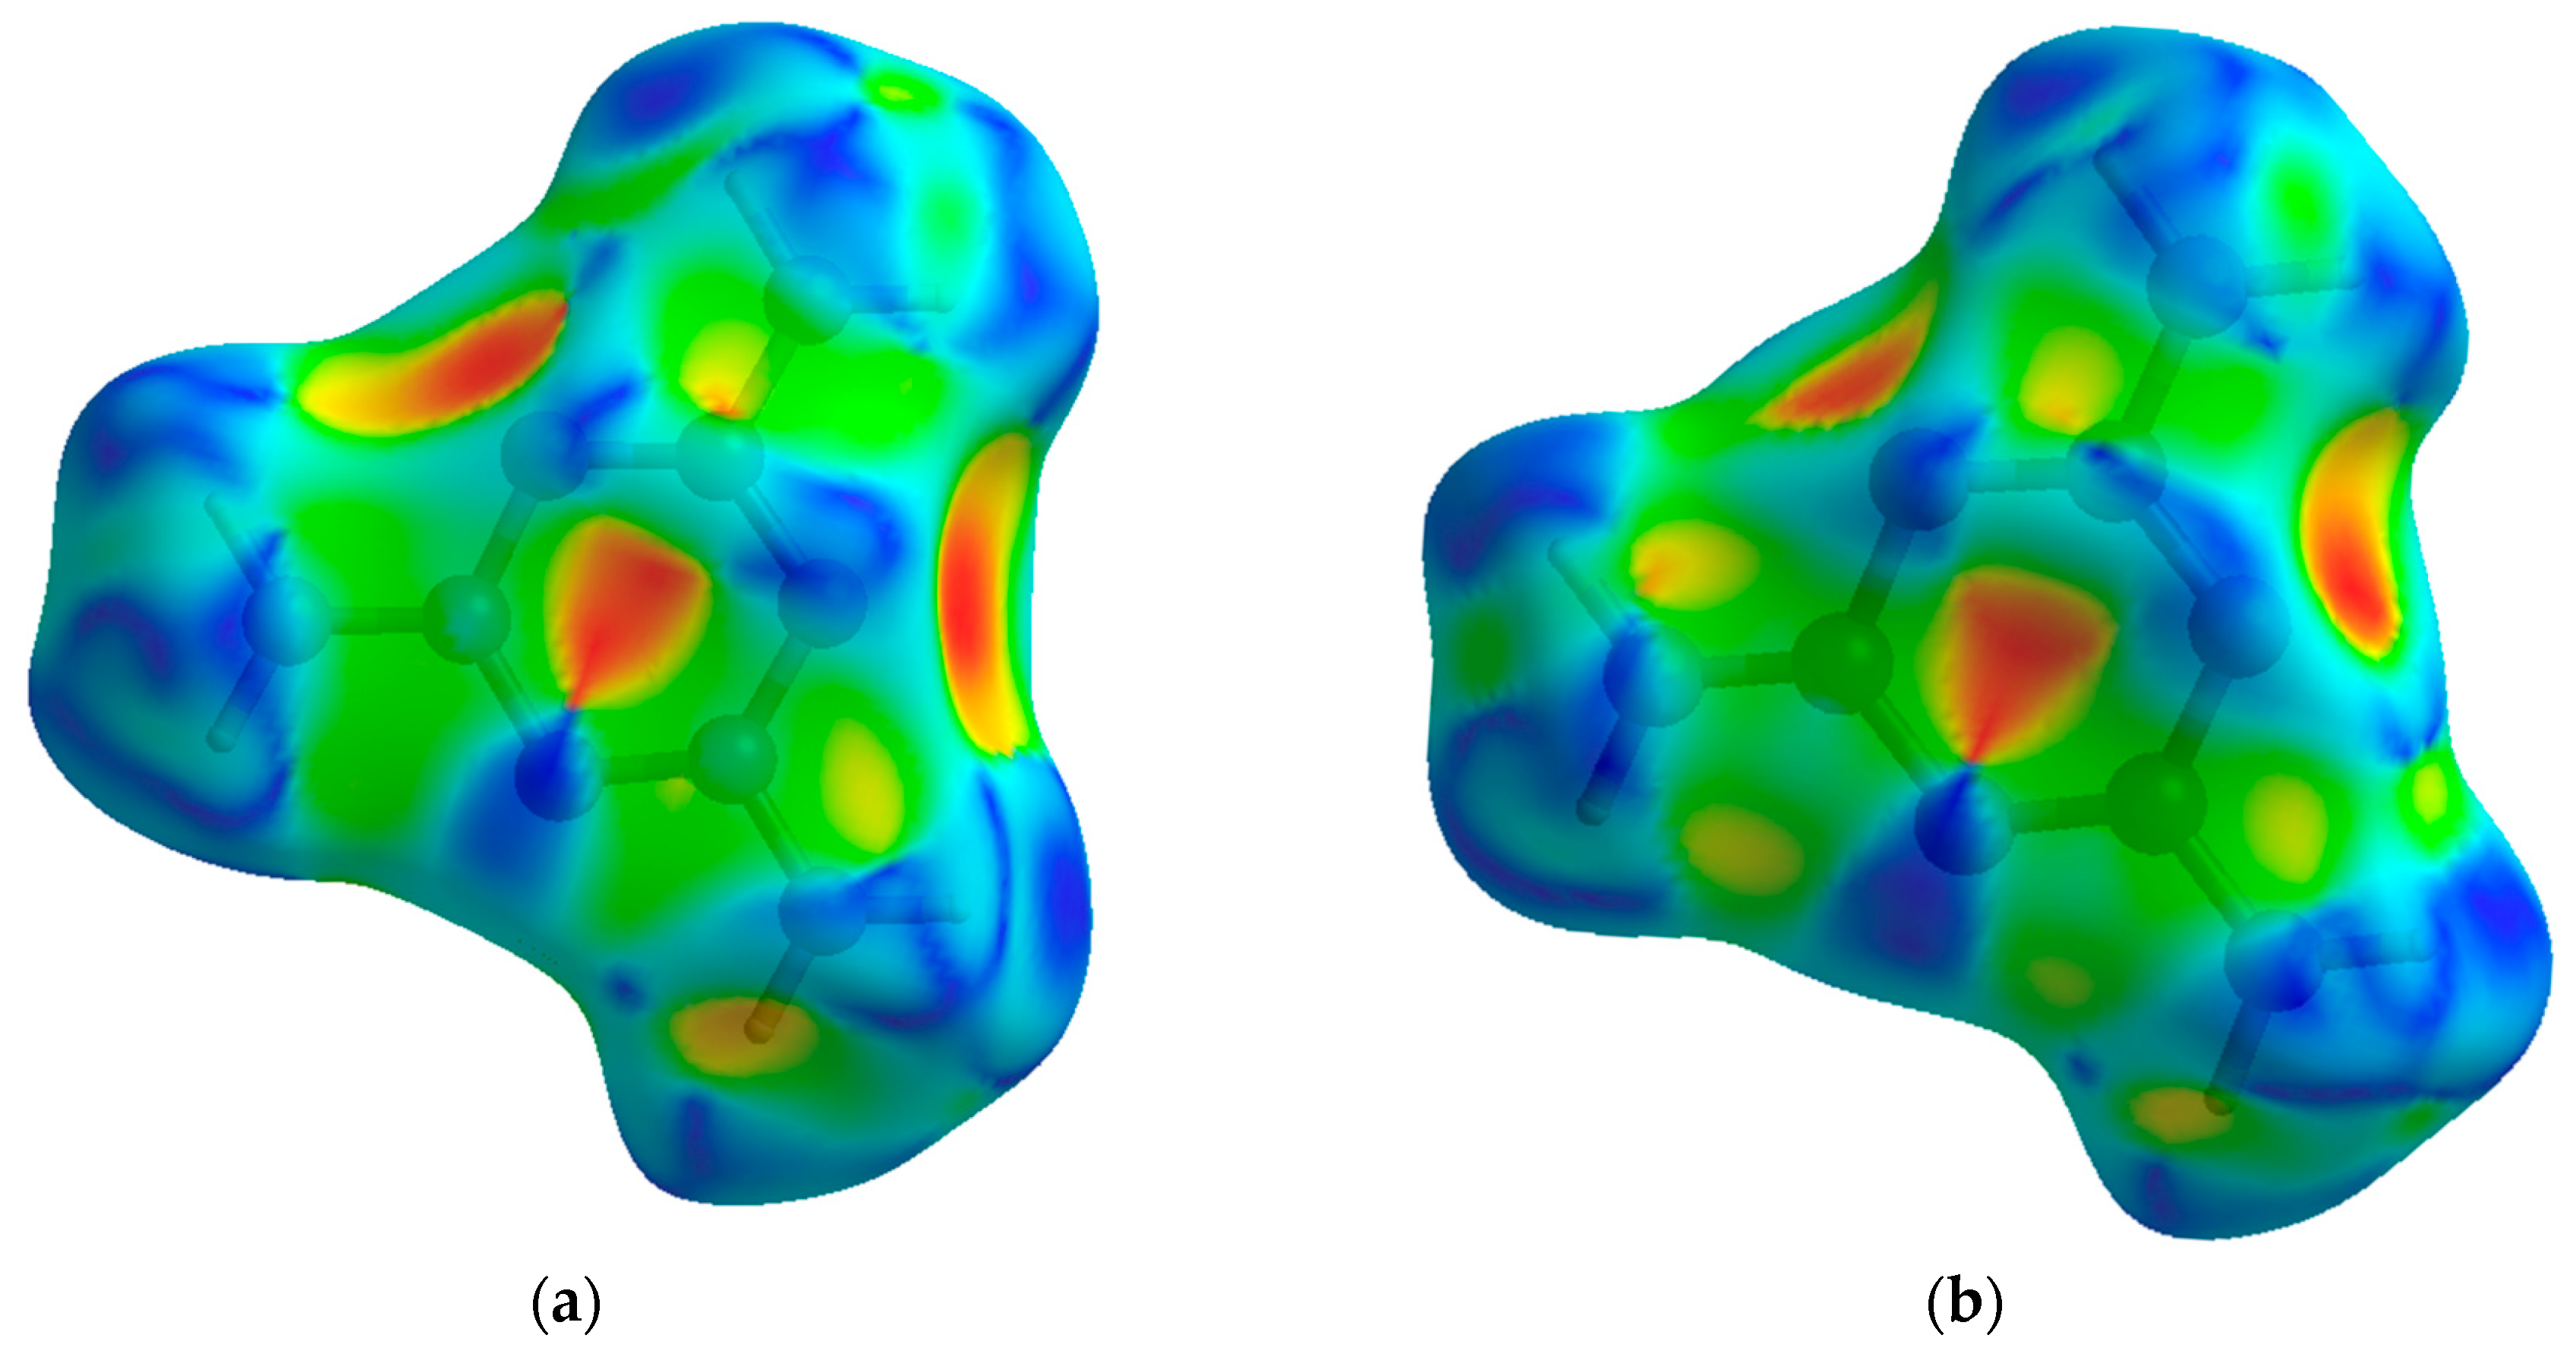
Figure 8.
Hirshfeld surfaces displaying dnorm at 0.96(5), 17.10(5), and 36.21(5) GPa. As pressure increases, intermolecular contacts are induced, primarily as new hydrogen bonds.
Figure 8.
Hirshfeld surfaces displaying dnorm at 0.96(5), 17.10(5), and 36.21(5) GPa. As pressure increases, intermolecular contacts are induced, primarily as new hydrogen bonds.
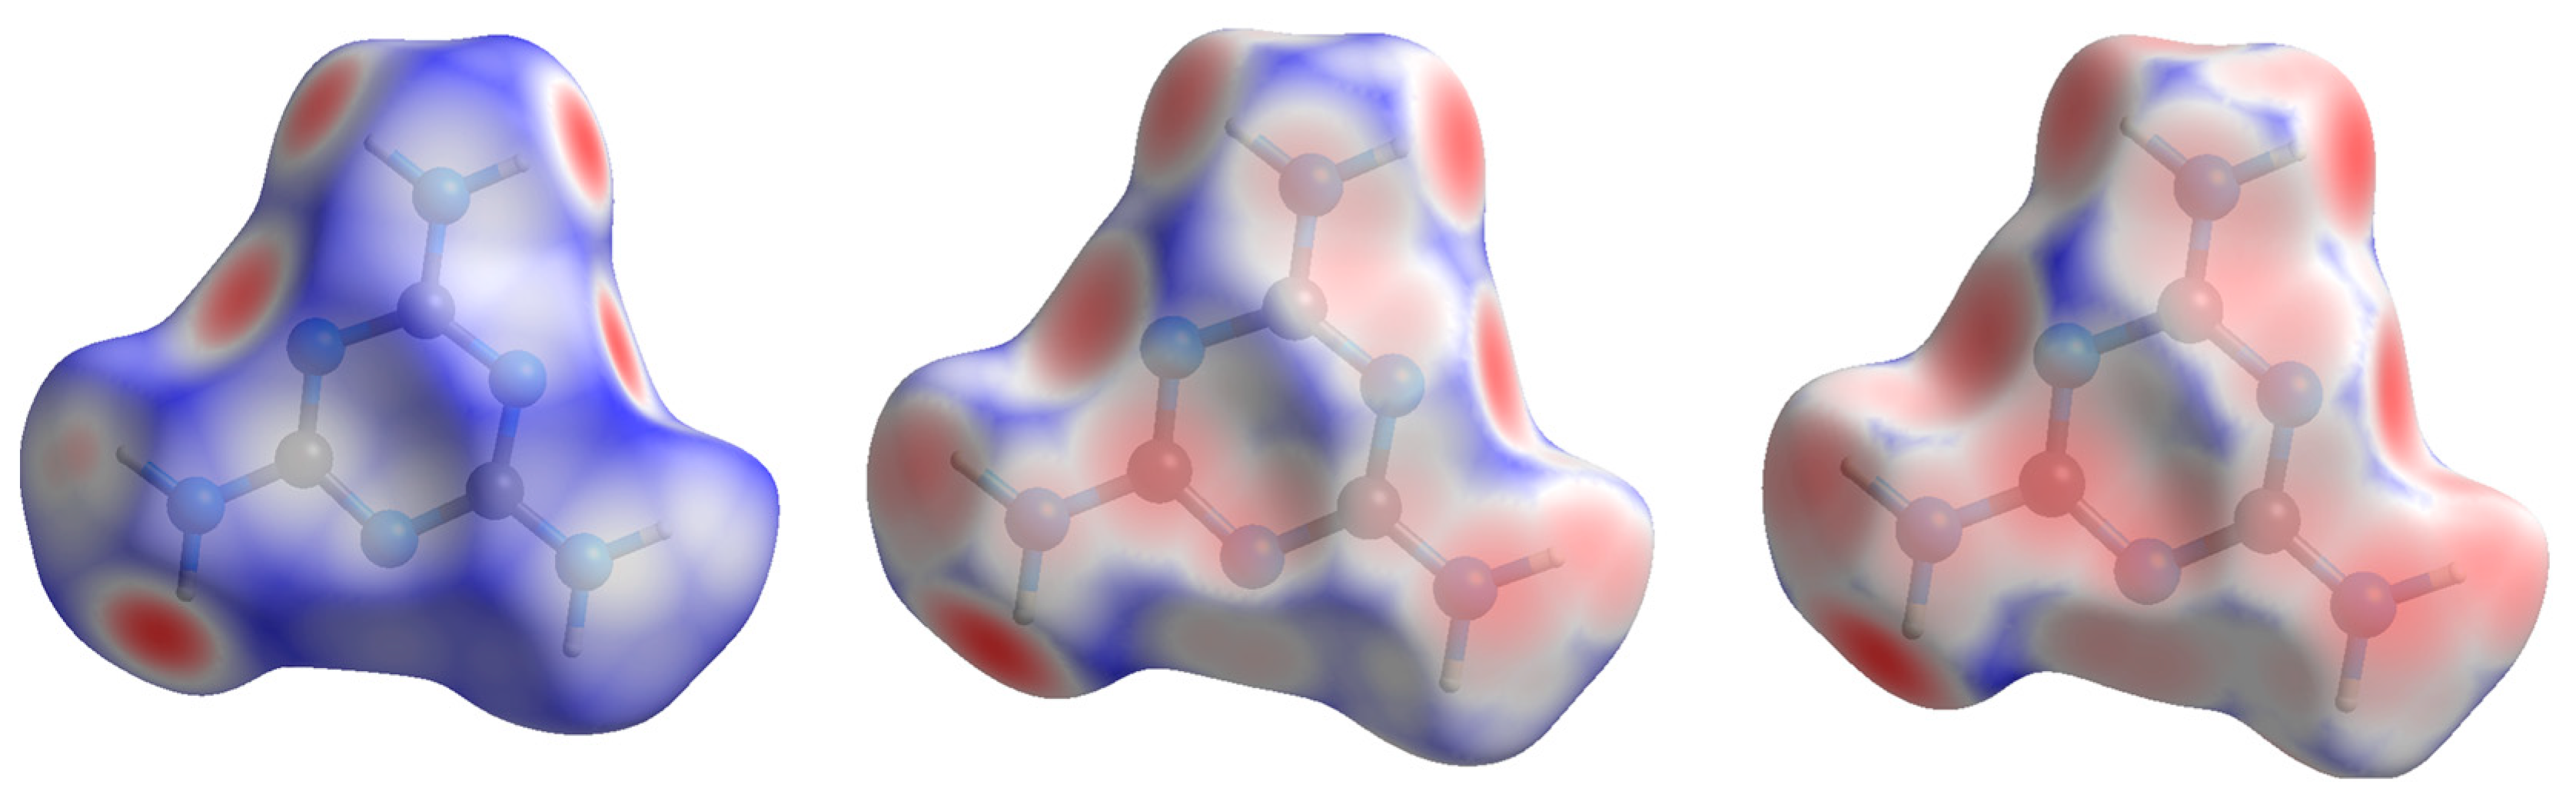
Figure 9.
Intra-plane hydrogen bond D···A distance as a function of pressure, fitted with a third-order polynomial function.
Figure 9.
Intra-plane hydrogen bond D···A distance as a function of pressure, fitted with a third-order polynomial function.
Figure 10.
Inter-plane hydrogen bond D···A distance as a function of pressure, fitted with a third-order polynomial function.
Figure 10.
Inter-plane hydrogen bond D···A distance as a function of pressure, fitted with a third-order polynomial function.
Figure 11.
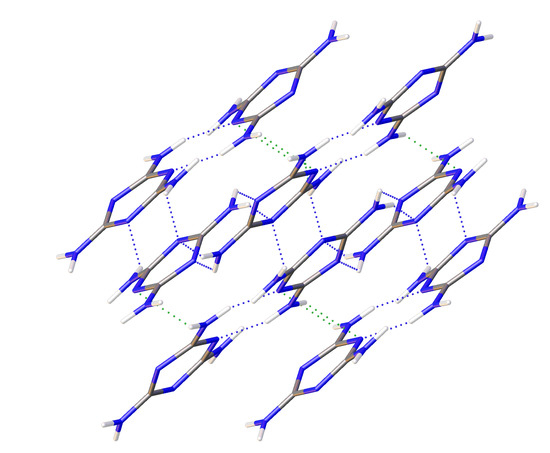
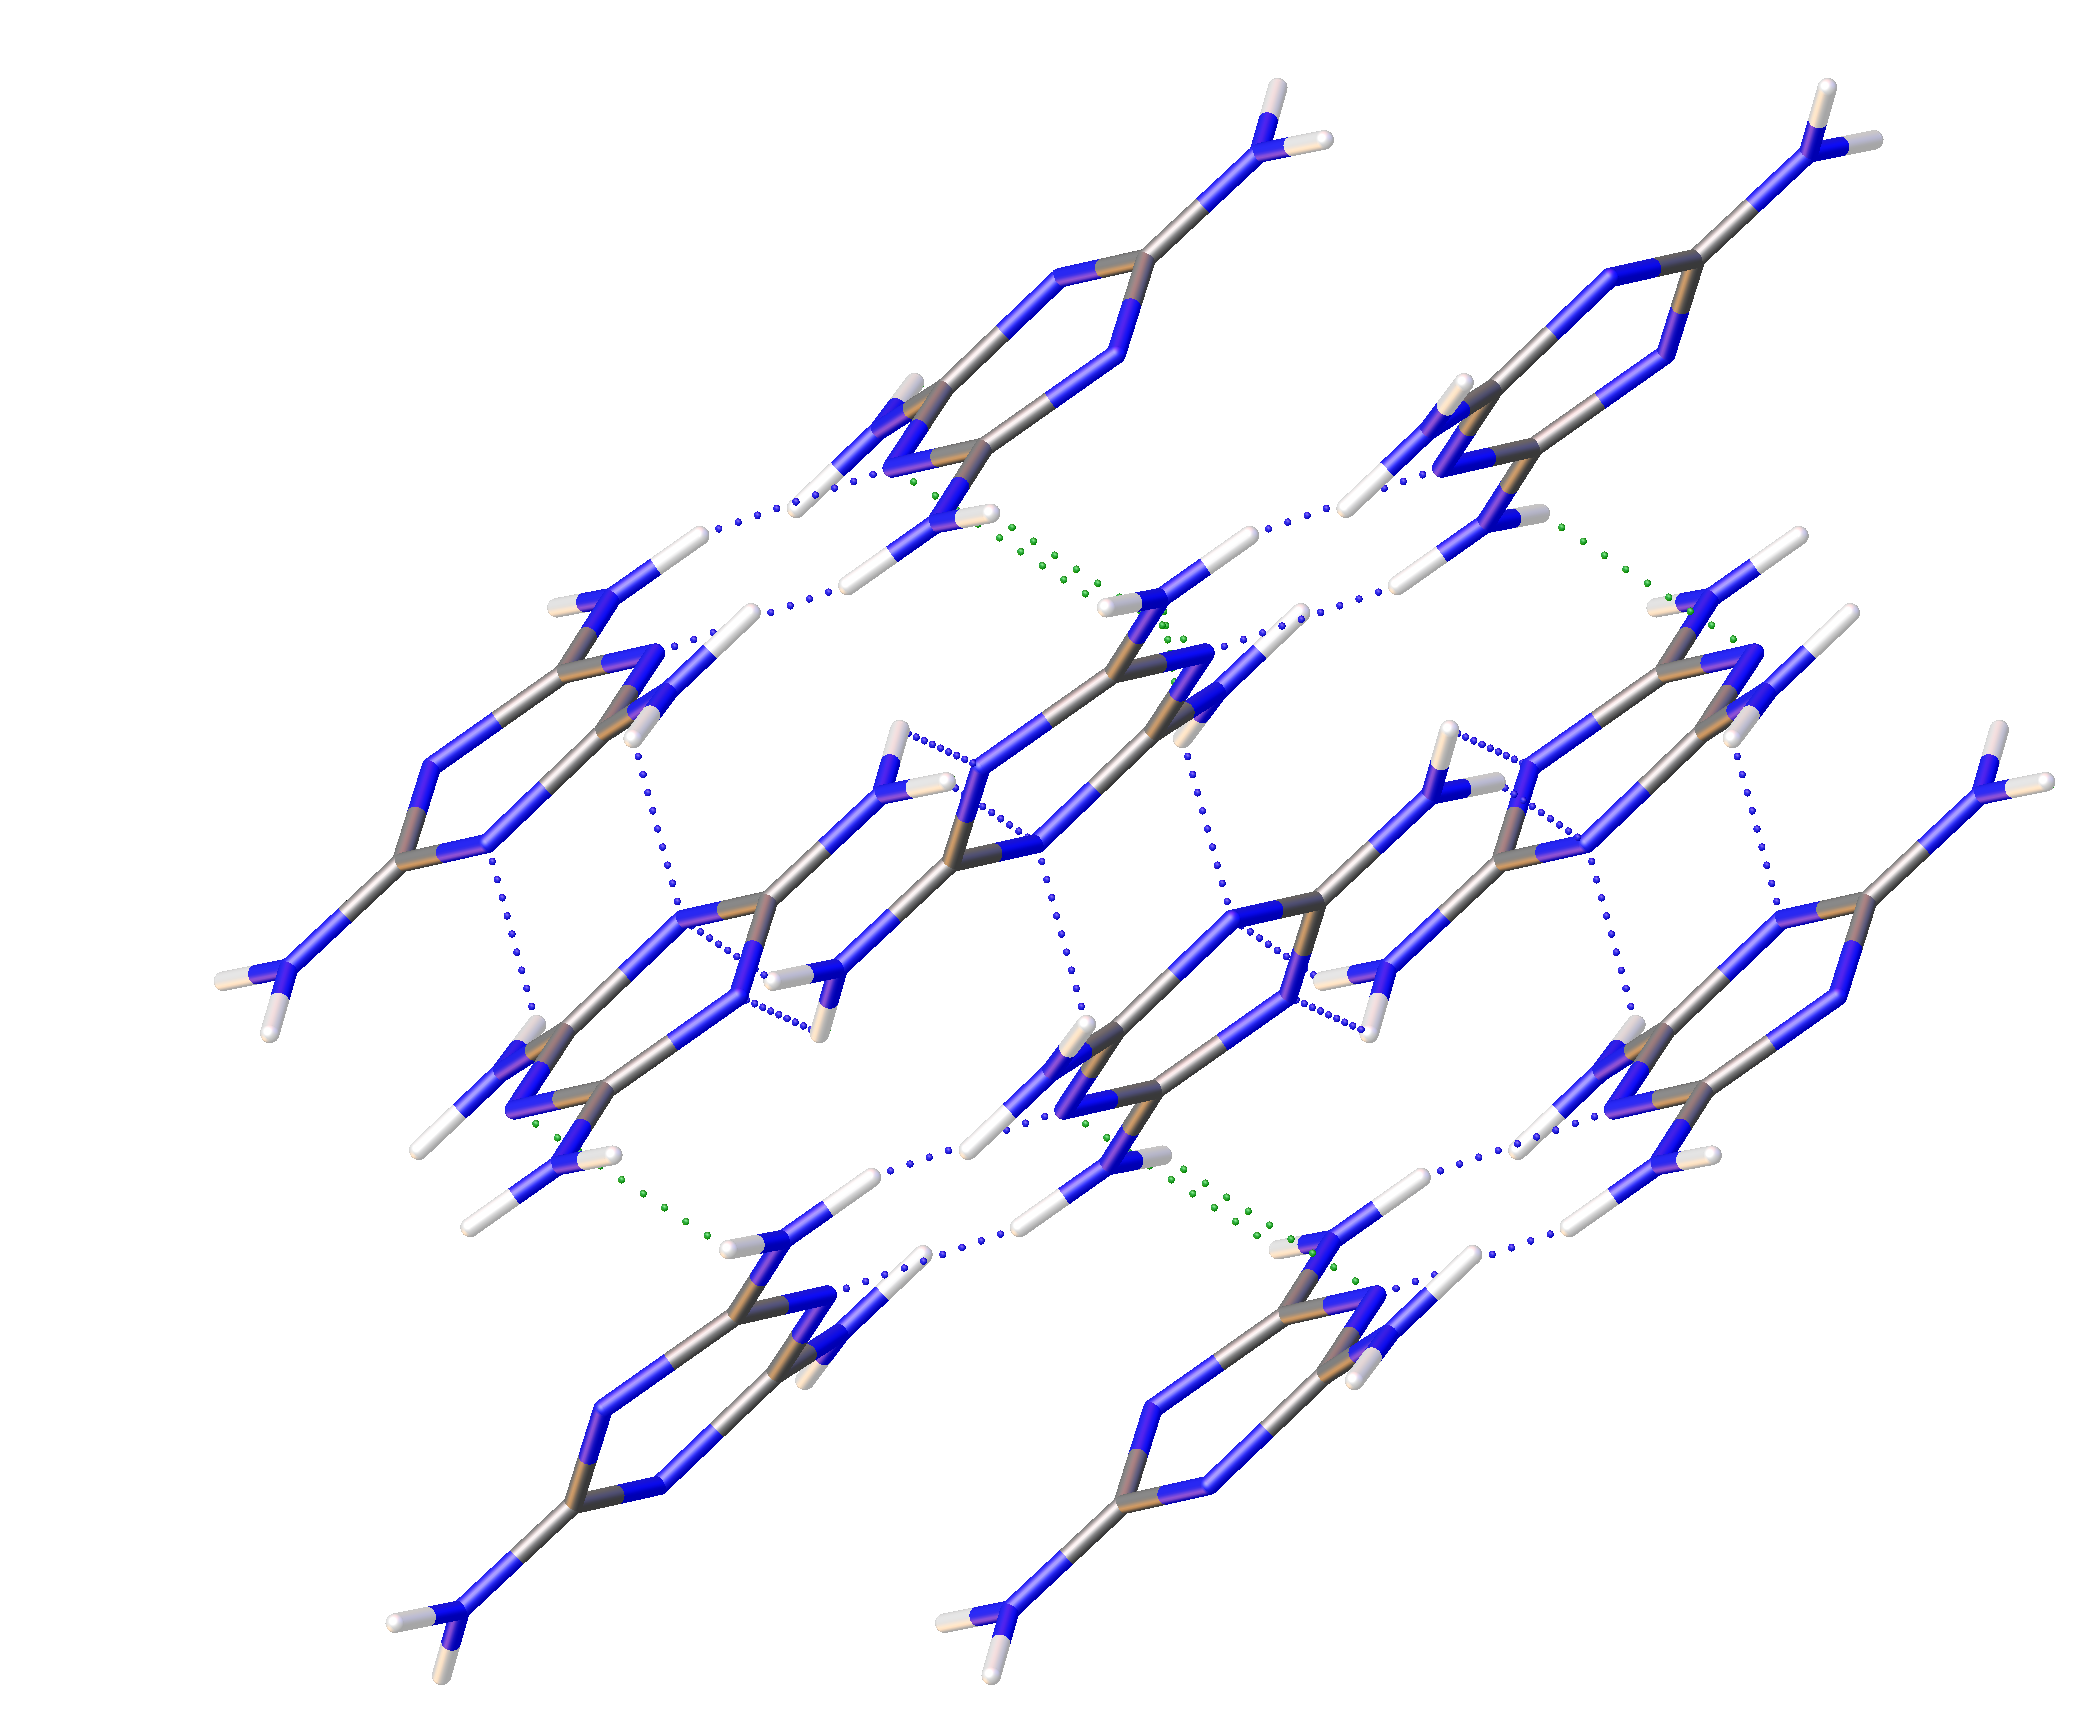
Hydrogen bonding network of melamine at (a) low (0.96(5) GPa) and (b) high (36.21(5) GPa) pressures, as viewed down <010>, displaying the layered structure. New hydrogen bonds to the central ring have been highlighted in green. Some bonds, including weak amino N-H interactions, have been omitted for clarity.
Figure 11.
Hydrogen bonding network of melamine at (a) low (0.96(5) GPa) and (b) high (36.21(5) GPa) pressures, as viewed down <010>, displaying the layered structure. New hydrogen bonds to the central ring have been highlighted in green. Some bonds, including weak amino N-H interactions, have been omitted for clarity.
Figure 12.
Electrostatic potential surfaces of neighboring melamine molecules at 6.33(5) (a) and 36.21(5) (b) GPa, scaled from −0.0928 to 0.1388 au. Regions in red are electron-rich, while regions in blue are electron deficient. With pressure, distance between melamine ring centroids oriented in parallel planes decreases, and the offset angle to the next pair of molecules decreases.

Figure 13.
Raman spectra of melamine in N-H vibration region, vertical offset indicates sequential pressure steps in GPa, as shown on the right vertical axis. Intensity is arbitrary with vertical stacking offset.
Figure 13.
Raman spectra of melamine in N-H vibration region, vertical offset indicates sequential pressure steps in GPa, as shown on the right vertical axis. Intensity is arbitrary with vertical stacking offset.
Figure 14.
Raman spectra of melamine in the ring vibration-mode range, vertical offset indicates pressure steps in GPa. Splitting of the 750 cm−1 and 1100 cm−1 peaks is observed at 29.80(5) GPa in Ne.
Figure 14.
Raman spectra of melamine in the ring vibration-mode range, vertical offset indicates pressure steps in GPa. Splitting of the 750 cm−1 and 1100 cm−1 peaks is observed at 29.80(5) GPa in Ne.
Figure 15.
Raman spectra of melamine in the C-N vibration mode range, vertical offset indicates pressure steps in GPa. Appearance of new peaks at approximately 1700 and 17900 rel cm−1 are seen above approximately 30 GPa.
Figure 15.
Raman spectra of melamine in the C-N vibration mode range, vertical offset indicates pressure steps in GPa. Appearance of new peaks at approximately 1700 and 17900 rel cm−1 are seen above approximately 30 GPa.
Table 1.
Selected data collection and refinement details from lowest and highest pressure points. The opening angle of the diamond anvil cell in the 2015_10 experiment was larger by 20° compared to the 2010_1 experiment, producing higher number of observed peaks.
Table 1.
Selected data collection and refinement details from lowest and highest pressure points. The opening angle of the diamond anvil cell in the 2015_10 experiment was larger by 20° compared to the 2010_1 experiment, producing higher number of observed peaks.
| 2010_1 (0.96(5) GPa) | Parameters | 2015_10 (36.21(5) GPa) | Parameters |
|---|---|---|---|
| No. of reflections collected | 453 | No. of reflections collected | 654 |
| No. of independent reflections | 186 | No. of independent reflections | 221 |
| Rint | 0.1272 | Rint | 0.0944 |
| R[F2 > 4σ(F2)] | 0.0611 | R[F2 > 4σ(F2)] | 0.0700 |
| wR(F2) | 0.1396 | wR(F2) | 0.1652 |
| Goodness-of-fit | 1.114 | Goodness-of-fit | 1.231 |
| No. of parameters refined | 40 | No. of parameters refined | 40 |
| No. of restraints used | 0 | No. of restraints used | 0 |
Table 2.
Unit cell parameters as a function of pressure. 2010 data were collected in Ne, 2015 data in He.
Table 2.
Unit cell parameters as a function of pressure. 2010 data were collected in Ne, 2015 data in He.
| Data Set | P (GPa) | a (Å) | b (Å) | c (Å) | β (°) | V (Å3) |
|---|---|---|---|---|---|---|
| 2010 | 10−4 | 10.606(1) | 7.495(1) | 7.295(2) | 112.26(2) | 536.7(2) |
| 2010 | 0.96(5) | 10.410(6) | 7.465(2) | 7.086(6) | 113.90(4) | 503.5(6) |
| 2010 | 2.9(1) | 10.148(6) | 7.389(2) | 6.954(6) | 115.93(4) | 468.9(5) |
| 2015 | 3.5(1) | 10.099(1) | 7.372(1) | 6.866(1) | 116.47(1) | 457.6(6) |
| 2010 | 4.7(1) | 9.962(6) | 7.333(2) | 6.821(6) | 117.14(4) | 443.4(5) |
| 2015 | 6.3(1) | 9.906(1) | 7.306(1) | 6.737(6) | 117.62(3) | 432.0(4) |
| 2010 | 7.7(1) | 9.807(4) | 7.274(1) | 6.705(4) | 118.07(3) | 422.0(4) |
| 2015 | 9.0(1) | 9.740(1) | 7.250(1) | 6.623(7) | 118.47(4) | 411.1(5) |
| 2010 | 10.5(1) | 9.678(6) | 7.235(1) | 6.616(5) | 118.34(4) | 407.8(4) |
| 2015 | 12.8(1) | 9.572(1) | 7.191(1) | 6.481(6) | 119.21(3) | 389.4(4) |
| 2010 | 16.8(1) | 9.446(6) | 7.151(2) | 6.350(5) | 119.89(4) | 371.9(4) |
| 2015 | 17.1(1) | 9.404(1) | 7.136(1) | 6.359(6) | 119.86(4) | 370.1(4) |
| 2010 | 19.8(1) | 9.366(7) | 7.122(7) | 6.252(6) | 120.47(5) | 359.4(5) |
| 2015 | 22.0(1) | 9.246(1) | 7.083(1) | 6.287(7) | 120.00(4) | 356.6(4) |
| 2010 | 23.5(1) | 9.254(4) | 7.103(4) | 6.279(4) | 120.14(3) | 356.9(3) |
| 2015 | 27.1(1) | 9.219(1) | 7.039(1) | 6.195(7) | 120.44(5) | 346.6(4) |
| 2015 | 30.8(1) | 9.057(2) | 7.013(1) | 6.128(7) | 120.57(5) | 335.1(4) |
| 2015 | 34.3(1) | 9.006(1) | 6.990(1) | 6.081(7) | 120.67(4) | 329.3(4) |
| 2015 | 36.2(1) | 8.965(1) | 6.966(1) | 6.075(7) | 120.48(5) | 326.9(4) |
© 2018 by the authors. Licensee MDPI, Basel, Switzerland. This article is an open access article distributed under the terms and conditions of the Creative Commons Attribution (CC BY) license (http://creativecommons.org/licenses/by/4.0/).
Share and Cite
MDPI and ACS Style
Shelton, H.; Dera, P.; Tkachev, S. Evolution of Interatomic and Intermolecular Interactions and Polymorphism of Melamine at High Pressure. Crystals 2018, 8, 265. https://doi.org/10.3390/cryst8070265
AMA Style
Shelton H, Dera P, Tkachev S. Evolution of Interatomic and Intermolecular Interactions and Polymorphism of Melamine at High Pressure. Crystals. 2018; 8(7):265. https://doi.org/10.3390/cryst8070265
Chicago/Turabian StyleShelton, Hannah, Przemyslaw Dera, and Sergey Tkachev. 2018. "Evolution of Interatomic and Intermolecular Interactions and Polymorphism of Melamine at High Pressure" Crystals 8, no. 7: 265. https://doi.org/10.3390/cryst8070265
Note that from the first issue of 2016, this journal uses article numbers instead of page numbers. See further details here.