1. Introduction
Compositional inhomogeneity of both natural and synthetic diamond crystals is a well-established phenomenon. Two models for explaining a heterogeneous distribution of carbon isotopes and key impurities within diamond crystals have been debated: changing of the carbon source and fractionation of a fluid over the course of diamond crystallization. Both of these models require marked changes in fluid composition as the driving factor for generating shifts in the carbon isotope ratio and/or the abundances of impurities, the most important of which being nitrogen. A comparison of synthetic and natural crystals reveals some key features that can be obvious for synthetic crystals but which are extremely rare in natural diamonds. First, a strong sectorial distribution pattern for nitrogen both in terms of concentration and isotopic composition has been observed in high temperature and high pressure (HTHP) synthetic diamonds [
1,
2,
3,
4,
5]. It is also known that the growth of diamonds along the [100] direction during chemical vapour deposition (CVD) synthesis leads to lowering the impurities level in the crystal in comparison with material grown along [111] direction [
6]. Less dramatic but consistent sectorial carbon isotope distribution between octahedra and cube growth sectors has also been documented in HTHP synthetic diamonds [
2,
5], whereas most attempts to observe such a compositional pattern in natural diamond crystals have been without success [
7,
8,
9]. Sectorial variations in nitrogen abundance and carbon isotope ratios in natural mixed-habit diamond crystals were reported by Zedgenizov and Harte [
10] for a diamond crystal from Udachnaya pipe and by Howell et al. [
11,
12] for three crystals from unknown locations. These data suggest that some compositional heterogeneity can occur in diamonds with no changing of fluid composition and at roughly equal kinetic conditions because simultaneously grown faces of the same crystal certainly feed from the same fluid. This particular case is the focus of the present research.
Until now, most investigated synthetic crystals come from metal-carbon systems that are highly efficient at diamond production [
1,
13]. Taking into account the general opinion of crystallization of natural diamonds from silicate/carbonate fluids [
14], the difference in composition of the fluid/melt from which diamond grows in experiments and in the nature has brought into question the relevance of such experimental results for geochemistry. However, methods for producing synthetic diamonds from non-metallic systems have now become advanced enough to make such material available for investigation. Here, we present the results of a compositional investigation of diamond material obtained from carbonate system in high-pressure and high-temperature experiments. Together with more detailed data for crystals from metal-carbon systems, our results point to a measurable fractionation of carbon isotopes and nitrogen impurity on the surface of diamond itself, regardless of the bulk composition of the system. This conclusion is supported by ab initio calculations of carbon isotope fractionation on different crystallographic faces of diamond.
Further in the text, we will use the term “octahedral growth” to indicate diamond material grown by faces of octahedra and term “cubic growth” for sectors of growth of cube faces.
3. Discussion
Nitrogen distribution shows a strong sector dependence in synthetic diamond crystals [
1,
2,
3,
4,
5,
15]. Sectors of octahedra were always enriched in nitrogen in comparison with sectors of other forms, including cube, trapezohedra and rhombododecahedra. As mentioned, previously published works considered diamond crystals grown in metal-carbon systems only. In the present study, we report first data collected from diamonds grown in a carbonate system.
A marked difference of nitrogen content reaching over a factor of 10 is clearly seen between cubic and octahedral growth diamond from carbonate system. The value for this difference cannot be precisely established due to the limited dataset for cubic growth, but the overall pattern is the same for diamond crystals from metal-carbon and carbonate systems (
Table 2). This difference is also confirmed by the data from different SIMS laboratories, which fit each other well in both carbon isotopes and nitrogen abundances.
Like nitrogen, the carbon isotope composition also shows a measurable difference between cube and octahedra growth sectors. The use of a single carbon source under identical growth conditions for both investigated samples makes it reasonable to combine the data from octahedral growth in sample 268-2 and from octahedral growth in sample 268-1 to construct a single dataset. This approach makes for a more statistically robust comparison between octahedral and cubic growth. Our dataset shows that cubic growth diamonds are depleted in
13C isotope in comparison to octahedral growth diamonds (
Table 2,
Figure 1). This difference is rather small but exceeds the analytical uncertainty of δ
13C measurements, so it should be consider significant. A similar relationship also can be recognized for crystals grown in metal-carbon system [
5]. In order to illustrate this, a detailed dataset for synthetic diamond crystals synthesized in a Fe-Ni-C system and where both octahedra and cube sectors grew simultaneously is shown in
Table 3. The cube sectors show systematic depletion by about 0.4‰ in heavy carbon isotope in comparison with an adjacent octahedral sector. The size of
13C depletion of cubic sector for the carbonate system is about 0.7‰. The difference between the metal and carbonate systems is negligible and could be solvent dependent or growth rate dependent. What is important is that the direction and magnitude of the effect are the same in both metal-dominated and carbonate-dominated environments (
Table 2).
The obvious similarities between the isotopic patterns of synthetic diamonds from both experimental systems provide evidence of no significant importance of solvent composition for distribution of nitrogen and carbon isotopes between octahedral and cubic growth diamond. By concluding that these effects are structurally defined, a generalized model describing the atomic structures of these particular faces on diamond crystals can be developed.
3.1. Crystal Structure Characteristics and General Regularities of Carbon Isotopes and Impurities Incorporation into a Crystal
A crystal surface can grow either via the incorporation of single atoms or by attaching coordinated groups of atoms. In the first case, the structure and perfectness of the growing surface determine the fractionation of elements and isotopes. Overall, the fractionation is more pronounced upon lowering a linear growth rate of the surface [
16]. In the second case, where carbon atoms have formed a group in a melt/fluid, only minor fractionation would be expected either between a solution and the groups of atoms or between the groups of atoms and the crystal. This process would provide a means for incorporating impurities into the growing crystal while avoiding any significant carbon isotope fractionation. Faces {111}, {110} and {100} differ significantly in their arrangement of atoms and any fractionation of atoms or groups of atoms on attaching to these surfaces should not be equal. Therefore, we consider each of these surfaces separately.
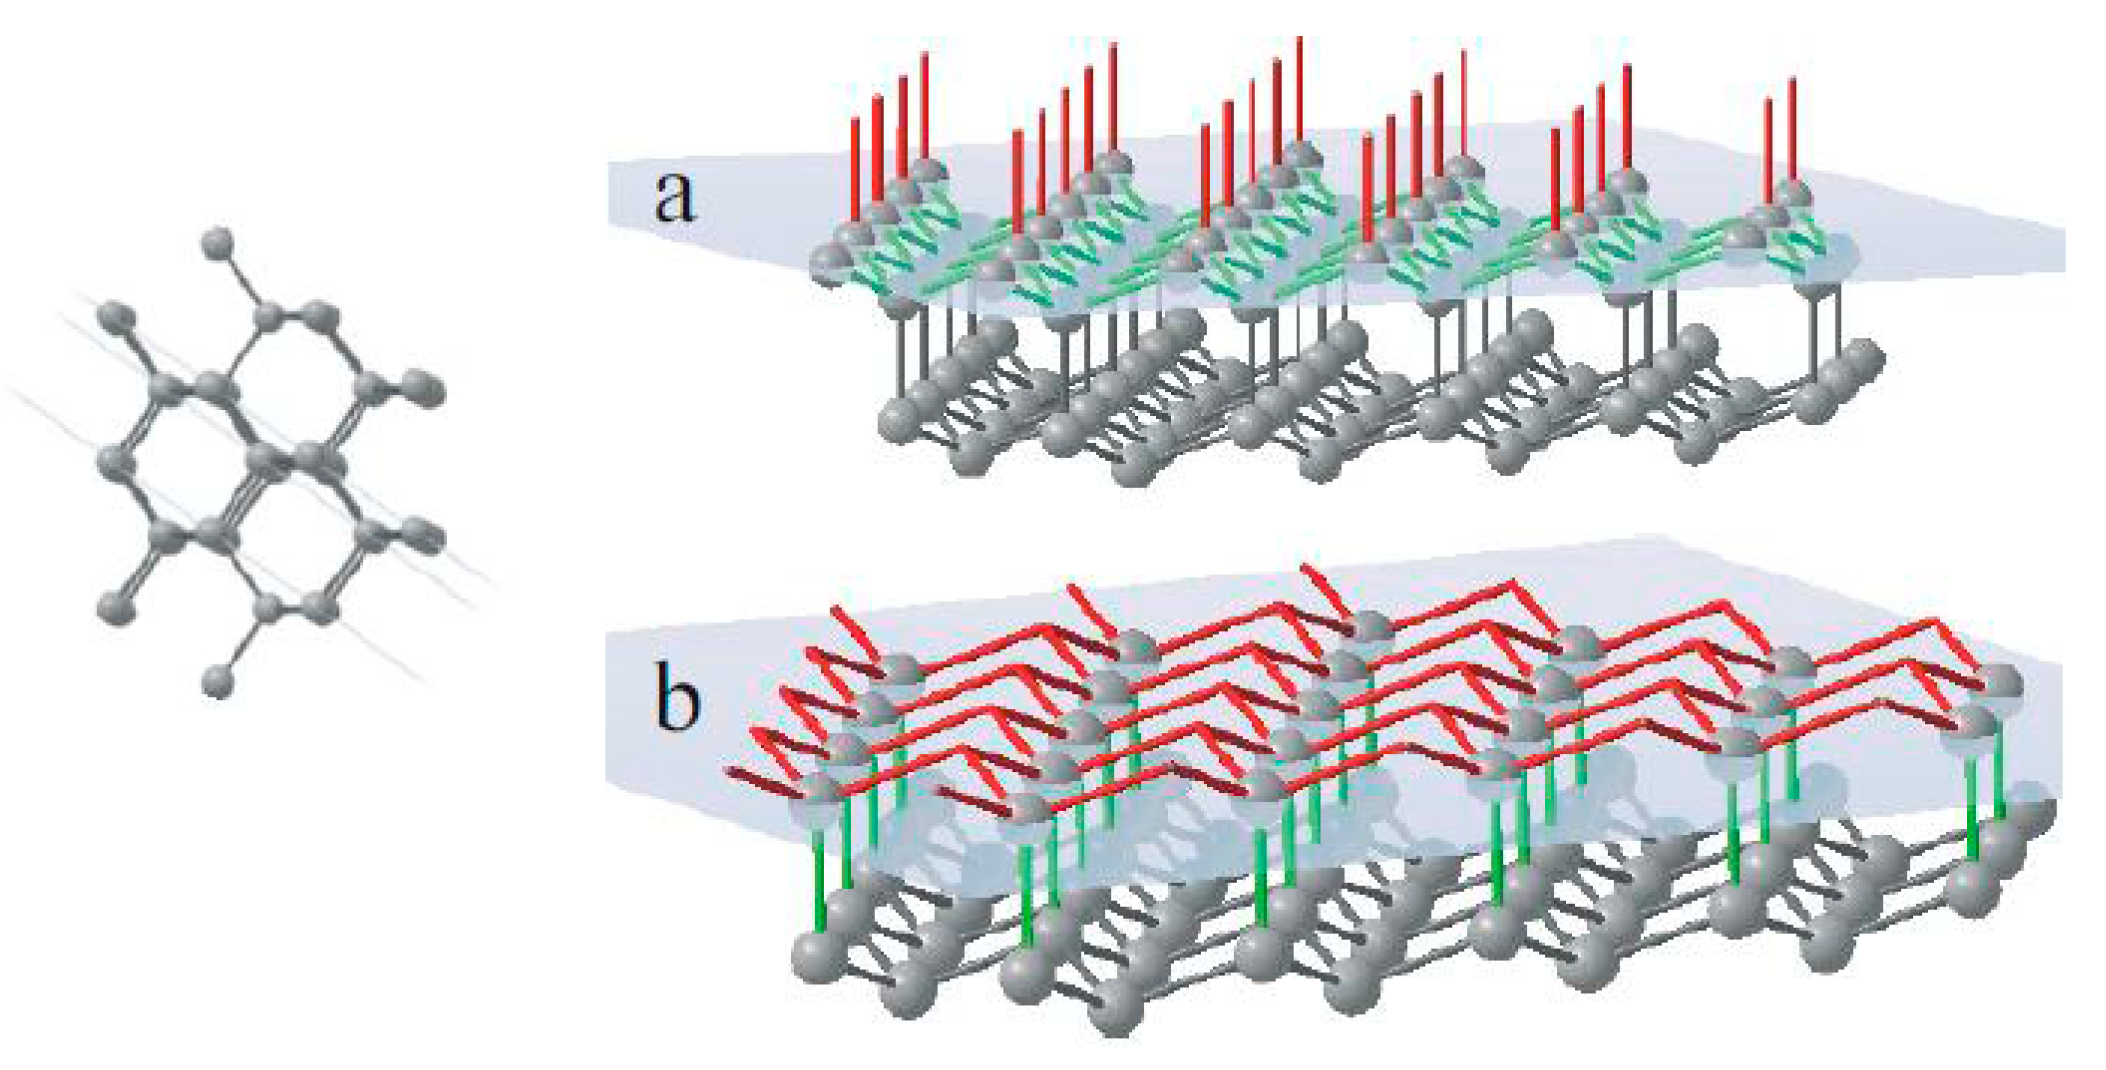
The face of the cube {100} has a single-layer atomic plane (
Figure 3), where the surface consists of regularly distributed equal units. Atoms on a cubic face have no direct bonds with neighbours within the same plane but joined with two atoms of the previous plane and two atoms of the next plane. Thus, every unit cell on the growing face of the cube has two open bonds. Every subsequently produced atomic plane of {100} will be identical to the previous one.
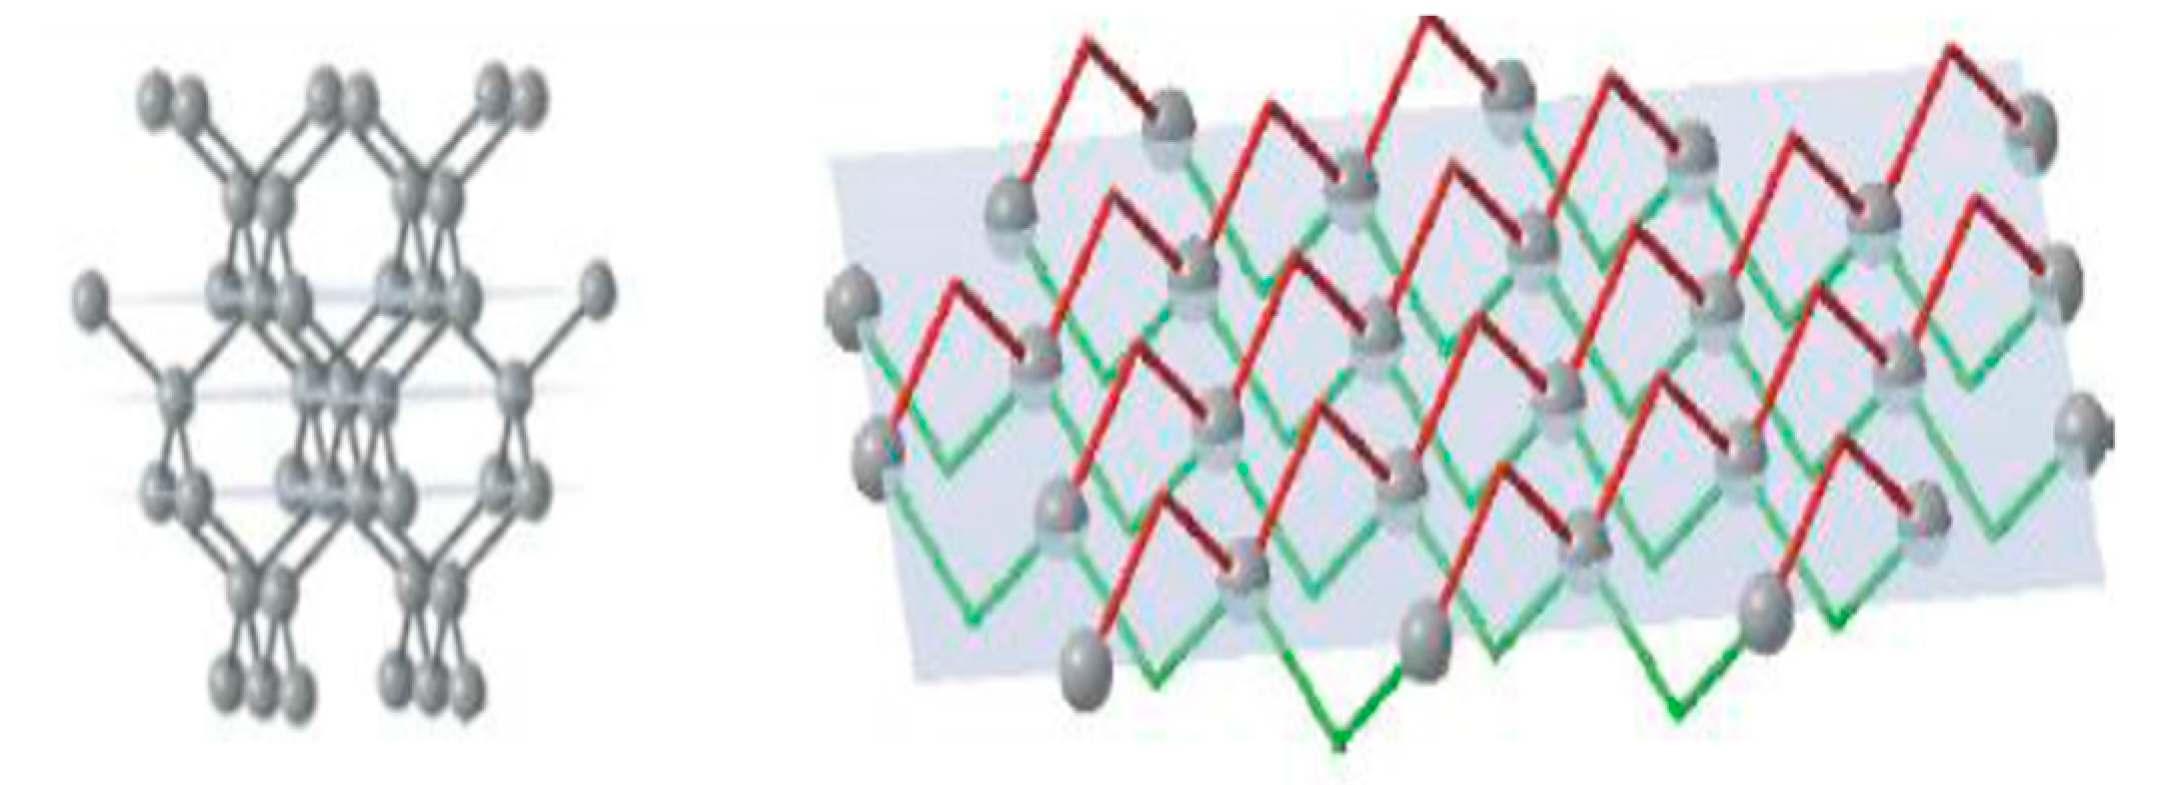
The face of rhombododecahedra {110} has a single-layer atomic plane that consists of zigzag-like chains of atoms (
Figure 4). These chains are not bonded to each other, but every atom in the plane has one link to a previous atomic plane and one link to the next atomic plane. Thus, a growing rhombododecahedra face will consist of single-bond units where every newly formed atomic plane will be the same as the previous one.
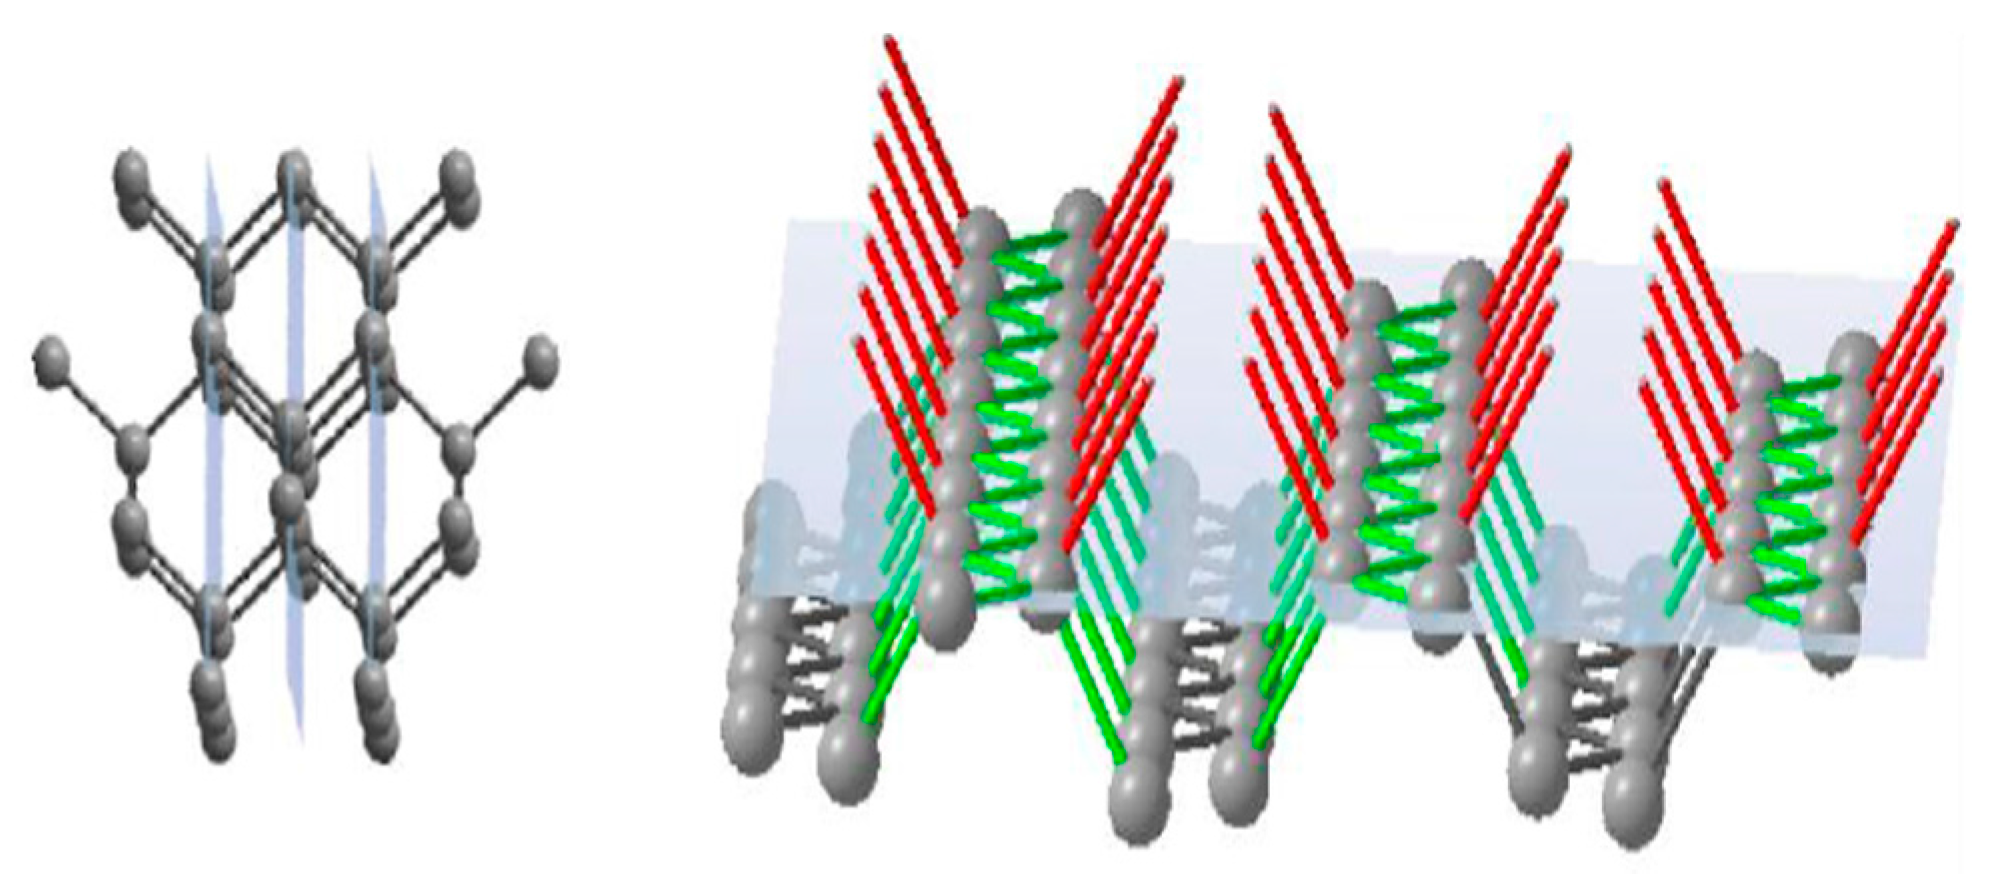
The face of octahedra {111} has a double-layer atomic plane (
Figure 5). Every single atom in this plane makes three joins with neighbour atoms of the same plane and one bond connected to the next atomic layer. It means that the growing surface of octahedra consists of a layer of triple-bond units followed by a layer of single-bond units.
In general, any crystallization from a solution will result from a supersaturation of a solvent by a component with respect to a certain crystal structure. Coordinated groups of atoms of a component can become stable in a solution under certain conditions. Such coordinated groups will have characteristics favouring their incorporation in a particular crystal structure: Composition of the solvent and solvent impurities will also influence the stability of particular coordinated groups of atoms. For example, an increasing abundance of nitrogen impurity in a diamond-producing metal-carbon melt will favour to crystallization of graphite instead of diamond [
17].
A detailed investigation of crystallization of semiconductors with diamond-like structures reveals the importance of atomic clusters in solution [
18]. The stability of specific coordinated groups of atoms is required to produce a perfect crystal. A few types of coordinated groups have been recognized in the case of diamond: one-dimension chains; two-dimension nets and three-dimension skeletons. These groups are rather stable in the solution, but can modify or rearrange until they are ultimately incorporated into the crystal lattice. Obviously, atoms from the solvent and other impurities could also take part in these groups. However, the presence of impurity atoms within such clusters leads to changes in both morphology and electron structure of the group, making it more difficult for such impurity-bearing groups to be incorporated onto crystal surface. Therefore, the availability of a perfect and regular structure on a growth surface will suppress the incorporation of groups of atoms holding impurities.
According to [
18], when a matrix solution contains no associated carbon atoms, octahedral faces of the diamond will grow the fastest. This, in turn, leads to the slower growing cubic faces to dominate in such a low-associated solution. If pre-existing atomic clusters of carbon are common in a solution, then the octahedra form becomes dominant due to its slow growth rate in comparison with other directions. On the other hand, the highly ordered cube faces provide favorable conditions for the fractionation of atoms and groups of atoms [
19]. In contrast, alternation of triple-bond and single-bond units on the growing surface of octahedra could make fractionation of atoms and groups of atoms less likely. In support, it has been shown that octahedra faces have less perfect structures as compared to cube faces in CVD diamonds [
6]. Considering data for HPHT diamonds, growth sectors of cube, trapezohedra and rhombododecahedra are always depleted in impurities, including nitrogen, metals and other elements in comparison with growth sectors of octahedra [
1,
2,
3,
4,
5].
3.2. Ab Initio Calculations of Carbon Isotope Fractionation
The results from our ab initio calculations provide strong support for
12C isotope affinity to cubic growth diamond relative to octahedral crystal faces. The difference of 3.75‰ is expected within the first crystal layer at 1400 K (
Figure 2). Instantaneous depletion of cubic face in heavy carbon isotope at about 1100 °C must be close to 4‰ in comparison to simultaneously growing octahedral faces. Again, it should be emphasized that the direction of fractionation is more important than the actual degree of isotope fractionation. It is well known from calculations [
20,
21,
22] and from experiments [
23] that diamond is enriched in heavy carbon isotope in a metal-carbon system but depleted in carbonate system in comparison with parent solution/fluid. However, the surface-induced relative fractionation is the same for both systems.
Theoretically, carbon isotope self-diffusion in the crystal lattice could erase this pattern since no energy difference between atom positions exists below the 6th atomic layer (
Figure 2). However, self-diffusion of carbon isotopes in diamond is extremely slow [
24], and, once generated, this pattern should remain for a long time even at mantle conditions. Such patterns have been reported in some natural diamonds [
10,
11]. Galimov [
25] shows ~3‰ depletion in
13C of cuboid diamonds in comparison with octahedral crystals from Yakutian kimberlites, which might, at least in part, have resulted from the surface-induced crystallochemical fractionation discussed here. However, the major challenge in documenting considered feature within the natural samples is the relatively high carbon isotope heterogeneity typically found in natural diamond crystals. Furthermore, the very limited dataset reported at the nanogram sampling size with high spatial resolution make it difficult to make firm conclusions about such behavior in natural environments.
3.3. Fractionation of Nitrogen
As shown above, within a single crystal of synthetic diamond sectors of cube are significantly depleted in nitrogen in comparison with growth sectors of octahedra. Detailed SIMS traverses across growth sectors in synthetic diamonds from a metal-carbon system reveal the same distribution of nitrogen between {111} and {100} sectors [
5]. Furthermore, sectors of octahedra show nitrogen abundances, which are close to that of the starting graphite [
5,
17]. Significant nitrogen depletion in cube sectors in comparison to nitrogen content in initial graphite documents the incompatible behavior of nitrogen in the 100 sector of diamond. These observations fit well with the incorporation of coordinated groups of carbon atoms containing nitrogen onto octahedral face with no efficient fractionation of nitrogen impurity, whereas the opposite is true for cube sectors. As mentioned above, the cube faces are dominant in a low-associated solution. Atom by atom incorporation of both carbon and nitrogen into well-ordered regular surfaces of cube provides the strongest discrimination against nitrogen incorporation. This pattern holds true for all synthetic samples investigated until now, including our current data for diamonds from the carbonate system. There are still no direct data reported on the actual nitrogen isotope fractionation between particular faces of diamond and the crystallization medium. The most important result from the above data is that surface-induced nitrogen fractionation is very much the same in metal-carbon and carbonate systems and the compositional difference between sectors of growth of different crystal faces has the same direction in both substrates.
There is a growing body of data documenting coupled variation of nitrogen concentration and carbon isotope fractionation during diamond growth [
26,
27,
28,
29,
30]. It has been suggested that nitrogen behavior is influenced by both diamond growth rate [
31] and
fO
2 [
22]. According to “a limit sector” model [
26], nitrogen must be generally incompatible in diamond at kinetic fractionation, since nitrogen content in diamonds suggested going lower with lowering diamond growth rate. Stachel et al. [
27] argued that, in case of equilibrium fractionation, nitrogen can be moderately compatible (K
N = 2) in diamond under reduced conditions and strongly compatible (K
N = 4), when diamond formed from an oxidized fluid. Mentioned conceptions of nitrogen partitioning at diamond crystallization based on model thermodynamic calculations and on empirical modeling of general distribution of nitrogen concentrations in mantle diamonds vs. their carbon isotopic composition. There is no doubt that this approach can be valid for modeling the distribution of nitrogen between bulk fluid and bulk diamond. Our data cannot provide any evidence of fractionation between bulk fluid and bulk diamond since there is no data about nitrogen concentrations in the fluid is available in our experiments. However, it is clear from our experiments that the nitrogen is strongly incompatible to diamond when atomic-flat faces of cube are growing. Most cuboid sectors reported in natural samples from kimberlites, lamproites and associated placers are, in fact, atomic-rough. Therefore, it is rather difficult to expect an exact fit of compositional difference resulted from the surface-induced fractionation in natural and synthetic crystals.
The first reported natural diamonds with flat cube faces found in Tibetan ophiolites [
32] reveal the same nitrogen distribution pattern between {111} and {100} growth sectors as has been seen in synthetic crystals. Three natural crystals gave N
(111)/N
(100) ratios from 5.3 to 8.8 [
32]. The paragenesis of the studied ophiolite, including native elements, alloys, carbides and nitrides, pointed strongly towards highly reducing conditions.
A number of specific conditions must be met in order for such a fractionation mechanism to be active for both carbon isotopes and nitrogen concentration during diamond growth. First, crystallization should take place from a carbon rich solution. Secondly, growth must occur predominantly on atomic-flat surfaces of different crystallographic faces. Diamond crystallization is generally associated with low degree of melting of a silicate-dominated matrix within the Earth’s mantle. However, this melting must be advanced enough to provide crystallization of euhedral macrocrystals, and it would be reasonable to expect a significant concentration of carbon clusters in coordinated groups in these melts. As mentioned, high association of carbon in a solution leads to the suppression of growth on all crystal faces other than octahedra. Such a situation would explain the overwhelming dominance of octahedra during the crystallization of natural diamonds.
Another important parameter that affects fractionation is growth rate: diamond growth rate has a significant influence on the carbon isotope fractionation between diamond and the carbon solution in metal melt [
16]. Presumably, the ability of surface-induced fractionation to be recorded within a crystal depends on the ratio of isotope diffusion rate over crystal growth rate. Because the growth rate is considered as one of the major parameters determining diamond crystal habit [
33], this parameter could be of interest for further investigations.
Some natural environments should be favorable for diamond crystallization associated with a relatively low degree of association of carbon atoms in coordinated groups. One such example would be a “magma ocean” setting, such as that which dominated during Earth’s early history [
34], where the temperature regime and compositional gradients were able to provide conditions for atom-by-atom crystallization. A second environment favoring a low degree of association would be a metal rich environment of lower mantle, where diamond could precipitate from carbon dissolved in metal melts. As can be seen from experiments, metal-carbon systems are most conducive for a stable growth of cube faces and surfaces other than octahedra. A third such environment would be melts from subducted carbonates containing minor quantities of silicates and relatively high amount of biogenic carbon, such as those generating carbonaceous diapirs [
35] or during interaction of carbonates with reduced mantle material [
36]. Such setting would have the potential to provide conditions that would form diamond crystals with the surface-induced compositional inhomogeneity, such as we observed in our experiments including the carbonate system.
4. Samples and Methods
Two samples of synthetic diamond were prepared in the Na
2CO
3-CO
2-C system. The composition of the system was chosen to provide diamond crystallization near the Carbon-Carbon oxide (CCO) buffer from a single carbon source rather than modelling some specific geological situation. However, sodium carbonates were found in fresh kimberlites [
37,
38] and even as inclusions in diamonds [
38,
39] and in olivine recovered from kimberlites [
40].
Natural diamond crystals with cubic and octahedral to dodecahedral habits and near 0.5 mm in size were used as seed crystals in our experiments. Both morphological types of seeds were placed together at the bottom of a platinum ampoule and the ampoule was filled with 99.99% pure sodium oxalate (Na
2C
2O
4). Finally, the ampoule was hermetically welded using a carbon-free technique. High-pressure experiments used a “split-sphere” type (BARS) multianvil apparatus at 1400 °C and 6 GPa in the V.S. Sobolev Institute of Geology and Mineralogy SB RAS [
41]. Sodium oxalate decomposes at experimental conditions producing sodium carbonate fluid (CO
2-containing Na
2CO
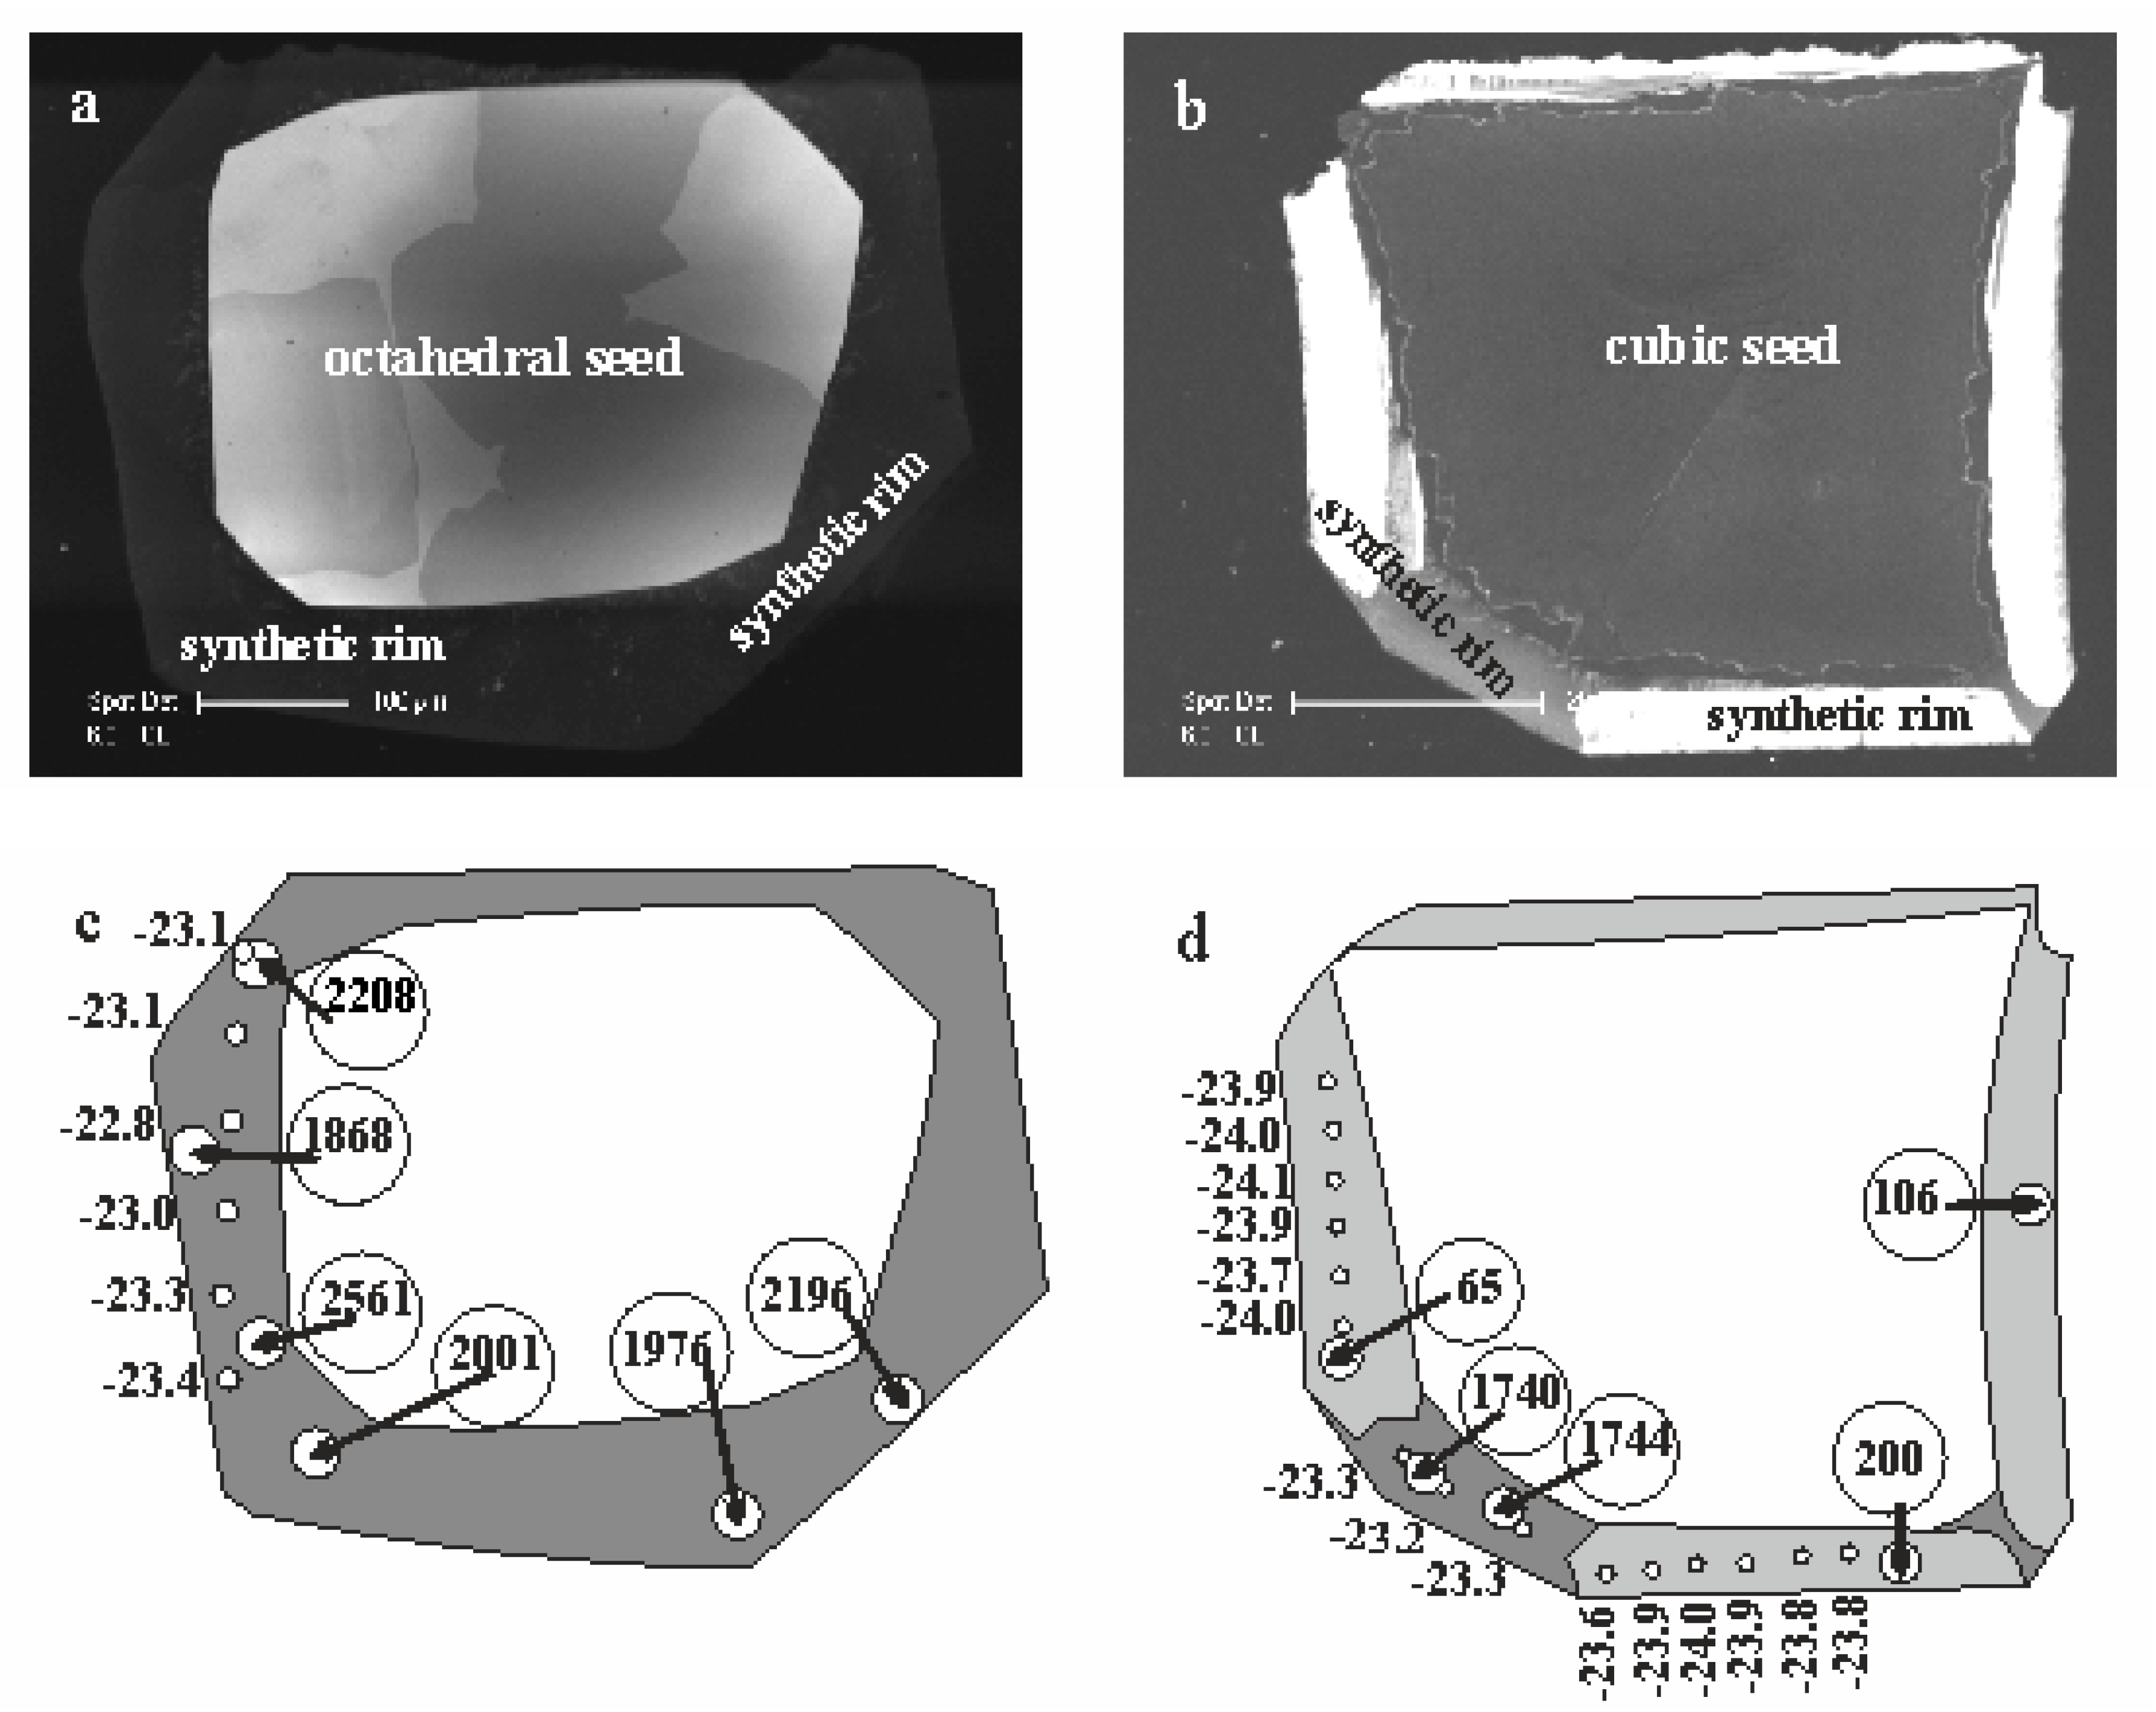
3 melt) with about 4.5 wt % excess of carbon. This excess of carbon in the carbonate fluid prevents diamond seeds from dissolution, a phenomenon often seen in metal-carbon systems and leads to the seeds being overgrown by synthetic diamond material with maximum thickness of 120 μm Diamond crystals recovered from the ampoules were inspected for growth morphology as described in [
42], then cut in a parallel [110] direction, polished and examined using a Philips XL30CP scanning electron microscope (Philips, Germany) with attached CL detector at the Edinburgh University, thereby revealing internal structure within the samples.
Secondary Ion Mass-Spectrometry data of carbon and nitrogen isotopes and nitrogen abundance were collected using the CAMECA 1270 ion microprobe (AMETEK Inc., France) at the NERC/Edinburgh University Ion Microprobe Facility (EIMF), in 2005–2006 and the CAMECA 1280 HR at the GFZ Potsdam SIMS laboratory in 2015–2016.
The analytical conditions for the EIMF measurements where reported earlier [
5]. In all cases, the unknowns and reference material were placed adjacent to one another in the same indium mount. The surface of the 1-inch sample mounts were then cleaned using high-purity ethanol prior to being argon sputter coated with high-purity gold. Magnet calibration and centring of the field aperture and slits was done prior to each point analysis.
At the GFZ Potsdam SIMS facility, carbon and nitrogen data were collected in June 2015 and March 2016, respectively. As for earlier EIMF work, for the GFZ measurements we employed 133Cs+ primary beam with a total impact energy of 20 keV. Our analyses used a 250 pA probe current for nitrogen and 2.5 nA current for carbon. The beam was focused to a ~4–8 μm diameter with a Gaussian distribution at the sample surface. Secondary ions were extracted using a −10 kV potential applied to the sample holder. Charge compensation involved circa 250 pA low energy electron cloud provide by a normal incidence electron flood gun. The instrument was operated with a circa 80 μm field-of-view, with a 50 eV wide energy window. In the case of the carbon isotope measurements, we used a static multi-collection mode operating at a mass resolution of M/dM ≈ 3200, which fully resolves the 13C mass station from the nearby 12C1H molecular isobar. For determining nitrogen contents and nitrogen isotope ratios, our mass spectrometer was operated in mono-collection mode at a mass resolution of M/dM ≈ 6900 using the peak-stepping sequence 12C2, 12C14N and 12C15N signals.
Each carbon isotope analysis was preceded by a 60 s presputter using a 25 μm raster, so as to remove the 35 nm tick gold coat and also to implant Cs+ in order to establish equilibrium sputtering conditions. An analysis used a 15 μm raster, together with the tool’s dynamic transfer capability, thereby generating a square, flat-bottom sputter crater. Prior to initiating data collection, we conducted automatic beam centering routines in both x and y for the field aperture. A single carbon analysis involved 20 cycles of 4 s integration each and the data were filtered at the 3 sd level. Thus, a single analysis required around 3 min of analysis time, including the presputtering. All data were collected in fully automated data acquisition mode.
Prior to initiating nitrogen data collection on a selected target, the region was sputter cleaned for 80 s using a 3 nA Cs+ primary beam rastered over a 20 × 20 μm area. Prior to initiating data collection, the primary beam current was reduced to the 250 pA probe current and the rastered area was reduced to 10 × 10 μm, which was compensated for using the dynamic transfer function of tool. Automatic centering routines were then conducted for x and y for the field aperture. Our data acquisition involved the peak-stepping sequence: 12C2 (2 s integration time per cycle), 12C14N (4 s) and 12C15N (15 s). A single nitrogen analysis consisted of 50 cycles of this peak-stepping sequence, leading to a total analysis time of ~20 min per acquisition.
For the EIMF measurements, the “synAT” standard (a synthetic “A” diamond crystal, partial slice “T”) was used [
43]. The characteristics of this reference material are: 230.4 ppm N (wt) and δ
13C
PDB of −23.92‰ as determined by combustion analysis using a gas source mass spectrometer (analysed by S.R. Boyd, at the Laboratoire de Geochimie des Isotopes Stables, Université de Paris VII). The GFZ machine calibration used two diamond reference materials contained in the same indium-based sample mount. The samples were cut out from “steady state” parts of up-octahedral sectors in synthetic crystals 140/4 and 150/3 [
5]. The synthetic crystals had been characterized for their δ
13C
VPDB values and nitrogen contents refer to “SynAT” reference material during the EIMF sessions in 2005 and 2006. Minor pieces of the specific chips used in this study were additionally checked for their δ
13C, δ
15N and nitrogen content using static vacuum gas source mass-spectrometry by Dr. A. Verchovsky at Open University (Milton Keynes, UK). The established characteristics are as follows: Crystal 140/4 with δ
13C
VPDB = −26.5‰, 460 μg/g nitrogen and δ
15N
AIR = 0‰; Crystal 150/3 with δ
13C
VPDB = −24.5‰, 215 μg/g nitrogen and δ
15N
AIR = −5‰.
Our carbon isotope raw data were tested for the presence of a time dependent linear drift, which was corrected for when needed. Such drifts, which we attribute to changes in sensitivity of the amplifiers in our detector system, were 0.01‰ per hour or less. After correcting for such drift, the repeatability of our 13C/12C determinations on the two reference materials was less than 0.24‰ (1 sd), which is our best estimate for the random component that might be present in our carbon isotope data. Hence, we can conclude that the overall reliability of our δ13C values is better than ±0.24‰ (1 sd) for GFZ measurements. The uncertainty of individual N abundance data points reported for the studied samples are better than ±10%. These uncertainties represent one standard error of the mean based upon multiple analyses of restricted areas within the reference crystals.
Ab initio calculations of C isotope fractionation factors were performed following the procedure of Kowalski et al. [
44,
45] for calculation of isotope fractionation factors at high temperatures. This method utilizes the Bigeleisen and Mayer [
46] approximation, in which only the force constants acting on the fractionating atom of interest are computed and used in derivation of relevant fractionation factors. This approach has been successfully applied in calculation of Li and B isotope fractionation between complex minerals and fluids [
44,
45]. For the quantum mechanical calculations of the force constants, we used plane-wave DFT code CPMD [
47] with BLYP generalized gradient approximation [
48,
49] and energy cutoff of 140 Ryd. The norm conserving Goedecker pseudopotentials were applied to describe the core electrons [
50]. Beta factors, describing isotope fractionation between species and an ideal monoatomic gas, were computed for three diamond surfaces (100), (110) and (111) with the bulk lattice parameter of face-centered cubic Bravais lattice of 3.56669 Å [
51]. The surfaces were modelled with thick 2 × 2 multi-layer slabs separated by a thick layer of vacuum in the
z-direction (at least 12.9 Å thick) and the atoms of the bottom layer were fixed to the bulk positions. The modelled slabs contained 17, 13 and 10 layers for (100), (110) and (111) surfaces, respectively.


