Review

Dirac Landau Level Spectroscopy in Pb1−xSnxSe and Pb1−xSnxTe across the Topological Phase Transition: A Review

by
Thanyanan Phuphachong
1,
Badih A. Assaf
2,*,
Valentine V. Volobuev
3,4,
Günther Bauer
3,
Gunther Springholz
3,
Louis-Anne De Vaulchier
1 and
Yves Guldner
1
1
Laboratoire Pierre Aigrain, Ecole Normale Supérieure, Centre National de la Rechercher Scientifique, Paris Sciences et Lettres Research University, Université Pierre et Marie Curie, Université Denis Diderot, 24 rue Lhomond, 75005 Paris, France
2
Département de Physique, Ecole Normale Supérieure Centre National de la Rechercher Scientifique, Paris Sciences et Lettres Research University, 24 rue Lhomond, 75005 Paris, France
3
Institut für Halbleiter und Festkörperphysik, Johannes Kepler Universität, Altenberger strasse 69, 4040 Linz, Austria
4
National Technical University “Kharkiv Polytechnic Institute”, Frunze Str. 21, 61002 Kharkiv, Ukraine
*
Author to whom correspondence should be addressed.
Crystals 2017, 7(1), 29; https://doi.org/10.3390/cryst7010029
Submission received: 15 December 2016 / Revised: 7 January 2017 / Accepted: 7 January 2017 / Published: 20 January 2017
(This article belongs to the Special Issue Topological Crystalline Insulators: Current Progress and Prospects)

Abstract

:
Topological crystalline insulators (TCIs) are topological materials that have Dirac surface states occurring at crystalline symmetric points in the Brillouin zone. This topological state has been experimentally shown to occur in the lead–tin salts Pb1−xSnxSe and Pb1−xSnxTe. More recent works also took interest in studying the topological phase transition from trivial to non-trivial topology that occurs in such materials as a function of increasing Sn content. A peculiar property of these materials is the fact that their bulk bands disperse following a massive Dirac dispersion that is linear at low energies above the energy gap. This makes Pb1−xSnxSe and Pb1−xSnxTe ideal platforms to simultaneously study 3D and 2D Dirac physics. In this review, we will go over infrared magneto-optical studies of the Landau level dispersion of Pb1−xSnxSe and Pb1−xSnxTe for both the bulk and surface bands and summarize work that has been done on this matter. We will review recent work on probing the topological phase transition in TCI. We will finally present our views on prospects and open questions that have yet to be addressed in magneto-optical spectroscopy studies on Pb1-xSnxSe and Pb1−xSnxTe.

1. Introduction

Inspired by the discovery of topological insulators (TIs), topological crystalline insulators (TCIs) are a novel family of topological materials extended from the topological classification of band structures by including certain point group symmetry. The notion of TCIs was first introduced by Fu in 2011. Such materials possess semiconducting bulk states accompanied by metallic gapless surface states as in the case of the well-known existing Z2 TIs [1]. Contrary to TIs protected by time-reversal symmetry (TRS) [2,3,4], a TCI material is protected by mirror symmetry or reflection symmetry present in the crystal [1,2,3,4,5]. Note that crystal symmetries can be broken by material surfaces. As a consequence, topological surface states of a TCI can exist only on some surfaces of the crystal, which is not the case in TI materials. The key role of mirror symmetry present in TCIs makes the study of different surface orientations very attractive.
Due to the complexity and richness of crystallography, the complete classification of TCI materials has not been achieved yet. The discovery of these topological states of matter is extremely intriguing and challenging in the research area of condensed matter physics. In 2012, Hsieh et al. [6] theoretically predicted the first class of TCI materials in narrow gap rocksalt IV–VI semiconductors and proposed SnTe as a representative by identifying its non-zero topological index or mirror Chern number [
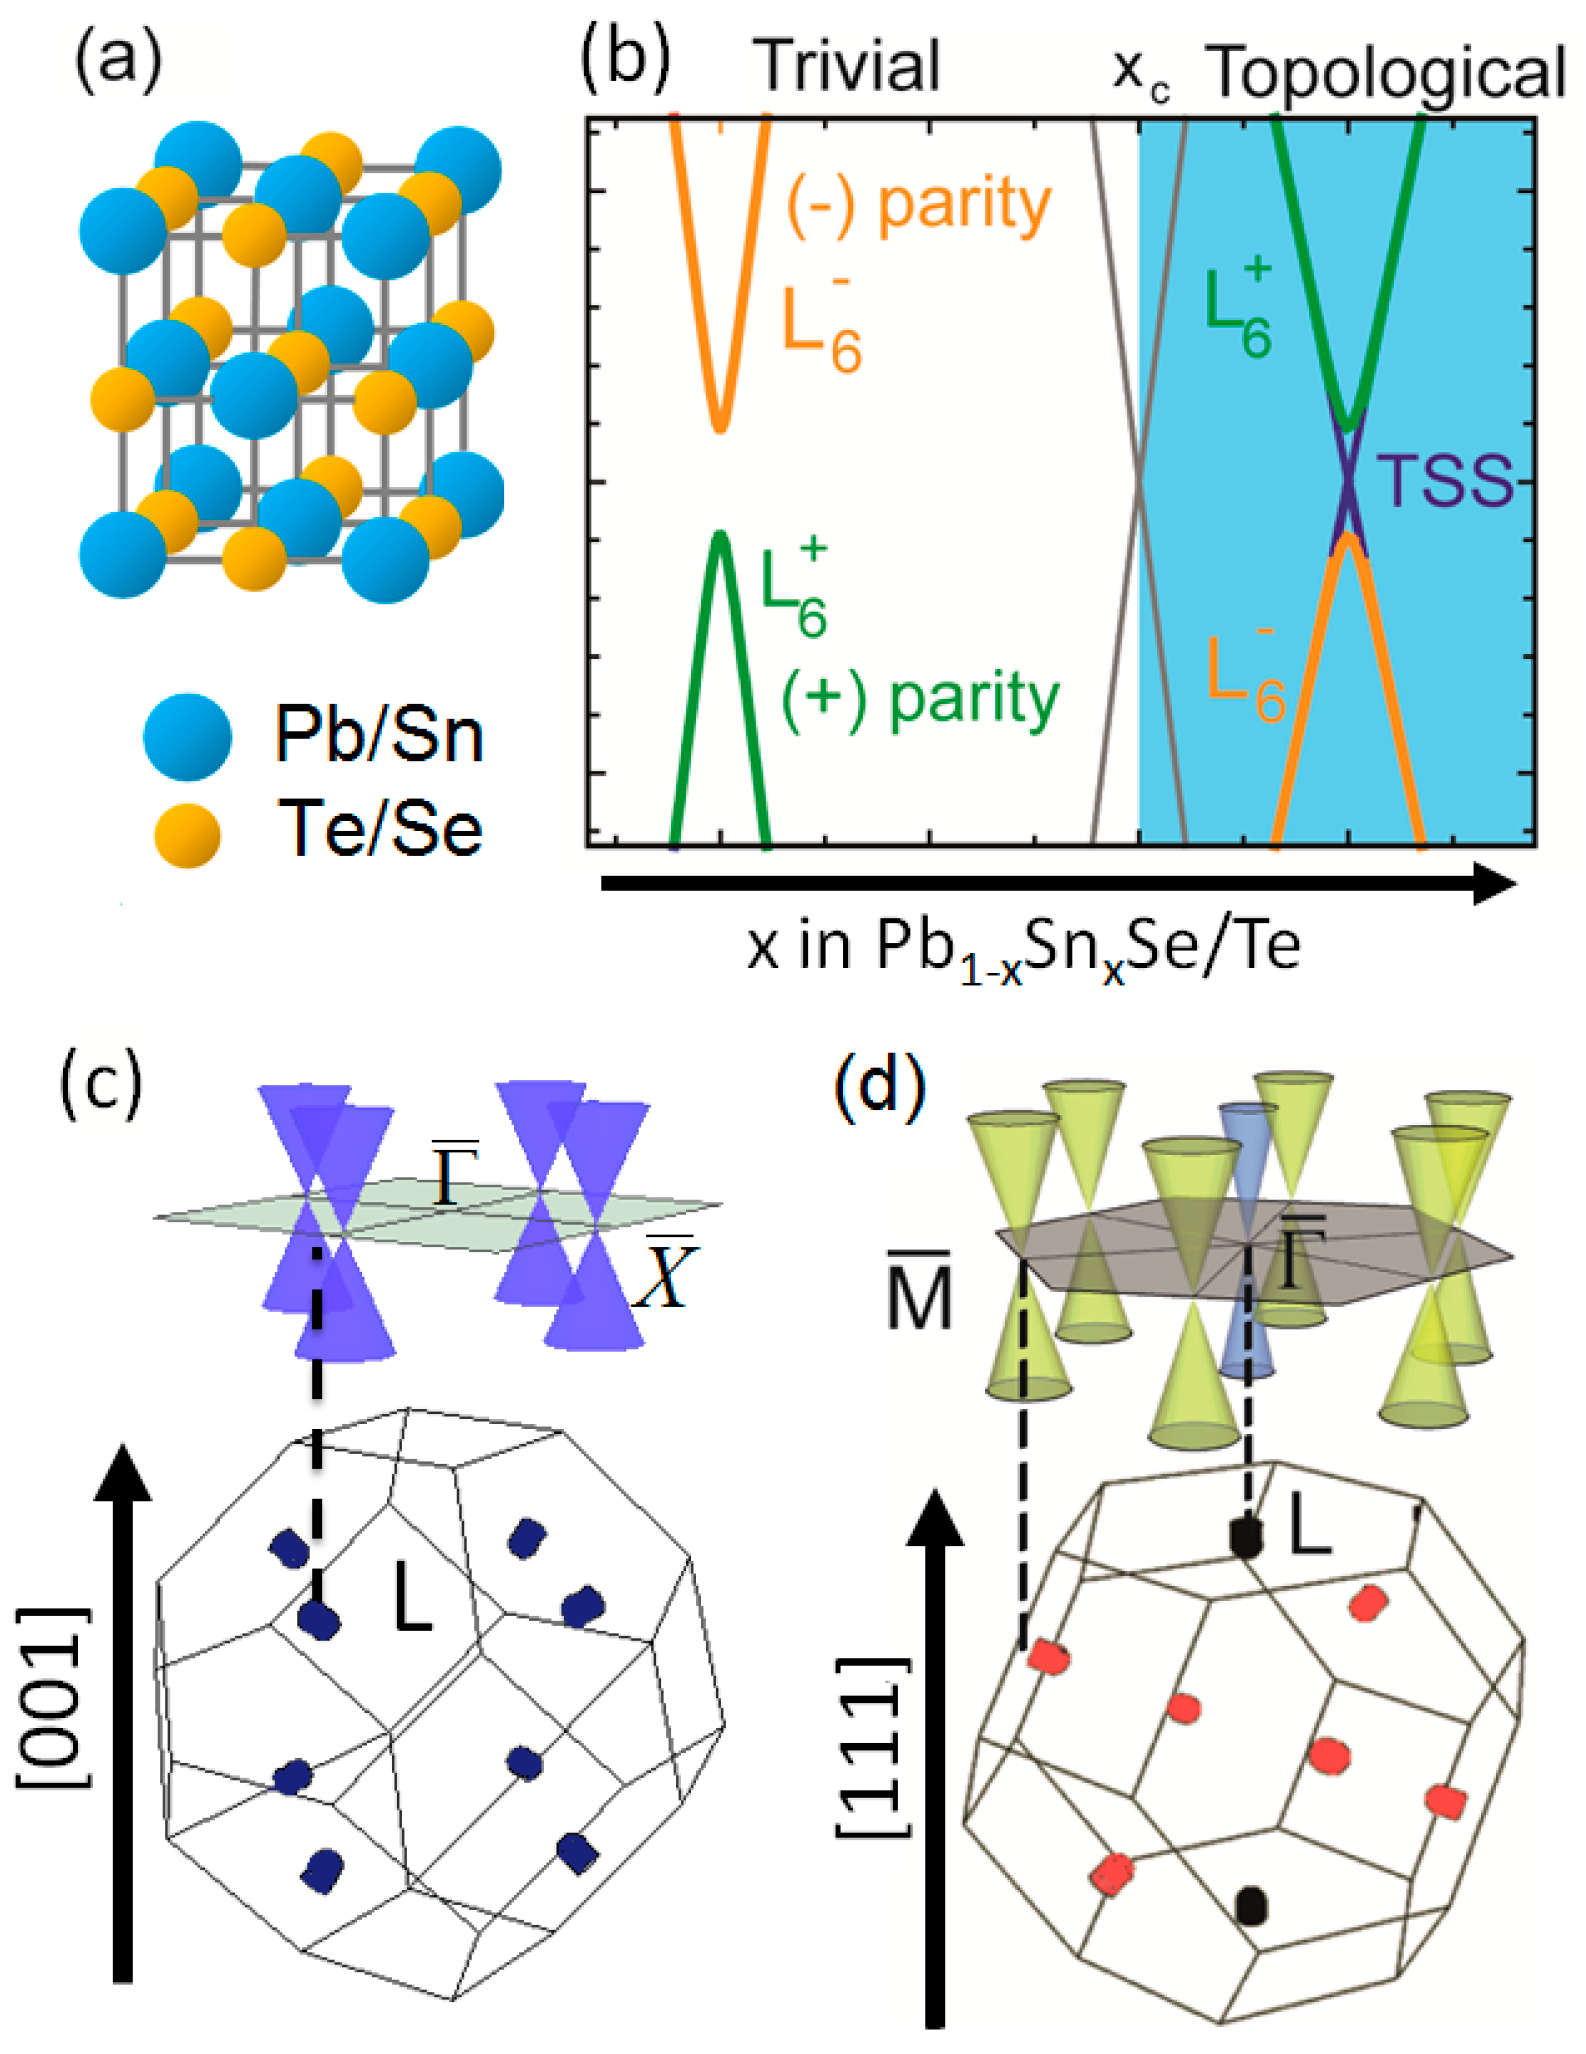
7]. In rocksalt IV–VI semiconductors Pb1−xSnxSe and Pb1−xSnxTe (Figure 1a), a band inversion (Figure 1b) occurs as a function of increasing Sn content at four equivalent L-points in the Brillouin zone. In the trivial phase, L 6 is the lowest conduction band and L 6 + is the highest valence band that form an energy gap Eg of the system. The far-bands are distant and not shown in Figure 1b. As shown in Figure 1b, in the trivial phase, the energy gap (Eg > 0) initially decreases with increasing Sn composition, then closes at x = xc, and finally re-opens as x > xc (Eg < 0) in the topological non-trivial phase (inverted regime) [8,9,10]. The band inversion results in the emergence of the topological surface states (TSS) in the non-trivial regime. This leads to an even Z2 topological invariant and implies a trivial character when TRS is considered. However, it was shown that as long as TRS is preserved, the crystalline mirror symmetry with respect to the {110} crystallographic planes of the rocksalt crystal leads to topologically protected band crossings at an even number (2 or 4) of points on the surface Brillouin zone [6]. These points correspond to where the bulk L-points project on each respective surface. Therefore, the (001) surface of Pb1−xSnxSe and Pb1−xSnxTe ends up having four Dirac cones along the Γ ¯ - X ¯ linecuts of the surface Brillouin zone (Figure 1c) [6]. The (111) surface has one Dirac cone at the Γ ¯ -point and three at the M ¯ -points (Figure 1d) [11,12]. This class of topological materials is referred to as topological crystalline insulators. It was first evidenced using angle-resolved photoemission spectroscopy (ARPES) in Pb1−xSnxSe [13], then subsequently in Pb1−xSnxTe [14] and SnTe [15].
Interestingly, since the inversion of the band structure in Pb1−xSnxSe and Pb1−xSnxTe can be controlled via the chemical composition, both systems offer an ideal platform to study the physics of the topological phase transition that leads to the TCI states. More specifically, the dynamics of the bulk band structure has generated great interest in being examined in light of the current understanding of 3D and 2D condensed matter physics and its subtle interplay with band topology. A powerful tool used to perform such band structure investigation is, and has always been, magneto-optical Landau level spectroscopy. It is a bulk sensitive tool that allows one to get accurate information about the bulk, without undermining the detection of topological surface state related features. This technique finally provides quantitative band structure information that can be useful to future studies on magnetotransport, quantum electronic devices, and infrared detectors.
In this review, we will first show in Section 2 that the multiband k.p perturbation theory used to study the lead salt compounds is equivalent to the Bernevig–Hughes–Zhang model Hamiltonian for TIs. These two models will then be shown to be the 3D Dirac Hamiltonian that we can use to identify the topological nature of Dirac fermions in Pb1−xSnxSe and Pb1−xSnxTe. We will also revisit the problem of Landau quantization of the bulk carriers in Pb1−xSnxSe and Pb1−xSnxTe, highlighting the Dirac character of energy bands in the vicinity of the topological phase transition. We will present a detailed discussion on how a Dirac fermion spectrum is obtained, based on previous findings that use a six-band perturbative k.p approach developed by Mitchell and Wallis in 1966 for lead salts [16]. In Section 3, we will summarize recent results on Landau level IR magneto-optical spectroscopy measurements of the bulk band structure of Pb1−xSnxSe [17] and Pb1−xSnxTe [18]. We will then discuss the recent observation of the ground state cyclotron resonance of topological surface states at high magnetic fields in Section 4 [18]. In Section 5, we will review recent progress on studies of the behavior of the bulk bands through the topological phase transition [17]. In Section 6, we will summarize future perspectives on bulk and surface Landau level studies in IV–VI materials and present challenges that need to be addressed in the future. Section 7 presents final conclusions.

2. Hamiltonian for IV–VI Semiconductors

2.1. Fermi Surface Anisotropy in Pb1−xSnxSe and Pb1−xSnxTe

The bulk Fermi surface in IV–VI semiconductors consists of four ellipsoids [8,19] located at the L-points of the Brillouin zone. Different 3D Brillouin zone configurations lead to different orientations of the bulk carrier ellipsoids (Figure 1c,d). In the Faraday geometry, the magnetic field is always applied perpendicular to the sample surface and will cause Landau quantization on planes parallel to this surface.
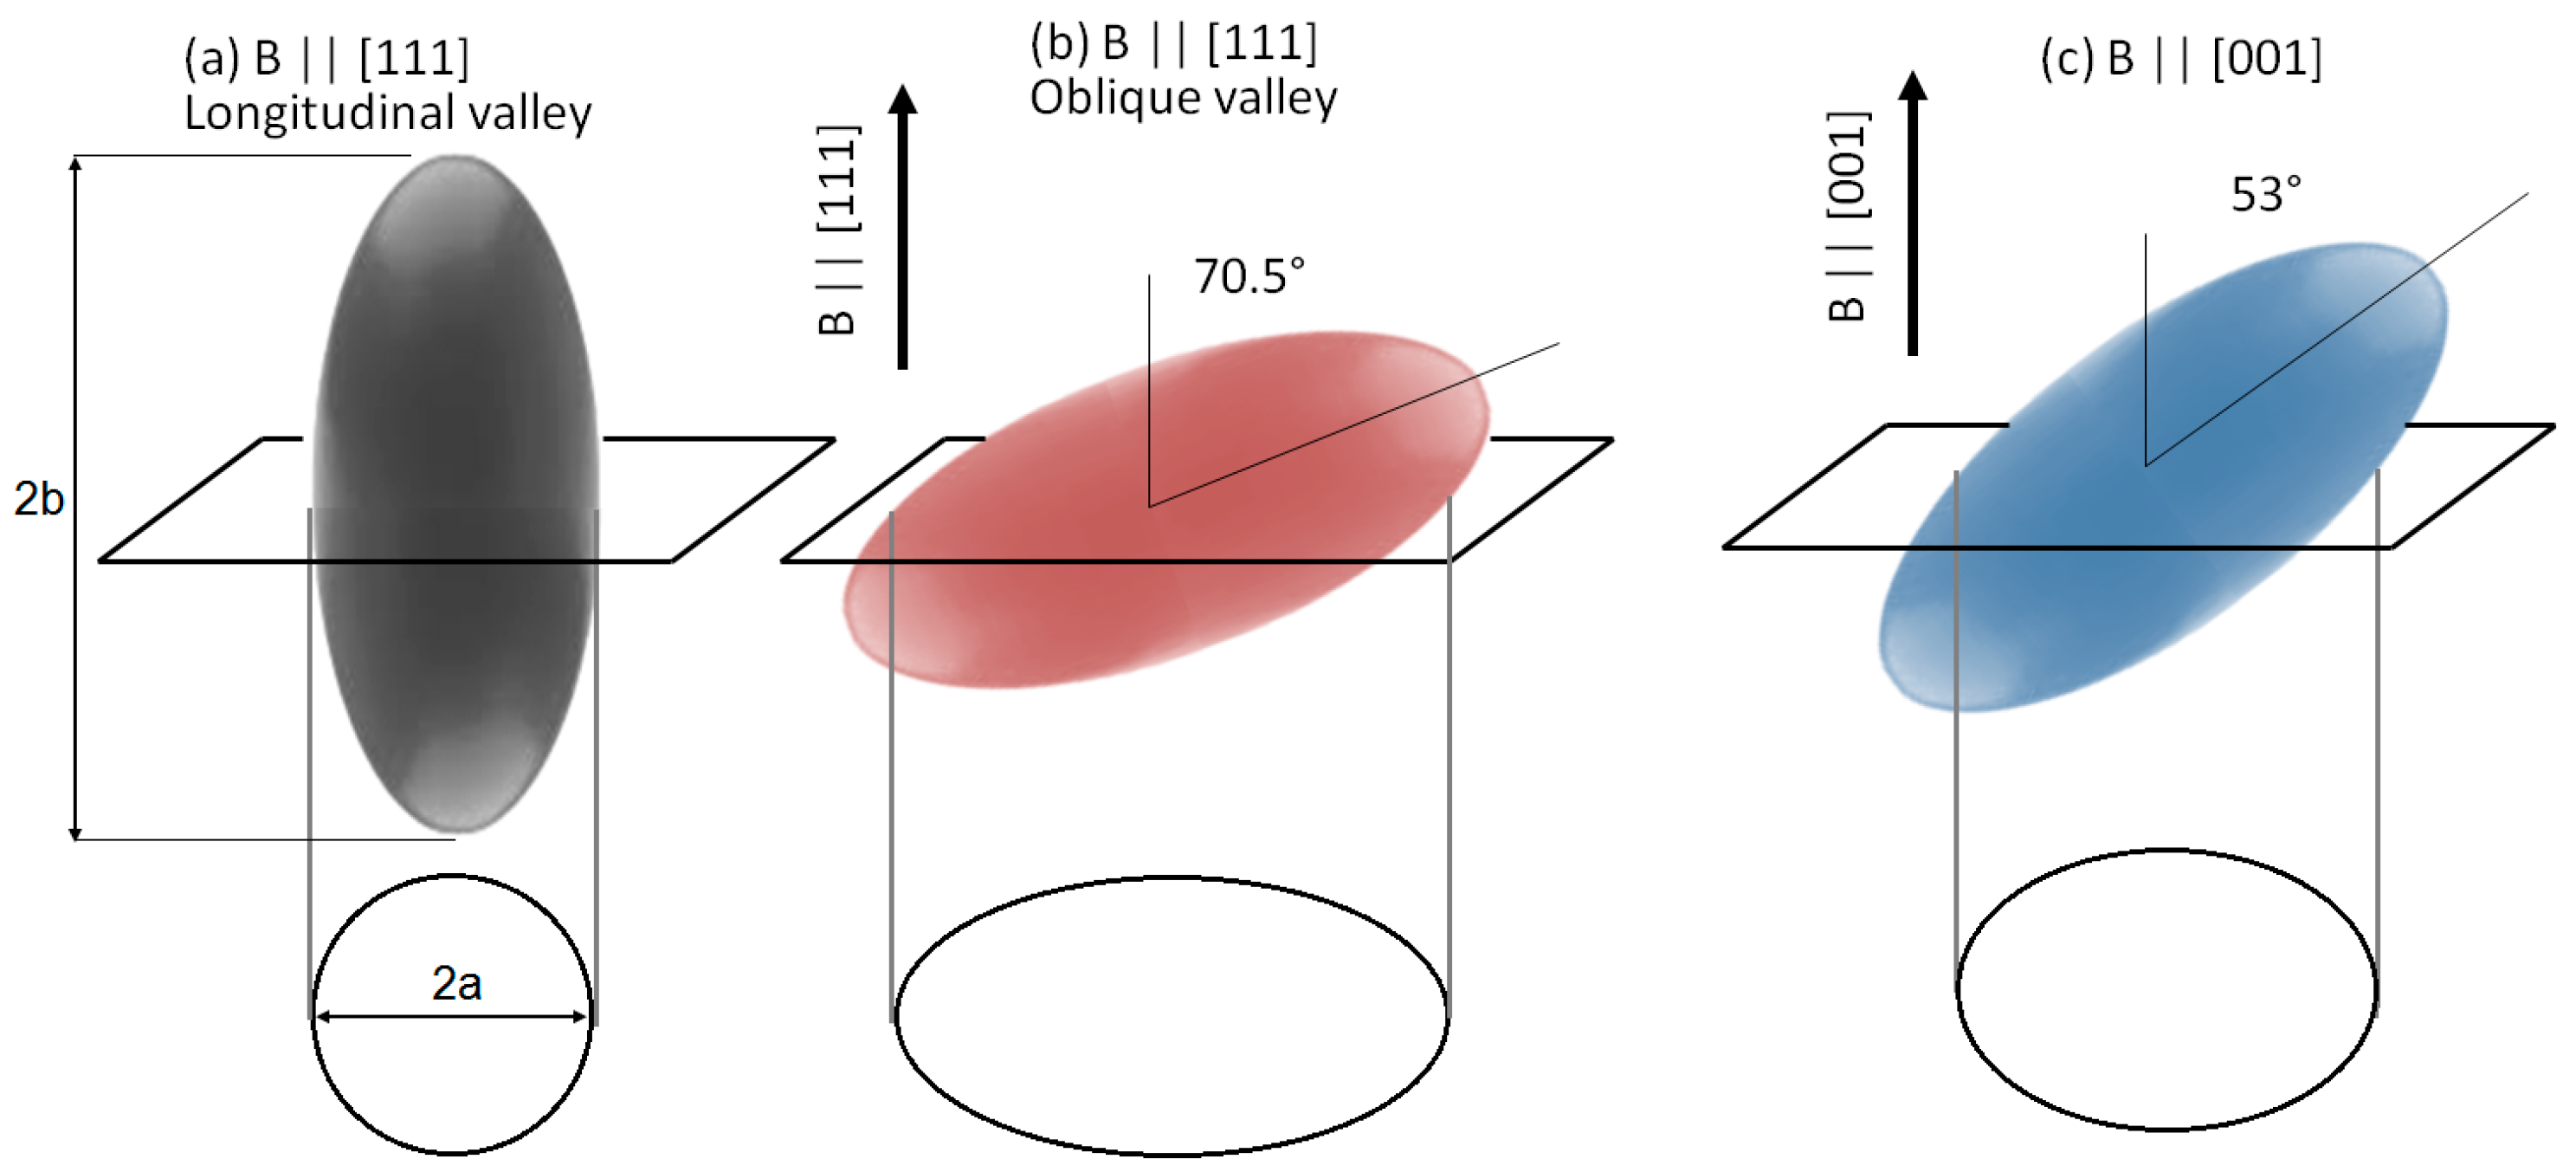
For a (111)-oriented sample (Figure 1d), the bulk carrier ellipsoidal pocket located at the longitudinal L-point and having its major axis “2b” parallel to the [111] direction is referred to as the longitudinal valley (Figure 2a). A magnetic field will quantize orbits in the plane perpendicular to the [111] direction, leading to a 2D quantized Fermi surface that is circular and has a diameter equal to the minor axis “2a” of the ellipsoid (Figure 2a). The three remaining carrier valleys located at the other three L-points have their great axes tilted by θ = 70.5° with respect to the [111] direction and are referred to as the oblique valleys (Figure 2b). The quantized orbits for oblique valleys are ellipses (Figure 2b). For a (001)-oriented sample (Figure 1c), all L-valleys are equivalent. They are ellipsoidal and have their great axes tilted by θ = 53° with respect to the [001] direction (Figure 2c). Their quantized orbits when B is parallel to the [001] direction are also elliptical (Figure 2c).
Finally, it is useful to define the anisotropy factor of the Fermi surface K as the area anisotropy factor K = (b/a)2,or, equivalently, the k.p matrix element anisotropy factor K = (P/Pǁ)2 [8], where P and Pǁ are, respectively, transverse and longitudinal momentum matrix elements.

2.2. Band Structure of the Longitudinal Valley in IV–VI Semiconductors

In this section, we will study the models in physics allowing us to understand the topological character of massive bulk Dirac fermions in Pb1−xSnxSe and Pb1−xSnxTe TCIs. In 2006, Bernevig, Hughes and Zhang (BHZ) proposed an explicit model Hamiltonian to describe the quantum spin Hall effect (QSHE) that was theoretically predicted to be realized in HgTe/CdTe quantum wells, known as the first 2D TI [20]. For 3D TIs in the Bi2Te3 family with a single Dirac cone on the surface, such materials can be similarly described by the model Hamiltonian developed by Zhang et al. in 2009 [21,22]. Here, we show that the k.p perturbation theory used to study TCI materials [8,23,24,25] is equivalent to the BHZ Hamiltonian for TIs. This model is a 3D Dirac Hamiltonian and reliably describes relativistic-like Dirac fermions in Pb1-xSnxSe and Pb1−xSnxTe.
Following [8], the two-band k.p model including the lowest conduction and the highest valence levels ( L 6 ± ), for z//[111], reads:
H ( k ) = ( E g 2 0 ћ m 0 P k z ћ m 0 P k 0 E g 2 ћ m 0 P k + ћ m 0 P k z ћ m 0 P k z ћ m 0 P k E g 2 0 ћ m 0 P k + ћ m 0 P k z 0 E g 2 ) ,
where Eg is the band gap, P and Pǁ are, respectively, transverse and longitudinal momentum matrix elements, k± = kx ± iky, and m0 is the electron rest mass.
In the Dirac formalism, new three parameters are defined as follows: Δ = Eg/2, v c = P/m0 and v c = Pǁ/m0. Here, v c is the velocity perpendicular to the z-axis and v c is the velocity parallel to the z-axis. We thus get a massive Dirac Hamiltonian with uniaxial anisotropy along the z-direction written as:
H ( k ) = ( Δ 0 ћ v c ' k z ћ v c k 0 Δ ћ v c k + ћ v c ' k z ћ v c ' k z ћ v c k Δ 0 ћ v c k + ћ v c ' k z 0 Δ ) .
The eigenvalues of the above Hamiltonian yield the following Dirac dispersion:
E c , v ( k ) = ± Δ 2 + ћ 2 v c 2 k 2 + ћ 2 v c ' 2 k z 2 ,
where k2 = kx2 + ky2 and the ± signs refer, respectively, to the energy of the conduction E c ( k ) and valence E v ( k ) bands. In this two-band model, the Dirac transverse mass is given by m = Δ/vc2.
If the effect of the four far-bands (two conduction and two valence bands) are treated in k2-approximation [8,16,23,24], the diagonal terms of Equation (2) are changed and replaced by:
H 11 = H 22 = Δ + ћ 2 2 m ˜ k 2 + ћ 2 2 μ ˜ k z 2 ,
H 33 = H 44 = Δ ћ 2 2 m ˜ k 2 ћ 2 2 μ ˜ k z 2 ,
where m ˜ > 0 and μ ˜ > 0 are the far-band contributions to the transverse and longitudinal Dirac masses in the conduction and valence bands.
Therefore, the diagonal terms can be written as the k -dependent mass term M ( k ) = Δ + ћ 2 2 m ˜ k 2 + ћ 2 2 μ ˜ k z 2 and the Hamiltonian reads:
H ( k ) = ( M ( k ) 0 ћ v c ' k z ћ v c k 0 M ( k ) ћ v c k + ћ v c ' k z ћ v c ' k z ћ v c k M ( k ) 0 ћ v c k + ћ v c ' k z 0 M ( k ) ) .
H( k ) is equivalent to the BHZ Hamiltonian for 3D TIs as expressed in [21,22]:
H ( k ) = ( M ( k ) A 1 k z 0 A 2 k A 1 k z M ( k ) A 2 k 0 0 A 2 k + M ( k ) A 1 k z A 2 k + 0 A 1 k z M ( k ) ) ,
where M ( k ) = Δ B 1 k 2 B 2 k z 2 . We can thus identify that A1 = ћvc, A2 = ћvc, B1 = ћ 2 2 m ˜ and B2 = ћ 2 2 μ ˜ . This Hamiltonian is nothing but the 3D Dirac Hamiltonian with uniaxial anisotropy along the z-direction and k -dependent mass terms.
Neglecting the k4 terms, the dispersion relation of the conduction and valence bands is given by:
E c , v ( k ) = ± Δ 2 + ћ 2 ( v c 2 + Δ m ˜ ) k 2 + ћ 2 ( v c ' 2 + Δ μ ˜ ) k z 2 .
The topological nature of massive bulk Dirac fermions can be identified by the sign of Δ:
  • If Δ > 0, the material is trivial;
  • If Δ < 0, the material is topological.

2.3. Landau Levels of the Longitudinal Valley

We now will treat the problem of Landau quantization for the longitudinal valley of (111)-oriented IV–VI semiconductors using the Mitchell–Wallis (MW) description [8,16,26]. The Landau levels are given by a six-band k.p approach, where the L 6 ± bands are exactly accounted for and the effect of four far-bands (two conduction and two valence bands) is included perturbatively in k2-approximation. At kz = 0, the Landau level energies of the conduction (c) and valence (v) bands are expressed as:
E n c , ± = 1 2 { ( n + 1 2 ) ( ћ ω ˜ c + ћ ω ˜ v ) ± [ ( g ˜ c g ˜ v ) μ B B 2 + ћ ω ˜ v ] } + ( Δ ) 1 / 2 { [ Δ + ( n + 1 2 ) ( ћ ω c ћ ω v ) ] ± [ ( g c + g v ) μ B B 2 ћ ω v ] } 1 / 2 ,
E n v , ± = 1 2 { ( n + 1 2 ) ( ћ ω ˜ c + ћ ω ˜ v ) [ ( g ˜ c g ˜ v ) μ B B 2 ћ ω ˜ c ] } ( Δ ) 1 / 2 { [ Δ + ( n + 1 2 ) ( ћ ω c ћ ω v ) ] [ ( g c + g v ) μ B B 2 ћ ω c ] } 1 / 2 .
Here, n is the Landau level index for the σ = ±½ states of the conduction and valence bands, µB = eħ/2m0 is the Bohr magneton, and B is the applied magnetic field. The cyclotron frequencies of the conduction (ωc) and valence (ωv) bands are defined, respectively, as ω c = ω + ω ˜ c and ω v = ω + ω ˜ v , where ω = eB/m is the cyclotron frequency in the two-band model ( 1 m = v c 2 Δ ). ω ˜ c and ω ˜ v are the far-band contributions. Since the far-bands are nearly equally distant from the conduction and valence bands ( L 6 ± ), we assume that these two bands are symmetric. The far-band contributions are thus given by ω ˜ c = e B m ˜ = ω ˜ and ω ˜ v = e B m ˜ = ω ˜ . Similarly, the g factors of the conduction (gc) and valence (gv) bands are given by g c = g + g ˜ c and g v = g + g ˜ v , where the tilted terms represent the far-band contributions. The far-band cyclotron energy contribution is assumed to be equal to the effective spin splitting. We thus get g ˜ c μ B B = ћ ω ˜ and g ˜ v μ B B = ћ ω ˜ .
Finally, the Landau level energies read as follows:
E n c , + = ћ ω ˜ + Δ 2 + 2 ( v c 2 + Δ m ˜ ) ћ e B ( n + 1 ) ,
E n c , = + ћ ω ˜ + Δ 2 + 2 ( v c 2 + Δ m ˜ ) ћ e B n ,
E n v , + = + ћ ω ˜ Δ 2 + 2 ( v c 2 + Δ m ˜ ) ћ e B ( n + 1 ) ,
E n v , = ћ ω ˜ Δ 2 + 2 ( v c 2 + Δ m ˜ ) ћ e B n .
We can redefine the Landau index such that N = n for spin (−) states and N = n + 1 for spin (+) states. Note, however, that special care has to be taken when dealing with the N = 0 (n = 0) Landau level, which is non-degenerate in spin. Everything finally reduces to:
E N > 0 c , ± = ћ ω ˜ + Δ 2 + 2 ( v c 2 + Δ m ˜ ) ћ e B N ,
E 0 c = ћ ω ˜ + Δ .
From Equations (10a) and (10b), we can extract v D as the renormalization of v c by the far-band correction m ˜ to the band edge mass. The expression of v D is thus:
v D = v c 2 + Δ m ˜ .
The Landau levels are finally written as:
E N > 0 c , ± = ћ ω ˜ + Δ 2 + 2 v D 2 ћ e B N , E 0 c = ћ ω ˜ + Δ ,
E N > 0 v , ± = ± ћ ω ˜ Δ 2 + 2 v D 2 ћ e B N , E 0 v = ћ ω ˜ Δ .
They correspond to the levels of a massive Dirac model with velocity v D plus a linear far-band contribution term ± ћ ω ˜ .
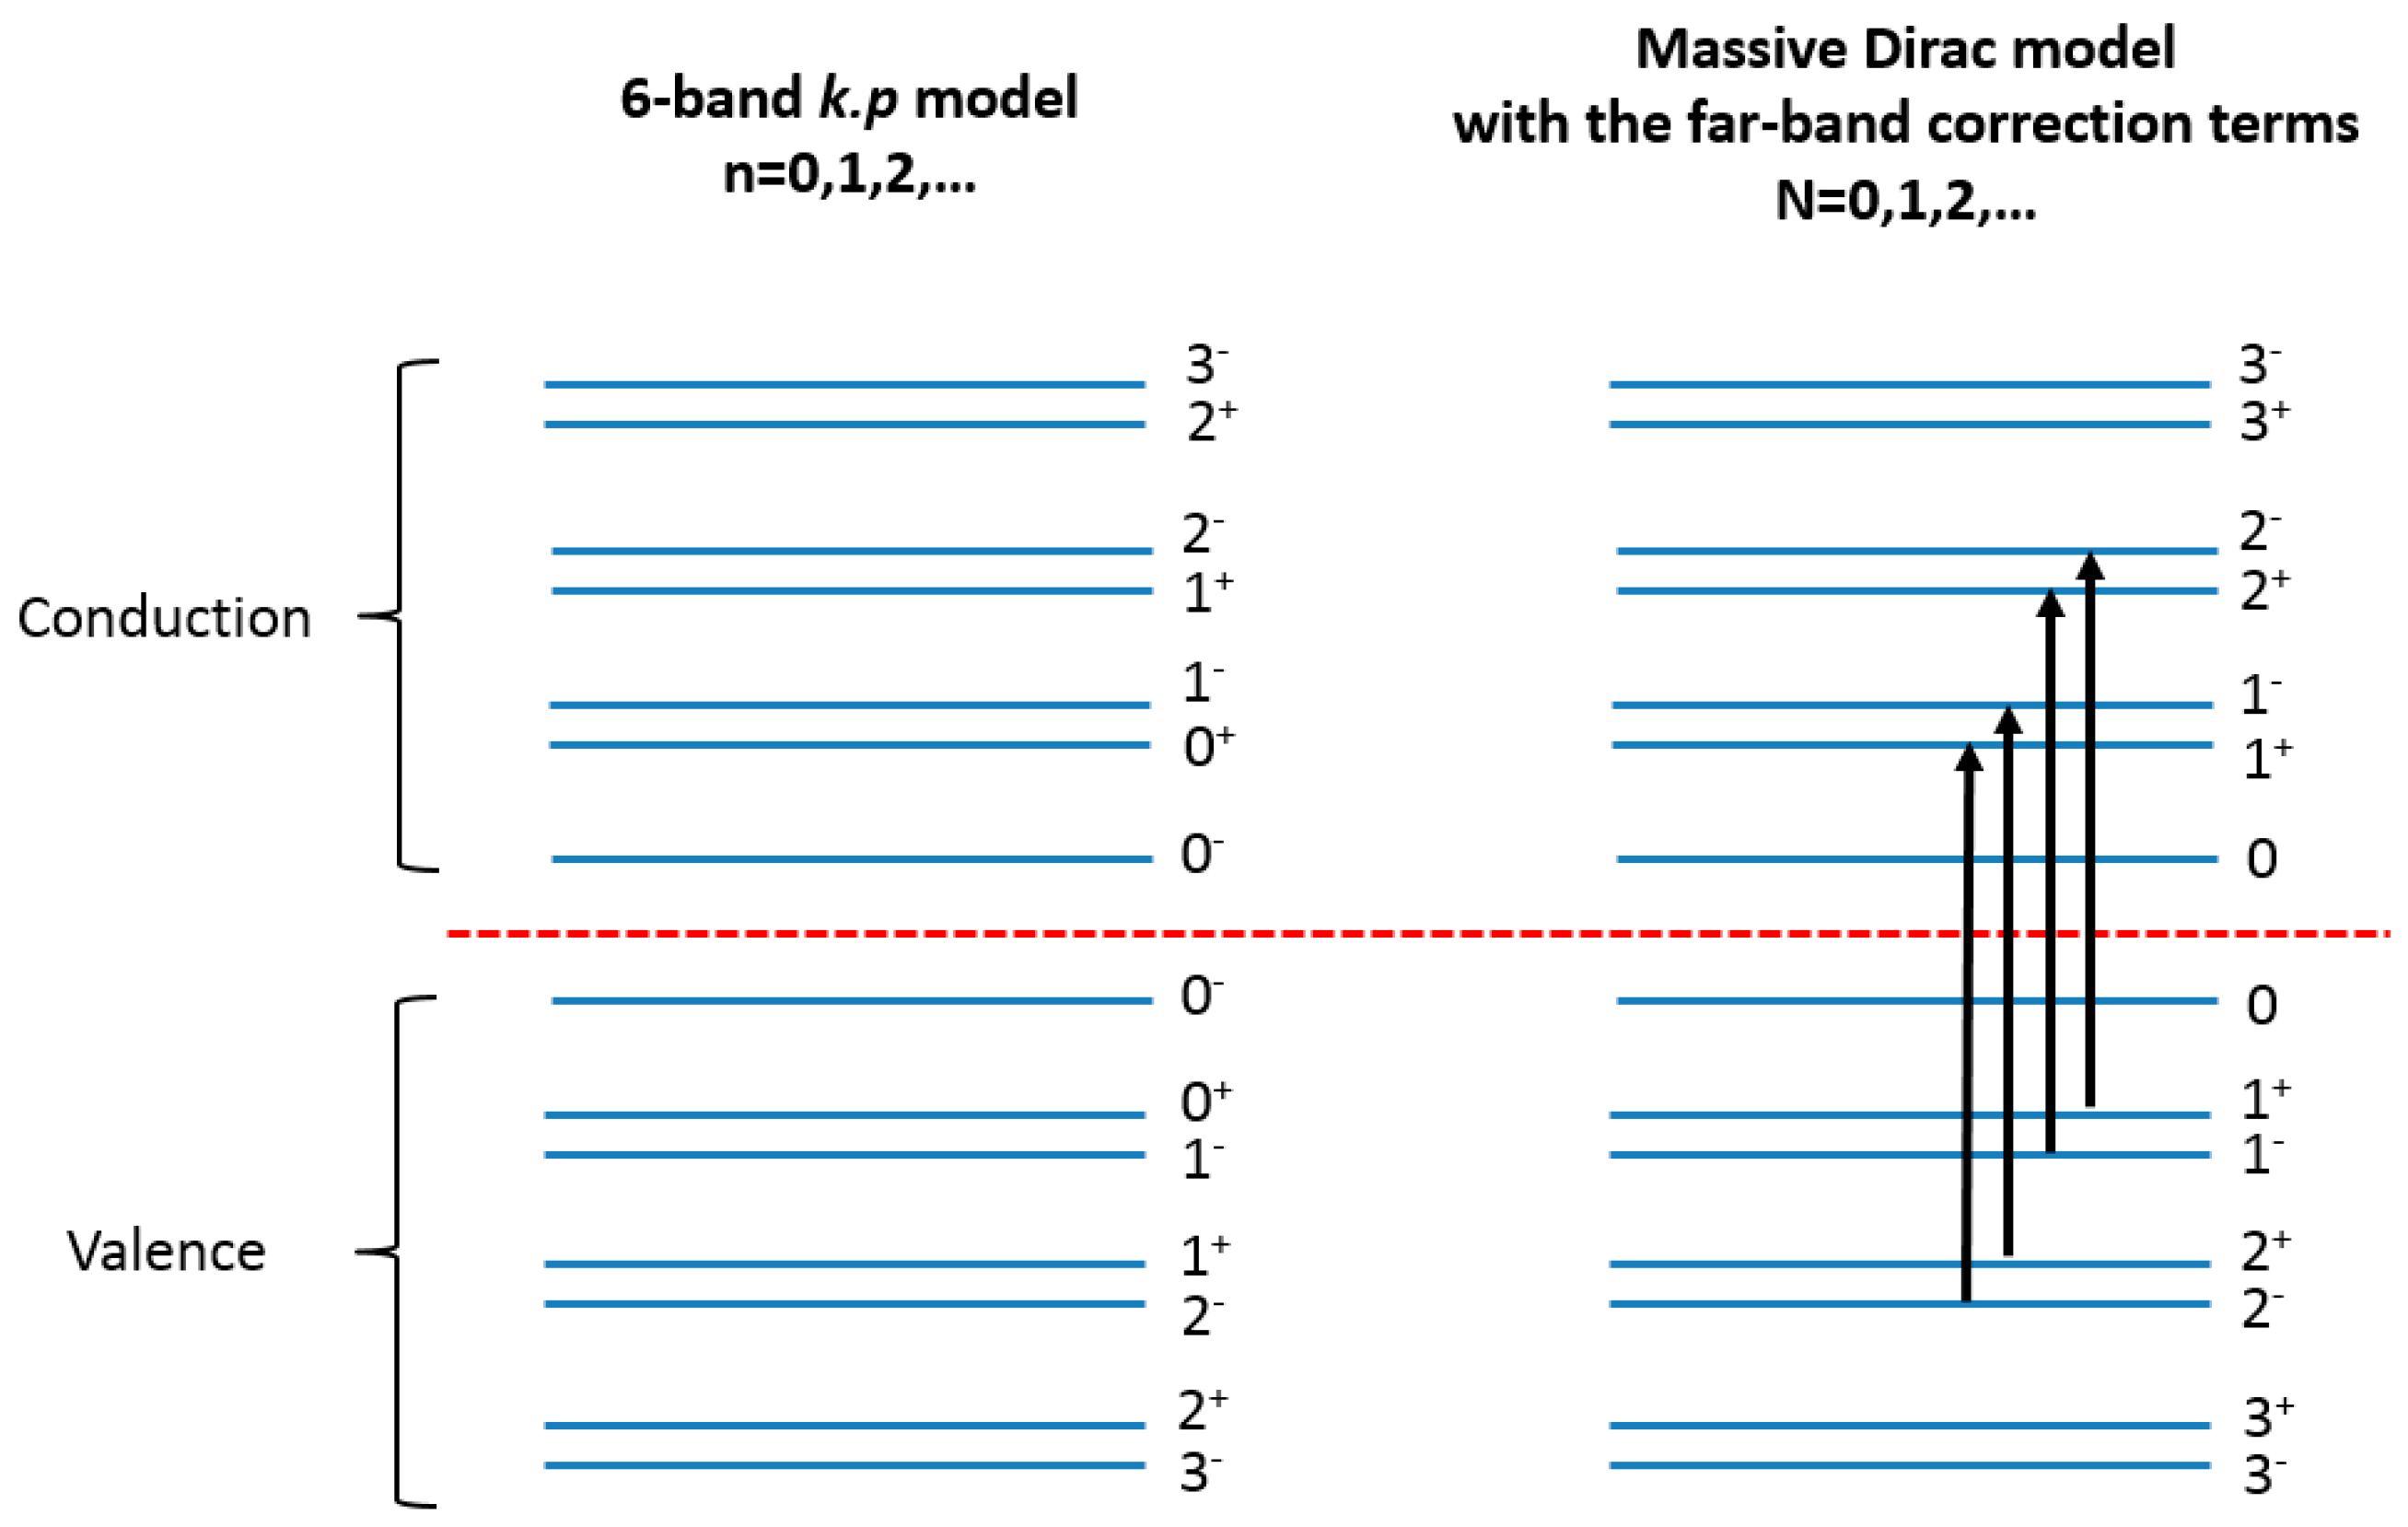
In magneto-optical spectroscopy (Faraday geometry), the selection rules for interband transitions have been discussed by Bauer and Zawadzki [27] and obey Δn = 0 and Δσ = ±1, or Δn = ±2 and Δσ = ±1. In the notation introduced for the massive Dirac model, this is simplified to ΔN = ±1 and Δσ = ±1. Figure 3 illustrates how these selection rules are equivalent. Accordingly, the interband transition energies, occurring at kz = 0 where the joint density of states is optimal, simply read:
E N c , ± E N ± 1 v , = Δ 2 + 2 v D 2 ћ e B N + Δ 2 + 2 v D 2 ћ e B ( N ± 1 ) .
We notice that the interband transition energy is independent from the term that is linear in ω ˜ . The transitions are thus insensitive to the effective spin. This is characteristic of ideal massive Dirac fermion transitions. To summarize, the Landau level interband transitions in the Faraday geometry can be effectively described by an ideal massive Dirac fermion model, even if the far-band correction terms are present.
The intraband transition energies, at kz = 0, similarly yield:
E N ± 1 c / v , ± E N c / v , ± = | Δ 2 + 2 v D 2 ћ e B ( N ± 1 ) Δ 2 + 2 v D 2 ћ e B N | .

2.4. Velocity as a Function of θ

For any tilted valleys θ ≠ 0, the Dirac fermions undergo the same physics as in the longitudinal valley θ = 0 and the expressions from transition energies remain unchanged. The only band parameter we have to consider is the velocity v D that varies as a function of θ. In this section, we will give useful expressions to calculate v D in a given valley.
Consider a (111)-oriented surface Brillouin zone: the electronic bulk band structure is four-fold degenerate. The magnetic field is applied perpendicular to the sample surface, in the Faraday geometry, or along the growth axis [111]. Hence, four band minima occurring at four equivalent L-points yield a longitudinal valley for an ellipsoidal pocket oriented parallel to the [111] direction (θ = 0) and three other oblique valleys where ellipsoidal pockets are tilted by θ = 70.5°. For this matter, we define the velocity in the longitudinal valley as v D ( 111 ) . Using the expression of the cyclotron frequency given by Bauer [8], we can derive the velocity expression as a function of θ as:
v D ( θ ) = v D ( 111 ) ( 1 K s i n 2 θ + c o s 2 θ ) 1 / 4 .
For the oblique valleys of (111)-oriented surface, we get v D ( θ = 70.5 ° ) = v D ( 111 ) ( 8 9 1 K + 1 9 ) 1 / 4 .
For the (001)-oriented surface, we have v D ( θ = 53 ° ) = v D ( 111 ) ( 16 25 1 K + 9 25 ) 1 / 4 .

3. Magneto-Optical Landau Level Spectroscopy of Bulk Massive Dirac Fermions in (111) Pb1−xSnxSe and Pb1−xSnxTe

The Landau levels of (111)-oriented Pb1−xSnxSe and Pb1−xSnxTe have recently been studied in detail using infrared (IR) magneto-optical spectroscopy in the Faraday geometry [17,18]. Far- and mid-infrared (FIR and MIR) magneto-optical absorption measurements were performed. A 30–700 cm−1 range is covered in FIR and a 700–7500 cm−1 is covered in MIR. Large samples grown on cleaved (111) BaF2 substrates by means of molecular beam epitaxy (MBE) were used. The applied magnetic field was oriented along the [111] direction (growth axis) and perpendicular to the sample surface. An Si composite bolometer cooled down to 4.5K was used to detect the transmitted signal. Transmission spectra were acquired and analyzed by a Bruker Fourier transform infrared (FTIR) spectrometer (Bruker, Germany). The relative transmission at a given magnetic field B is defined to be the normalization of the sample transmission T(B) by the zero-field transmission T(0).
Measurements up to 17 T at 4.5 K have been made for 0 ≤ x ≤0.30 in Pb1−xSnxSe. The bulk band parameters can be precisely extracted as long as the sample has a high enough mobility (>5000 cm2/Vs) and low carrier density (<5 × 1018 cm−3). Results from our work on Pb1−xSnxSe (x = 0.14) in Reference [17] are shown in Figure 4. 
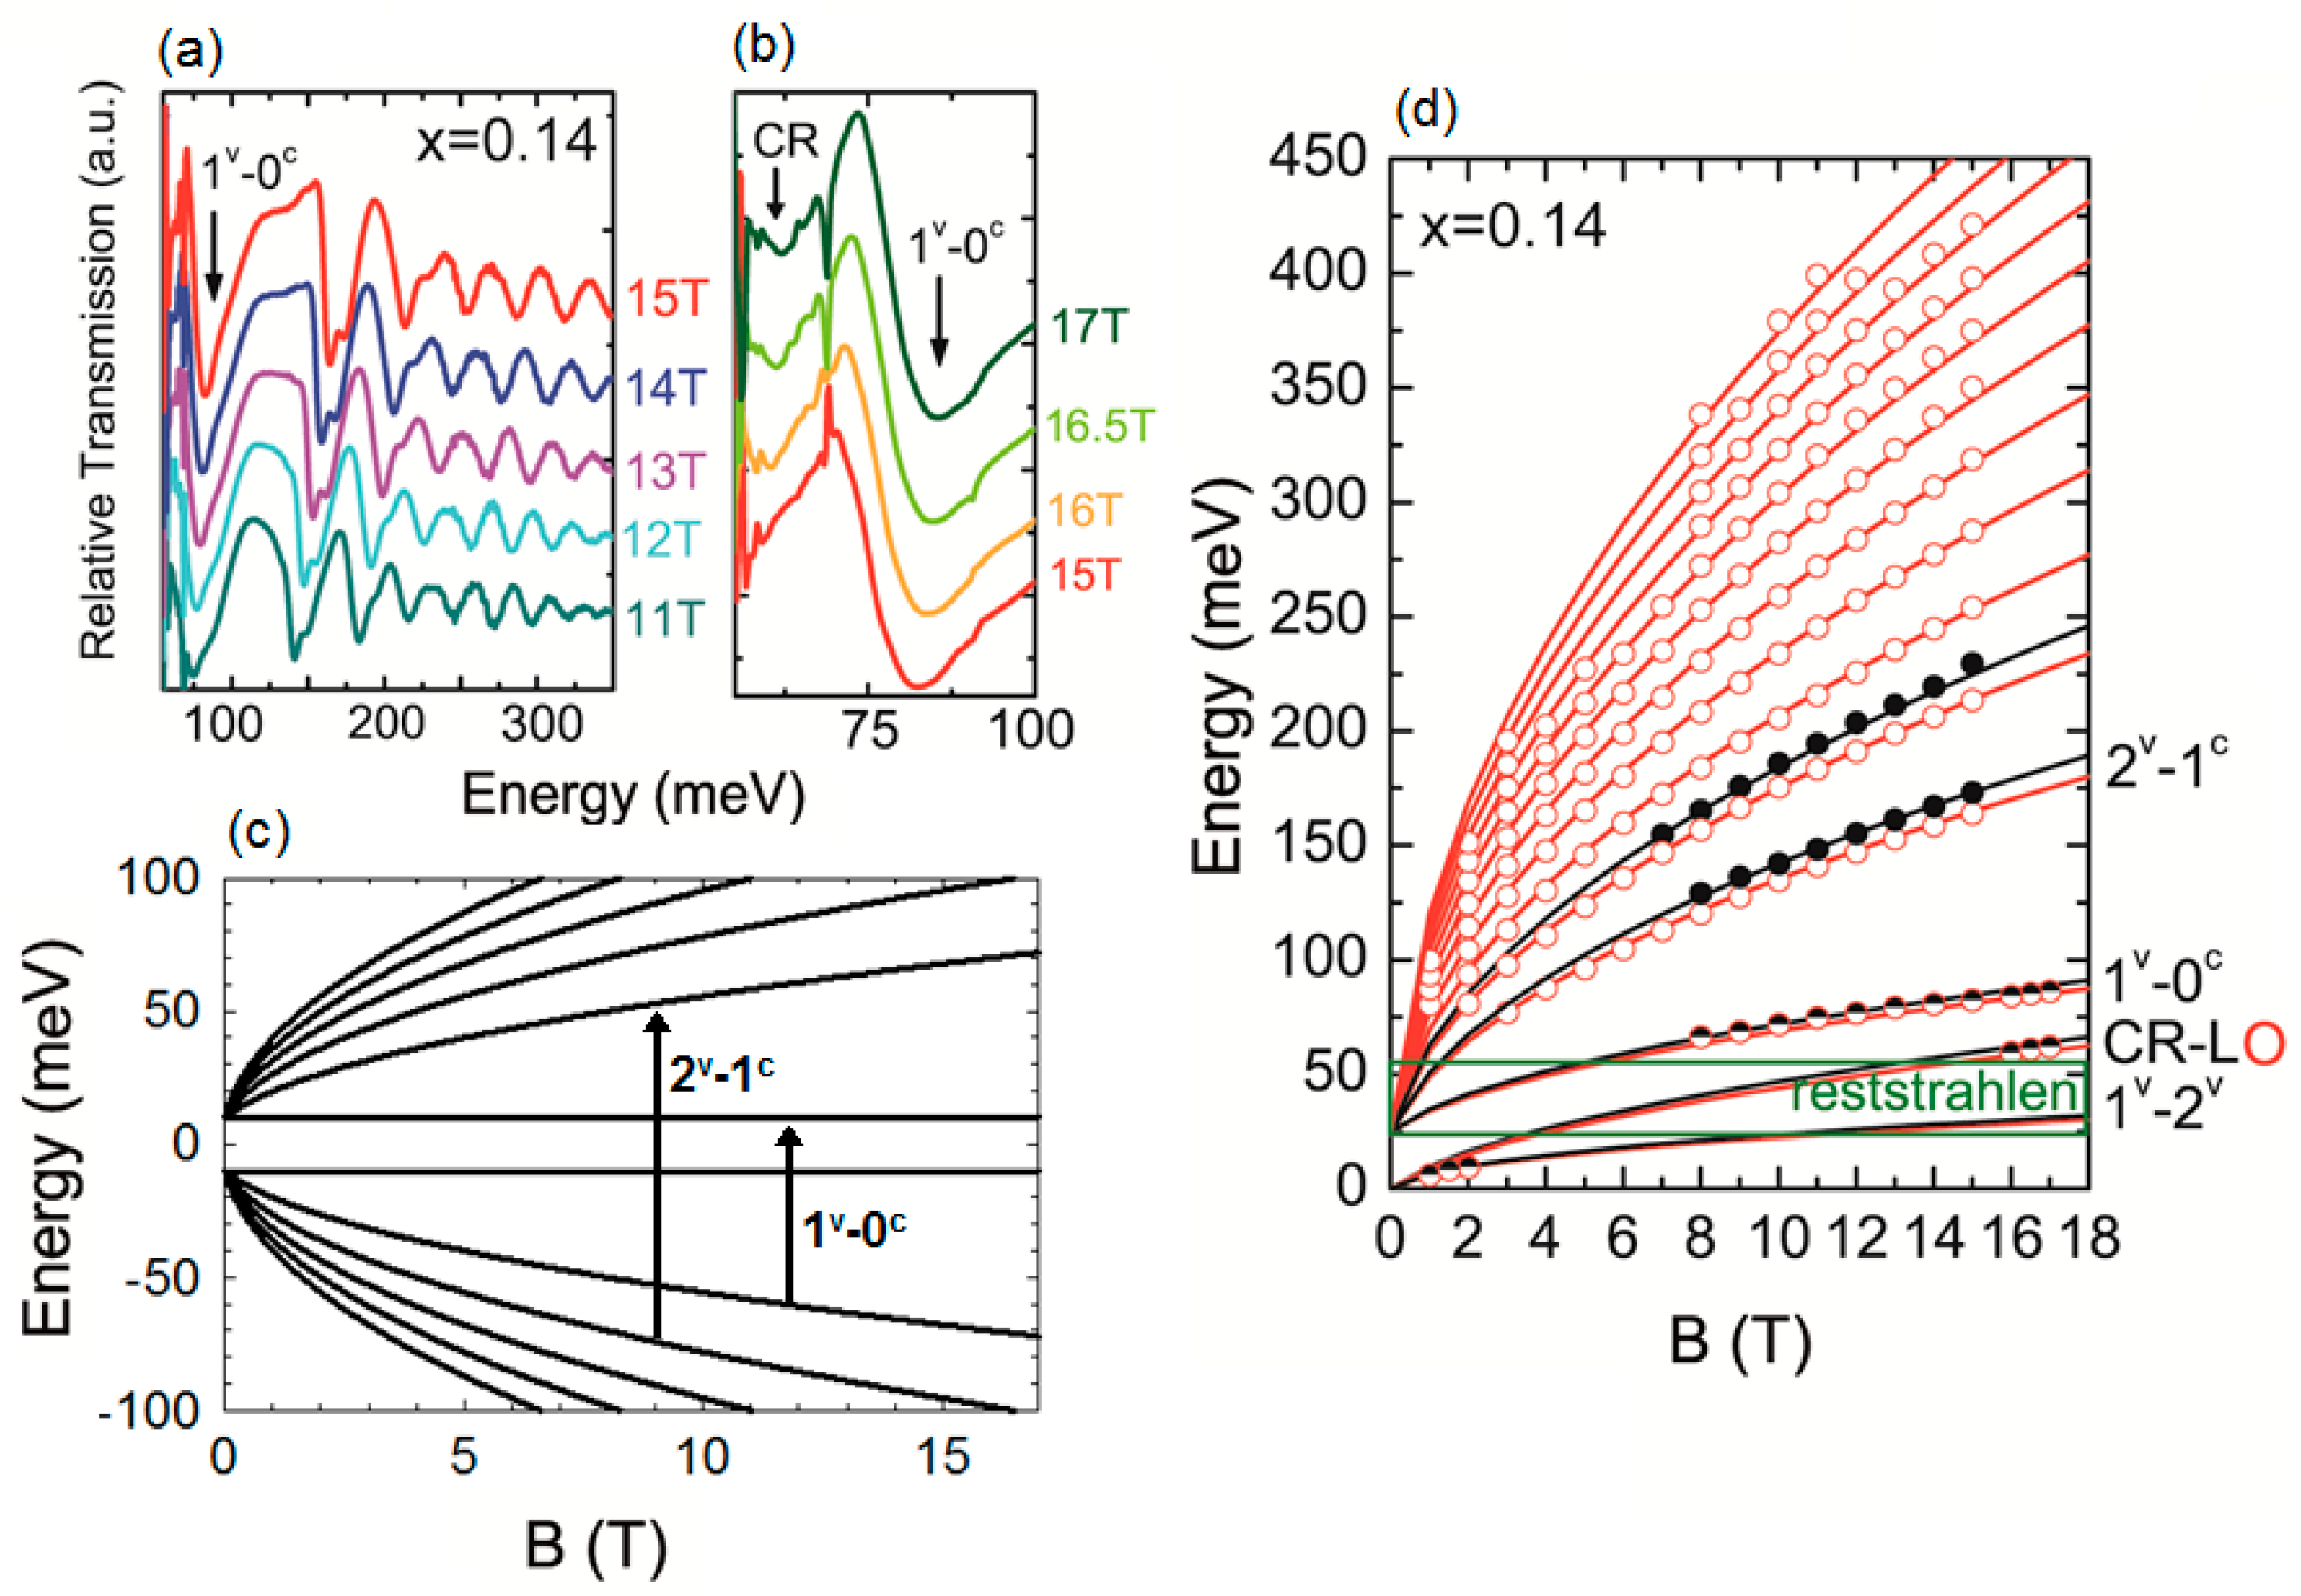
Figure 4a,b, respectively, show the relative transmission amplitude from transitions observed between 11T and 15T in the MIR range and between 15 T and 17 T for the FIR range. We know a priori from transport measurements that this sample is slightly p-type having a Fermi level intersecting the bulk valence band. In Figure 4a, the transition occurring at the lowest energy corresponds to the first interband 1v − 0c transition (Figure 4c). The second interband transition at slightly higher energy is a 2v − 1c transition (Figure 4a,c). Notice that this transition seems split, as a result of the bulk valley degeneracy. In the FIR range (Figure 4b), the first interband transition is again reproduced. The ground state intraband cyclotron resonance (1v − 0v) can also be observed and is labeled CR. The energy of the transmission minima is extracted then plotted versus field in Figure 4d. Open red and full black circles denote, respectively, transitions attributed to the oblique and longitudinal bulk valleys.
All transitions are fit using Equation (13) for interband transitions and Equation (14) for intraband transitions (red curves for oblique and black curves for longitudinal valleys), confirming the 3D massive Dirac nature of bulk bands in Pb1−xSnxSe. Here, L and O stand, respectively, for longitudinal and oblique valleys. The reststrahlen band of BaF2 substrate is between 22 and 55 meV. In this region, no transition can be observed. The velocity of massive Dirac fermions can then be measured with a precision that is better than 2%, and the band gap can be determined, typically, with an uncertainty of 5 meV. Additionally, transitions pertaining to Landau levels from different valleys can be well differentiated.
The velocity v D ( x ) for both valleys and the magnitude of the energy gap have been reported in Reference [17] for samples having x between 0 and 0.30. The closure and reopening of the energy gap have also been reported, with the band inversion occurring at x = 0.16 in agreement with previous measurements of the energy gap. Similar measurements have been made for Pb1−xSnxTe, confirming the Dirac nature of the bulk bands. They are also reported in References [17,18]. Samples having x between 0 and 0.56 have been measured. The band inversion is seen to occur at about x = 0.4, in agreement with the experimental literature. The velocity is higher than that measured for Pb1−xSnxSe for the longitudinal valley.

4. The Landau Levels of Massless Dirac Surface States in (111) Pb1−xSnxSe and Pb1−xSnxTe

The Landau level dispersion for the Dirac surface states of TCI has been treated theoretically by Serbyn and Fu [28], as well as by Li, Zhang and MacDonald [29]. Scanning tunneling microscopy (STM) measurements have allowed a thorough characterization of the Landau levels of (100) topological surface states [30,31]. In the case of the (111) surface, the Landau levels were studied using cyclotron resonance [18]. The (111) surface states of Pb1−xSnxSe and Pb1−xSnxTe are four-fold degenerate for both materials, with one massless Dirac cone occurring at the Γ ¯ -point of the 2D Brillouin zone and three occurring at the M ¯ -points. In both cases, the Landau levels are given by:
E N c / v = ± 2 v D 2 ћ e B N .
The velocity v D of the TSS may be different for the two valleys. The N = 0 Landau level is dispersionless in the case, and thus yields a ground state N = 0 to N = 1 (or vice versa) cyclotron resonance that is given by:
E C R T S S = 2 v D 2 ћ e B N .
Such an N = 0 to N = 1 ground state cyclotron resonance, resulting from the topological surface states (CR-TSS) of Pb1−xSnxSe and Pb1−xSnxTe, has been observed recently.
Pb1−xSnxTe having x = 0.46 [18] and x = 0.56 has been reported. The velocity obtained from the CR-TSS in that case was almost equal to the velocity of the bulk longitudinal valley. The transition was thus associated with the Γ ¯ -point Dirac cone. The M ¯ -point Dirac cone in (111) Pb1−xSnxTe is expected to yield a similar transition with a lower velocity likely equal to that of the oblique valleys [11,12,32,33]. It has not been observed in (111) samples grown on BaF2, since it likely occurs in the reststrahlen band of the BaF2 substrate.
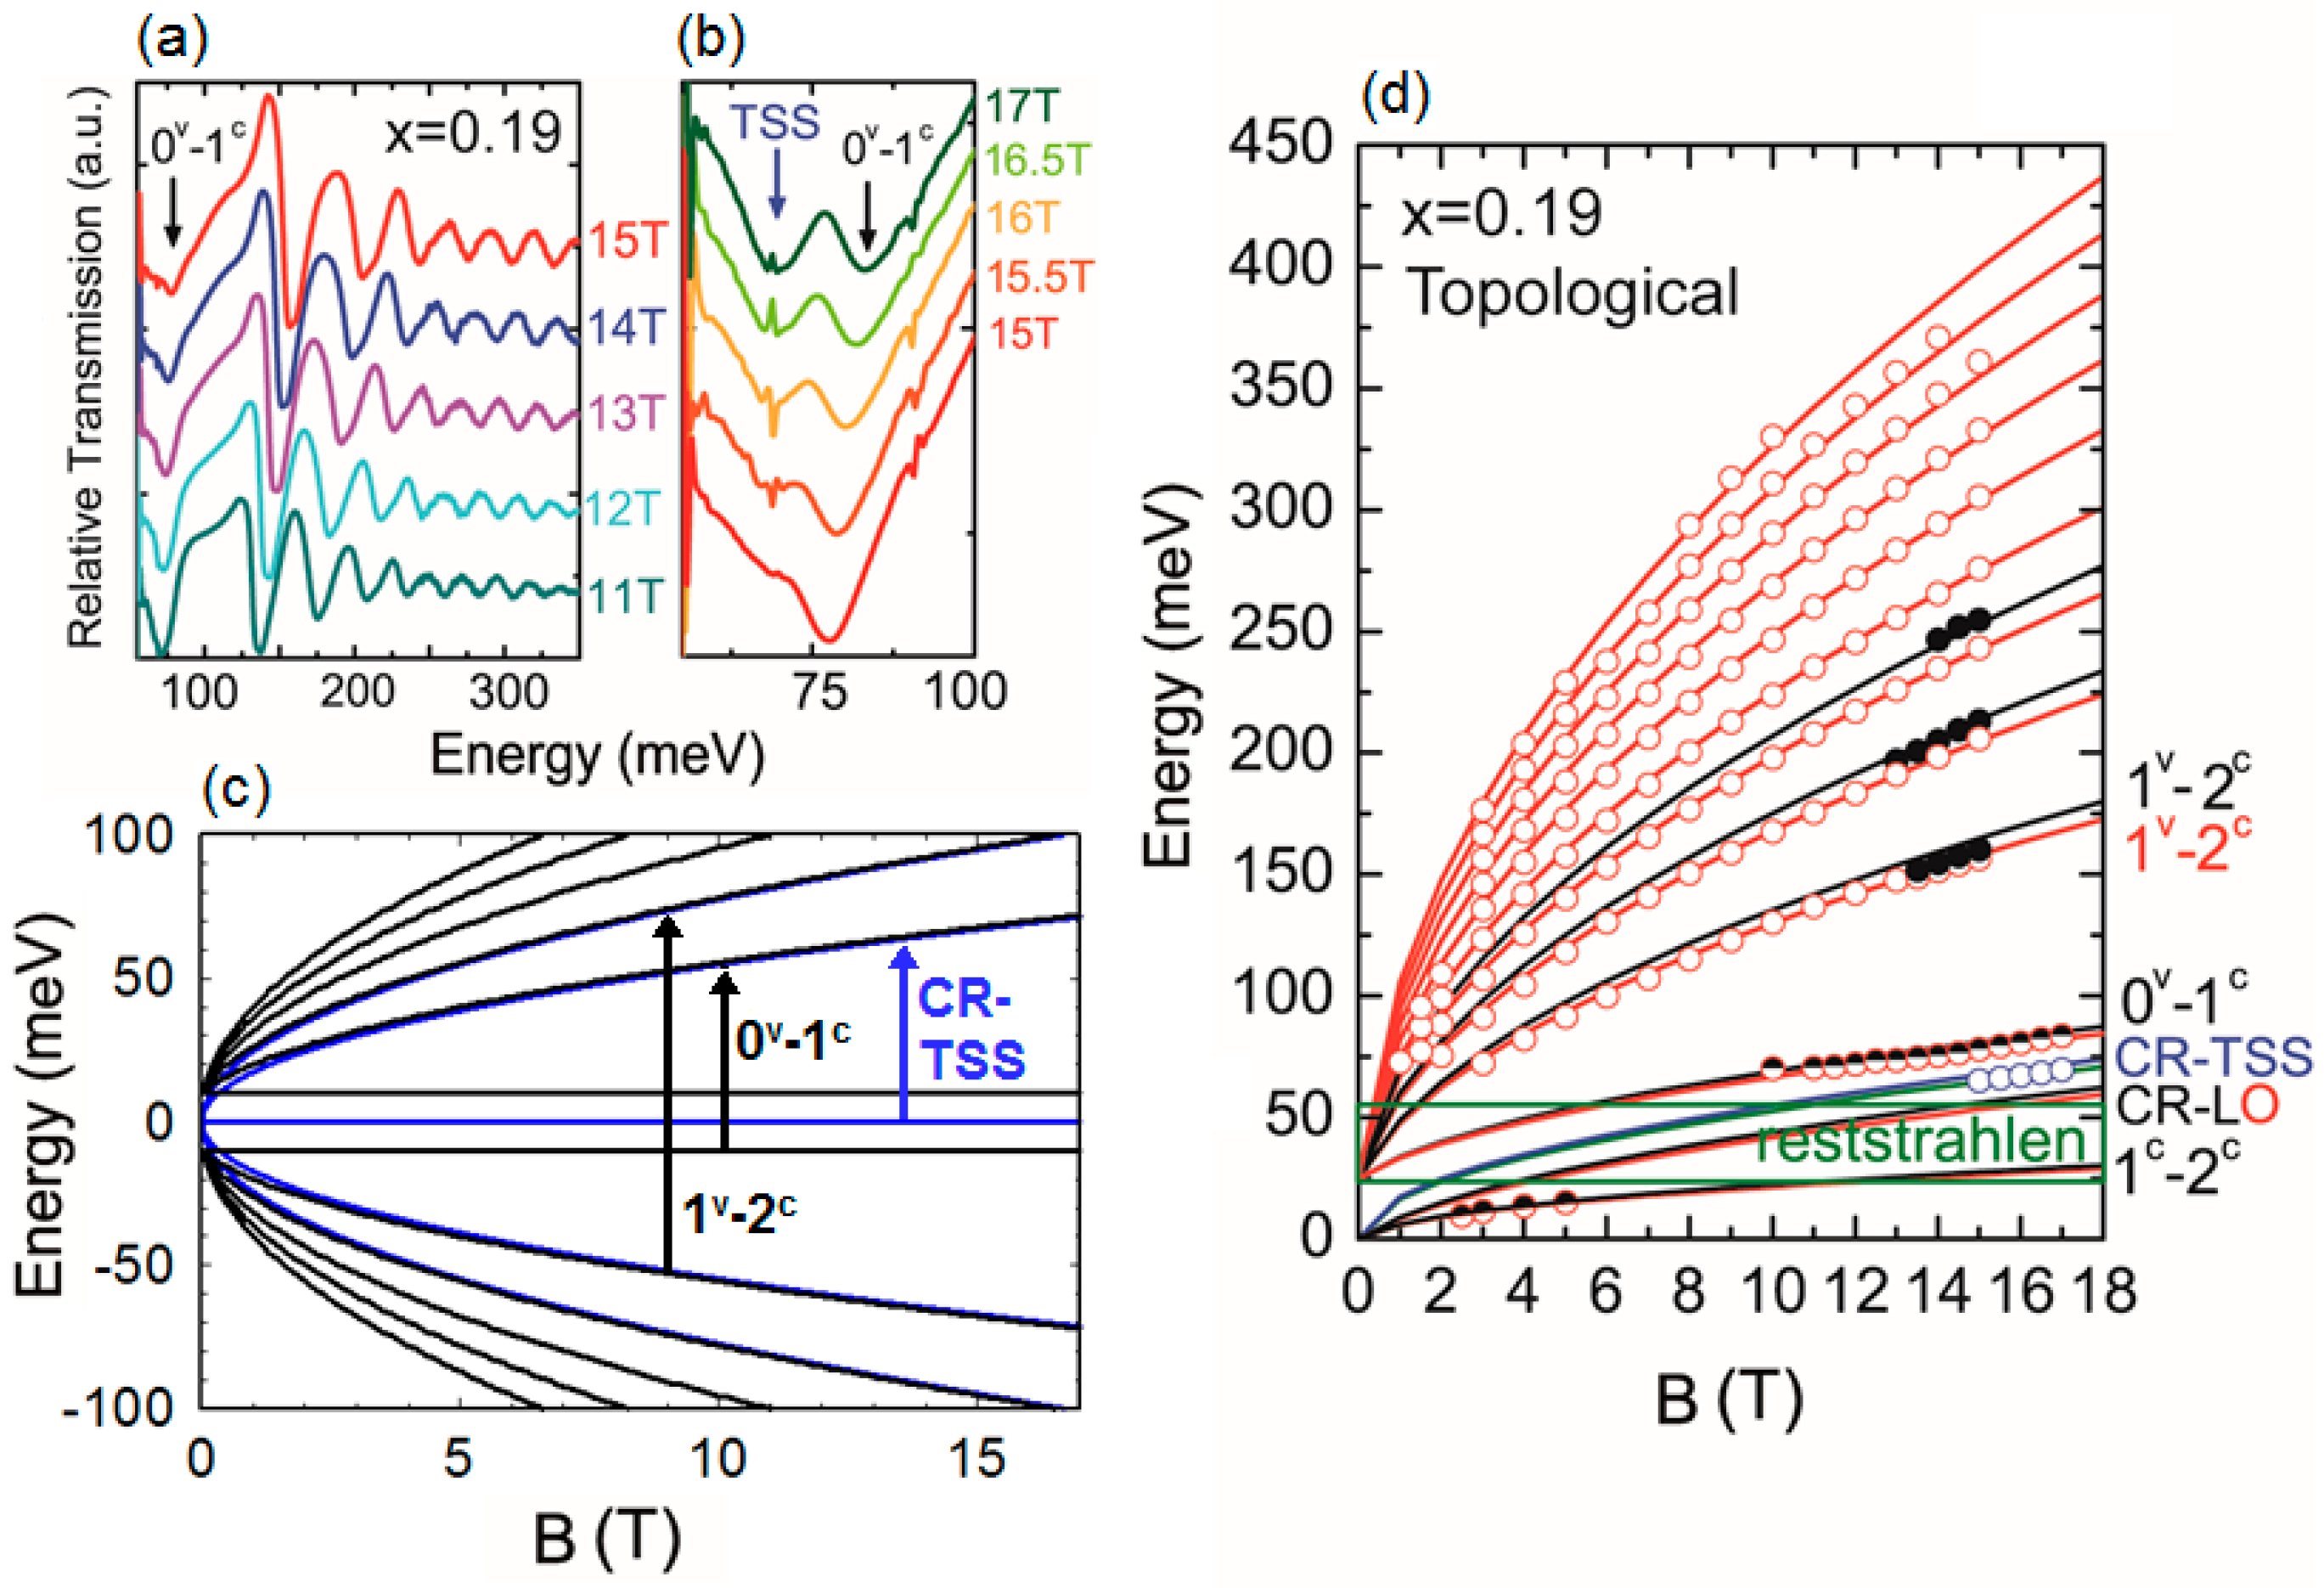
Similar results have also been reported for Pb1−xSnxSe (x = 0.19) that is n-type and has a Fermi level intersecting the bulk conduction band. They are shown in detail in Figure 5 as adapted from Reference [17]. Figure 5a,b, respectively, show the relative transmission amplitude from transitions observed between 11T and 15T in the MIR range and between 15T and 17T for the FIR range. In Figure 5a, interband transitions from bulk Landau levels are shown; the transition occurring at the lowest energy corresponds to the first interband 0v − 1c transition (see Figure 5c). The second interband transition at slightly higher energy is 1v − 2c (Figure 5a,c). In the FIR range (Figure 5b), the first interband transition is again reproduced. At low energies, a CR from a N = 0 − N = 1 transition of massless TSS is observed (see Figure 5c). The energy of the transmission minima is extracted and then plotted versus the field in Figure 5d. Open red and full black circles denote, respectively, transitions attributed to the oblique and longitudinal bulk valleys. Blue points refer to the CR-TSS. All bulk transitions agree with Equations (13) and (14). The CR-TSS agrees quite well with Equation (17) for v D equal to that of the bulk 4.7 × 10⁵ m/s (solid blue line). This additional transition is also not seen in the trivial x = 0.14 sample, consolidating the fact that it is due to the presence of TSS. In Pb1−xSnxSe, in contrast with Pb1−xSnxTe, the CR-TSS is likely due to all four Dirac cones (at Γ ¯ - and M ¯ -points), since they are almost all identical and all have velocities that are almost equal to 4.7 × 10⁵ m/s. This is mainly the reason why the CR-TSS in Pb1-xSnxSe is significantly stronger than that in Pb1−xSnxTe. This agrees with ARPES studies of Pb1−xSnxSe [34].
In both Pb1−xSnxSe and Pb1−xSnxTe, the additional transition associated with TSS occurs at energies where no transitions are expected from the bulk and lies above the ground state cyclotron resonance of the bulk bands. It additionally satisfies Equation (17), and is seen to disappear across the topological phase transition in magneto-optical spectroscopy. These three arguments are evidence that the additional transition that is observed is indeed the TSS ground cyclotron resonance.

5. IR Magneto-Optical Determination of the Topological Index

Recently, attention has been given to study the full topological phase diagram in Pb1−xSnxSe and Pb1−xSnxTe using magneto-optical absorption experiments. Looking back at the expression of the bulk Landau levels as a function of magnetic field, we have noticed that the velocity given by Equation (11) can be related to the relative sign of the energy gap, or equivalently to the topological index [35,36]. If the critical velocity v c is known, or can be estimated, one can extract the sign of the topological index by measuring:
v D 2 v c 2 = Δ / m ˜ .
When Δ / m ˜ is positive, the system is topologically trivial. When it is negative, the system is non-trivial [17]. Thus, generally speaking, v D 2 v c 2 yields a measure of the ratio of the Dirac gap of the system to the far-band mass contribution [8]. In the particular case of IV–VI TCI, the quantity is large enough and can be reliably measured. As we will discuss next, the implications of this observation are deep and will allow us to get more hands-on experimental understanding of the thermodynamics of topological phase transition. Lastly, it is important to note that this fact establishes magneto-optical Landau level spectroscopy as a powerful technique allowing one to not only map out the band parameters of a system, but also to extract bulk information about the topological nature of a given material [17].

6. Future Perspectives

6.1. The Nature of the Topological Phase Transition in IV–VI Topological Materials

Our discussion brings us next to discuss the dynamics of the topological phase transition. A key point in the distinction between a topological trivial and a topological non-trivial phase is the claim that a material cannot transition from one phase to the other without gap closure. Thus, at the critical point between two topological phases, a gapless 3D Dirac state may exist. Recent angle resolved photo-emission spectroscopy experiments on Pb1−xSnxSe attempted to quantify the bulk band gap and have challenged this claim [37]. In magneto-optical Landau level spectroscopy, the determination of the band gap is precise to about 2–5 meV in samples having good enough transport parameters. Up until now, no composition of Pb1−xSnxSe has been seen to exhibit a gapless 3D Dirac state. In Pb1−xSnxTe, matters are more complicated. We have reported a thorough quantification of the bulk band gap near the topological phase transition, and have not yet observed a bulk gap closure [17]. Pb1−xSnxTe samples having high Sn content are, however, Bi-doped (0.01%–0.2%) [38]. The Bi content is likely to have some impacts on the band gap. However, it is expected to be minimal for such concentrations. The energy gap that we observe in Pb1−xSnxTe is never smaller than 30 meV. Overall, it is unclear whether the gapless 3D Dirac state is fundamentally unfavorable or suppressed by alloy disorder.
Several theoretical works and hypotheses have been proposed to explain how a topological phase transition can occur without gap closure. Electron–electron correlations and electron–phonon coupling were among the possible interactions considered [39,40,41]. More conventionally, alloy disorder and impurity doping were also argued to lead to the gapping of the 3D Dirac state [37,38].
A recent theoretical work deserves closer attention. In this work, an expression for the velocity of a system going through a topological phase transition was derived. It was shown to depend on the Dirac gap and Schrödinger mass terms. In 3D, the topological phase transition was argued to be first-order in nature, and the band-gap is discontinuous in the vicinity of the transition, in agreement with recent observations in ARPES [41]. In IR Landau level spectroscopy, indeed, no gapless zero-energy state has been yet reported in Pb1−xSnxSe and Pb1−xSnxTe. The findings typically agree with ARPES results from Reference [30]. Further work needs to be done to determine whether the behavior is fundamentally discontinuous or suppressed by disorder.

6.2. Surface and Bulk State Landau Levels at High Magnetic Fields

Finally, several questions and theoretical predictions about the behavior of Landau levels of surface Dirac cones in TCI materials remain unaddressed and untested.
In particular, in the case of the (111) surface Pb1−xSnxTe, the M ¯ -Dirac cones were shown to be highly anisotropic and asymmetric. It is thus expected to behave like the non-ideal Dirac cones of Bi-based TIs. The Landau level dispersion of non-ideal Dirac cones was discussed under the scope of the Berry phase by McKenzie and Wright [42], and Taskin and Ando [43]. It was shown that a strong Zeeman term will coexist with the cyclotron term of Dirac fermions, and will yield a field-dispersing zeroth Landau level. This has not yet been observed in Landau level spectroscopy on TCI materials. The difficulty lies mainly in the fact that the M ¯ -Dirac cones may be shifted with respect to the Γ ¯ -Dirac cone and may have Fermi levels that are farther from the Dirac point [27]. Low-index Landau levels are hence challenging to observe. Intraband transitions involving M ¯ -Dirac cones are thus expected to lie at relatively low energies and might require high magnetic fields to yield transitions in the IR range (>1 THz).
Finally, it is also worthwhile noting that, at high magnetic fields, it is predicted that the N = 0 Landau levels of the conduction and valence bands may cross and reinvert, yielding a possible suppression of the topologically non-trivial state [36]. The behavior of surface Landau levels is not known in this limit. Additionally, in magnetic fields that are high enough for the surface states to be in the quantum limit, but low enough not to reinvert the bulk band ordering, SU(3)-like excitations are predicted to occur in TCI, as a result of the valley degenerate character of surface states [29]. These predictions remain untested. They will require high quality materials having a high mobility and very low Fermi energy, lying in the bulk band gap.

7. Conclusions

In conclusion, we have discussed the theoretical treatment and experimental work that have been done thus far on the Landau levels of the bulk and surface states on IV–VI TCI materials. This system has shown great promise and yielded results pertaining to the topological surface states owing to the good material quality that can be achieved. We have also discussed recent achievements in understanding the mechanism and nature of the topological phase transition in Pb1−xSnxSe and Pb1−xSnxTe, and presented a number of challenging questions that need to be addressed. Finally, we have presented two predictions about unconventional effects stemming from the dispersion of Landau levels and their valley degeneracy that remain untested. Magneto-optical Landau level absorption is the ideal tool to put those predictions to the test. However, the conditions required to observe these effects are not easy to reach. Pb1−xSnxSe and Pb1−xSnxTe have shown great promise so far in exhibiting topological surface state signatures in Landau level spectroscopy, owing to their low carrier density and high mobility. They are, therefore, systems that deserve great attention and may soon lead to significant achievements in the field of topological matter.

Acknowledgments

This work is supported by the Agence Nationale de la Recherche LabEx grant ENS-ICFP (ANR-10-LABX-0010/ANR-10-IDEX-0001-02 PSL) and by the Austrian Science Fund, Project SFB F2504-N17 IRON. Thanyanan Phuphachong acknowledges support from the Mahidol Wittayanusorn Scholarship and the Franco-Thai Scholarship.

Author Contributions

Thanyanan Phuphachong, Badih A. Assaf, Louis-Anne de Vaulchier and Yves Guldner wrote the manuscript with significant input from Valentine V. Volobuev, Günther Bauer and Gunther Springholz on theoretical and experimental literature and material growth and characterization.

Conflicts of Interest

The authors declare no conflict of interest.

References

  1. Fu, L. Topological Crystalline Insulators. Phys. Rev. Lett. 2011, 106, 106802. [Google Scholar] [CrossRef] [PubMed]
  2. Hasan, M.Z.; Kane, C.L. Colloquium: Topological insulators. Rev. Mod. Phys. 2010, 82, 3045–3067. [Google Scholar] [CrossRef]
  3. Qi, X.-L.; Zhang, S.-C. Topological insulators and superconductors. Rev. Mod. Phys. 2011, 83, 1057–1110. [Google Scholar] [CrossRef]
  4. Ando, Y. Topological insulator materials. J. Phys. Soc. Jpn. 2013, 82, 102001. [Google Scholar] [CrossRef]
  5. Ando, Y.; Fu, L. Topological Crystalline Insulators and Topological Superconductors: From Concepts to Materials. Annu. Rev. Condens. Matter Phys. 2015, 6, 361–381. [Google Scholar] [CrossRef]
  6. Hsieh, T.H.; Lin, H.; Duan, W.; Bansil, A.; Fu, L. Topological crystalline insulators in the SnTe material class. Nat. Commun. 2012, 3, 982. [Google Scholar] [CrossRef] [PubMed] [Green Version]
  7. Teo, J.C.Y.; Fu, L.; Kane, C.L. Surface states and topological invariants in three-dimensional topological insulators: Application to Bi1−xSb. Phys. Rev. B 2008, 78, 45426. [Google Scholar] [CrossRef]
  8. Bauer, G. Narrow Gap Semiconductors Physics and Applications: Proceeding of the Internationl Summer School; Zawadzki, W., Ed.; Springer: Berlin/Heidelberg, Germany, 1980; Volume 133, pp. 427–446. [Google Scholar]
  9. Dimmock, J.; Melngailis, I.; Strauss, A. Band Structure and Laser Action in PbxSn1−xTe. Phys. Rev. Lett. 1966, 16, 1193–1196. [Google Scholar] [CrossRef]
  10. Strauss, A.J. Inversion of conduction and valence bands in Pb1-xSnxSe alloys. Phys. Rev. 1967, 157, 608–611. [Google Scholar] [CrossRef]
  11. Liu, J.; Duan, W.; Fu, L. Two types of surface states in topological crystalline insulators. Phys. Rev. B Condens. Matter Mater. Phys. 2013, 88, 241303. [Google Scholar] [CrossRef]
  12. Safaei, S.; Kacman, P.; Buczko, R. Topological crystalline insulator (Pb,Sn)Te: Surface states and their spin polarization. Phys. Rev. B Condens. Matter Mater. Phys. 2013, 88, 45305. [Google Scholar] [CrossRef]
  13. Dziawa, P.; Kowalski, B.J.; Dybko, K.; Buczko, R.; Szczerbakow, A.; Szot, M.; Łusakowska, E.; Balasubramanian, T.; Wojek, B.M.; Berntsen, M.H.; et al. Topological crystalline insulator states in Pb1−xSnxSe. Nat. Mater. 2012, 11, 1023–1027. [Google Scholar] [CrossRef] [PubMed]
  14. Xu, S.-Y.; Liu, C.; Alidoust, N.; Neupane, M.; Qian, D.; Belopolski, I.; Denlinger, J.D.; Wang, Y.J.; Lin, H.; Wray, L.A.; et al. Observation of a topological crystalline insulator phase and topological phase transition in Pb1−xSnxTe. Nat. Commun. 2012, 3, 1192. [Google Scholar] [CrossRef] [PubMed]
  15. Tanaka, Y.; Ren, Z.; Sato, T.; Nakayama, K.; Souma, S.; Takahashi, T.; Segawa, K.; Ando, Y. Experimental realization of a topological crystalline insulator in SnTe. Nat. Phys. 2012, 8, 800–803. [Google Scholar] [CrossRef]
  16. Mitchell, D.L.; Wallis, R.F. Theoretical energy-band parameters for the lead salts. Phys. Rev. 1966, 151, 581–595. [Google Scholar] [CrossRef]
  17. Assaf, B.A.; Phuphachong, T.; Volobuev, V.V.; Bauer, G.; Springholz, G.; de Vaulchier, L.-A.; Guldner, Y. Universal relation between velocity and topological character of Dirac fermions through a topological phase transition. arXiv 2016. [Google Scholar]
  18. Assaf, B.A.; Phuphachong, T.; Volobuev, V.V.; Inhofer, A.; Bauer, G.; Springholz, G.; de Vaulchier, L.A.; Guldner, Y. Massive and massless Dirac fermions in Pb1-xSnxTe topological crystalline insulator probed by magneto-optical absorption. Sci. Rep. 2016, 6, 20323. [Google Scholar] [CrossRef] [PubMed]
  19. Burke, J.R.; Houston, B.; Savage, H.T. Anisotropy of the Fermi surface of p-type PbTe. Phys. Rev. B 1970, 2, 1977–1988. [Google Scholar] [CrossRef]
  20. Bernevig, B.A.; Hughes, T.L.; Zhang, S.-C. Quantum Spin Hall Effect and Topological Phase Transition in HgTe Quantum Wells. Science 2006, 314, 1757–1761. [Google Scholar] [CrossRef] [PubMed]
  21. Zhang, H.; Liu, C.-X.; Qi, X.-L.; Dai, X.; Fang, Z.; Zhang, S.C. Topological insulators in Bi2Se3, Bi2Te3 and Sb2Te3 with a single Dirac cone on the surface. Nat. Phys. 2009, 5, 438–442. [Google Scholar] [CrossRef]
  22. Liu, C.X.; Qi, X.-L.; Zhang, H.J.; Dai, X.; Fang, Z.; Zhang, S.C. Model Hamiltonian for topological insulators. Phys. Rev. B Condens. Matter Mater. Phys. 2010, 82, 45122. [Google Scholar] [CrossRef]
  23. Grisar, R.; Burkhard, H.; Bauer, G.; Zawadzki, W. Magnetooptical transitions and band parameters of PbTe. In Proceedings of the International Conference on the Physics of Narrow Gap Semiconductors, Warszawa; Rauluszkiewicz, J., Ed.; PWN-Polish Scientific: Warsaw, Poland, 1978; Volume 115. [Google Scholar]
  24. Dimmock, J. k.p theory for the conduction and valence bands of Pb1−xSnxTe and Pb1−xSnxSe alloys. In Proceedings of the International Conference on the Physics of Semimetals and Narrow Gap Semiconductors, 1969; Carter, D.L., Bate, R.T., Eds.; Pergamon: New York, NY, USA, 1971; Volume 319. [Google Scholar]
  25. Nimtz, G.; Schlicht, B. Narrow-Gap Semiconductors. Narrow-Gap Semiconductors; Springer: Berlin, Germany, 1983; Volume 98. [Google Scholar]
  26. Bauer, G.; Pascher, H.; Zawadzki, W. Magneto-optical properties of semimagnetic lead chalcogenides. Semicond. Sci. Technol. 1999, 7, 703–723. [Google Scholar] [CrossRef]
  27. Burkhard, H.; Bauer, G.; Zawadzki, W. Band-population effects and intraband magneto-optical properties of a many-valley semiconductor: PbTe. Phys. Rev. B 1979, 19, 5149–5159. [Google Scholar] [CrossRef]
  28. Serbyn, M.; Fu, L. Symmetry breaking and Landau quantization in topological crystalline insulators. Phys. Rev. B Condens. Matter Mater. Phys. 2014, 90, 35402. [Google Scholar] [CrossRef]
  29. Li, X.; Zhang, F.; MacDonald, A.H. SU(3) Quantum Hall Ferromagnetism in SnTe. Phys. Rev. Lett. 2016, 116, 26803. [Google Scholar] [CrossRef] [PubMed]
  30. Okada, Y.; Serbyn, M.; Lin, H.; Walkup, D.; Zhou, W.; Dhital, C.; Neupane, M.; Xu, S.; Wang, Y.J.; Sankar, R.; et al. Observation of Dirac node formation and mass acquisition in a topological crystalline insulator. Science 2013, 341, 1496–1499. [Google Scholar] [CrossRef] [PubMed]
  31. Zeljkovic, I.; Okada, Y.; Serbyn, M.; Sankar, R.; Walkup, D.; Zhou, W.; Liu, J.; Chang, G.; Wang, Y.J.; Hasan, M.Z.; et al. Dirac mass generation from crystal symmetry breaking on the surfaces of topological crystalline insulators. Nat. Mater. 2015, 14, 318–324. [Google Scholar] [CrossRef] [PubMed]
  32. Tanaka, Y.; Shoman, T.; Nakayama, K.; Souma, S.; Sato, T.; Takahashi, T.; Novak, M.; Segawa, K.; Ando, Y. Two types of Dirac-cone surface states on the (111) surface of the topological crystalline insulator SnTe. Phys. Rev. B Condens. Matter Mater. Phys. 2013, 88, 235216. [Google Scholar] [CrossRef]
  33. Yan, C.; Liu, J.; Zang, Y.; Wang, J.; Wang, Z.; Wang, P.; Zhang, Z.-D.; Wang, L.; Ma, X.; Ji, S.; et al. Experimental Observation of Dirac-like Surface States and Topological Phase Transition in Pb1−xSnxTe(111) Films. Phys. Rev. Lett. 2014, 112, 186801. [Google Scholar] [CrossRef] [PubMed]
  34. Polley, C.M.; Dziawa, P.; Reszka, A.; Szczerbakow, A.; Minikayev, R.; Domagala, J.Z.; Safaei, S.; Kacman, P.; Buczko, R.; Adell, J.; et al. Observation of topological crystalline insulator surface states on (111)-oriented Pb1−xSnx Se films. Phys. Rev. B Condens. Matter Mater. Phys. 2014, 89, 75317. [Google Scholar] [CrossRef]
  35. Shen, S.-Q. Topological Insulators: Dirac Equation in Condensed Matters; Springer Science and Business Media: Berlin, Germany, 2013; Volume 174. [Google Scholar]
  36. Bernevig, B.A.; Hughes, T.L. Topological Insulator and Topological Superconductors; Princeton University Press: Princeton, NJ, USA, 2013. [Google Scholar]
  37. Wojek, B.M.; Dziawa, P.; Kowalski, B.J.; Szczerbakow, A.; Black-Schaffer, A.M.; Berntsen, M.H.; Balasubramanian, T.; Story, T.; Tjernberg, O. On the nature of the band inversion and the topological phase transition in (Pb,Sn)Se. Phys. Rev. B 2014, 90, 161202. [Google Scholar] [CrossRef]
  38. Volobuev, V.V.; Mandal, P.S.; Galicka, M.; Caha, O.; Sánchez-Barriga, J.; Di Sante, D.; Varykhalov, A.; Khiar, A.; Picozzi, S.; Bauer, G.; et al. Giant Rashba Splitting in Pb1−xSnxTe (111) Topological Crystalline Insulator Films Controlled by Bi Doping in the Bulk. Adv. Mater. 2016. [Google Scholar] [CrossRef]
  39. Garate, I. Phonon-induced topological transitions and crossovers in dirac materials. Phys. Rev. Lett. 2013, 110, 1–5. [Google Scholar] [CrossRef] [PubMed]
  40. Roy, B.; Goswami, P.; Sau, J.D. Continuous and discontinuous topological quantum phase transitions. Phys. Rev. B 2016, 94, 41101. [Google Scholar] [CrossRef]
  41. Juricic, V.; Abergel, D.S.L.; Balatsky, A.V. First-order quantum phase transition in three-dimensional topological band insulators. arXiv 2016. [Google Scholar]
  42. Wright, A.R.; McKenzie, R.H. Quantum oscillations and Berry’s phase in topological insulator surface states with broken particle-hole symmetry. Phys. Rev. B Condens. Matter Mater. Phys. 2013, 87, 85411. [Google Scholar] [CrossRef]
  43. Taskin, A.A.; Ando, Y. Berry phase of nonideal Dirac fermions in topological insulators. Phys. Rev. B Condens. Matter Mater. Phys. 2011, 84, 1–6. [Google Scholar] [CrossRef]
Figure 1. (a) rocksalt (space group Fm 3 ¯ m) crystal structure of Pb1−xSnxSe and Pb1−xSnxTe alloys; (b) schematic illustration of a topological phase transition in Pb1-xSnxSe and Pb1−xSnxTe systems, from topological trivial regime to topological non-trivial regime, occurring at a critical Sn concentration xc; (c) (001)- and (d) (111)-oriented 3D bulk Brillouin zones with respective 2D surface Brillouin zones shown on top. The Dirac cones corresponding to the (001) (c) and (111) (d) surfaces are also shown on each respective surface Brillouin zone.
Crystals 07 00029 g001
Figure 2. Illustration of the Fermi surface geometry. (a) Longitudinal bulk valley of IV–VI semiconductors is an ellipsoid with its major axis oriented parallel to the [111] direction. 2a is the minor axis of the ellipsoid and 2b is its major axis. A magnetic field will yield cyclotron motion on a plane perpendicular to the field. The section of the Fermi ellipsoid by this plane yields a circular 2D Fermi surface shown below the ellipsoid; (b) In the case of a [111] oblique valley, the ellipsoid is tilted by 70.5° with respect to the [111] direction and direction of the applied field. The 2D section is thus an ellipse; (c) In the case of (001)-oriented crystals with a magnetic field oriented parallel to the [001] direction, the ellipsoid is tilted by 53°, and the section also yields an ellipse.
Crystals 07 00029 g002
Figure 3. The equivalence between the Landau levels in the six-band k.p model used by Mitchell and Wallis and in the massive Dirac model that includes the far-band correction terms. The arrows show the interband transitions of the same energy in the Faraday geometry where the selection rules are ΔN = ±1 and Δσ = ±1.
Crystals 07 00029 g003
Figure 4. Infrared (IR) magneto-optical absorption measurement in Pb1−xSnxSe for x = 0.14. (a) Mid-IR and (b) Far-IR relative transmissions measured at high magnetic fields; (c) Landau levels dispersion and examples of Landau level interband transitions occurring in this system; and (d) Landau level transition diagram. Transitions in the bulk oblique and longitudinal valleys are represented by empty red and full black circles, respectively. All curve fits (red for oblique and black for longitudinal valleys) are obtained from a massive Dirac fermion model that includes far-band contributions. The green rectangle is the BaF2 substrate reststrahlen band where no transition can be observed.
Crystals 07 00029 g004
Figure 5. IR magneto-optical absorption measurement in Pb1−xSnxSe for x = 0.19. (a) MIR and (b) FIR relative transmissions measured at high magnetic fields; (c) examples of Landau level interband transitions and the ground state cyclotron resonance of the topological surface states (CR-TSS); and (d) Landau level transition diagram. Transitions in the bulk oblique and longitudinal valleys are represented by empty red and full black circles, respectively. Blue circles denote the CR-TSS. Curve fits for bulk band transitions (red for oblique and black for longitudinal valleys) are obtained from a massive Dirac fermion model that includes far-band contributions. The blue solid line is obtained from a massless Dirac model. The green rectangle is the BaF2 substrate reststrahlen band where no transition can be observed.
Crystals 07 00029 g005

