Article

Ionic Liquid Crystals Modifier for Selective Determination of Terazosin Antihypertensive Drug in Presence of Common Interference Compounds

1
Department of Chemistry, Faculty of Science, Cairo University, 12613 Giza, Egypt
2
Department of Chemistry, Faculty of Science, Kuwait University, Safat 13060, Kuwait
3
Forensic Chemistry Laboratory, Medico Legal Department, Ministry of Justice, 11341 Cairo, Egypt
*
Author to whom correspondence should be addressed.
Crystals 2017, 7(1), 27; https://doi.org/10.3390/cryst7010027
Submission received: 30 November 2016 / Revised: 1 January 2017 / Accepted: 12 January 2017 / Published: 20 January 2017
(This article belongs to the Section Liquid Crystals)

Abstract

:
Electrochemical sensor was fabricated based on carbon paste electrode modified with an ionic liquid crystal ILC (2-chloro-1,3-dimethyl-imidazolidinium hexafluorophosphate) in presence of sodium dodecyl sulfate for the selective electrochemical determination of Terazosin (TZ) in presence of common interference compounds. The electrode performance was compared in presence of other ionic liquids ILs (1-Butyl-4-methyl pyridinium tetrafluoroborate) and (1-n-Hexyl-3-methyl imidazolium tetrafluoroborate). Ultrasensitive determination of Terazosin HCl at the ILC modified electrode in the linear dynamic ranges of 0.002 to 0.09 μmol·L−1 and 0.2 to 30 μmol·L−1 with correlation coefficients 0.996 and 0.995 and LODs 1.69 × 10⁻¹¹ mol·L−1 and 6.43 × 10⁻⁹ mol·L−1, respectively, were obtained. Selective determination of TZ in presence of uric acid and ascorbic acid and simultaneous determination of binary mixtures of TZ/dopamine, TZ/paracetamol and TZ/Morphine were also determined successfully using the modified sensor.

1. Introduction

Terazosin hydrochloride (TZ), 2-[4-(2-tetrahydrofuranyl) carbonyl]-1-piperazinyl-6,7-di-methoxy-4-quinazolinamine monohydro-chloride dehydrate, an alpha-1-selective adrenoceptor blocking agent, is a quinazoline derivative which is used to treat hypertension (high blood pressure) [1,2] and for the treatment of symptoms of an enlarged prostate [3,4]. Several methods for determination of this drug have been reported in the literature, including high performance liquid chromatography [5,6,7,8,9,10,11,12,13,14,15,16], capillary zone electrophoresis [17], spectrofluorimetry [18,19], X-ray fluorescence spectrometry based on the formation of ion-pair associates with zinc thiocyanate [20] and voltammetric methods [19,20]. Electrochemical methods have received considerable interest due to their higher selectivity, lower detection limit, lower cost and faster operation than other reported methods [21,22]. Since the innovation of carbon paste electrodes (CPEs) by Adams, they have been widely used in many fields such as voltammetry, amperometry and potentiometry [23].
Carbon paste electrode (CPE) is of particular importance. The ease and speed of preparation and of obtaining a new reproducible surface, low residual current, porous surface, and low cost of carbon paste are some advantages of CPE over all other carbon electrodes [23,24,25,26].
Ionic liquid crystals (ILCs) are liquid crystals composed of salts of cations and their counterpart anions [27]. These materials possess the properties of ionic liquids (ILs) [28,29,30,31] and liquid crystals (LCs). One of the most promising features of ILCs is ionic conductivity. They are a new class of solvent, and are ionic compounds with relatively low melting points. Liquid crystals are soft materials which are considered as the fourth state of matter between solid and liquid. The modified carbon paste ionic liquid electrodes (CPILEs) shows high conductivity and electron transfer rate, wide electrochemical window and low over potentials [32,33,34,35] and very good electro-catalytic activities towards determination of many probes in electrochemistry [36], gas and liquid chromatography [37], mass spectrometry [38], capillary electrophoresis [39] and sensors [40,41,42,43,44,45,46,47]. Ionic liquid crystals also display uncommon mesophases such as the nematic columnar phase. Worldwide intense research activity in the field of ionic liquids is presently ongoing [48,49,50,51,52,53,54,55]. Aligned samples of ionic liquid crystals show pronounced anisotropic ion conduction and are of interest as low-dimensional ion-conductive materials [56]. Atta and co-workers constructed electrochemical sensors based on ionic liquid crystal modified carbon paste electrode for the sensitive determination of enoxacin antibacterial drug [57], benazepril hydrochloride antihypertensive drug [58] and neurotransmitters [59].
On the other hand, surfactants modified electrodes exhibited high impact in electrochemistry by improving the electrode/solution interface properties [60,61,62,63]. Surfactants are amphiphilic molecules that contained hydrophilic head on one side and a hydrophobic tail. Furthermore, surfactants can enhance the electrochemical signal of the electroactive species in electroanalysis and electrochemical sensing [64,65] via different approaches such as acting as masking agent [66], Aggregation at the electrode/solution interface forming supramolecules structure [67,68], solubility of organic compounds via micelles formation, providing definite orientation of the molecules at the electrode surface and enhancing the preconcentration/accumulation of the analyte at the electrode surface [68]. Therefore, the addition of surfactants resulted in improvement of the electrode/solution interface properties, enhancement of current response, sensitivity and selectivity and affecting greatly the redox potential and diffusion and charge transfer coefficients of the electrode processes [65,66,67,69]. Various modified electrodes for drug determination in presence of surfactants were presented in the literature [62,63,64,65,66,67,68,69,70,71,72].
This study presents for the first time a sensitive sensor based on carbon paste electrode in situ modified with ILC(2-chloro-1,3-dimethyl-imidazolidinium hexafluorophosphate) for the electrochemical determination of TZ in the presence of surface active agent. This work combined the effect of ILC in enhancing the conductivity with the effect of sodium dodecyl sulfate (SDS) to facilitate the preconcentartion/accumulation of TZ drug at the electrode surface. As a result, greater electro-catalytic activity, higher sensitivity and better selectivity were achieved at the proposed sensor for TZ determination compared to other electrodes. In addition, other ionic liquids were investigated for the electro-catalytic determination of TZ. Higher conductivity and greater electro-catalytic activity were obtained in case of ILC modified electrode compared to the other ionic liquids modified electrodes namely (1-butyl-4-methyl pyridinium tetrafluoroborate) and (1-n-hexyl-3-methyl imidazolium tetrafluoroborate). Simultaneous determinations of TZ with morphine (MO), paracetamol (APAP) and dopamine (DA) in binary mixtures were achieved with good separation. On the other hand, this sensor shows anti-interference ability; it can simultaneously determine TZ with good current response in presence of large amount of ascorbic acid and uric acid. In addition, the determination of TZ in spiked urine samples is achieved with good reproducibility and excellent recovery results demonstrating the validity of this method for real sample analysis at the proposed electrode.

2. Experimental

2.1. Materials and Reagents

Terazosin hydrochloride (TZ) was obtained from Forensic Chemistry Laboratory. Graphite powder (<20 µm, synthetic), paraffin oil, ionic liquid crystal (2-chloro-1,3-dimethyl-imidazolidinium hexafluorophosphate), ionic liquids (1-Butyl-4-methyl pyridinium tetrafluoroborate), (1-n-Hexyl-3-methyl imidazolium tetrafluoroborate), sodium dodecyl sulfate (SDS), uric acid (UA), dopamine (DA), ascorbic acid (AA), paracetamol (APAP), potassium phosphate (mono, di-basic salt), potassium hydroxide (KOH) were purchased from Sigma-Aldrich Chemicals Co. (Milwaukee, WI, USA). Morphine sulfate (MO) was supplied from Forensic Chemistry Laboratory, Medico Legal Department, Ministry of Justice, Cairo, Egypt. Phosphate buffer solution PBS (1.0 mol·L−1 K2HPO4 and 1.0 mol·L−1 KH2PO4) of pH 7–11 was used as the supporting electrolyte. The pH was adjusted using suitable amounts of 0.1 mol·L−1 H3PO4 and 0.1 mol·L−1 KOH.

2.2. Electrochemical Cell and Equipment

Electrochemical studies were carried out using a three-electrode/one compartment glass cell. The working electrode was modified CPE. The auxiliary electrode was a 10 cm long/2.0 mm diameter Pt wire. All the potentials in the electrochemical studies were referenced to Ag/AgCl (4 mol·L−1 KCl saturated with AgCl) electrode. Prior to immersion in the cell, the electrode surface was thoroughly rinsed with distilled water and dried. All experiments were performed at 25 °C ± 0.2 °C. The electrochemical characterization of electrodes was performed using a BAS-100B electrochemical analyzer (Bioanalytical Systems, BAS, West Lafayette, IN, USA). The electrochemical impedance spectroscopy was performed using a Volta lab PGZ 301 (Radiometer, Neuilly-Plaisance, France). The data analysis software was supplied with the instrument and applied non-linear least-squares fitting with a Levenberg–Marquardt algorithm. All impedance experiments were recorded between 0.1 Hz and 100 kHz with an excitation signal of 10 mV amplitude. The measurements were performed under potentiostatic control at certain potential value which was decided from the recorded cyclic voltammograms (874 mV for TZ). Quanta FEG 250 instrument (FEI, Hillsboro, OR, USA) was used to obtain the scanning electron micrographs of the different films (accelerating voltage was 20 keV).

2.3. Preparation of Carbon Paste Electrode (CPE)

The electrode was prepared by mixing graphite powder (0.5 g) with paraffin oil (0.3 mL) in a glass mortar. The carbon paste was packed into the hole of the electrode body and smoothed on a filter paper until its shiny appearance.

2.4. Preparation of Working Electrode (ILCCPE)

Modification of carbon paste electrode with ionic liquid crystal (2-cloro-1,3-dimethyl imidazolidinium hexafluorophosphate) was prepared by mixing 0.5 g ILC, 1.5 g of graphite powder, with 0.5 mL of paraffin oil in a mortar with a pestle to form a homogeneous paste (ILCCPE). Then, the resulting paste was packed firmly in the hole of the electrode body, and the electrode was rinsed with water to remove any unadsorbed modifier and dried in air at room temperature. The two other ionic liquid modified carbon paste electrodes, (IL1CPE) and (IL2CPE), were prepared by the same way, by mixing Ionic liquids (ILs) (1-n-hexyl-3-methyl imidazolium tetrafluoroborate) or (1-Butyl-4-methyl pyridinium tetrafluoroborate) to graphite powder/with a ratio of 1% (w/w). The modification of the surface of the electrode was achieved by the addition of increments of 10 µL from a stock of SDS (0.1 mol·L−1).

2.5. Analysis of Urine

The utilization of the proposed method in real sample analysis was also investigated by direct analysis of human urine samples spiked with (TZ). Urine sample used for detection was diluted 400 times with 0.1 mol·L−1 PBS/pH 7.4 to reduce the matrix effect of real samples. TZ was dissolved in 0.1 mol·L−1 PBS/pH 7.40 to make a stock solution with 1 mmol·L−1 concentration. Standard additions were carried out from the TZ stock solution in 15 mL of diluted urine.

3. Results and Discussion

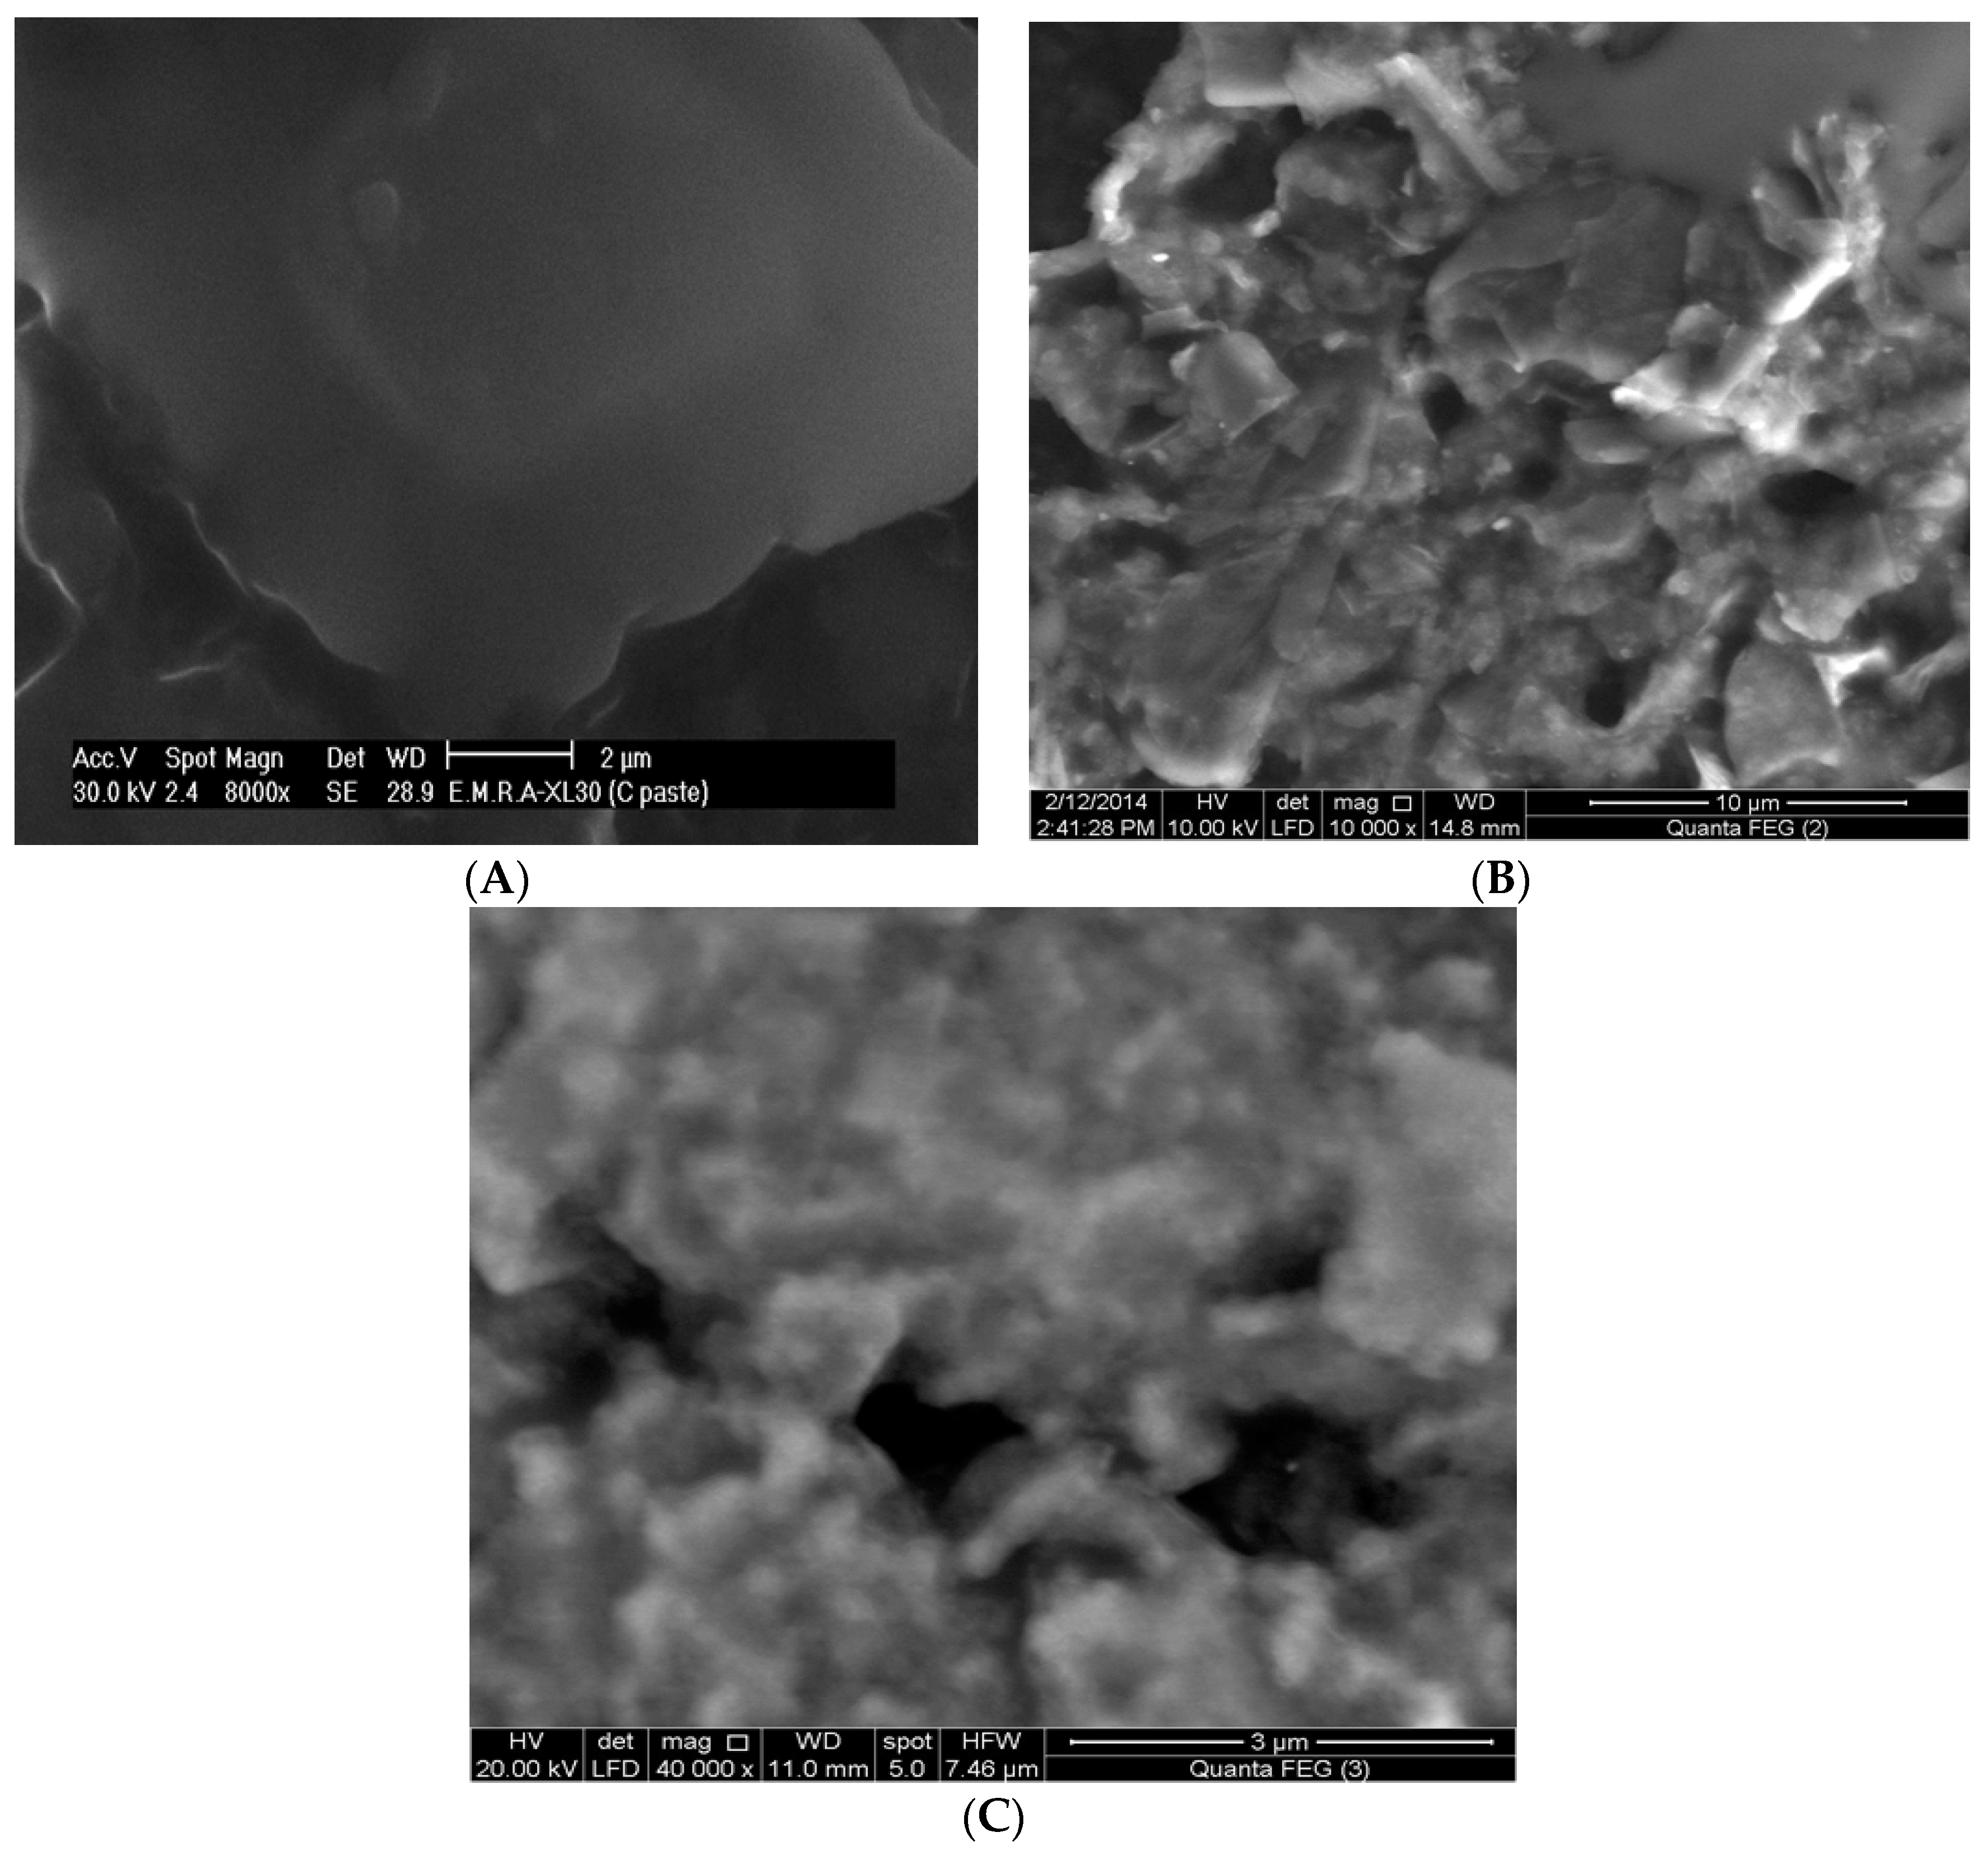
3.1. Morphology Study

The surface morphology of the proposed sensor affected greatly the effectiveness and the catalytic performance toward TZ oxidation. Figure 1A–C shows the SEM of CPE, ILCCPE and ILCCPE…SDS, respectively. The SEM of bare CPE showed separated irregular graphite flakes (Figure 1A). Upon modification with ILC, blurry shape with greater surface area was obtained (Figure 1B). The moderate viscosity and good conductivity of the ILC facilitated its distribution into the void spaces between the graphite flakes and enhanced its dispersion with the graphite powder paste [58,59]. The penetration of the highly conductive ILC between the graphite flakes affected greatly the conductivity of the paste and also resulted in more ordered films inside the paste due to the solid state structure of ILC and its molecular orientation ordering characteristic [27,73,74]. Therefore, the ILC showed two main roles as a binder and a bridge or ions carrier between the graphite flakes enhancing the conductivity of the film. In the presence of SDS, spongy films of SDS were assembled on the surface of the electrode (Figure 1C). These films resulted in the facilitation of the preconcentration/accumulation of TZ drug on the surface and mediation of electron transfer kinetics.

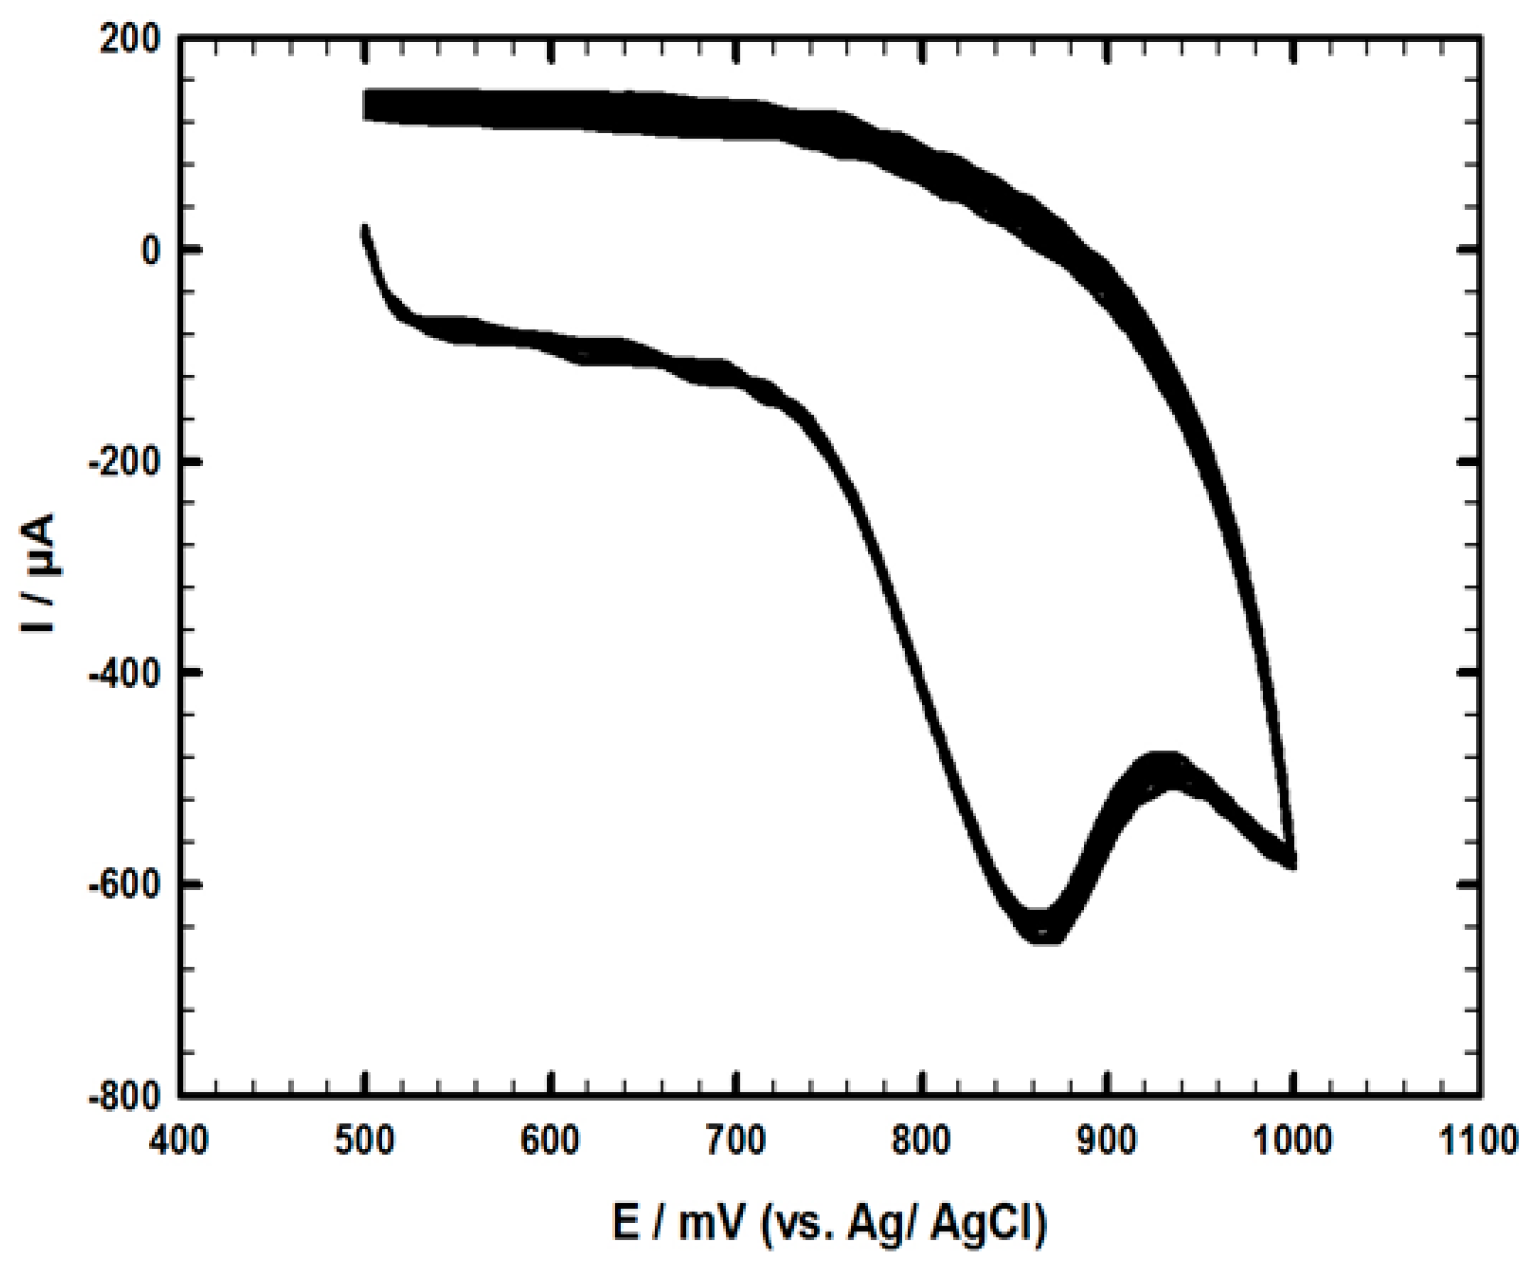
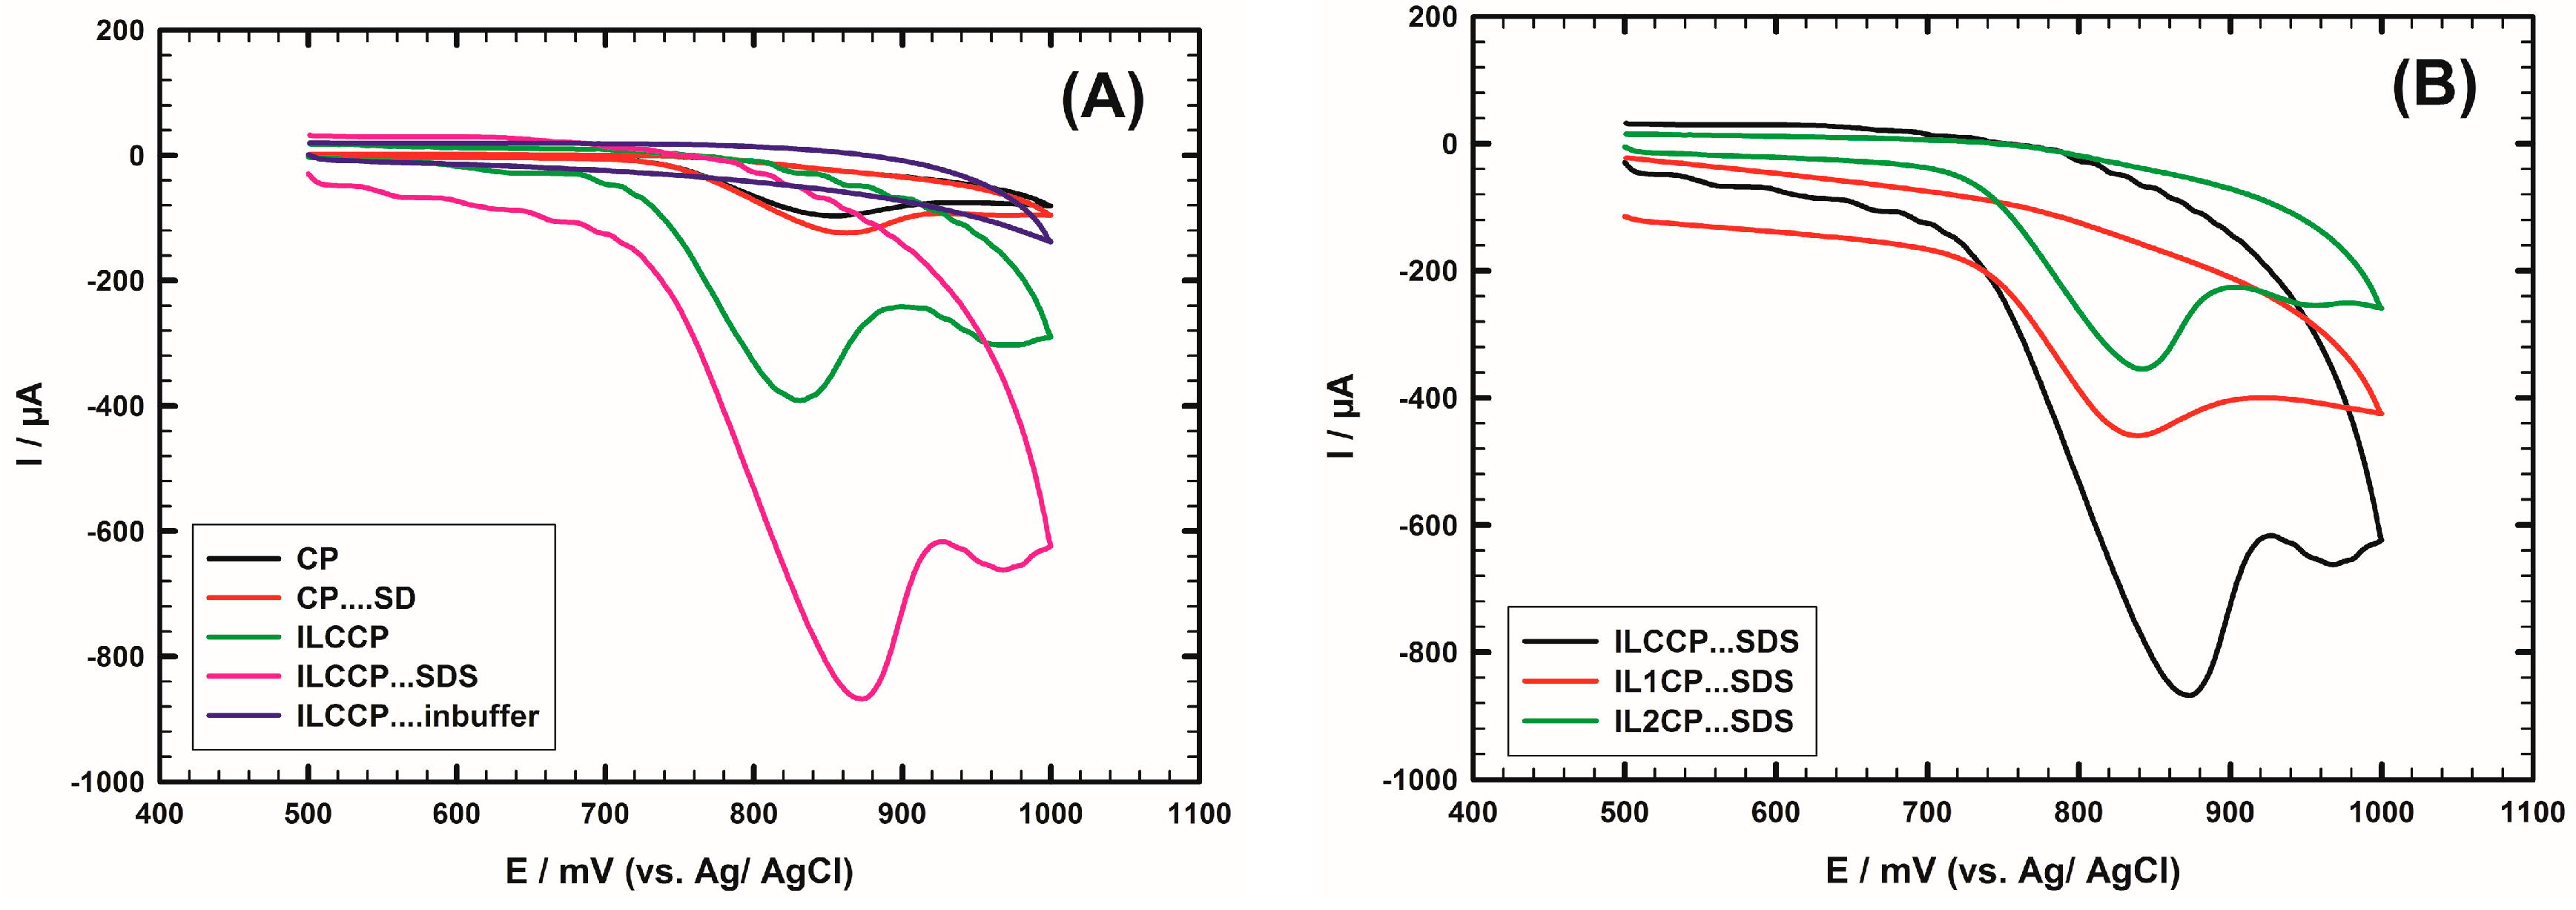
3.2. Comparison between Different Modified Electrodes

The electrochemistry of 1 mmol·L−1 TZ/0.1 mol·L−1 PBS/pH 7.4 was investigated at different modified electrodes; CPE, CPE…SDS, IL1CPE…SDS, IL2CPE…SDS, ILCCPE and ILCCPE…SDS at scan rate 50 mV·s−1 using cyclic voltammetry in potential window 500 to 1000 mV (Figure 2A,B). The anodic peak currents for electrochemical oxidation of TZ at CPE and CPE...SDS were 86 μA and 120 μA, respectively, at oxidation potentials 850 mV and 863 mV, respectively. The higher anodic peak current at CPE…SDS was noticed due to the presence of SDS which has a great effect for enhancing the preconcentration of TZ species in the ionic form at the surface. This causes an improvement in the electron transfer process and enhancement in the electrochemical oxidation reaction of TZ. To illustrate the effect of different types of ionic liquids in presence of SDS, electrochemical oxidation of TZ was examined using cyclic voltammetry at IL1CPE…SDS and IL2CPE…SDS; the oxidation peak currents were 319 μA and 290 μA at 842 mV and 839 mV, respectively (Table 1). For ILCCPE…SDS, the anodic peak current was 707 μA at 874 mV. The oxidation peak current increased at the modified electrode ILCCPE…SDS; the shift in oxidation potential results from the “ohmic” drop due to SDS adsorption on the surface.
Certain ionic materials are also known to form amphitropic liquid crystals, where the positive charge is localized on the nitrogen atom of imidazolidinium salts, which lead to wider electrochemical potential window than for imidazolium and pyridinium salts at which the positive charge is delocalized over the aromatic ring, and the solid state structure of the ionic liquid crystal helps in the formation of ordered films [75,76]. Furthermore, the pKa of TZ is 7.1, therefore it is positively charged at the working pH (7.40) [23]. SDS can be adsorbed on the electrode surface forming a layer with highly dense negatively charged ends pointed outside the electrode. As a result, electrostatic interactions between the positively charged TZ drug and the anionic SDS facilitated the preconcentration/aggregation of the drug at the electrode surface and enhanced the current signal of TZ at the proposed sensor. Therefore, a synergistic effect was explored by the presence of high ionic conductive and polarizable ILC with the surface active agent SDS. All these catalytic modifiers combined with each other to facilitate the electron transfer rate of TZ drug at the proposed sensor.

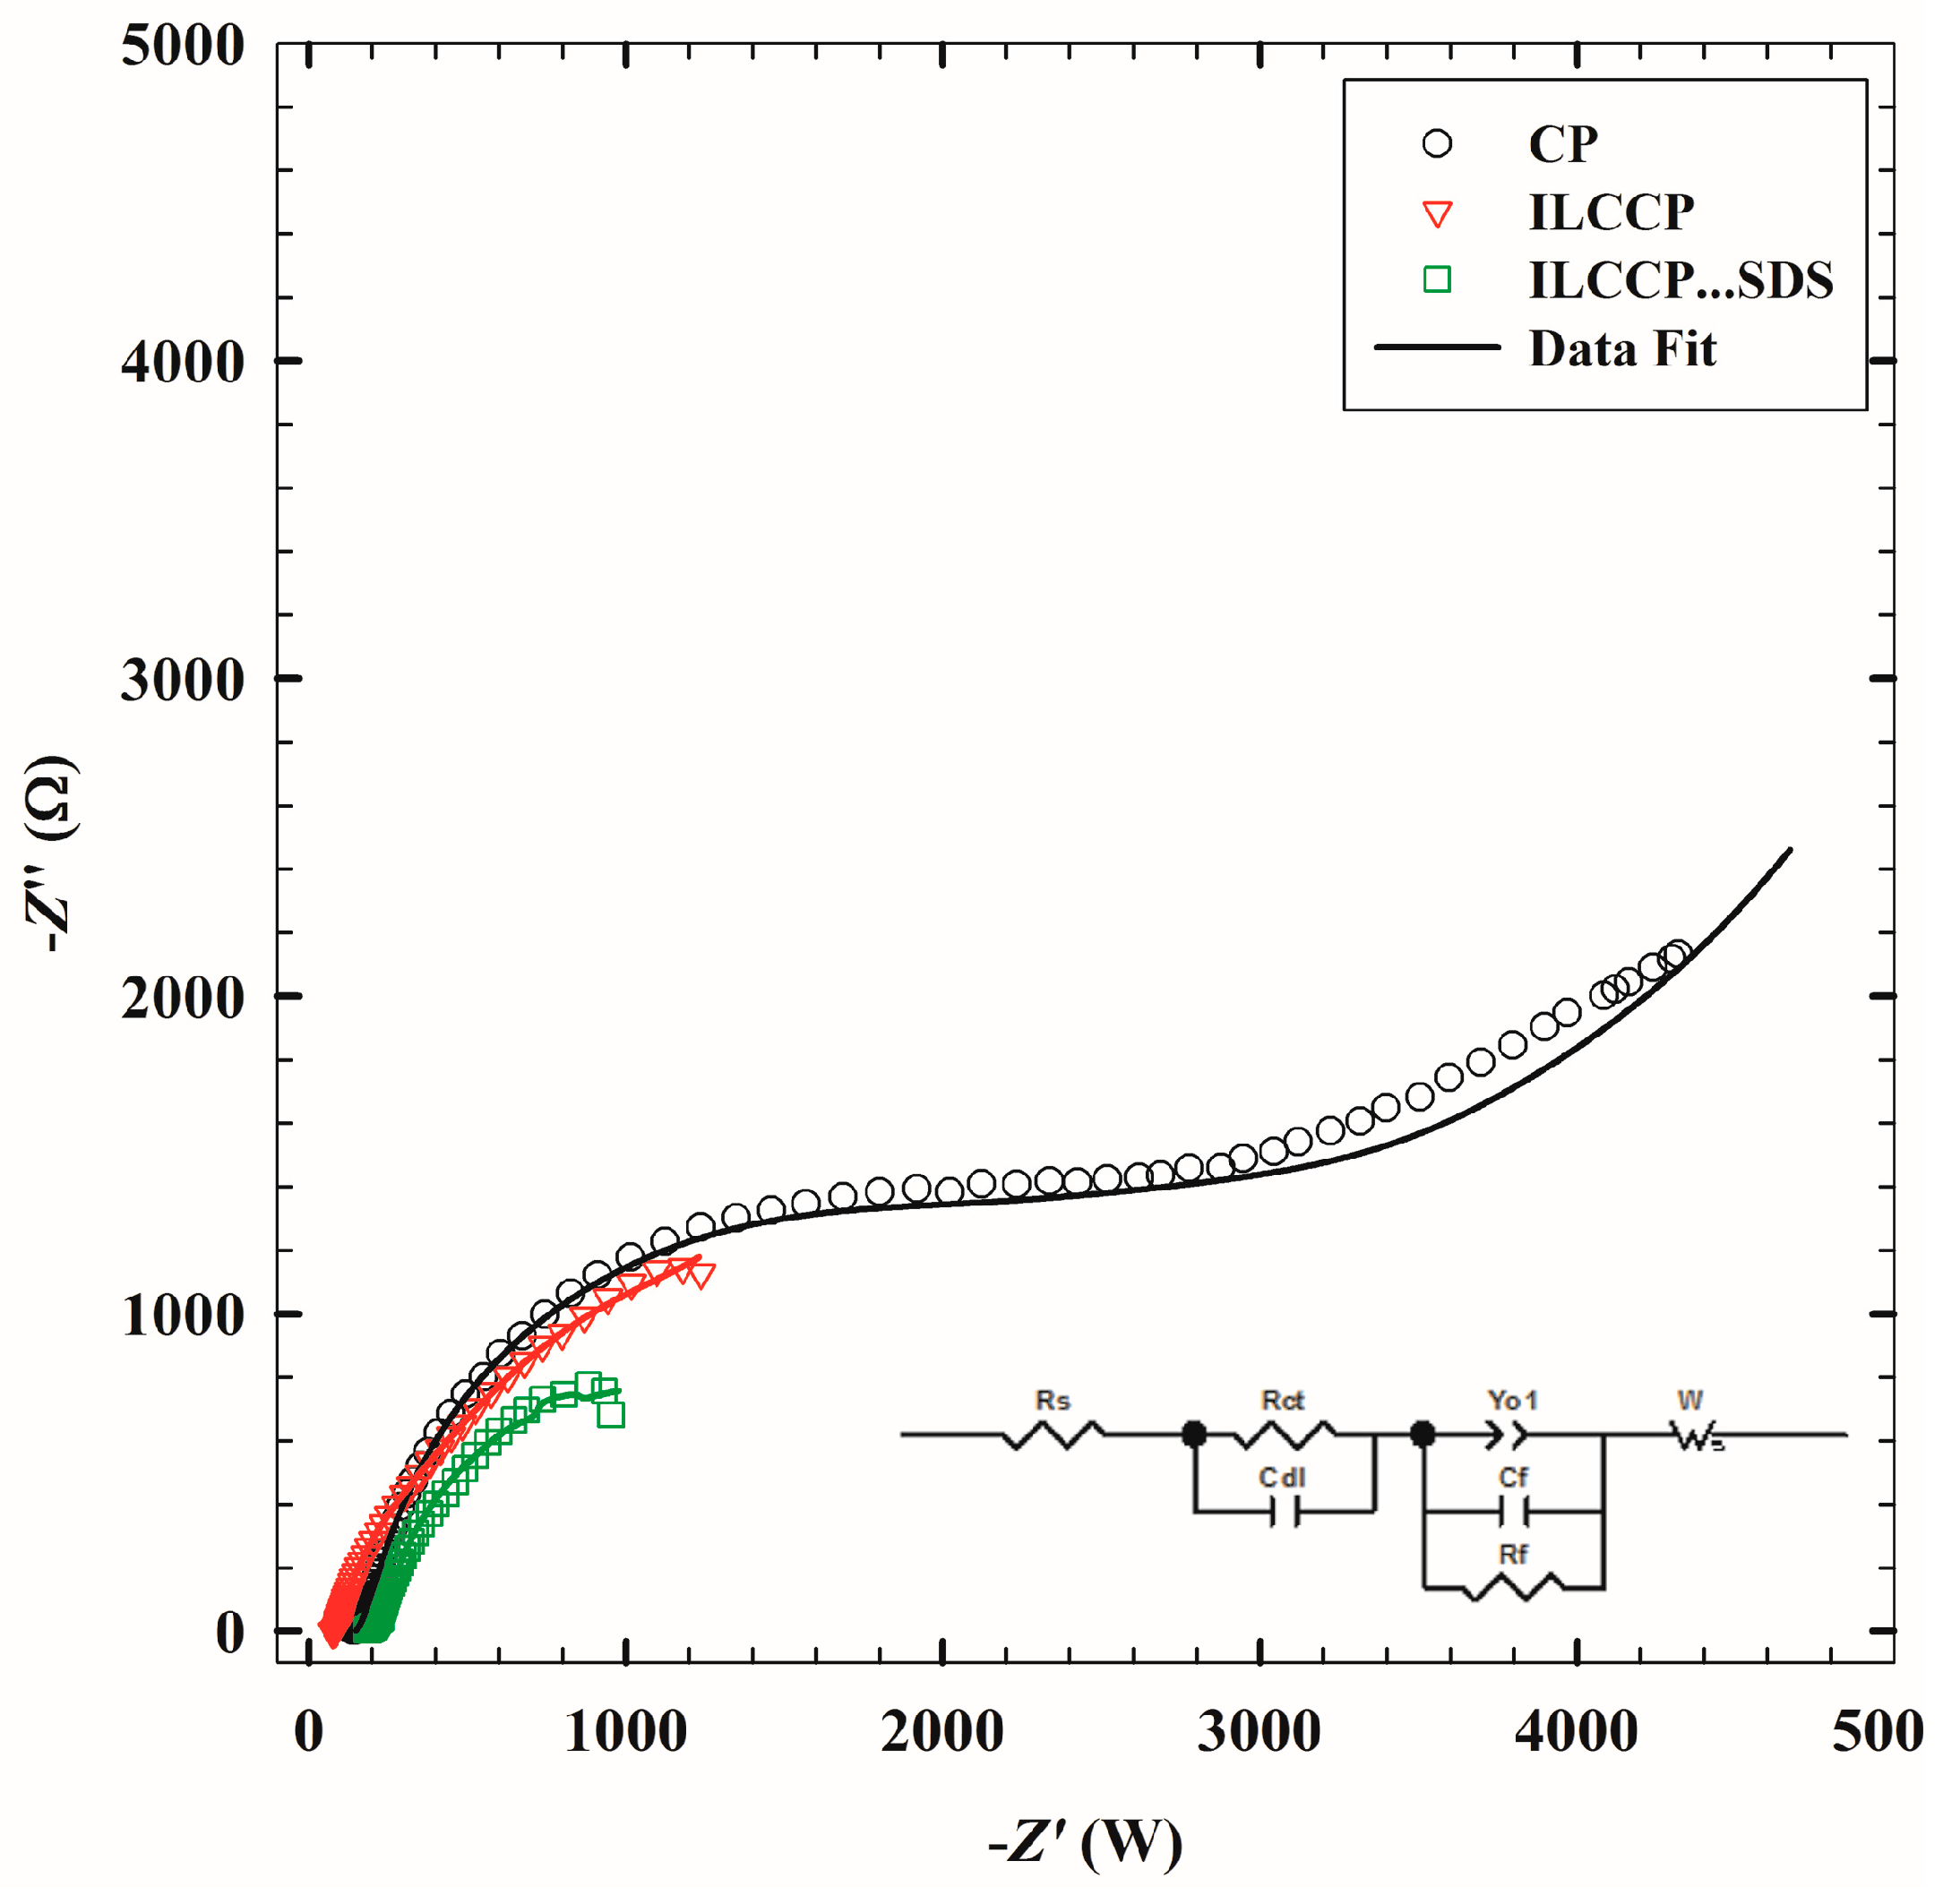
3.3. Electrochemical Impedance Spectroscopy

EIS is an effective tool for studying the interface properties of surface modified electrodes. EIS data were obtained at CPE and ILCCPE…SDS surfaces in 1 mmol·L−1 TZ/0.1 mol·L−1 PBS/pH 7.4 at ac frequency varying between 0.1 Hz and 100 kHz with an applied potential in the region corresponding to the electrolytic oxidation of TZ in PBS buffer pH 7.4. Figure 3 shows a typical impedance spectrum presented in the form of Nyquist plot of TZ at the two electrodes. From this comparison, it is clear that the impedance of TZ responses show a great difference in the presence of ionic liquid crystal compared to CPE. In the case of ILCCPE…SDS, the charge transfer resistance of electro-oxidation of TZ decreases noticeably and the charge transfer rate is enhanced indicating the catalytic properties of the proposed sensor. The Nyquist plot is characterized by two time constants: the first at the high frequency range is represented by an incomplete quasi-semicircle; the second represents resistive characteristics of the film components interfaces and a diffusional element. It is established that the semicircle diameter in the impedance spectrum equals to electron transfer resistance Rct, this resistance controls the electron transfer kinetics of drug at the electrode interface. Therefore, Rct can be used to describe the interface properties of the electrode. To obtain detailed information from the impedance spectroscopy, a simple equivalent circuit model in Figure 3 inset was used to fit the results. The average error of the fits for the mean error of modulus was χ2 = 1.77 × 10⁻³ and average weighed sum of squares equal to 0.302. The experimental data are compared to an “equivalent circuit” given in the inset of Figure 3. In this circuit, Rs is the solution resistance, Rct is the charge transfer resistance, Cdl is the double layer capacitance, Yo1 is a constant phase element that represents the surface roughness at the interface while n is its corresponding exponent, Rf and Cf is the internal film resistance and its capacitance, and W is the impedance created due to diffusion.
Table 2 lists the best fitting values calculated from the equivalent circuit for the impedance data. ILCCPE…SDS electrode shows enhanced values of the interfacial capacitance component with respect to Yo1. This is attributed to more conducting character of the surface due to ionic adsorption at the electrode surface and the faster charge transfer process. The decrease in the interfacial electron transfer resistance Rct is attributed to the selective interaction between modified sensor and the drug and the good ionic conductivity of the ILC that resulted in the observed increase in the current signal for the electro-oxidation.

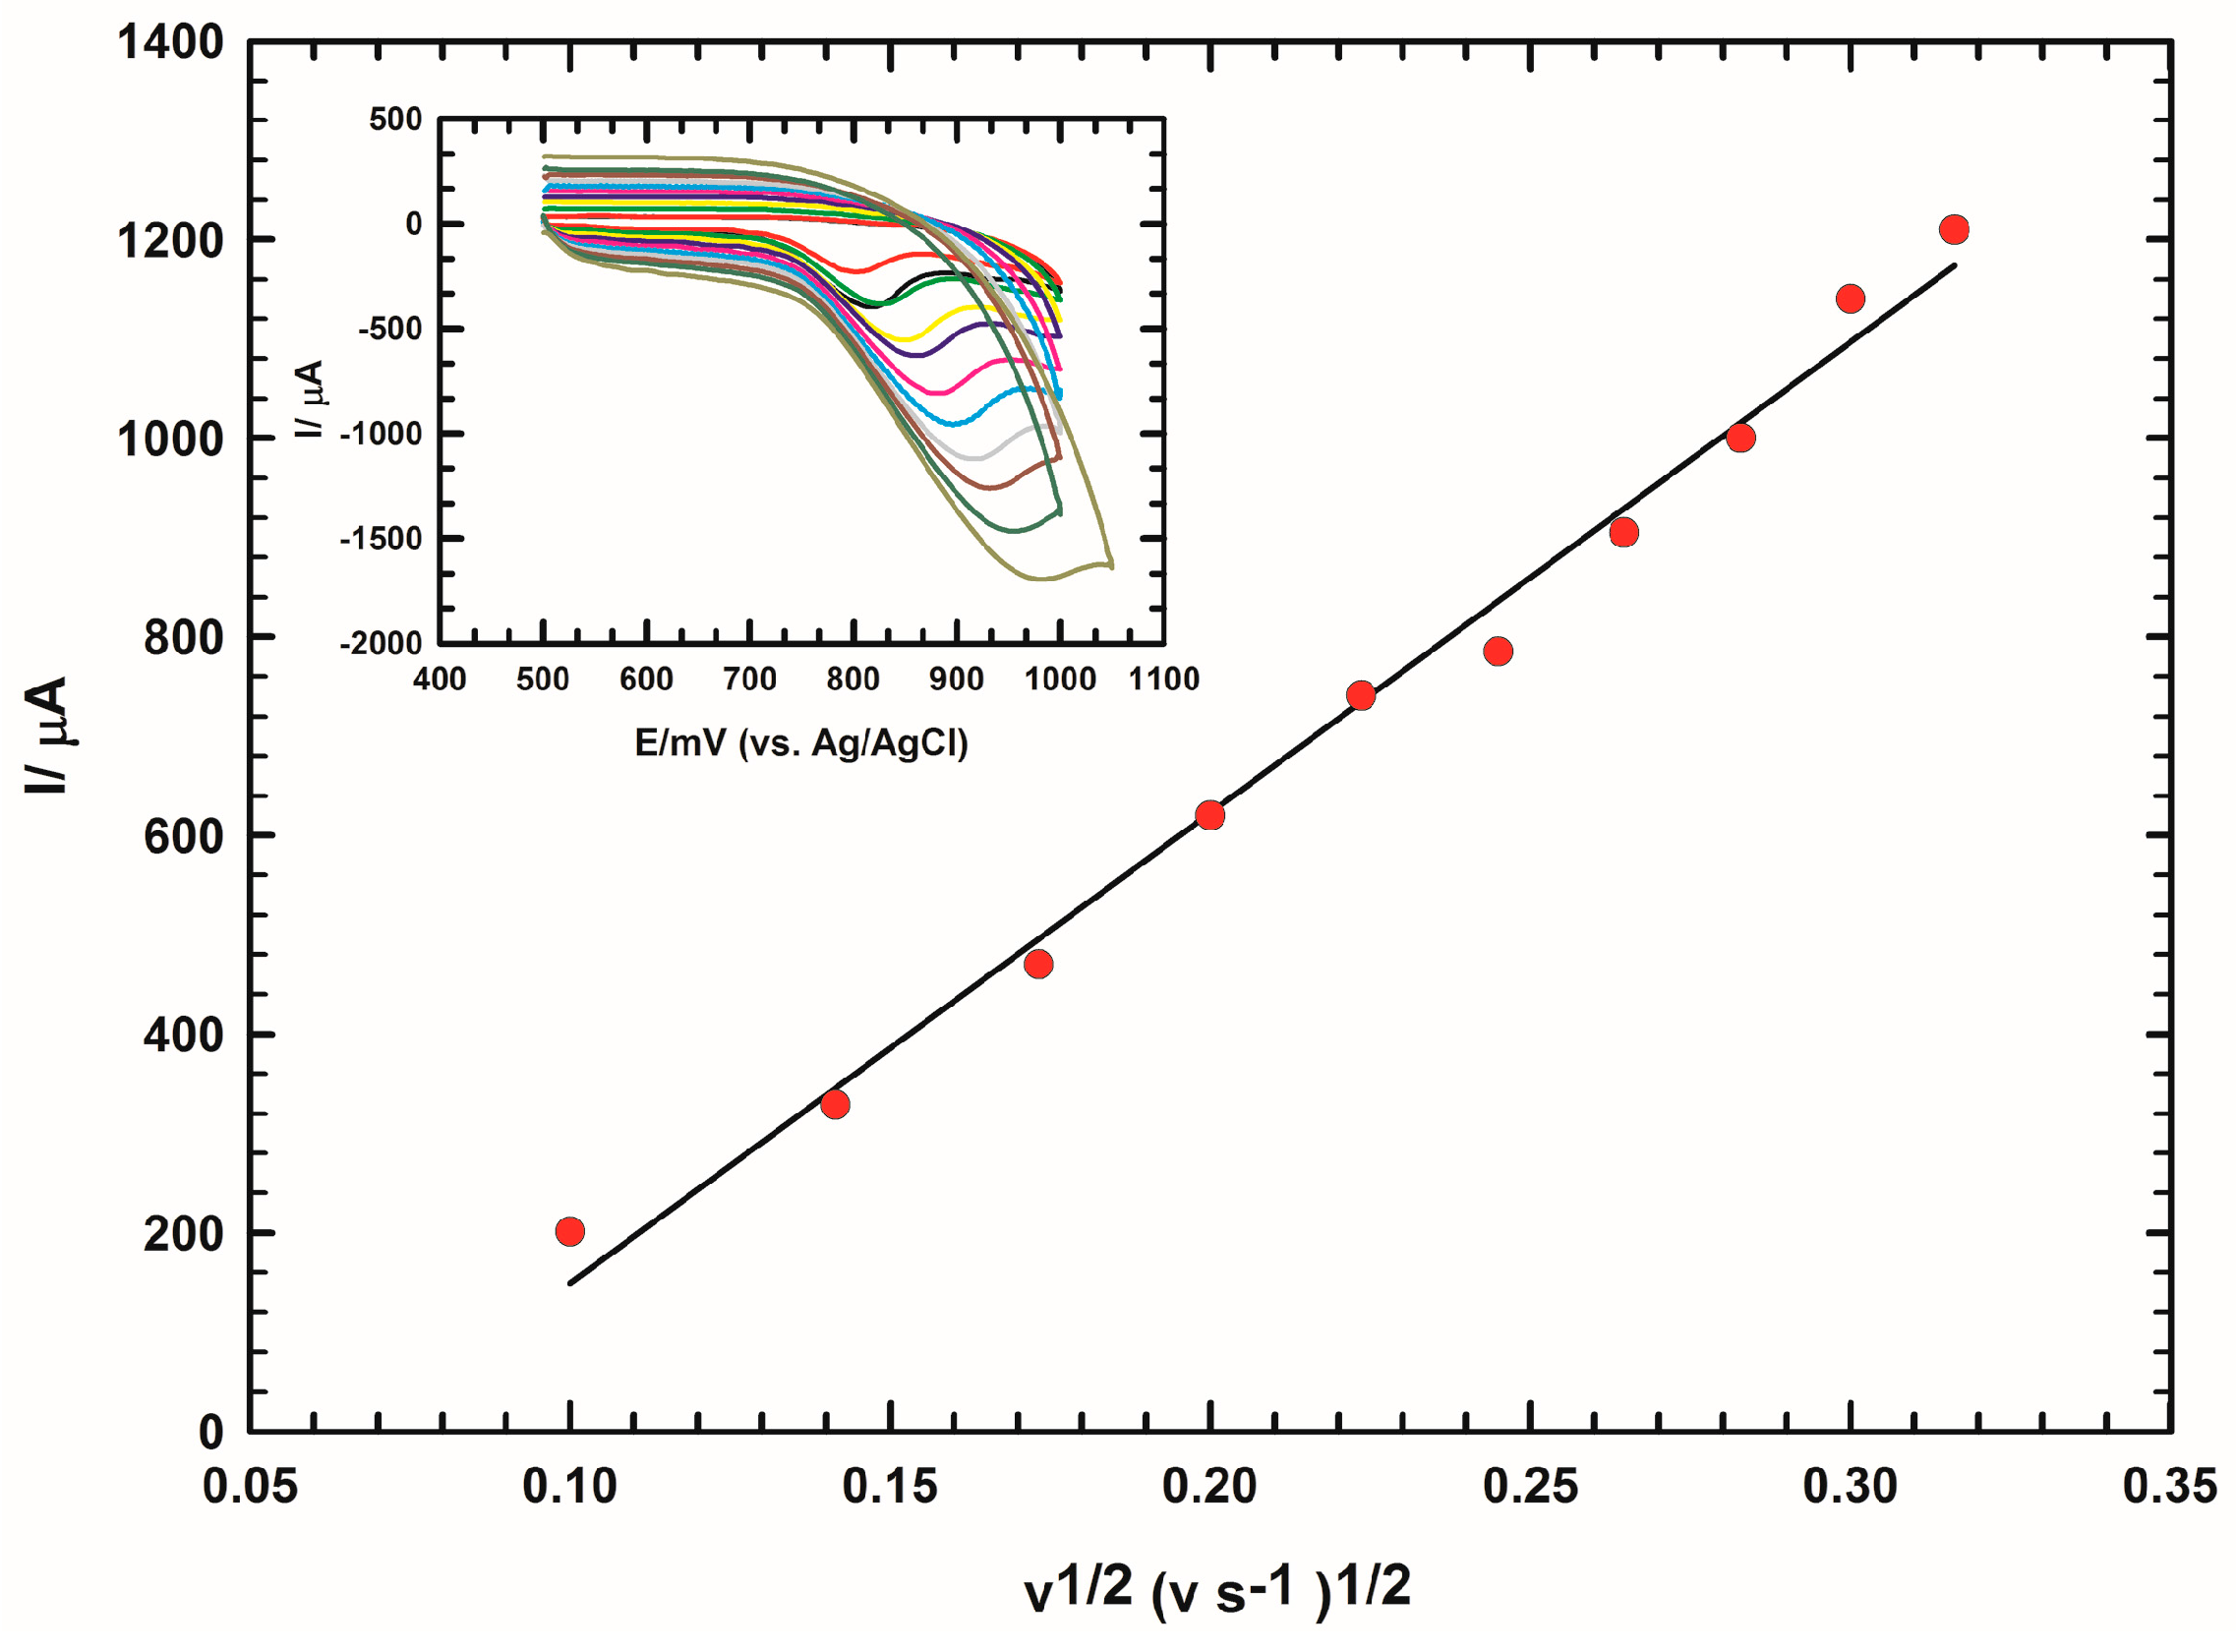
3.4. Effect of Scan Rate
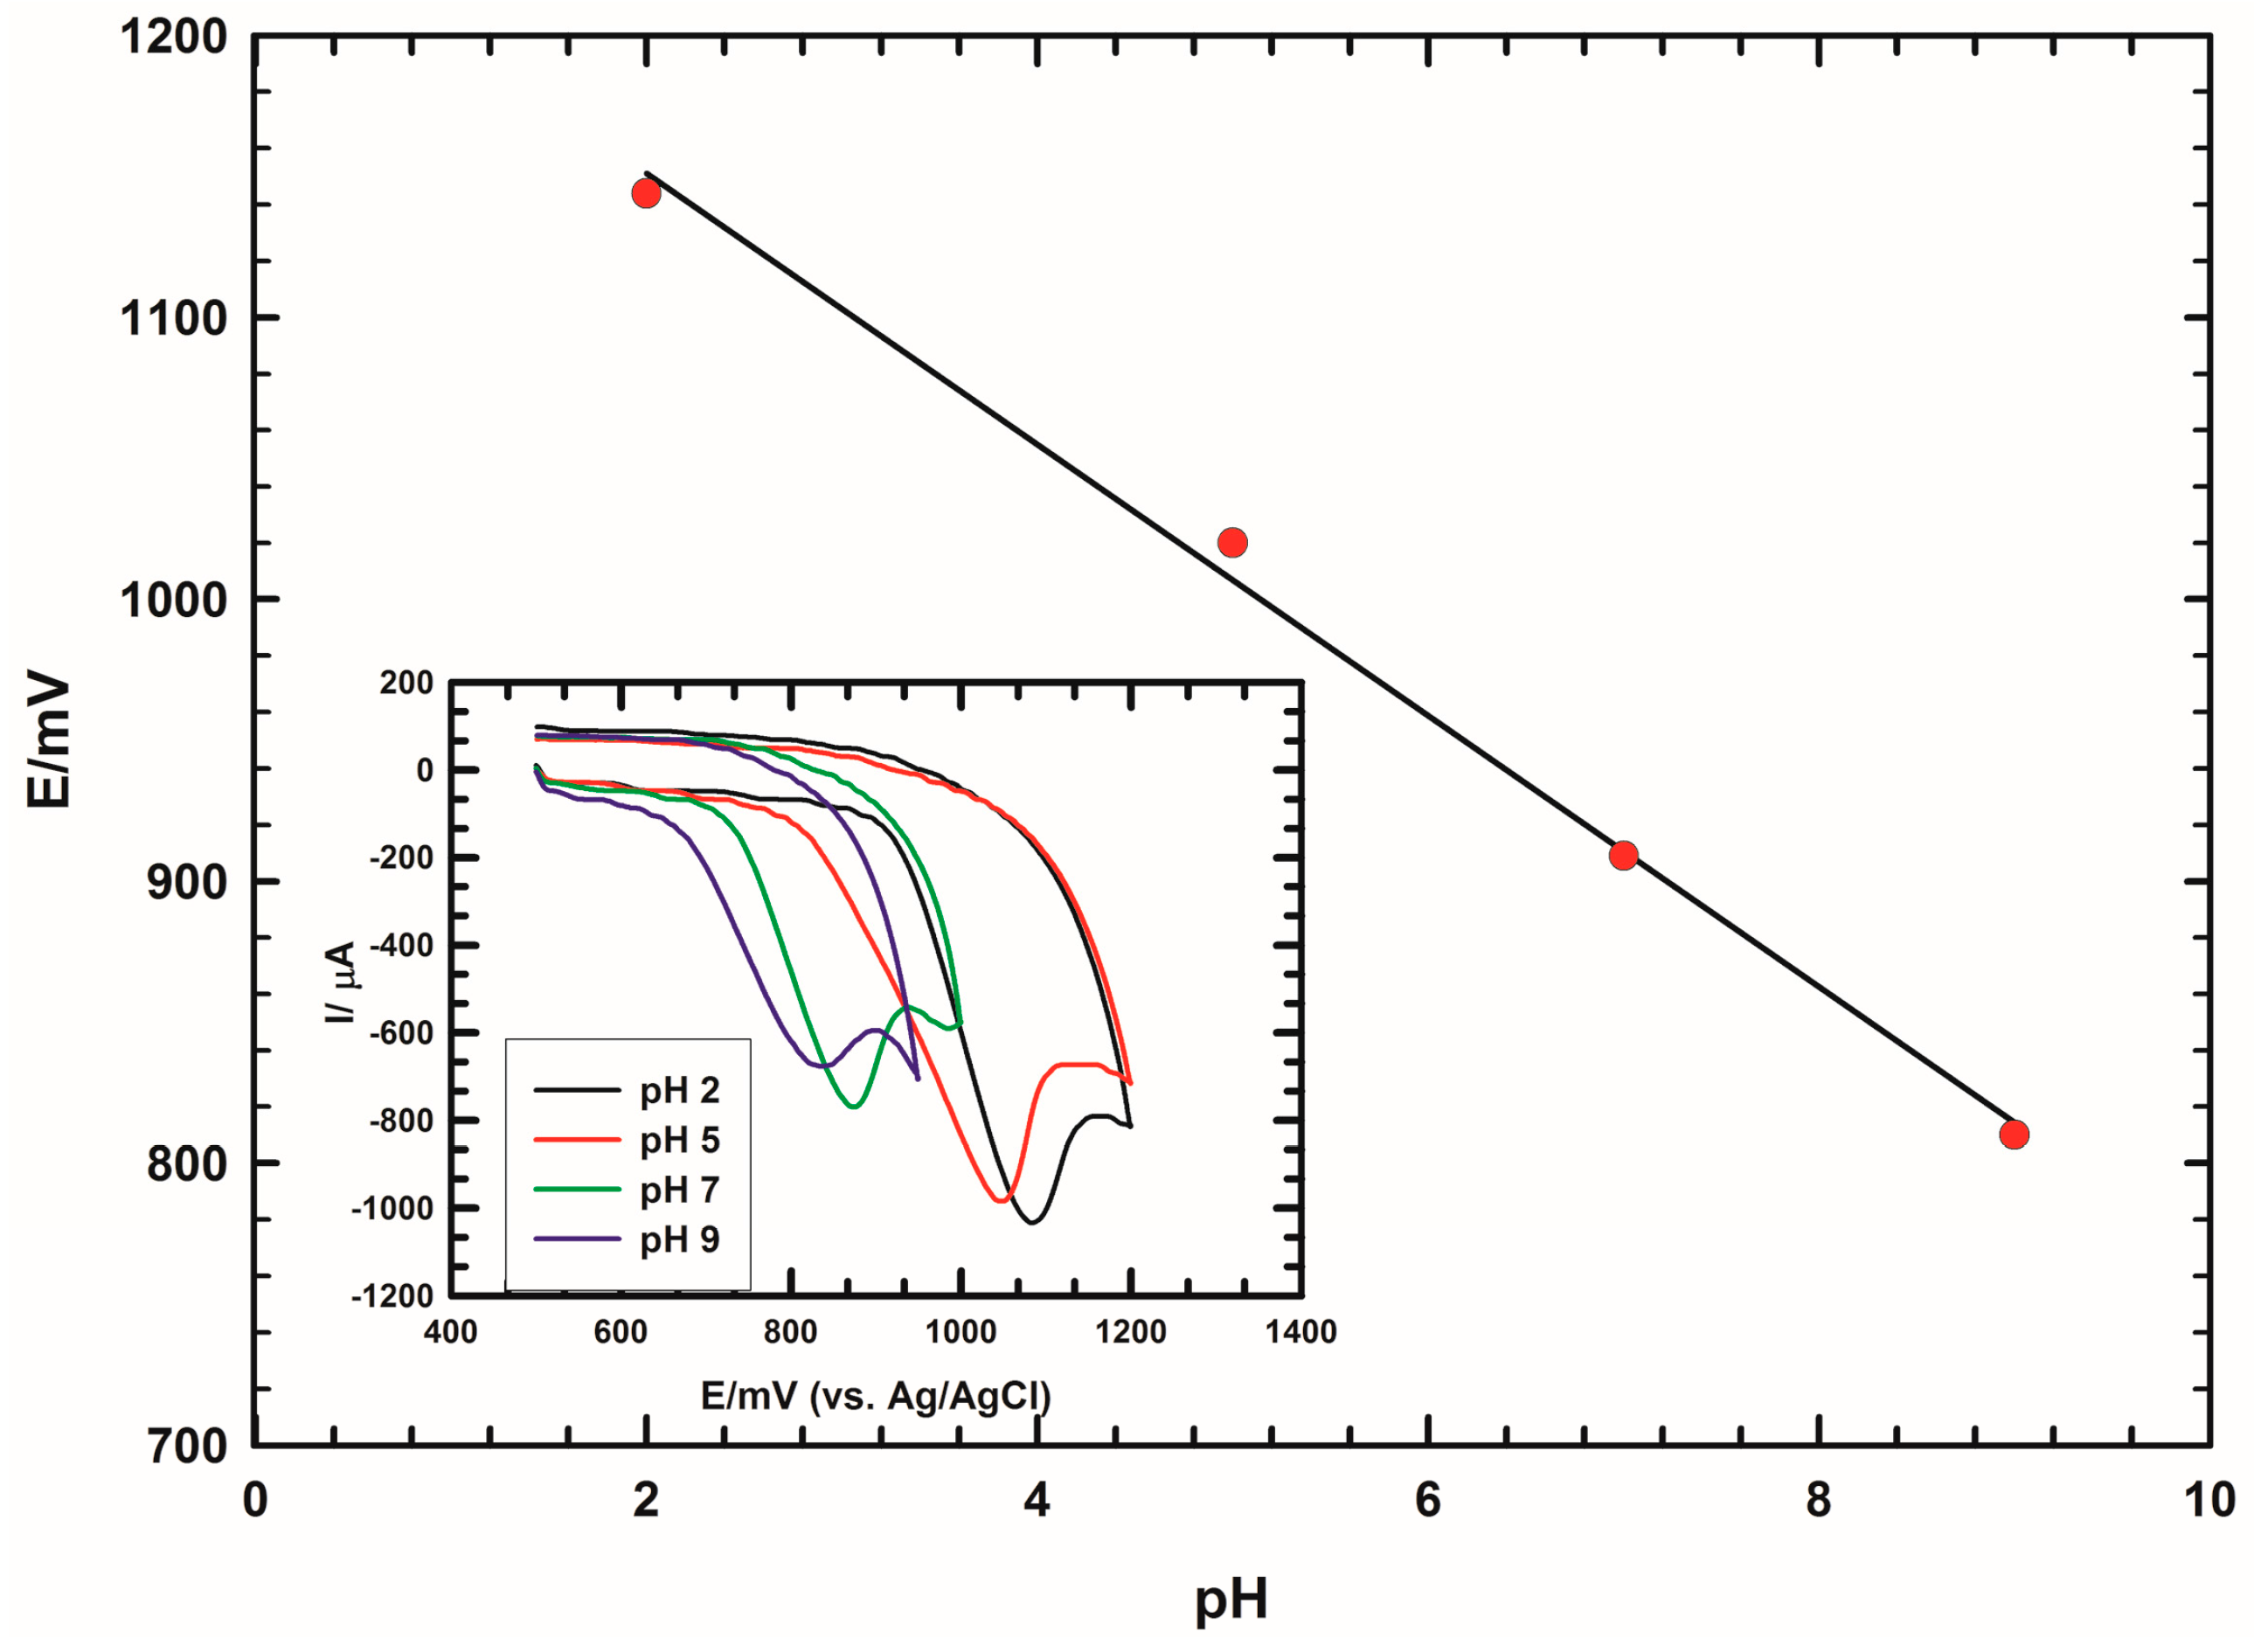
One of the most important factors affecting the performance of the proposed sensor is its response under the effect of different scan rates. Figure 4 shows the cyclic voltammetry studies of 1 mmol·L−1 TZ/0.1 mol·L−1 PBS/pH 7.4 at ILCCPE…SDS at different scan rates from 10 to 100 mV·s−1. By increasing the scan rate, the oxidation peak current of TZ increased and the oxidation potential was shifted to more positive value. For irreversible processes, the rate of electron transfer is smaller than the rate of mass transport at all potentials, and the peak potential will increase with the scan rate. Peak potential is also related to other parameters such as symmetry factor (α) that describes the difference between charge transfer kinetics for forward and reverse processes; this is described according to the following equation:
E p = E 0 R T α n a F [ 0.78 + n ( D 1 / 2 k 0 ) + n ( α n a F ν R T ) 1 / 2 ]
Moreover, the inset of Figure 4 shows the linear relation between the anodic peak current (Ipa, A) and the square root of the scan rate proving that the electro-oxidation of TZ in the studied scan rate range was diffusion-controlled process. Moreover, this relation was represented via Randles Sevcik Equation (1) which can be used to estimate the “apparent” diffusion coefficient (Dapp, cm2·s−1) of TZ.
Ipa = (2.99 × 10⁵n·(na·α)1/2·A·C0·D1/2·υ1/2
In this equation, n is the total number of electrons exchanged in the oxidation and na is the number of electrons in the rate determining step at T = 298 K, A is the electroactive area = 0.312 cm2, C0 is the analyte concentration (1 × 10⁻⁶ mol·cm−3) and υ is the scan rate V·s−1. Dapp values were 0.424 × 10⁻⁵, 0.827 × 10⁻⁵, 4.64 × 10⁻⁵ cm2·s−1 and 28.7 × 10⁻⁵ cm2·s−1 at CPE, CPE…SDS, ILCCPE and ILCCPE…SDS, respectively. This indicated the quick mass transfer of the analyte molecules towards ILCCPE…SDS surface from bulk solution and/or fast electron transfer process of electrochemical oxidation of the TZ molecule at the electrode-solution interface.

3.5. pH Effect

The pH effect of the PBS, supporting electrolyte, on the voltammetry response of ILCCPE…SDS toward TZ drug was investigated. The reported pKa value of terazosin is 7.1 [76]. The pH effect was studied for TZ at ILCCPE…SDS electrode in the pH range (2–11) as shown in Figure 5. The results indicated that no observed peak of TZ oxidation was achieved above pH 9 indicating that changing the pH of the supporting electrolyte affected remarkably the oxidation process. Because protons take part in the electrochemical oxidation of TZ, the peak current and peak potential are affected by the pH of the working solution. The anodic peak current of TZ decreased as pH increased. The higher oxidation peak current for TZ was observed in acidic medium at pH 2, where the TZ drug attracted to the negatively charged surface of the modified electrode, but pH 7.4 was selected throughout the experiments because it is a biological fluid pH.
Our results showed that TZ adsorbed readily on ILCCPE…SDS in acidic medium. First, this is related to the differences in the surface properties of the electrode in absence and presence of SDS and the adsorption interactions between TZ and the modified electrode surface. Second, the variation of electrostatic interaction between TZ and the anionic SDS at different pH values could also be responsible for this phenomenon. As shown in Figure 5, with increasing pH, the oxidation potential for TZ became more negative, indicating that the electro-catalytic oxidation of TZ at the proposed sensor is a pH dependent reaction and protonation/deprotenation is taking part in the charge transfer process. The relationship between the potential and pH was linear, and the regression equation was as follows:
Epa (V) = 1.247 − 0.048pH
With a correlation coefficient of r2 = 0.996, the slope was found to be −48 mV/pH units, which is not close to the anticipated Nernstian theoretical value of −59 mV for an electrochemical process involving the same number of protons and electrons. These conclusions are in accordance with the suggested mechanism of the TZ electrochemical reaction Scheme 1 reported in the literature [77].

3.6. Stability, Repeatability and Reproducibility of the Proposed Sensor

One of the factors affecting the performance of the proposed sensor is the repeated cycle stability. Figure 6 shows the repeated cycle stability of ILCCPE…SDS in 1 mmol·L−1 TZ/0.1 mol·L−1 PBS/pH 7.40 up to 25 cycles. Very stable response was obtained with a slight decrease in the anodic peak currents demonstrating that the proposed sensor was free from fouling by the oxidation products. In addition, three similarly prepared modified electrodes of ILCCPE…SDS were utilized independently for determination of TZ. Low relative standard deviation of 0.91% was obtained. This result demonstrated that good reproducibility and stable response was obtained at the modified electrode.

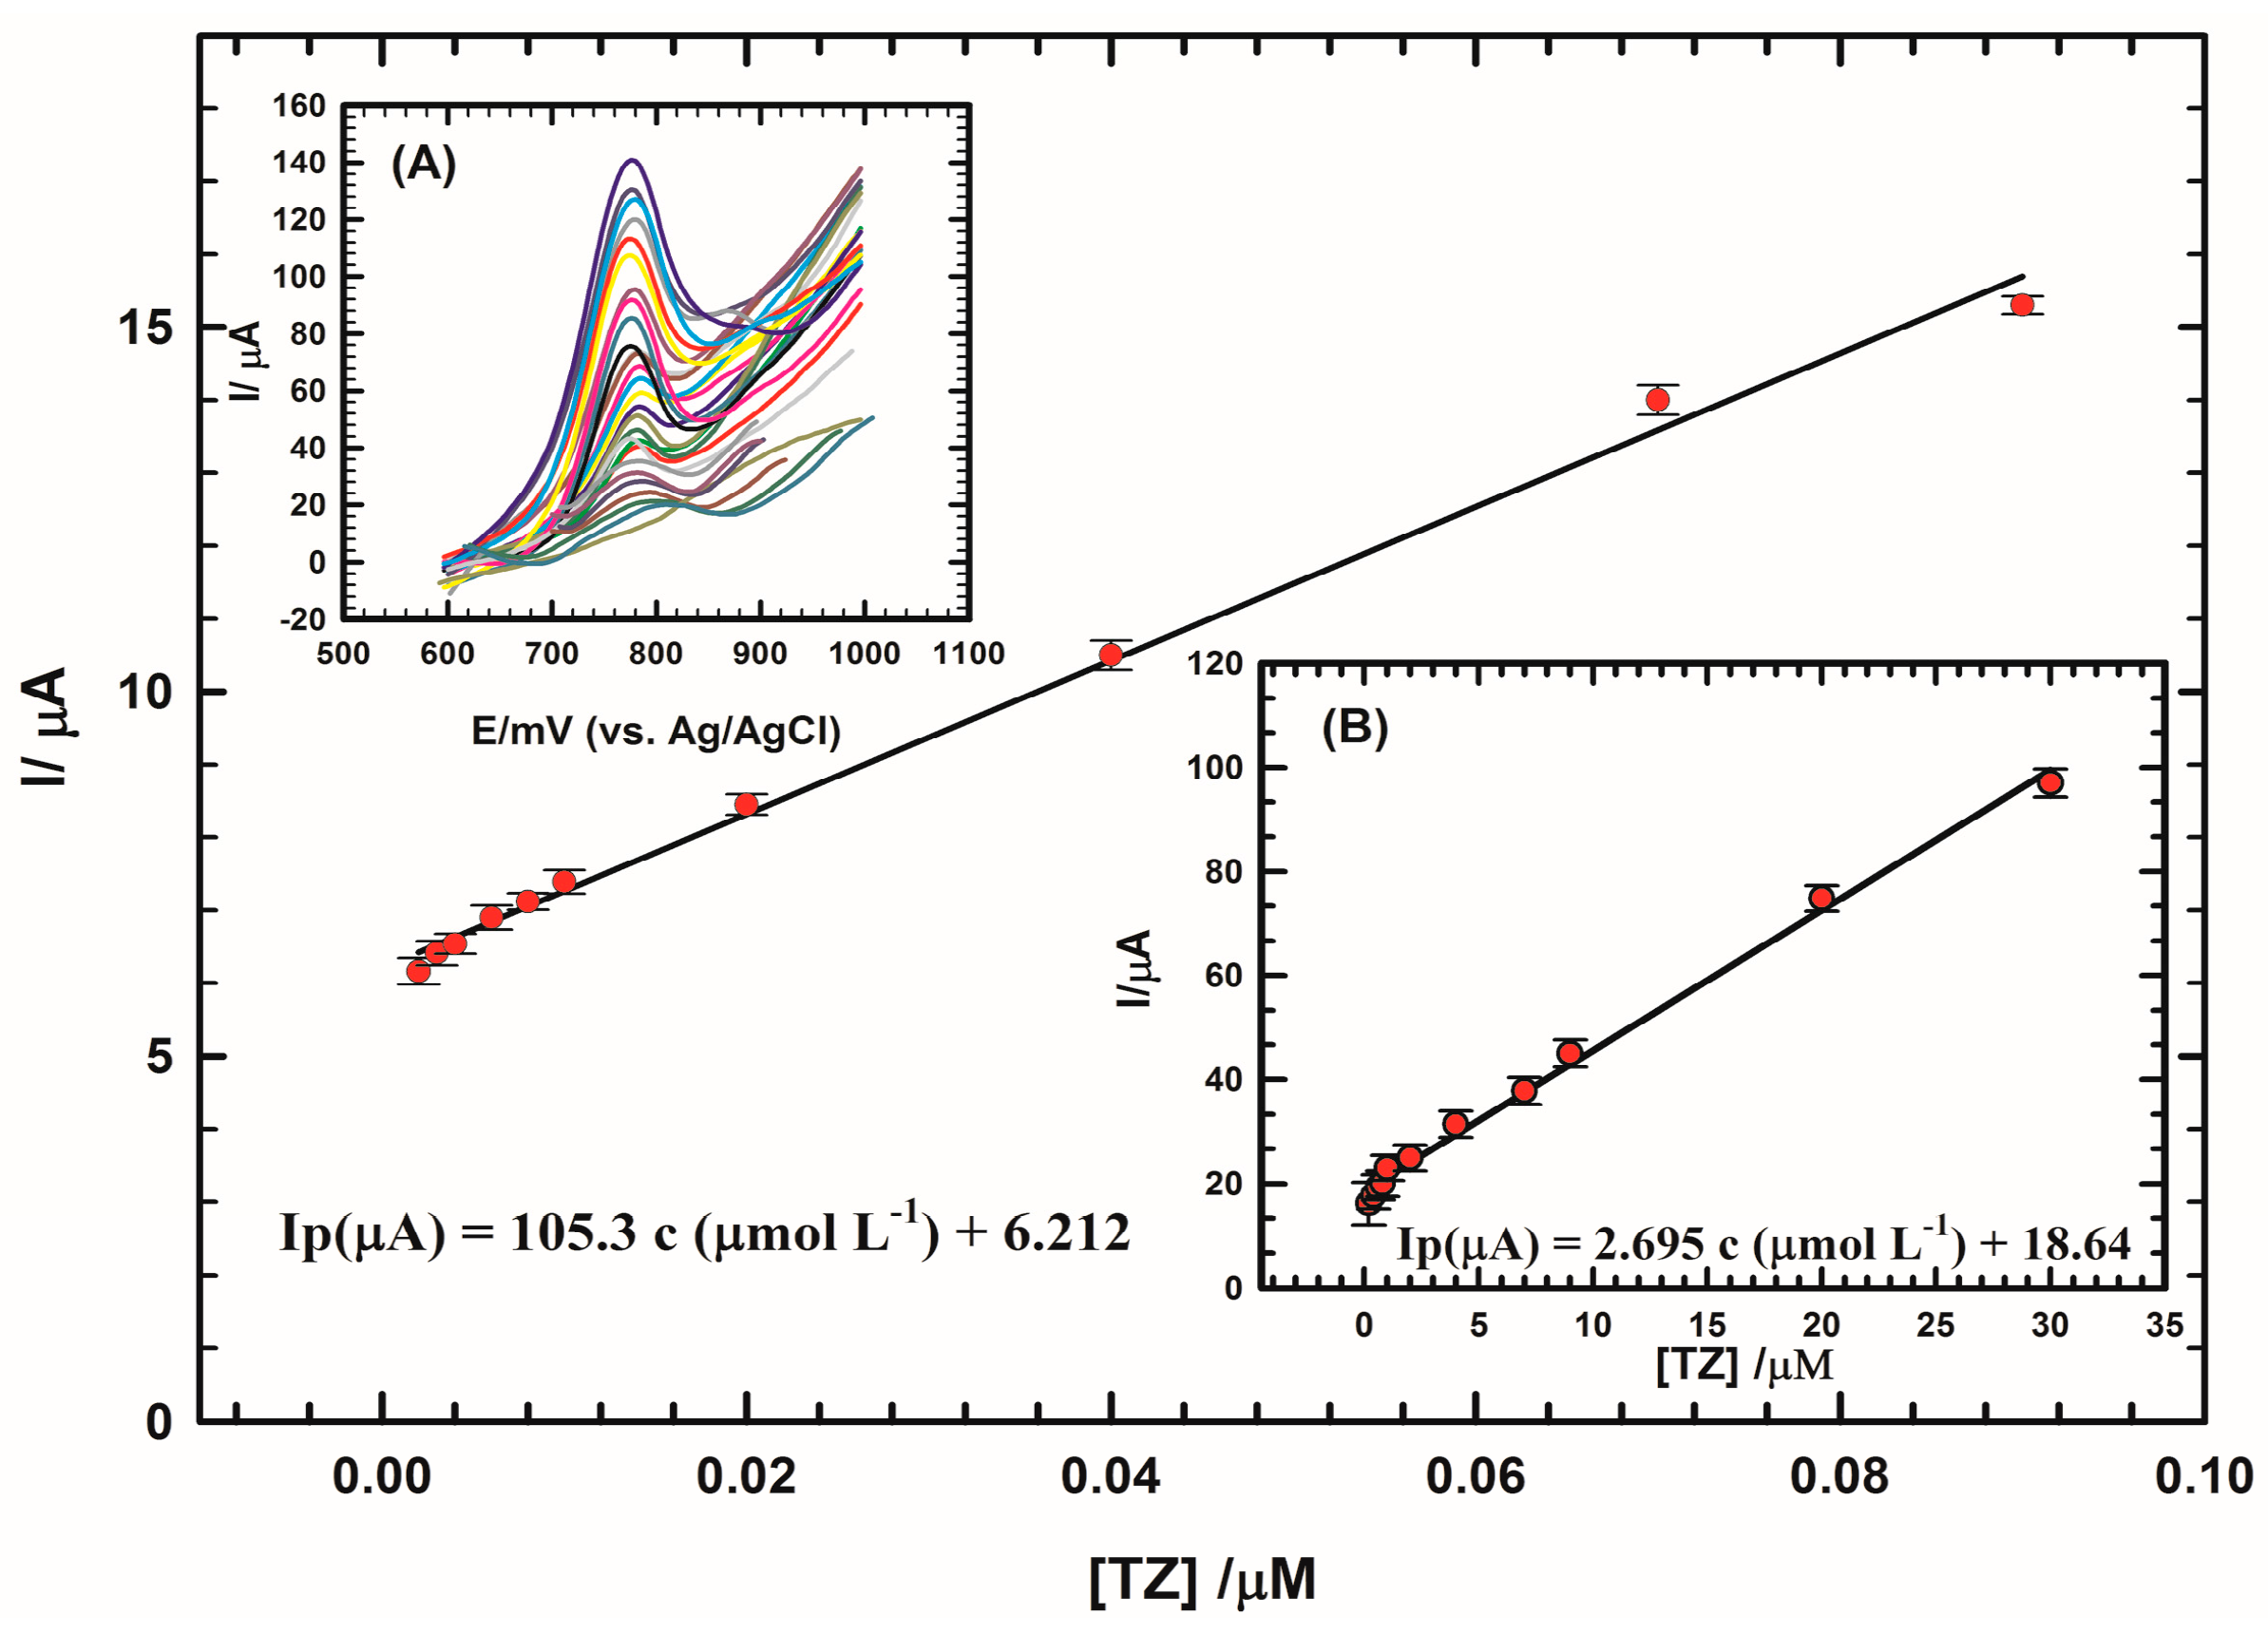
4. Determination of TZ in Real Samples

4.1. Determination of TZ in Urine

It is very important to check the validity of the sensor in the real sample analysis. On the other hand, TZ is toxic in excess or when abused; therefore, it is necessary to detect its concentration in blood or urine samples. Figure 7 (inset) shows the differential pulse voltammograms (DPVs) of standard additions of 1 mmol·L−1 TZ/0.1 mol·L−1 PBS/pH 7.40 to 15 mL of diluted urine/pH 7.40 at ILCCPE…SDS which indicated that by increasing the concentration of TZ, the anodic peak current increases. Figure 7 shows the calibration curve of the anodic peak current values in urine in the linear range of 0.002 to 0.09 μmol·L−1 with a correlation coefficient (r2) = 0.966 and a detection limit of 1.69 × 10⁻¹¹ mol·L−1 and the regression equation for TZ is Ip (μA) = 105.3 c + 6.212 (μmol·L−1). The second inset of Figure 7 shows the calibration curve of TZ in urine at ILCCPE…SDS in the linear range of 0.2 to 30 μmol·L−1. A detection limit of 6.43 × 10⁻⁹ mol·L−1 and the regression equation for TZ is Ip (μA) = 2.695 c (μmol·L−1) + 18.64 with a correlation coefficient of 0.995 was obtained. The detection limit (DL) was calculated from the following Equation (3):
DL = 3·(s/b)
where s is the standard deviation and b is the slope of the calibration curve. The results indicated that the present procedures are free from interferences of the urine sample matrix and strongly proved that TZ can be sensitively determined at ILCCPE…SDS in urine sample with low detection limit. Table 3 shows the comparison for the determination of TZ at ILCCPE…SDS with various modified electrodes based in literature reports. Relatively higher sensitivity and lower detection limit for TZ was achieved at the proposed sensor. On the other hand, four different concentrations on the calibration curve are chosen to be repeated five times to evaluate the accuracy and precision of the proposed method which is represented in Table 4.

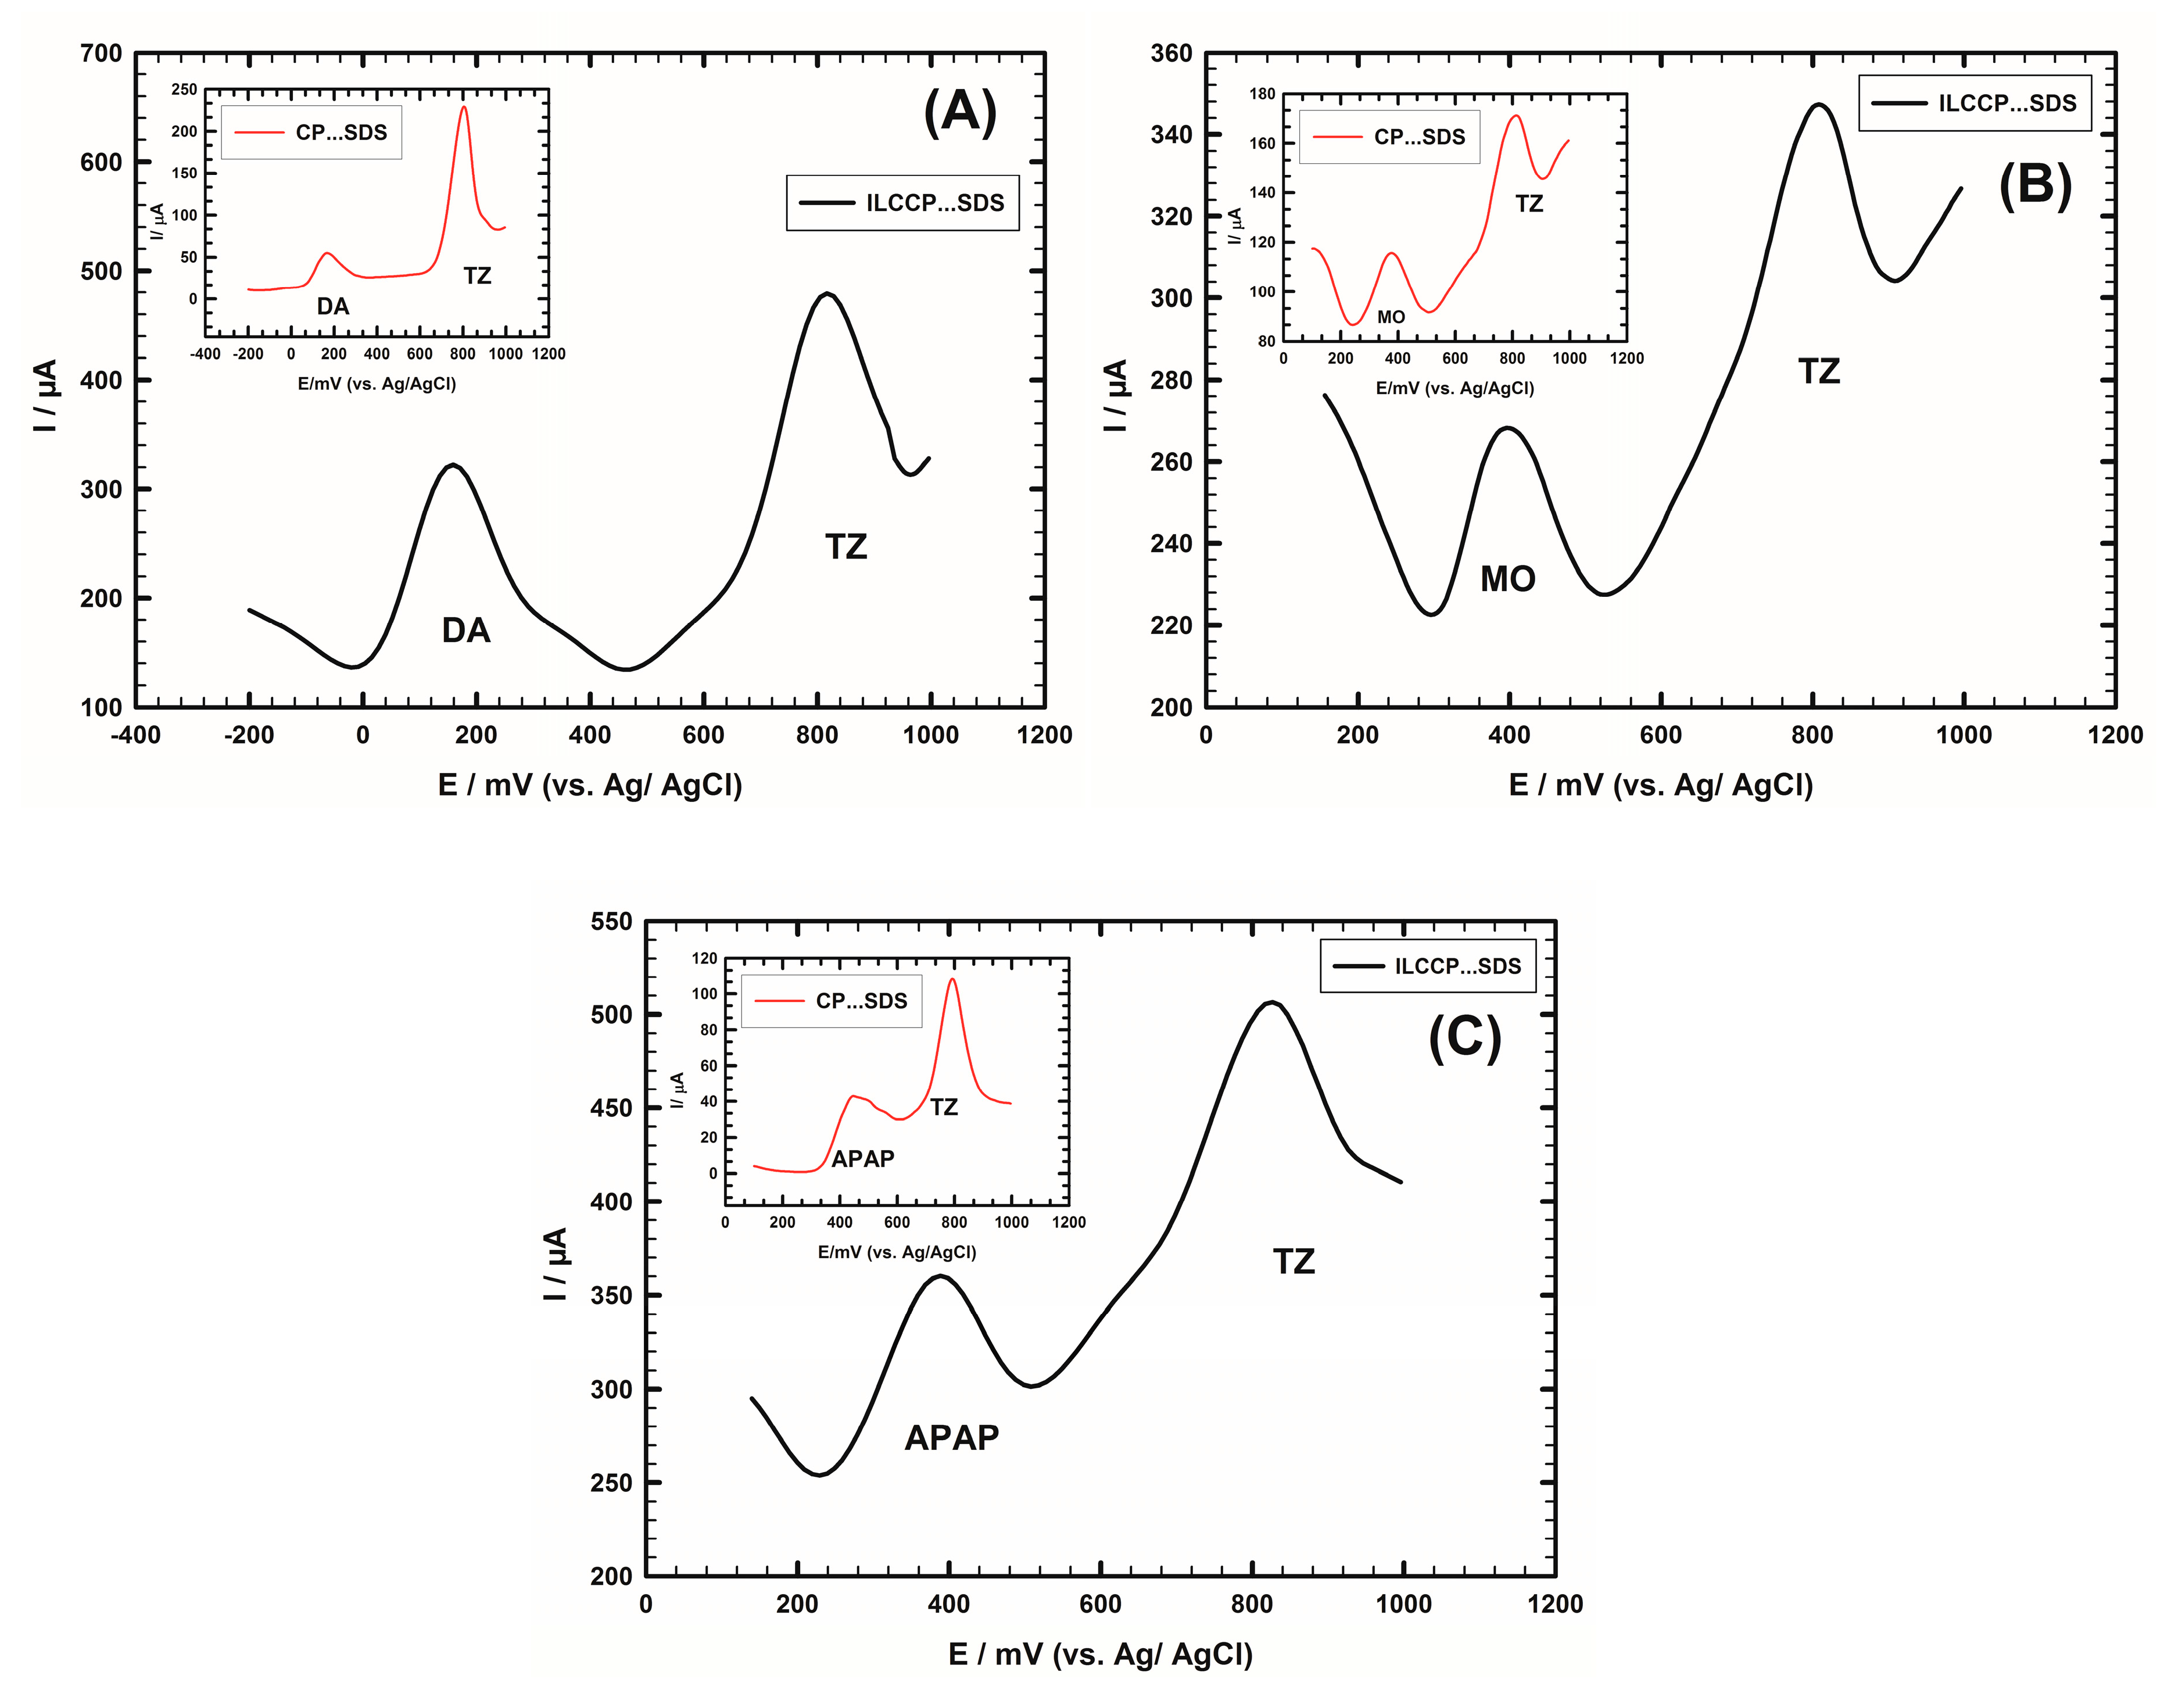
4.2. Interference Study

Determination of TZ may be interfering with co-existing biological compounds in the human fluid such as ascorbic acid, uric acid [78,79], dopamine [79] and paracetamol [79,80]. Paracetamol or acetaminophen (APAP) and morphine are two analgesic drugs widely used for the treatment of pain and fever. However, over dosage results in liver and kidney damage and may lead to death [79,80]. Therefore, it is necessary to investigate the simultaneous separation of these compounds with TZ at the modified electrode.
Figure 8A and the inset show the DPVs of 1 mM TZ and 1 mM DA/0.1 M PBS/pH 7.4 at ILCCPE…SDS and CPE…SDS. Two well-defined sharp peaks were obtained at ILCCPE…SDS at 156 mV and 820 mV with current values 249 μA and 301 μA for DA and TZ, respectively, compared to the case of CPE…SDS, where the two peaks were obtained at 168 mV and 804 mV with lower current response values 36 μA and 170 μA, respectively.
Similar behavior was obtained in other binary mixtures of TZ/MO and TZ/APAP. Figure 8B and the inset show the electrochemical behaviors of 1 mM TZ, and 1 mM MO/0.1 M PBS/pH 7.4 at ILCCPE…SDS and CPE…SDS. Two well-resolved oxidation peaks with higher current values were obtained at ILCCPE…SDS at 396 mV and 808 mV and current values 44 μA and 62 μA for MO and TZ, respectively, compared to the MO and TZ oxidation peaks, which were obtained at CPE…SDS at 392 mV and 808 mV with current values 10 μA and 49 μA, respectively.
Furthermore Figure 8C and the inset show the electrochemical behaviors of 1 mM TZ, and 1 mM APAP/0.1 M PBS/pH 7.4 at ILCCPE…SDS and CPE…SDS, respectively. Two well-resolved oxidation peaks of APAP and TZ at 392 mV and 836 mV with higher current values 97 μA and 130 μA were obtained at ILCCPE…SDS compared to APAP and TZ oxidation peaks were obtained at CPE…SDS at 448 mV and 792 mV with current values 27 μA and 74 μA, respectively.
Thus, we conclude that the proposed sensor can be used for determination of the drug with good resolution and potential peak separation in presence of other interferences in the human body.
On the other hand, the oxidation of some biomolecules such as ascorbic acid and uric acid may compete with that of TZ, thus it is very important to selectively determine TZ in presence of these interfering species. Therefore, the determination of TZ in the presence of AA and UA is very crucial from the clinical point of view. Thus, we examined these organic acids: AA and UA using ILCCPE and ILCCPE…SDS to determine their possible interference effects on the TZ sensing (Figure 9).
Figure 9A shows the DPVs of 0.1 mM AA in 0.1 M PBS/pH 7.4 at ILCCPE and ILCCPE…SDS. AA oxidation peak current observed at ILCCPE at 16 mV and it disappeared at ILCCPE…SDS. Figure 9B shows the DPVs of 0.01 mM of UA in 0.1 M PBS/pH 7.4 at the ILCCPE and ILCCPE…SDS. UA oxidation peak current at ILCCPE electrode obtained at 366 mV with current 17 μA and it decreased at ILCCPE…SDS to 10 μA at 350 mV. The adsorption of the anionic surfactant SDS may lead to electrostatic repulsion between the anionic film and anionic species (AA and UA) at the electrode surface, thus decreasing their electron transfer [81].
The ability of ILCCPE…SDS modified electrode to realize the voltammetric separation of 0.1 mM TZ, 0.01 mM UA and 0.1 mM AA in their mixture solution was investigated. The electrochemical behaviors of TZ, UA and AA in 0.1 M PBS/pH 7.4 were studied at ILCCPE and ILCCPE…SDS (Figure 9C and the inset). The values of pKa of TZ, AA and UA are 7.1, 4.10 and 5.4, respectively. Three well-resolved peaks at 768 mV, 320 mV and 80 mV for TZ, UA and AA respectively obtained at ILCCP (the inset). Using the ILCCPE…SDS, only two peaks were obtained, one sharp peak with higher current response for TZ at 779 mV and another broad peak with lower current response for UA. This showed the ability to determine selectively TZ in the presence of these species at ILCCPE…SDS.
Selective determination of TZ in presence of AA and UA mixture was also investigated when the concentration of TZ changed, whereas the others were kept constant. Figure 9D shows that the oxidation peak current of TZ increased with an increase in TZ concentration (10 → 100 µmol·L−1) while the concentrations of AA and UA were kept constant at 0.1 mmol·L−1 and 0.01 mmol·L−1, respectively. The regression equation for the calibration curve of TZ (inset) is Ip (µA) = 0.4227 C (µmol·L−1) + 2.414 (with a correlation coefficient of r2 = 0.995).
The previous results revealed the validity of the proposed sensor for the selective determination of TZ in presence of interfering species with high sensitivity.

5. Conclusions

In the present work, Ionic liquid crystal modified carbon paste electrode in presence of SDS (ILCCPE…SDS) was successfully fabricated and optimized for the electrochemical determination of TZ. Simultaneous determinations of TZ with dopamine, APAP and morphine in 0.1 M PBS/pH 7.4 binary mixtures were achieved with good separation. On the other hand, this sensor shows anti-interference ability; it can selectively determine TZ with high current response in presence of large amount of ascorbic acid and uric acid and the method was simple, sensitive and successfully applied for determination of TZ in human urine. High conductivity and inherent catalytic ability resulted in increasing electron transfer rate of the electro-oxidation of TZ using ILCCPE compared to the other modified electrodes, IL1CPE and IL2CPE in presence of SDS. Under the optimum conditions, calibration plots for TZ were linear in the ranges of 0.002 to 0.09 μmol·L−1 and 0.2 to 30 μmol·L−1 with correlation coefficients of 0.996 and 0.995 and detection limits 1.6 × 10⁻¹¹ mol·L−1 and 6.43 × 10⁻⁹ mol·L−1, respectively. The good properties of this modified electrode will expand its application in electrochemical field for the determination of other drugs in biological fluids without any interference.

Acknowledgments

The authors express their gratitude to the University of Cairo (Office of Vice President for Graduate Studies and Research) for providing partial financial support. The financial support of Kuwait University through grant number SC07/15 and instrumentation facilities (GS01/01 and GS02/08) are highly appreciated.

Author Contributions

Nada F. Atta shared suggesting the work plan, editing the manuscript and discussion. Mohammad H. BinSabt shared suggesting the work plan, editing the manuscript and discussion. Samar H. Hassan performed experiments, shared writing the manuscript and data analysis. Ahmed Galal shared data analysis and manuscript editing.

Conflicts of Interest

The authors declare no conflict of interest.

References

  1. Abraham, P.A.; Halstenson, C.E.; Matzke, G.R.; Napier, J.L.; Keane, W.F. Antihypertensive therapy with once-daily administration of terazosin, a new alpha1-adrenergic-receptor blocker. Pharmacotherapy 1985, 5, 285–289. [Google Scholar] [CrossRef] [PubMed]
  2. Miller, K. Pharmacological management of hypertension in paediatric patients. Drugs 1994, 48, 868–887. [Google Scholar] [CrossRef] [PubMed]
  3. Deger, G. Effect of terazosin on serum lipids. Am. J. Med. 1986, 80, 82–85. [Google Scholar] [CrossRef]
  4. Fabricius, P.G.; Weizert, P.; Dunzendorfer, U.; Hannaford, J.M.; Maurath, C. Efficacy of once-a-day terazosin in benign prostatic hyperplasia: A randomized, double-blind placebo-controlled clinical trial. Prostate 1990, 17, 85–93. [Google Scholar] [CrossRef]
  5. Patterson, S.E. Determination of terazosin in human plasma using high performance liquid chromatography with fluorescence detection. J. Chromatogr. B 1984, 311, 206–212. [Google Scholar] [CrossRef]
  6. Bhamra, R.K.; Flanagan, R.J.; Holt, D.W. High performance liquid chromatographic measurement of prazosin and terazosin in biological fluids. J. Chromatogr. B 1986, 380, 216–221. [Google Scholar] [CrossRef]
  7. Bauer, J.F.; Krogh, S.K.; Chang, Z.L.; Wong, C.F. Determination of minor impurities in terazosin hydrochloride by high-performance liquid chromatography. J. Chromatogr. A 1993, 648, 175–181. [Google Scholar] [CrossRef]
  8. Ferretti, R.; Gallinella, B.; La Torre, F.; Zanitti, L.; Turchetto, L.; Mosca, A.; Cirilli, R. Direct high-performance liquid chromatography enantioseparation of terazosin on an immobilised polysaccharide-based chiral stationary phase under polar organic and reversed-phase conditions. J. Chromatogr. A 2009, 1216, 5385–5390. [Google Scholar] [CrossRef] [PubMed]
  9. Zou, H.-Y.; Wu, H.-L.; Yang, L.-Q.O.; Zhang, Y.; Nie, J.-F.; Fu, H.-Y.; Yu, R.-Q. Fluorescent quantification of terazosin hydrochloride content in human plasma and tablets using second-order calibration based on both parallel factor analysis and alternating penalty trilinear decomposition. Anal. Chim. Acta 2009, 650, 143–149. [Google Scholar] [CrossRef] [PubMed]
  10. Zavitsanos, A.P.; Alebic-Kolbah, T. Enantioselective determination of terazosin in human plasma by normal phase high-performance liquid chromatography–electrospray mass spectrometry. J. Chromatogr. A 1998, 794, 45–56. [Google Scholar] [CrossRef]
  11. Srinivas, J.S.; Avadhavulu, A.B.; Anjaneyulu, Y. HPLC determination of terazosin hydrochloride in its pharmaceutical dosage forms. Indian Drugs 1998, 35, 269–273. [Google Scholar]
  12. Sekhar, E.C.; Rao, T.R.K.; Sekhar, K.R.; Naidu, M.U.R.; Shobha, J.C.; Rani, P.U.; Kumar, T.V.; Kumar, V.P. Determination of terazosin in human plasma, using high-performance liquid chromatography with fluorescence detection. J. Chromatogr. B Biomed. Sci. Appl. 1998, 710, 137–142. [Google Scholar] [CrossRef]
  13. Cheah, P.Y.; Yuena, K.H.; Liong, M.L. Improved high performance liquid chromatographic analysis of terazosin in human plasma. J. Chromatogr. B 2000, 745, 439–443. [Google Scholar] [CrossRef]
  14. Niu, C.Q.; Ren, L.M. Chiral separation and preparation of three new antagonists of alpha 1-adrenoceptors by chiral mobile phase HPLC. Yao Xue Xue Bao 2002, 37, 450–453. [Google Scholar] [PubMed]
  15. Bakshi, M.; Ojha, T.; Singh, S. Validated specific HPLC methods for determination of prazosin, terazosin and doxazosin in the presence of degradation products formed under ICH-recommended stress conditions. J. Pharm. Biomed. Anal. 2004, 34, 19–26. [Google Scholar] [CrossRef] [PubMed]
  16. Chen, D.; Zhao, C. Determination of terazosin in human plasma by high performance liquid chromatography with ultraviolet detection. Asian J. Tradit. Med. 2006, 52, 1–3. [Google Scholar]
  17. Ren, X.; Dong, Y.; Huang, A.; Sun, Y.; Sun, Z. Separation of the enantiomers of four chiral drugs by neutral cyclodextrin-mediated capillary zone electrophoresis. Chromatographia 1999, 49, 411–414. [Google Scholar] [CrossRef]
  18. Abdine, H.H.; El-Yazbi, F.A.; Blaih, S.M.; Shaalan, R.A. Spectrophotometric and spectrofluorimetric methods for the determination of terazosin in dosage forms. Spectrosc. Lett. 1998, 31, 969–980. [Google Scholar] [CrossRef]
  19. Jiang, C.-Q.; Gao, M.-X.; He, J.-X. Study of the interaction between terazosin and serum albumin: synchronous fluorescence determination of terazosin. Anal. Chim. Acta 2002, 452, 185–189. [Google Scholar] [CrossRef]
  20. Atta, N.F.; Darwish, S.A.; Khalil, S.E. Effect of surfactants on the voltammetric response and determination of an antihypertensive drug. Talanta 2007, 72, 1438–1445. [Google Scholar] [CrossRef] [PubMed]
  21. Pournaghi-Azar, M.H.; Saadatirad, A. Simultaneous voltammetric and amperometric determination of morphine and codeine using a chemically modified-palladized aluminum electrode. J. Electroanal. Chem. 2008, 624, 293–298. [Google Scholar] [CrossRef]
  22. Atta, N.F.; Galal, A.; Ahmed, R.A. Direct and simple electrochemical determination of morphine at PEDOT modified Pt electrode. Electroanalysis 2011, 23, 737–746. [Google Scholar] [CrossRef]
  23. Ghoneim, M.M.; El Ries, M.A.; Hammam, E.; Beltagi, A.M. A validated stripping voltammetric procedure for quantification of the anti-hypertensive and benign prostatic hyperplasia drug terazosin in tablets and human serum. Talanta 2004, 64, 703–710. [Google Scholar] [CrossRef] [PubMed]
  24. Molaakbari, E.; Mostafavi, A.; Beitollahi, H.; Alizadeh, R. Synthesis of ZnO nanorods and their application in the construction of a nanostructure-based electrochemical sensor for determination of levodopa in the presence of carbidopa. Analyst 2014, 139, 4356–4364. [Google Scholar] [CrossRef] [PubMed]
  25. Shabani-Nooshabadi, M.; Tahernejad-Javazmi, F. Electrocatalytic determination of hydroxylamine in the presence of thiosulfate in water and wastewater samples using a nanostructure modified carbon paste electrode. Electroanalysis 2015, 27, 1733–1741. [Google Scholar] [CrossRef]
  26. Mahmoudi Moghaddam, H.; Beitollahi, H.; Tajik, S.; Soltani, H. Fabrication of a Nanostructure Based Electrochemical Sensor for Voltammetric Determination of Epinephrine, Uric Acid and Folic Acid. Electroanalysis 2015, 27, 2620–2628. [Google Scholar] [CrossRef]
  27. Novoselov, K.S.A.; Geim, A.K.; Morozov, S.; Jiang, D.; Katsnelson, M.; Grigorieva, I.; Dubonos, S.; Firsov, A. Two-dimensional gas of massless Dirac fermions in graphene. Nature 2005, 438, 197–200. [Google Scholar] [CrossRef] [PubMed] [Green Version]
  28. Švancara, I.; Vytřas, K.; Kalcher, K.; Walcarius, A.; Wang, J. Carbon Paste Electrodes in Facts, Numbers, and Notes: A Review on the Occasion of the 50-Years Jubilee of Carbon Paste in Electrochemistry and Electroanalysis. Electroanalysis 2009, 21, 7–28. [Google Scholar] [CrossRef]
  29. Binnemans, K. Ionic liquid crystals. Chem. Rev. 2005, 105, 4148–4204. [Google Scholar] [CrossRef] [PubMed]
  30. Sun, W.; Yang, M.; Jiao, K. Electrocatalytic oxidation of dopamine at an ionic liquid modified carbon paste electrode and its analytical application. Anal. Bioanal. Chem. 2007, 389, 1283–1291. [Google Scholar] [CrossRef] [PubMed]
  31. Sun, W.; Liu, J.; Wang, X.; Li, T.; Li, G.; Wu, J.; Zhang, L. Electrochemical oxidation of adenosine-5′-triphosphate on a chitosan–graphene composite modified carbon ionic liquid electrode and its determination. Mater. Sci. Eng. C 2012, 32, 2129–2134. [Google Scholar] [CrossRef]
  32. Wang, B.; Li, Y.; Qin, X.; Zhan, G.; Ma, M.; Li, C. Electrochemical fabrication of TiO2 nanoparticles/[BMIM] BF4 ionic liquid hybrid film electrode and its application in determination of p-acetaminophen. Mater. Sci. Eng. C 2012, 32, 2280–2285. [Google Scholar] [CrossRef]
  33. Shabani-Nooshabadi, M.; Roostaee, M. Coupling of NiO Nanoparticles and Room Temperature Ionic Liquid for Fabrication of Highly Sensitive Voltammetric Sensor in Tryptophan Analysis. Anal. Bioanal. Electrochem. 2012, 8, 578–588. [Google Scholar]
  34. Beitollahi, H.; Tajik, S.; Jahani, S. Electrocatalytic Determination of Hydrazine and Phenol Using a Carbon Paste Electrode Modified with Ionic Liquids and Magnetic Core-shell Fe3O4@SiO2/MWCNT Nanocomposite. Electroanalysis 2016, 28, 1093–1099. [Google Scholar] [CrossRef]
  35. Shabani-Nooshabadi, M.; Roostaee, M.; Tahernejad-Javazmi, F. Graphene oxide/NiO nanoparticle composite-ionic liquid modified carbon paste electrode for selective sensing of 4-chlorophenol in the presence of nitrite. J. Mol. Liq. 2016, 219, 142–148. [Google Scholar] [CrossRef]
  36. Shabani-Nooshabadi, M.; Roostaee, M. Modification of carbon paste electrode with NiO/graphene oxide nanocomposite and ionic liquids for fabrication of high sensitive voltammetric sensor on sulfamethoxazole analysis. J. Mol. Liq. 2016, 220, 329–333. [Google Scholar] [CrossRef]
  37. Sun, W.; Dong, L.; Deng, Y.; Yu, J.; Wang, W.; Zhu, Q. Application of N-doped graphene modified carbon ionic liquid electrode for direct electrochemistry of hemoglobin. Mater. Sci. Eng. C 2014, 39, 86–91. [Google Scholar] [CrossRef] [PubMed]
  38. Pandey, S. Analytical applications of room-temperature ionic liquids: A review of recent efforts. Anal. Chim. Acta 2006, 556, 38–45. [Google Scholar] [CrossRef] [PubMed]
  39. Qin, W.; Li, S.F.Y. An ionic liquid coating for determination of sildenafil and UK-103,320 in human serum by capillary zone electrophoresis-ion trap mass spectrometry. Electrophoresis 2002, 23, 4110–4116. [Google Scholar] [CrossRef] [PubMed]
  40. Silvester, D.S. Recent advances in the use of ionic liquids for electrochemical sensing. Analyst 2011, 136, 4871–4882. [Google Scholar] [CrossRef] [PubMed]
  41. Opallo, M.; Lesniewski, A. A review on electrodes modified with ionic liquids. J. Electroanal. Chem. 2011, 656, 2–16. [Google Scholar] [CrossRef]
  42. Ensafi, A.A.; Rezaei, B.; Krimi-Maleh, H. An ionic liquid-type multiwall carbon nanotubes paste electrode for electrochemical investigation and determination of morphine. Ionics (Kiel) 2011, 17, 659–668. [Google Scholar] [CrossRef]
  43. Liu, X.; Ding, Z.; He, Y.; Xue, Z.; Zhao, X.; Lu, X. Electrochemical behavior of hydroquinone at multi-walled carbon nanotubes and ionic liquid composite film modified electrode. Colloids Surf. B Biointerfaces 2010, 79, 27–32. [Google Scholar] [CrossRef] [PubMed]
  44. Chandrashekar, B.N.; Swamy, B.E.K.; Ashoka, N.B.; Bannanakere, M.P. Simultaneous electrochemical determination of epinephrine and uric acid at 1-butyl-4-methyl-pyridinium tetrafluroborate ionic liquid modified carbon paste electrode: A voltammetric study. J. Mol. Liq. 2012, 165, 168–172. [Google Scholar] [CrossRef]
  45. Ensafi, A.A.; Bahrami, H.; Rezaei, B.; Karimi-Maleh, H. Application of ionic liquid-TiO2 nanoparticle modified carbon paste electrode for the voltammetric determination of benserazide in biological samples. Mater. Sci. Eng. C 2013, 33, 831–835. [Google Scholar] [CrossRef] [PubMed]
  46. Sun, W.; Jiang, Q.; Yang, M.; Jiao, K. Electrochemical behaviors of hydroquinone on a carbon paste electrode with ionic liquid as binder. Bull. Korean Chem. Soc. 2008, 29, 915–921. [Google Scholar]
  47. Liu, L.-H.; Duan, C.-Q.; Gao, Z.-N. Electrochemical behavior and electrochemical determination of carbamazepine at an ionic liquid modified carbon paste electrode in the presence of sodium dodecyl sulfate. J. Serbian Chem. Soc. 2012, 77, 483–496. [Google Scholar] [CrossRef]
  48. Welton, T. Room-temperature ionic liquids. Solvents for synthesis and catalysis. Chem. Rev. 1999, 99, 2071–2084. [Google Scholar] [CrossRef] [PubMed]
  49. Sheldon, R. Catalytic reactions in ionic liquids. Chem. Commun. 2001, 2399–2407. [Google Scholar] [CrossRef]
  50. Huang, K.-J.; Niu, D.-J.; Sun, J.-Y.; Zhu, X.-L.; Zhu, J.-J. Label-free amperometric immunobiosensor based on a gold colloid and Prussian blue nanocomposite film modified carbon ionic liquid electrode. Anal. Bioanal. Chem. 2010, 397, 3553–3561. [Google Scholar] [CrossRef] [PubMed]
  51. Sun, W.; Li, X.; Jiao, K. Direct Electrochemistry of Myoglobin in a Nafion-Ionic Liquid Composite Film Modified Carbon Ionic Liquid Electrode. Electroanalysis 2009, 21, 959–964. [Google Scholar] [CrossRef]
  52. Xiao, F.; Zhao, F.; Li, J.; Liu, L.; Zeng, B. Characterization of hydrophobic ionic liquid-carbon nanotubes—Gold nanoparticles composite film coated electrode and the simultaneous voltammetric determination of guanine and adenine. Electrochim. Acta 2008, 53, 7781–7788. [Google Scholar] [CrossRef]
  53. Arvand, M.; Shiraz, M.G. Voltammetric Determination of Clozapine in Pharmaceutical Formulations and Biological Fluids Using an In Situ Surfactant-Modified Carbon Ionic Liquid Electrode. Electroanalysis 2012, 24, 683–690. [Google Scholar] [CrossRef]
  54. Kachoosangi, R.T.; Musameh, M.M.; Abu-Yousef, I.; Yousef, J.M.; Kanan, S.M.; Xiao, L.; Davies, S.G.; Russell, A.; Compton, R.G. Carbon nanotube- ionic liquid composite sensors and biosensors. Anal. Chem. 2008, 81, 435–442. [Google Scholar] [CrossRef] [PubMed]
  55. Zhang, Q.; Shan, C.; Wang, X.; Chen, L.; Niu, L.; Chen, B. New ionic liquid crystals based on azobenzene moiety with two symmetric imidazolium ion group substituents. Liq. Cryst. 2008, 35, 1299–1305. [Google Scholar] [CrossRef]
  56. Cheng, X.; Bai, X.; Jing, S.; Ebert, H.; Prehm, M.; Tschierske, C. Self-Assembly of Imidazolium-Based Rodlike Ionic Liquid Crystals: Transition from Lamellar to Micellar Organization. Chem. Eur. J. 2010, 16, 4588–4601. [Google Scholar] [CrossRef] [PubMed]
  57. Pal, S.K.; Kumar, S. Microwave-assisted synthesis of novel imidazolium-based ionic liquid crystalline dimers. Tetrahedron Lett. 2006, 47, 8993–8997. [Google Scholar] [CrossRef]
  58. Atta, N.F.; Galal, A.; Azab, S.M.; Ibrahim, A.H. Electrochemical Sensor Based on Ionic Liquid Crystal Modified Carbon Paste Electrode in Presence of Surface Active Agents for Enoxacin Antibacterial Drug. J. Electrochem. Soc. 2015, 162, B9–B15. [Google Scholar] [CrossRef]
  59. Galal, A.; Atta, N.F.; Azab, S.M.; Ibrahim, A.H. Electroanalysis of Benazepril Hydrochloride Antihypertensive Drug Using an Ionic Liquid Crystal Modified Carbon Paste Electrode. Electroanalysis 2015, 27, 1282–1292. [Google Scholar] [CrossRef]
  60. Zanardi, C.; Terzi, F.; Seeber, R. Composite electrode coatings in amperometric sensors. Effects of differently encapsulated gold nanoparticles in poly(3,4-ethylendioxythiophene) system. Sens. Actuators B Chem. 2010, 148, 277–282. [Google Scholar] [CrossRef]
  61. Atta, N.F.; Galal, A.; Abu-Attia, F.M.; Azab, S.M. Characterization and electrochemical investigations of micellar/drug interactions. Electrochim. Acta 2011, 56, 2510–2517. [Google Scholar] [CrossRef]
  62. Atta, N.F.; Galal, A.; Ekram, H. A novel sensor of cysteine self-assembled monolayers over gold nanoparticles for the selective determination of epinephrine in presence of sodium dodecyl sulfate. Analyst 2012, 137, 2658–2668. [Google Scholar] [CrossRef] [PubMed]
  63. Galal, A.; Atta, N.F.; Ekram, H. Probing cysteine self-assembled monolayers over gold nanoparticles—Towards selective electrochemical sensors. Talanta 2012, 93, 264–273. [Google Scholar] [CrossRef] [PubMed]
  64. Shankar, S.S.; Swamy, B.E.K. Detection of epinephrine in presence of serotonin and ascorbic acid by TTAB modified carbon paste electrode: A voltammetric study. Int. J. Electrochem. Sci. 2014, 9, 1321–1339. [Google Scholar]
  65. Shrivastav, R.; Satsangee, S.P.; Jain, R. Effect of Surfactants on the Voltammetric Response and Determination of an Antihypertensive Drug Phentolamine at Boron Doped Diamond Electrode. ECS Trans. 2013, 50, 23–26. [Google Scholar] [CrossRef]
  66. Bozal-Palabiyik, B.; Kurbanoglu, S.; Gumustas, M.; Uslu, B.; Ozkan, S.A. Electrochemical approach for the sensitive determination of anticancer drug epirubicin in pharmaceuticals in the presence of anionic surfactant. Rev. Roum. Chim. 2013, 58, 647–658. [Google Scholar]
  67. Teradal, N.L.; Kalanur, S.S.; Prashanth, S.N.; Seetharamappa, J. Electrochemical investigations of an anticancer drug in the presence of sodium dodecyl sulfate as an enhancing agent at carbon paste electrode. J. Appl. Electrochem. 2012, 42, 917–923. [Google Scholar] [CrossRef]
  68. Jain, R.; Sharma, S. Glassy carbon electrode modified with multi-walled carbon nanotubes sensor for the quantification of antihistamine drug pheniramine in solubilized systems. J. Pharm. Anal. 2012, 2, 56–61. [Google Scholar] [CrossRef]
  69. Atta, N.F.; Galal, A.; Ali, S.M.; Hassan, S.H. Electrochemistry and detection of dopamine at a poly(3,4-ethylenedioxythiophene) electrode modified with ferrocene and cobaltocene. Ionics (Kiel) 2015, 21, 2371–2382. [Google Scholar] [CrossRef]
  70. Atta, N.F.; Galal, A.; Ekram, H.E. Gold nanoparticles-coated poly(3,4-ethylene-dioxythiophene) for the selective determination of sub-nano concentrations of dopamine in presence of sodium dodecyl sulfate. Electrochim. Acta 2012, 69, 102–111. [Google Scholar] [CrossRef]
  71. Atta, N.F.; Galal, A.; El-Ads, E.H. Smart electrochemical morphine sensor using poly(3,4-ethylene-dioxythiophene)/gold-nanoparticles composite in presence of surfactant. Int. J. Electrochem. Sci 2014, 9, 2113–2131. [Google Scholar]
  72. Giang, H.T.; Duy, H.T.; Ngan, P.Q.; Thai, G.H.; Toan, N.N. Hydrocarbon gas sensing of nano-crystalline perovskite oxides LnFeO3 (Ln = La, Nd and Sm). Sens. Actuators B Chem. 2011, 158, 246–251. [Google Scholar] [CrossRef]
  73. Axenov, K.V.; Laschat, S. Thermotropic ionic liquid crystals. Materials (Basel) 2011, 4, 206–259. [Google Scholar] [CrossRef]
  74. Wang, X.; Hu, S.; Li, Q.; Li, F.; Yao, K.; Shi, M. Inducting effects of ionic liquid crystal modified-PEDOT: PSS on the performance of bulk heterojunction polymer solar cells. RSC Adv. 2015, 5, 52874–52881. [Google Scholar] [CrossRef]
  75. Maleki, N.; Safavi, A.; Tajabadi, F. High-performance carbon composite electrode based on an ionic liquid as a binder. Anal. Chem. 2006, 78, 3820–3826. [Google Scholar] [CrossRef] [PubMed]
  76. Wei, D.; Ivaska, A. Applications of ionic liquids in electrochemical sensors. Anal. Chim. Acta 2008, 607, 126–135. [Google Scholar] [CrossRef] [PubMed]
  77. Madrakian, T.; Ghasemi, H.; Afkhami, A.; Haghshenas, E. ZnO/rGO nanocomposite/carbon paste electrode for determination of terazosin in human serum samples. RSC Adv. 2016, 6, 2552–2558. [Google Scholar] [CrossRef]
  78. Afkhami, A.; Ghaedi, H.; Madrakian, T.; Ahmadi, M.; Mahmood-Kashani, H. Fabrication of a new electrochemical sensor based on a new nano-molecularly imprinted polymer for highly selective and sensitive determination of tramadol in human urine samples. Biosens. Bioelectron. 2013, 44, 34–40. [Google Scholar] [CrossRef] [PubMed]
  79. Abu-Shawish, H.M.; Ghalwa, N.A.; Zaggout, F.R.; Saadeh, S.M.; Al-Dalou, A.R.; Assi, A.A.A. Improved determination of tramadol hydrochloride in biological fluids and pharmaceutical preparations utilizing a modified carbon paste electrode. Biochem. Eng. J. 2010, 48, 237–245. [Google Scholar] [CrossRef]
  80. Sanghavi, B.J.; Srivastava, A.K. Simultaneous voltammetric determination of acetaminophen and tramadol using Dowex50wx2 and gold nanoparticles modified glassy carbon paste electrode. Anal. Chim. Acta 2011, 706, 246–254. [Google Scholar] [CrossRef] [PubMed]
  81. Atta, N.F.; Galal, A.; Ahmed, R.A. Poly(3,4-ethylene-dioxythiophene) electrode for the selective determination of dopamine in presence of sodium dodecyl sulfate. Bioelectrochemistry 2011, 80, 132–141. [Google Scholar] [CrossRef] [PubMed]
  82. Atta, N.F.; Galal, A.; Azab, S.M. Gold Nanoparticles Modified Electrode for the Determination of an Antihypertensive Drug. Electroanalysis 2012, 24, 1431–1440. [Google Scholar] [CrossRef]
  83. Shrivastava, A.; Gupta, V. Stability-Indicating RP-HPLC Method for the Simultaneous Determination of Prazosin, Terazosin, and Doxazosin in Pharmaceutical Formulations. Sci. Pharm. 2012, 80, 619–631. [Google Scholar] [CrossRef] [PubMed]
  84. Ismail, N.S.; Mohamed, T.A. Potentiometric and Fluorimetric Methods for the Determination of Terazosin HCl in Drug Substance and Dosage Forms. Int. J. Electrochem. 2014, 9, 7394–7413. [Google Scholar]
Figure 1. SEM micrographs of: (A) CPE; (B) ILCCPE; and (C) ILCCPE…SDS.
Crystals 07 00027 g001
Figure 2. (A) CVs of 1 mmol·L−1 TZ/0.1 mol·L−1 PBS/pH 7.40 at CPE (black line), CPE…SDS (red line) ILCCPE (green line) and ILCCPE…SDS (violet line). (Blue line) Represents the CV of ILCCPE…SDS in the absence of TZ, scan rate 50 mV·s−1. (B) CVs of 1 mmol·L−1 TZ/0.1 mol·L−1 PBS/pH 7.40 at ILCCPE…SDS (black line), IL1CPE…SDS (red line) and IL2CPE…SDS (green line). Scan rate 50 mV·s−1.
Crystals 07 00027 g002
Figure 3. Typical impedance spectrum presented in the form of the Nyquist plot for CPE (○), ILCCPE () and ILCCPE…SDS (). (Symbols and solid lines represent the experimental measurements and the computer fitting of impedance spectra, respectively). (Inset) Equivalent circuit used in the fit procedure of the impedance spectra.
Crystals 07 00027 g003
Figure 4. The linear relation between the anodic peak current of TZ (µA) and the square root of the scan rate (mV·s−1)1/2, the inset, CVs of 1 mmol·L−1 TZ/0.1 mol·L−1 PBS/pH 7.40 at ILCCPE…SDS at different scan rates (10–100 mV·s−1).
Crystals 07 00027 g004
Figure 5. The linear relationship between the anodic peak potential of TZ (mV) and the pH value, scan rate 50 mV·s−1, the inset, CVs of 1 mmol·L−1 TZ/0.1 mol·L−1 PBS with different pH values (2–9) at ILCCPE…SDS.
Crystals 07 00027 g005
Scheme 1. Suggested mechanism for the electrochemical oxidation of terazosin.
Crystals 07 00027 sch001
Figure 6. Repeated cycle stability of 1 mmol·L−1 TZ/0.1 mol·L−1 PBS/pH 7.40 at ILCCPE…SDS, 25 repeated cycles, scan rate 50 mV·s−1.
Crystals 07 00027 g006
Figure 7. Calibration curve for TZ in the linear range (0.002 µmol·L−1–0.09 µmol·L−1) at ILCCPE…SDS electrode. Insets: (A) DPVs of TZ in urine at ILCCPE…SDS for concentrations from (0.002 µmol·L−1 to 30 µmol·L−1); and (B) calibration curve for TZ in the linear range (0.2 µmol·L−1–30 µmol·L−1) at ILCCPE…SDS.
Crystals 07 00027 g007
Figure 8. (A) DPV of 1 mmol·L−1 TZ in the presence of 1 mmol·L−1 DA at ILCCPE…SDS, the inset, the DPV of 1 mmol·L−1 TZ in presence of 1 mmol·L−1 DA at CPE…SDS; (B) DPV of 1 mmol·L−1 TZ in the presence of 1 mmol·L−1 MO at ILCCPE…SDS, the inset, DPV of 1 mmol·L−1 TZ in presence of 1 mmol·L−1 MO at CPE…SDS; and (C) DPV of 1 mmol·L−1 TZ in presence of 1 mmol·L−1 APAP at ILCCPE…SDS, the inset, the DPV of 1 mmol·L−1 TZ in presence of 1 mmol·L−1 APAP at CPE…SDS.
Crystals 07 00027 g008
Figure 9. (A) DPV of 0.1 mmol·L−1 AA at ILCCPE and ILCCPE…SDS; (B) DPV of 0.01 mmol·L−1 UA at ILCCPE and ILCCE…SDS; (C) DPV of 0.1 mmol·L−1 TZ in presence of 0.01 mmol·L−1 UA and 0.1 mmol·L−1 AA at ILCCPE…SDS (inset: DPV of 0.1 mmol·L−1 TZ in presence of 0.01 mmol·L−1 UA and 0.1 mmol·L−1 AA at ILCCPE); and (D) DPVs of TZ in presence of 0.01 mmol·L−1 UA and 0.1 mmol·L−1 AA at ILCCPE…SDS for concentration range (10 µmol·L−1–100 µmol·L−1) (inset: calibration curve for TZ in the linear range (10 µmol·L−1–100 µmol·L−1) at ILCCPE…SDS).
Crystals 07 00027 g009
Table 1. Summary of CV results obtained at CPE, CPE…SDS, ILCCPE, ILCCPE…SDS, IL1CPE…SDS and IL2CPE…SDS for 1 mmol·L−1 of TZ in 0.1 mol·L−1 PBS/pH 7.40, scan rate 50 mV·s−1.
ElectrodeEpa (mV)Ipa (µA)Dapp × 10−5 (cm2/s)
CPE850860.424
CPE…SDS8631200.827
ILCCPE8282854.64
ILCCPE…SDS87470728.7
IL1CPE…SDS8423195.85
IL2CPE…SDS8392904.83
Epa, the anodic peak potential; Ipa, the anodic peak current; Dapp, the apparent diffusion coefficient.
Table 2. Electrochemical impedance spectroscopy fitting data corresponding to Figure 3.
ElectrodeRs
(Ω·cm2)
Rct
(×10−3 Ω·cm2)
Cdl
(×103 F·cm−2)
Yo1
(×10−4 F·cm−2)
nCf
(×104 F·cm−2)
Rf
(×10−3 Ω·cm2)
W
(×10−3 Ω·s−1/2)
CPE1833.230.01991.090.9802.941.111.13
ILCCPE1481.591.212.040.9107.320.8481.10
ILCCPE…SDS80.90.7391.4853.00.9334.490.3660.552
Table 3. Comparison of TZ determination at various modified electrodes-based literature reports.
Sample[TZ] Added (µmol·L−1)[TZ] Found (µmol·L−1) aRecovery (%)Standard DeviationStandard Error b
/10−8/10−8
10.0020.001999.940.577350.3333
20.010.009999.8610.5774
321.96898.457.73533.33
42020.03100.13105.774
a Average of five determinations; b Standard error = Standard deviation/n1/2.
Table 4. Evaluation of the accuracy and precision of the proposed method for the determination of TZ in urine samples.
ElectrodeLDRSensitivity (µA/µM)LODReference
GNMCPE (urine)0.2 µM–30 µM-0.28 (nM)[82]
GC/SDS (buffer)0.04 µM–2.4 µM-4.58 (nM)[20]
HPLC (buffer)2 μg/mL–500 μg/mL-0.065 μg/mL[83]
(TRZ.PMA) cp1 µM–10 mM-800 (nM)[84]
ILCCPE…SDS (urine)0.002 µM–0.09 µM1050.0169 (nM)This work
0.2 µM–30 µM2.6956.43 (nM)
GNMCPE: Gold nanoparticles modified CP electrode; GC: glassy carbon; HPLC: High pressure liquid chromatography; (PMA) cp: potentiometric titration with phosphomolybdic acid CP electrode.

