1. Introduction
With the discovery of the first quasicrystals [
1], the quest began for, on the one hand, new quasiperiodic systems with better characterization of structural properties, and on the other hand, for theoretical methods to handle these systems. One of the goals of experiment has been, in particular, obtaining a single component quasicrystal, in the hope of finding direct relationships between its physical and geometrical properties. This may, we hope, become possible in cold atom systems. Cold atoms in optical lattices have been used to simulate quantum behavior of periodic crystals but not, thus far, of quasiperiodic tilings. Cold gases, of cesium, rubidium or potassium atoms for example, are used as quantum simulators for a great variety of systems. As compared to real solid state systems, cold atom systems represent ideal systems, in which model parameters can be tuned at will. Improvements in experimental techniques have resulted in an explosion of experimental simulations of condensed matter physics, quantum information and quantum optics models. Ultracold quantum gases in optical potentials therefore provide an exciting possibility towards the goal of synthesizing a perfect one-component quasicrystal.
The behavior of electrons in quasicrystals remains insufficiently understood, especially in dimensions higher than one. Numerical investigations have thus far been limited by the amount of computational time needed. Much effort has been devoted to trying to understand tight-binding models on simple tilings, as a first step towards the description of more realistic systems. It is thus natural to ask what possibilities exist for realizing a quasiperiodic tiling by trapping cold atoms in an optical potential. The advantages of such a system, if realized, are manifold. First, it would become possible to fabricate samples using a single atomic species—a significant simplification compared to real quasicrystals. It would be possible to directly observe the quantum states of the atoms, described by a tight-binding Hamiltonian. Finally, and importantly, many of the parameters of the hopping and interaction Hamiltonians could be tuned. Many body properties in quasiperiodic systems could be properly studied under controlled conditions. The amount of disorder could be tuned as desired, to mimic experimental situations. An experimental set-up to realize a two-dimensional tiling was proposed in [
2,
3]. It was shown that one can obtain an eight-fold tiling bearing a close relation to the Ammann–Beenker tiling [
4]. We will present the experimental system, the theoretical model and explain how a perfect quasiperiodic tiling can be obtained by introducing additional small interactions between atoms.
This paper begins with a description of the experimental set-up. We then introduce a 4D description of the optical tiling that is naturally suggested by the experimental geometry. We next show the relation between the optical tilings and the perfect Ammann Beenker tiling, and describe how to transform the former into the other. In conclusion, some directions for simulating important theoretical models are suggested.
2. Experimental Set-Up
Optical trapping of atoms by laser generated potentials has led to the artificial realization in experiments of many different kinds of models on lattices, in which particles can move and interact via experimentally controlled interactions [
5]. Atoms can be trapped by laser light thanks to the dipole force acting on an atom due to the Stark effect in an off-resonance electric field. Under suitable assumptions concerning the decay rate Γ of the excited state (for more details, see the review), it can be shown that the potential energy landscape seen by the atom that has the form
where
is a constant and
is the average value of the intensity at the position
. Denoting the electric field by
,
. The sign of the prefactor,
, depends on the polarizability of the atom, and this can be positive or negative depending on the frequency of the laser,
, relative to the resonance frequency
for the atom [
6]. The constant
depends, among other parameters, on the laser detuning and is positive for blue-detuning (
) and negative for red-detuning (
). In other words, atoms experience a net force directed towards nodes (antinodes) of the laser intensity pattern if the detuning parameter
is positive (resp. negative). In this paper, we study this latter case, corresponding to atoms being attracted to maxima of the laser intensity pattern
I. We note that, for large detuning, corrections will appear to this interaction potential due to non-conservative processes, and we will neglect these. Using this type of optical potential, it has been possible to simulate models defined on a large variety of periodic structures including the square, triangular, Kagome and other lattices. We will now consider a quasiperiodic structure with eight-fold symmetry obtained by this method.
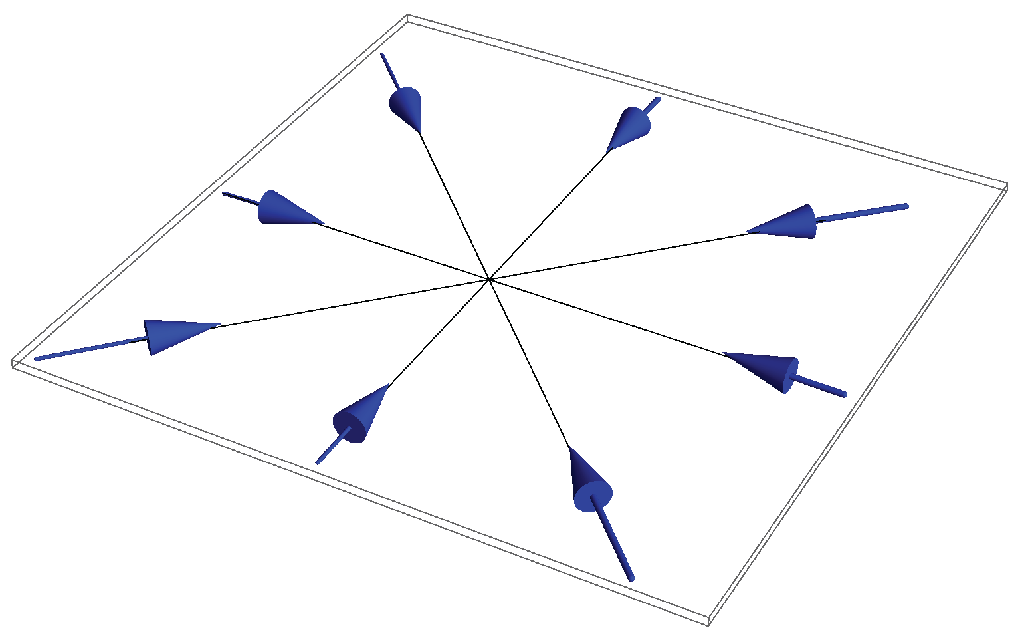
We consider a region where standing waves have been set up using four laser beams oriented at 45° angles in the
x–
y plane, as shown in
Figure 1. The wavelengths,
λ, are the same for all the beams, as are their amplitudes. We will consider the situation where all the polarizations are perpendicular to this plane, allowing the amplitudes to sum up to an absolute maximum. The alternative choice, of using in-plane polarizations, yields smaller maxima of amplitudes, smaller contrast, and would therefore be less efficient in trapping particles. For the case of four standing waves, the intensity is given by:
where
is the position vector of the points lying in the plane of the lasers. The four wave vectors are given by:
with
, where
. Notice that the four beams can have arbitrary different phase-shifts
. As long as the relative phase shifts are maintained at some fixed arbitrary values, these phase shifts do not change the nature of the structures obtained, as discussed later.
The function
of Equation (
2) is quasiperiodic since there is no integer relationship between the four wave vectors
. The intensity landscape obtained for a random choice of the phases
has a complex structure of maxima, minima and saddlepoints. The intensities of the peaks, or local maxima, have a range of values with the upper bound
. The potential energy thus has a minimum value of
with
.
The cold atoms in this region are attracted to local maxima of —i.e., the local minima of the potential energy. If one now introduces a finite density of atoms, depending on the chemical potential, only maxima corresponding to intensities bigger than a cut-off will be occupied by an atom. We will neglect fluctuations due to finite temperature and trapping of atoms in metastable configurations, and instead focus on the ideal structures one expects to find, as a function of .
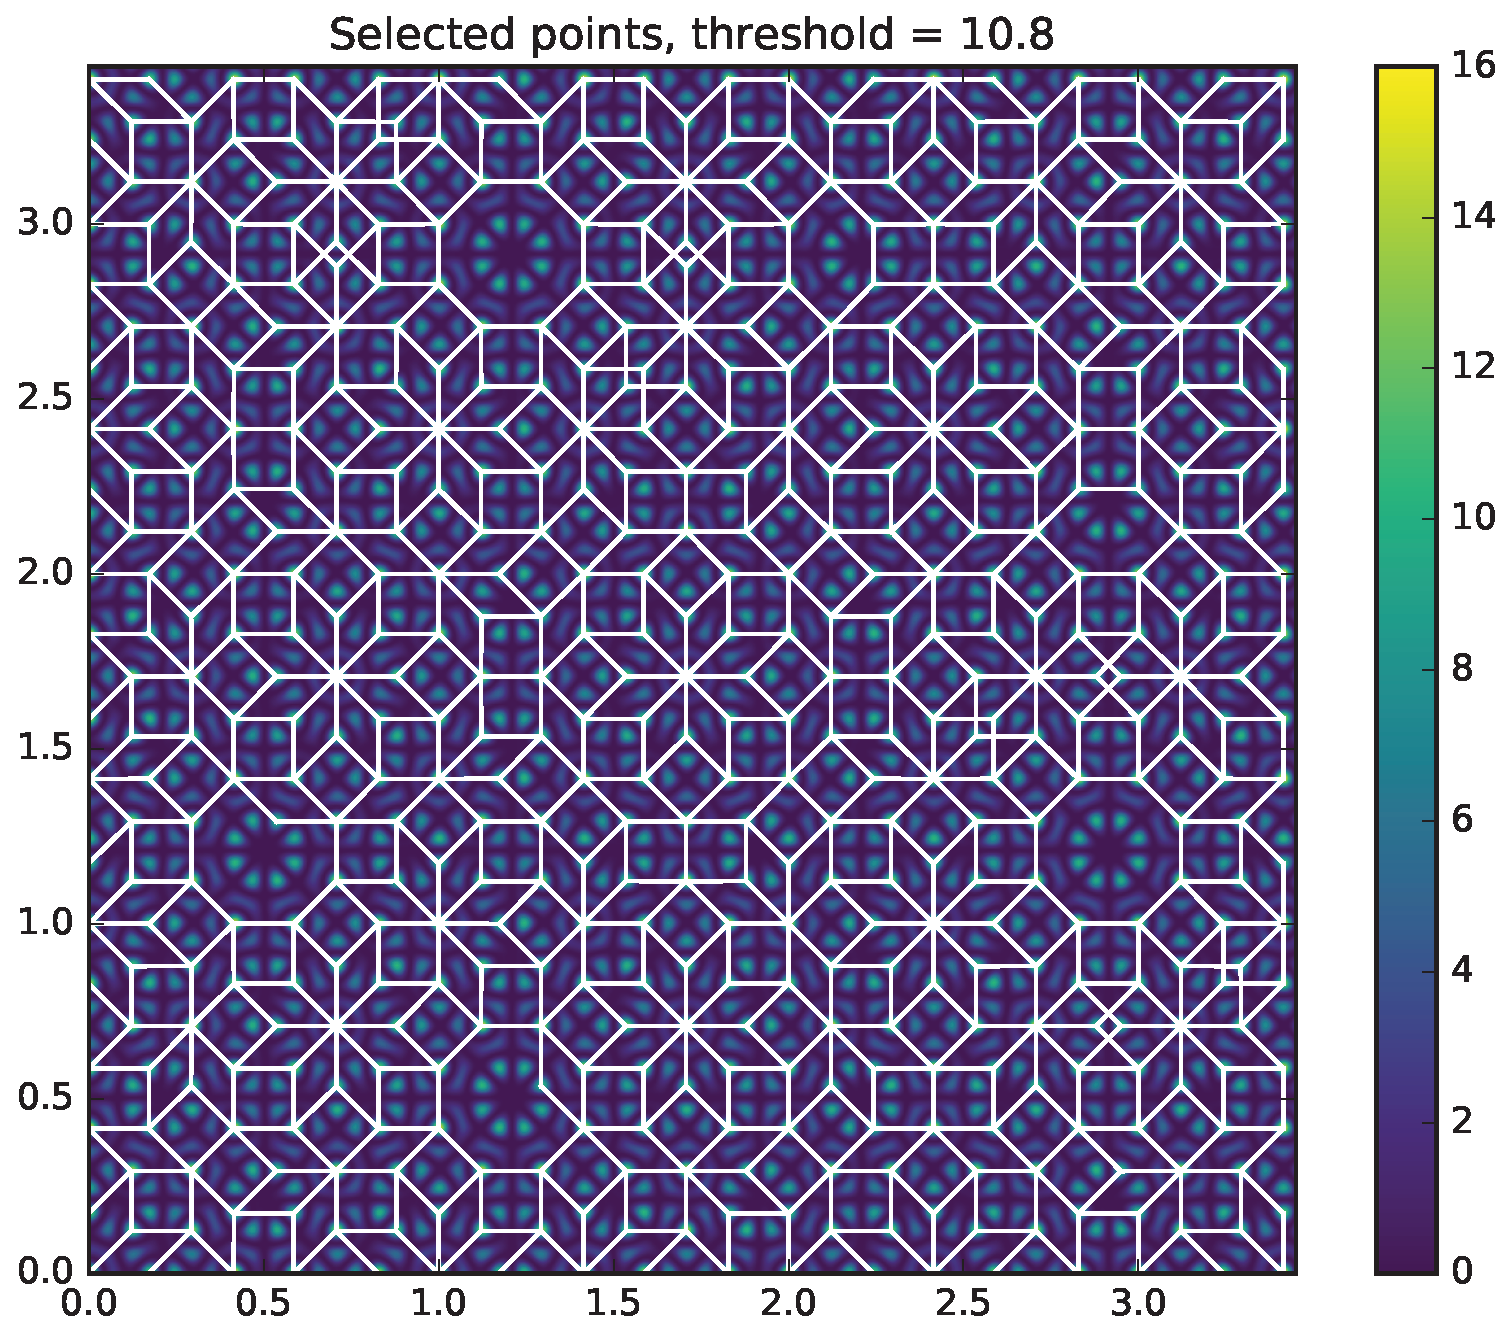
Figure 2 shows the optical tilings obtained for three representative values of the intensity cut-off:
and
. The edge-length of the tiles can be seen to increase by a discrete scale factor, the irrational number
, also called the silver mean. The tilings are shown superposed on the intensity profile, represented by a shaded plot (dark shades for small intensity). These are examples of the type of structure that we will refer to as the optical quasicrystal (OT). As can be seen from the shape of the tiles, it is closely related to the standard Ammann–Beenker or octagonal tiling (ABT) [
4,
7] composed of squares and 45° rhombuses. For larger and larger values of the cutoff, approaching
, only the largest maxima will be occupied, and the atomic density in the
plane correspondingly decreases. As the cutoff takes on successive special values in the series given in the next section, the lattice vectors increase by powers of the irrational number
α.
3. A Four-Dimensional Model for the Optical Quasicrystal
This section summarizes the model of the OT which was introduced in [
2,
3], along with some additional details, and clarifications. Our aim here will be to give a mathematical description of the optical tilings shown in
Figure 2, and calculate quantities such as the lattice vectors in terms of the cutoff intensity
. In this model, the only dimensionful parameters are
the wavelength of the laser light, which sets the length-scale, and
, which sets the energy scale in the problem. All other relevant lengths and energies can then be specified in terms of these two quantities.
Let us return to the intensity of the laser beams given by the function Equation (
2). Since the four vectors
have no rational relationships,
is a quasiperiodic function in the sense of Bohr [
8] and Besicovitch [
9]. The Fourier transform is readily obtained by expanding cosines so that the spectrum is the finite set of all combinations
.
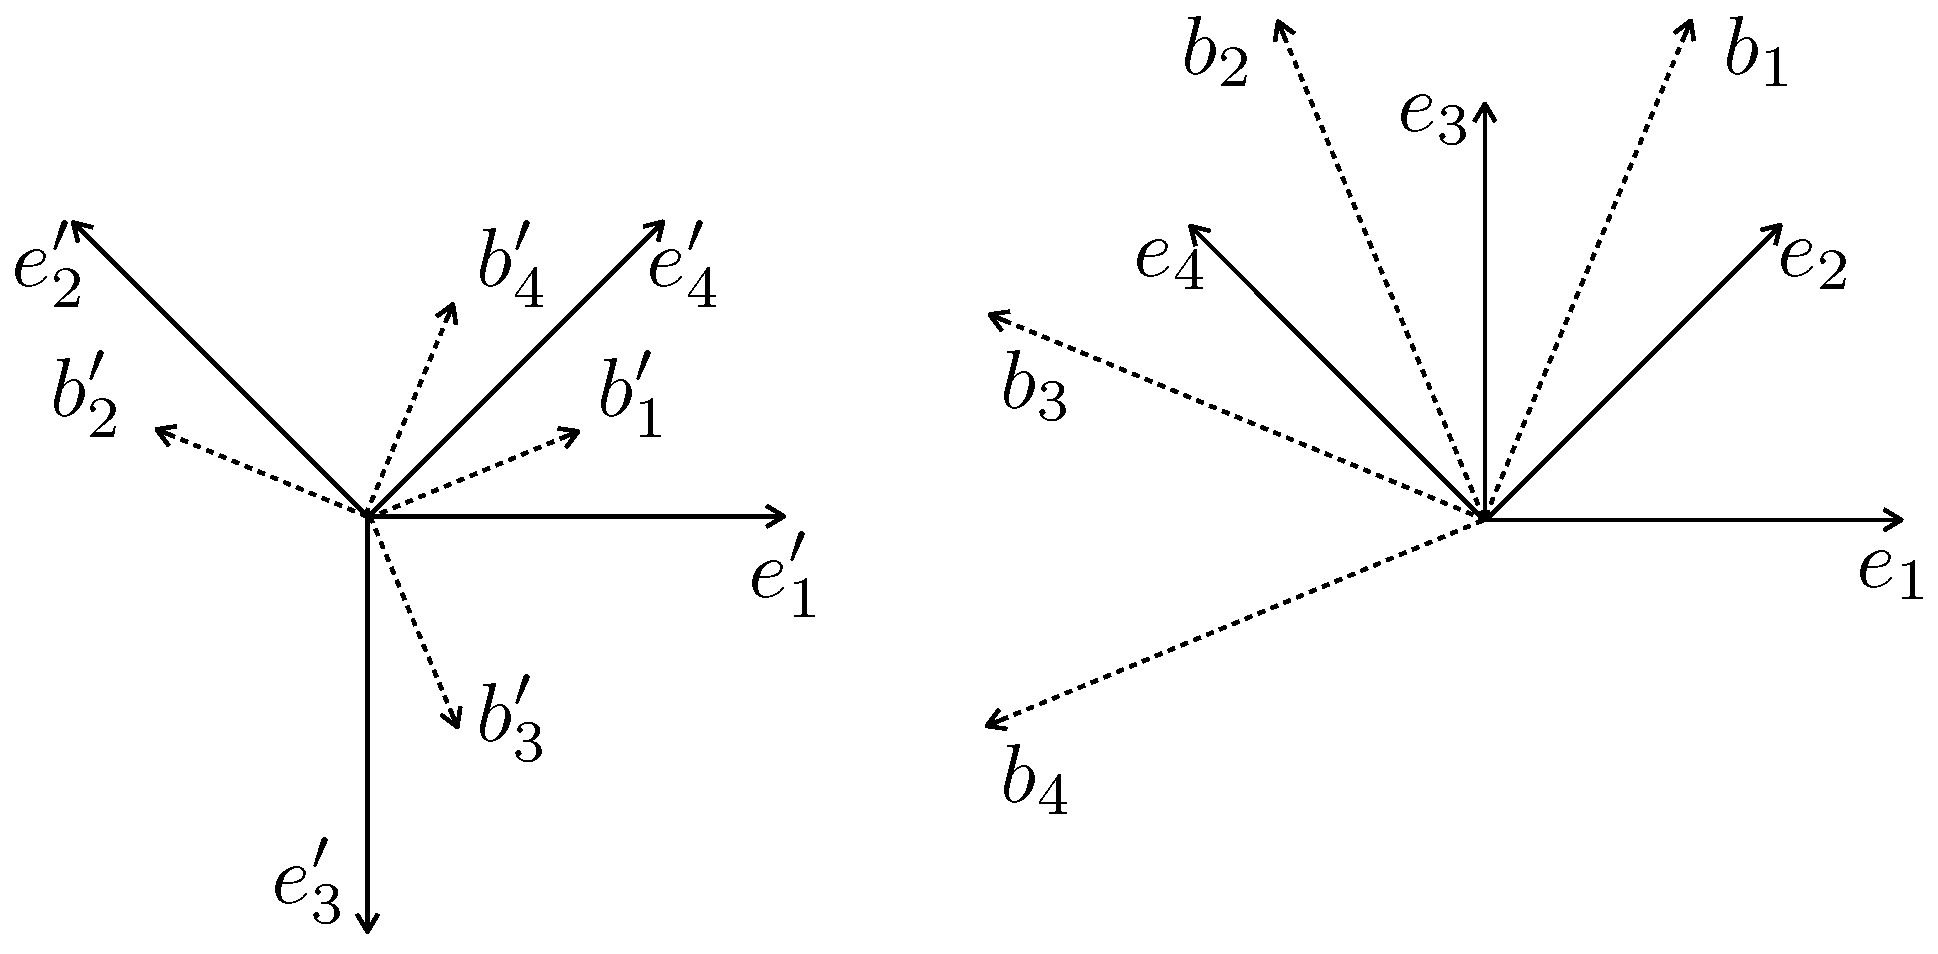
The eight-fold symmetry of
follows from the remark that a rotation
γ (see [
3]) of
maps
to
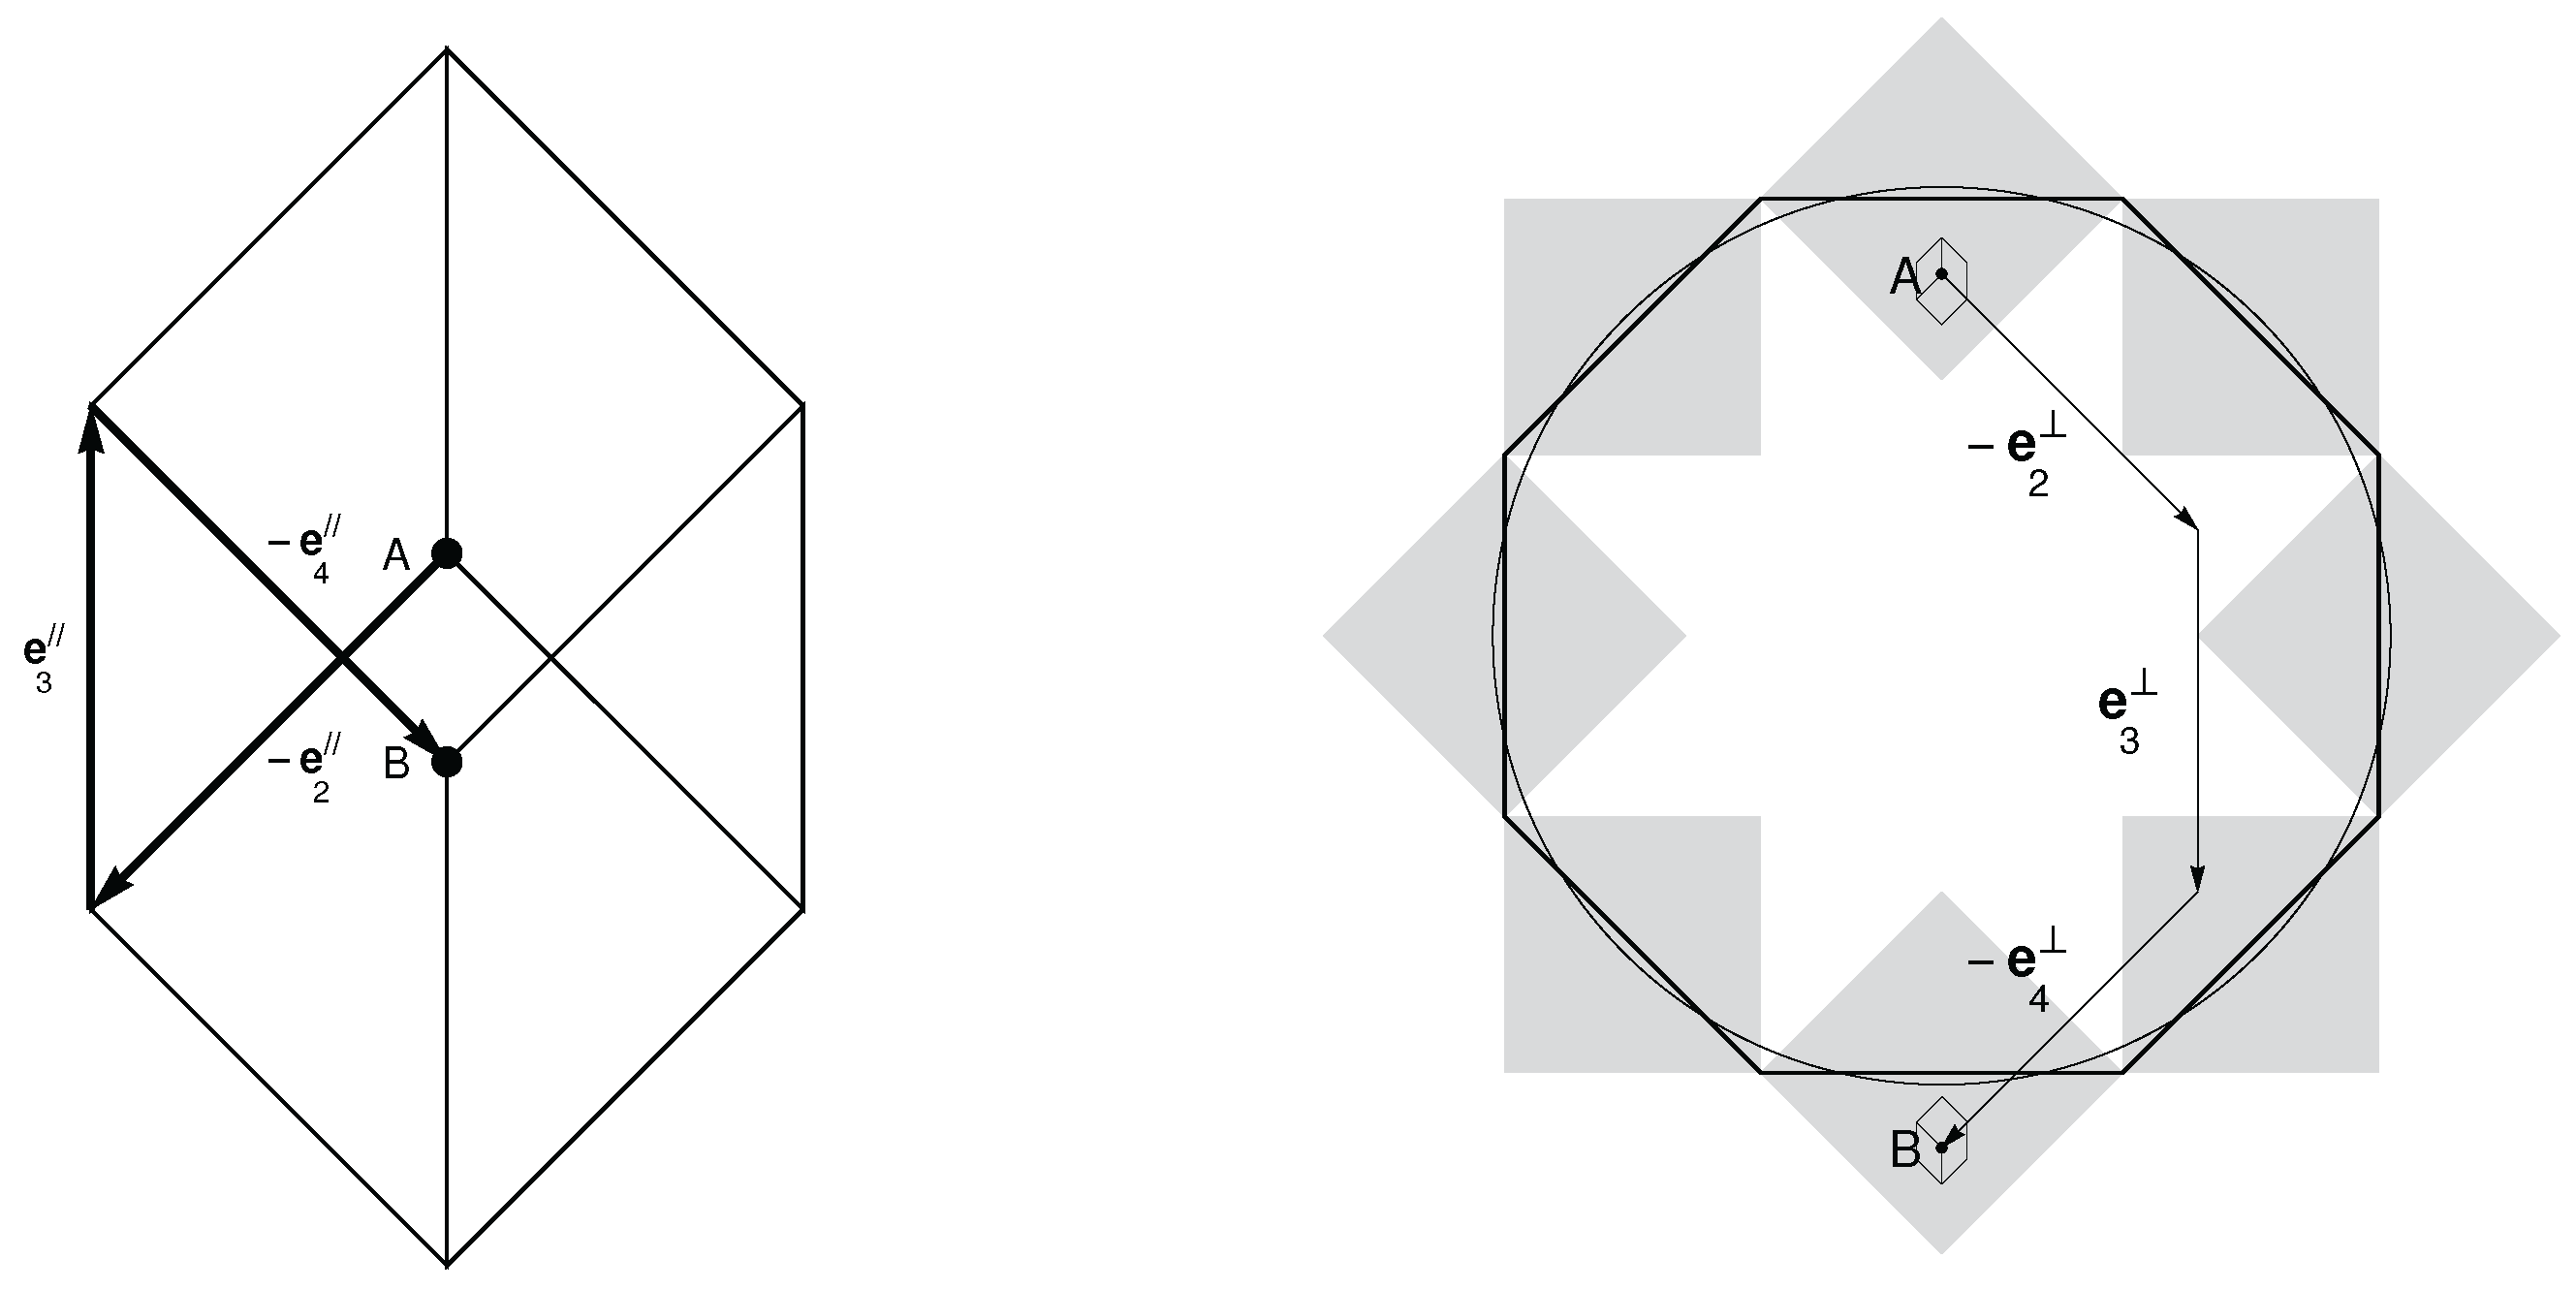
(see
Figure 3).
is also invariant by the two-fold symmetry
σ w.r.t. the
x-axis, which maps
to
. While this
symmetry is not crystallographic in 2D, it is crystallographic in the 4D space
: Lifting
γ and
σ to
gives the integer matrices:
in the standard basis
. They satisfy
and
. This 4D representation of
is reducible since
is the Cartesian product of two planes
P and
that are orthogonal and invariant. While the restriction of Γ to
P is the previous
γ rotation, the restriction to
is a rotation
of
.
One can choose orthonormal bases
in
P (the “physical space” ) and
in
(the “perpendicular space”) so that the orthogonal projections
and
, all of norm
, are as shown in
Figure 3.
Points
of
also write
in the
bases of
. The transformation is given by the following rotation
:
If and are two 4D vectors, then .
The wave vectors
are the projections in
P of orthogonal 4D vectors
, so that their magnitude is
. The intensity Equation (
2) can be obtained from the 4D periodic function
so that
is the restriction of
to the plane
P.
The maxima of
occur on points where all cosines equal 1, i.e. on the cubic lattice
, and on points where all cosines equal
, which correspond to the body centers. Let
B denote the BCC lattice of
: coordinates are either all integers or all half integers. Accordingly, the maxima
of
are located on the BCC lattice
. The vertices of
B can be written as
with
(where the
are integers) and where
T is the matrix
A basis of
B is given by the unit vectors
(
). One can check that
and that
, so that
B is invariant with respect to
and belongs to the same Bravais class as the hypercubic lattice
. Furthermore,
T commutes with the eight-fold generator Γ. The four primitive lattice vectors
of
B project onto the set
in
P, and
in
, as shown in
Figure 3. The norms of these vectors are
and
.
The condition is equivalent to a condition . If the cutoff is high enough, the last condition is fulfilled in a set of disjoint domains centered on the BCC lattice . If the cutoff is close to the absolute maximum , one can substitute the quadratic approximation . The domains are close to spheres of radius ρ given by . Their projections on P and are close to disks of the same radius.
If is a local maximum, the point belongs to a domain centered on a vertex of the BCC lattice, at a distance bounded by ρ in the quadratic approximation. These points are close to the BCC lattice, allowing for a comparison with the cut-and-project method as discussed below.
The vertices of the octagonal tiling [
7] are the projections
of 4D lattice points
such that
belongs to an octagonal window generated by the four vectors
(see [
10] for the cut-and-project algorithm). The area of this window (see
Figure 4) is
. The inflation transformation of the octagonal tiling enlarges the edge length of the tiles in
P by a factor
α, while distances in
are reduced by the same factor. Inflated octagonal tilings correspond to selection windows of area
with
.
If
is low enough and if the areas of
and
W are equal (up to inflation), a relationship between both structures can be expected. This equality ensures that the two structures have the same density of points. Using the quadratic approximation of
this condition writes:
The OT of
Figure 2 corresponds to
and 3. The circular windows
are shown in
Figure 4 for
and
, inside the window of the octagonal tiling. The criterion in Equation (
8) can be further simplified by noting that, for
, the cosine terms in
V can be expanded to second order in the distance
ρ. In this limit, the selection windows for the OT are approximately circular and the radius for the cutoff value
is given by
. It can be shown that the edges of the tiles of the
pth OT have length
. The smallest edge length
is obtained for
.
4. Fourier Transform of the OT
We now turn to the diffraction pattern of a structure obtained when atoms occupy all of the allowed vertices corresponding to a particular value of
. The general method for finding the Fourier transform and indexation of peaks is discussed for example by Katz and Gratias in [
11]. The structure factor consists of Bragg peaks whose positions are given by the reciprocal lattice of the 4D cubic lattice, and whose peak intensities are given by the Fourier Transform of the selection window. Due to the close similarity of their selection windows, the structure factor of the OT and that of the ABT are expected to be very similar, with peaks in the same positions but with slight differences in their intensities. Here, we will confine our attention to the indexing of Bragg peaks. It is interesting to observe that spherical selection windows were introduced by Grimm and Baake in the context of the diffraction patterns of quasiperiodic tilings [
12], as a useful approximation in the calculation of the structure factor. For the optical quasicrystal, in contrast, we see that the spherical window turns out to be the correct, physically imposed choice, provided only that the cut-off
is large enough.
The 4D basis vectors are
. After projection in
P, one obtains the four lattice vectors of Equation (
3):
The peaks of the structure factor
are found at positions
with the condition that
equivalent to the requirement that
be even. This condition is equivalent to saying that the positions of its Bragg peaks are those of
, the reciprocal lattice of
, after projection into
P. The values of the intensities are determined by the Fourier transform of the selection window, which is of octagonal shape for the ABT, and circular shape for the OT. The resulting differences between the two structure factors would show up only under a detailed comparison of peak intensities.
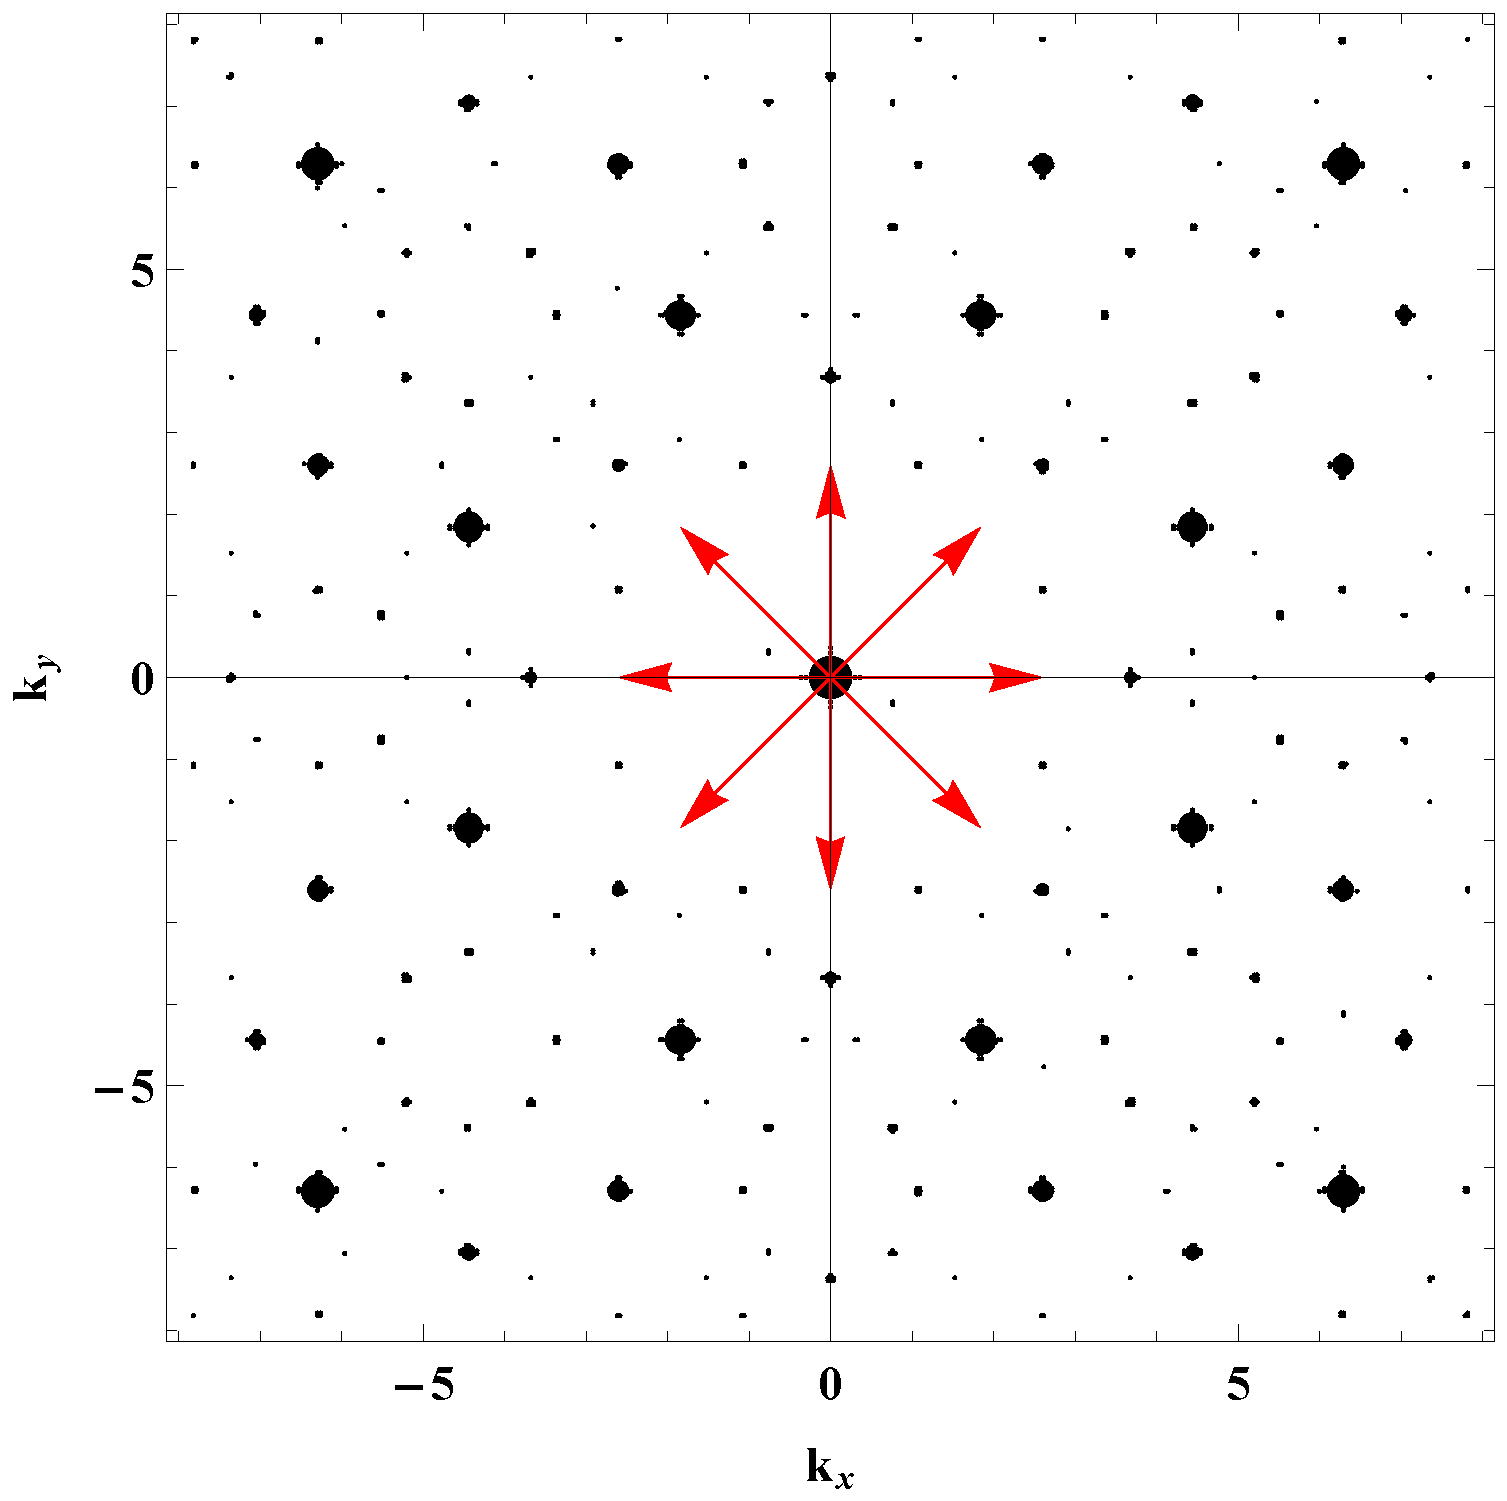
Figure 5 shows the eight vectors
, and the numerically calculated intensity function
defined by
where
N is the number of sites in the sample. The set of intense peaks nearest the origin correspond to the combinations
and permutations thereof, in accordance with the condition in Equation (
10). The structure factors of successive OT for
will be the same, only rescaled by powers of
, to take into account the inflation in real space.
5. From the Optical Tiling to the Ammann–Beenker Tiling
In the preceding discussion, we assumed that when atoms are loaded into this optical potential, they occupy sites of lowest potential energy i.e., highest intensity, at very low temperature, giving rise to the optical tiling. While overall, the intensities of the occupied peaks vary within the range
, one can define different categories of sites. It is easily seen that the typical value of the potential energy depends on the local environment, as follows. For convenience, we will describe the environment of each site by the letter A,B,... as determined by its position in the octagonal acceptance window W (see
Figure 4), and for purposes of illustration, we consider the OT for
.
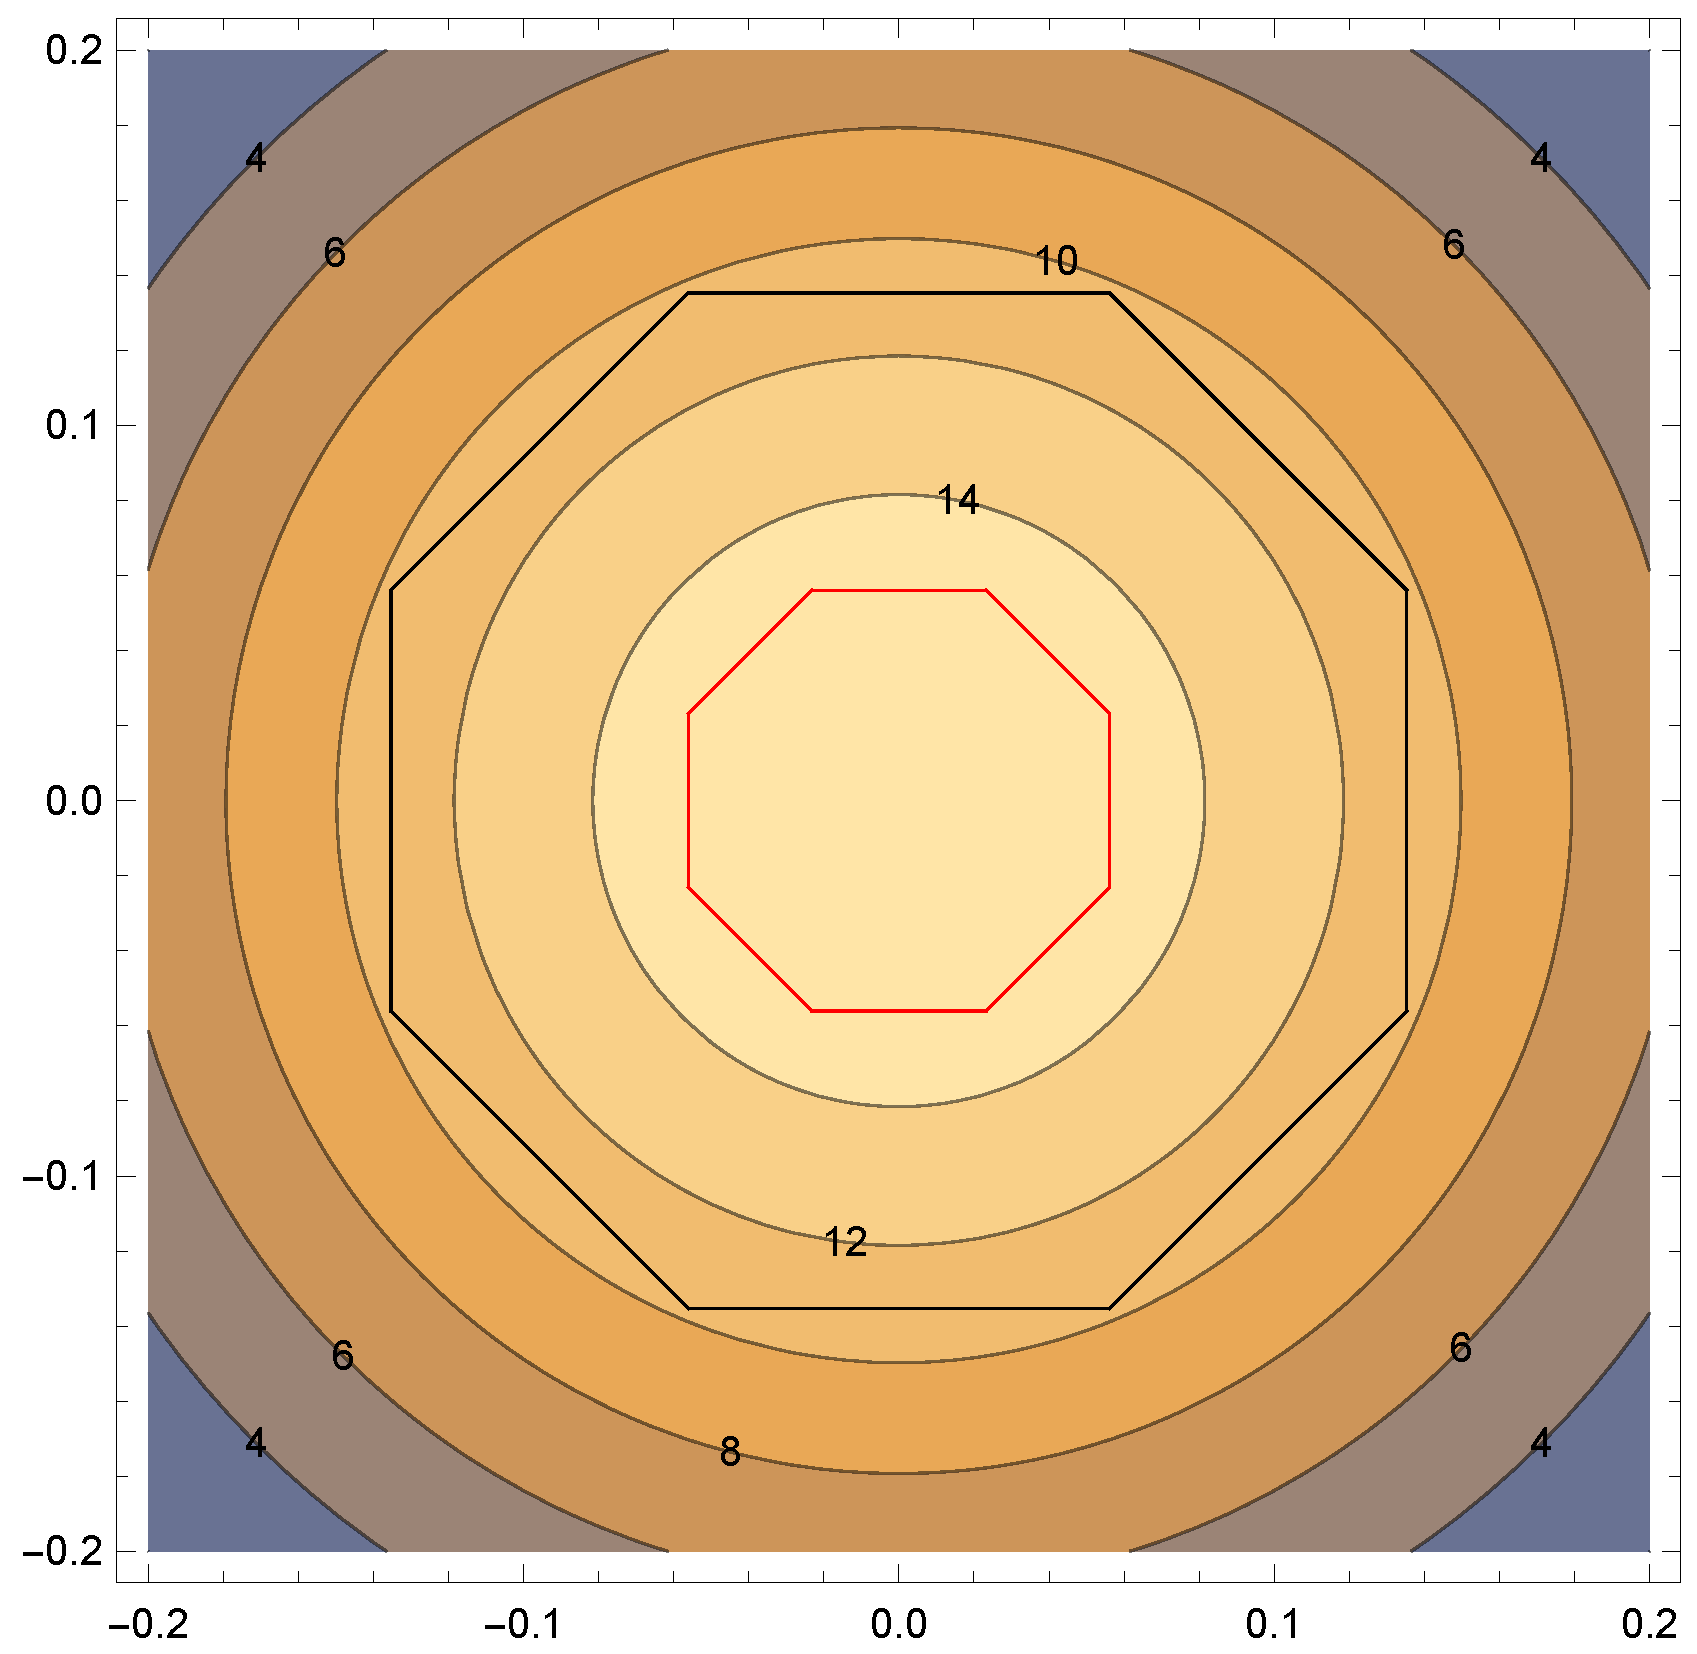
Figure 6 is a contour plot of the intensity
in perpendicular space. The value of the potential on a given site depends on its perpendicular coordinate, decreasing with the distance from the origin. For the values of the potential shown, these contours are close to circular. On the other hand, as we saw (in
Figure 4), the distance from the origin in perpendicular space coordinate tends to get larger as
z decreases. As shown in
Figure 6, the high coordination number sites (
) sites correspond to the region inside the small red octagon, and these have the highest values of intensity,
. The sites with small coordination numbers, which lie in the region between the red and black octagons, have values in the range
.
We turn now to the problem of structure differences between the Ammann–Beenker tiling and the optical tiling. These arise from the difference in shape of their acceptance windows in perpendicular space. Comparing the two acceptance domains, one sees that they overlap over most of the regions that they occupy. This ensures that a large fraction of the selected points are identical in the two tilings. The differences between the two windows arise in the outlying regions. Firstly, the difference in the selection window has the result that some sites that are present in the AB tiling are missing in the OT. This leads to the empty hexagons and larger n-gons that one sees in
Figure 2. Secondly, pairs of “twin-sites” separated by a very short distance
δ appear in the OT, whereas in the AB tiling only one of the members of these pairs is present, the other being related by a “phason-flip”. These two types of differences are shown in detail in
Figure 7. Differences of intensity of the occupied and unoccupied sites are too small to be detected visually. For example, in
Figure 7a, the intensities of the twin-sites are 10.8
(left site) and 11.1
(right site). Similarly, in
Figure 7b, the intensities of the bright spots in the center of the vacant hexagonal region are 10.5
and 10.6
. We note that the two defects shown in
Figure 7 are situated on the same vertical worm of the ABT.
In summary, the difference in the shape of the selection windows leads to the appearance of inhomogeneities: as compared to the AB tiling, the OT has larger density fluctuations. The local intensity for the members of a pair of twin-sites are slightly different because their distances from the origin in perpendicular space are slightly different, as shown in
Figure 8. Similarly, it is easy to show that the “vacant” site inside, say, an empty hexagon has a local intensity that lies just below the cut-off value.
Small local fluctuations could lead to depopulating the twin-sites on the one hand, and populating the empty sites, on the other. This suggests that a way to remove the observed defects in the OT would be to turn on small short-range repulsive interactions between atoms. One can, indeed, tune the local interaction strengths between atoms in cold gases using Feshbach resonances [
5]. In the standard Hubbard model for fermions, the interaction energy is nonzero when the two fermions are on a single site. In the extended Hubbard model, the interaction terms concern particles on nearest neighbor sites. Both kinds of terms can be simulated in cold atom gases. By varying the relative strength of the hopping and onsite interaction terms, it is possible, for example, to induce a superfluid to Mott insulator transition in a bosonic system [
13]. Extensions of the Hubbard model to further near neighbors are reviewed in [
14].
Adding a small short-range repulsive interaction energy will make it unfavorable to occupy simultaneously both sites of the twin pairs. One of the atoms corresponds to a larger distance from the origin in perpendicular space, and therefore has a slightly higher onsite energy than its twin. It will therefore move to an unoccupied site with similar onsite energy, corresponding to one of the empty polygons. Let us make the reasonable assumption that all pairwise nearest neighbor interactions are negligible, except for those between the atoms on twin-sites. Let the strength of the repulsive energy for a pair of twin-sites be
. Increasing
will make it increasingly unfavorable to occupy simultaneously both sites of a twin pair. The
value needed to shift an atom to an empty site can be estimated by the following argument. Consider a pair of twin-sites, whose positions in the perpendicular space are known, for example as in
Figure 8. We now consider the change in the energy of the system
if one of the twin-sites is vacated by the atom, which migrates to a defect “vacant” site. In this move, an atom is removed from the site whose coordinate
lies within the cutoff radius but outside the octagonal window, and it is replaced elsewhere, on a site whose coordinate
lies outside the cutoff radius but within the octagonal window. Such a move costs potential energy, and the change can be calculated by using the projected form of the potential energy in perpendicular space:
where
and
are the radial distances of the initial and final positions of the atom in perpendicular space, and where we used the quadratic approximation of the potential. One can calculate the maximum value of this difference, by taking
to be on the midpoint of an edge of the octagonal window, and
on a vertex. The difference of distances can then be readily calculated, as a function of
p. One thus finds that
. In order for such a hop to occur, the gain in onsite potential energy has to be compensated by the reduction of energy due to the destruction of a twin pair, namely,
. This argument provides an upper bound to the value of the repulsive interaction needed to eliminate twin pairs. For
, for example, one gets
, and the values for larger
p are even smaller. This estimate shows that the repulsive interaction needed would be quite small relative to the onsite potential energy term.
To transform the OT into the AB tiling, in summary, one must introduce a small additional nearest neighbor interactions, over and above the optical potential. As we noted, in cold atom systems, such repulsive interactions can be introduced and experimentally controlled. The experimental set-up with the laser potential and repulsive interactions appears to be a feasible proposition for obtaining a perfect defect-free Ammann–Beenker tiling, at least in principle. In practice, there will be problems associated with slow dynamics, trapping in metastable configurations, and thus possibly a certain amount of disorder at finite temperatures.
The dynamics of this system can be described, to good approximation, by a tight-binding model, using the basis set of the Wannier states defined on the local minima of the optical lattice. As we have already pointed out, the values of the diagonal terms (the onsite energies), depend on the local environment (coordination number). The degree of localization of the Wannier functions depends on the depth of the potential minimum, and also varies to a limited extent. As for the hopping amplitude between two neighboring sites, they depend on several factors: on the distance between the sites, on the profile of the potential, and on the degree of localization of the local Wannier orbitals. These amplitudes will, therefore, have a variation of values for different pairs of sites. To evaluate the size of the spread of values, a detailed calculation is necessary. However, it can be argued, as in [
3], that the hopping amplitudes are expected to fall off quickly with the distances and that the two important processes correspond to hopping along edges and across the small diagonal of the rhombus.
With the experimental and theoretical caveats mentioned above, we see that it is theoretically possible to simulate tight-binding Hamiltonians for fermions and bosons on a perfect octagonal tiling. This quasiperiodic tiling has been a subject of theoretical investigation since the mid-eighties. To cite only a few representative works, spectral properties and quantum dynamics in tight binding Hamiltonians have been investigated by many authors using a variety of techniques [
15,
16,
17,
18,
19]. Many body effects in quasicrystals are also a question of current interest. The effect of Hubbard interactions [
20], and, more recently, the fate of a local magnetic impurity [
21] in this tiling, were examined, motivated by recent experimental work in heavy fermion quasicrystal compounds [
22,
23]. It should be possible also to simulate and study the 2D quasiperiodic antiferromagnetic Heisenberg spin model, for which theoretical works have predicted novel ground state properties [
24]. Effects of disorder, magnetic fields, etc. could also be systematically studied by means of a cold atom simulation.
