1. Introduction
Quasicrystals in general and icosahedral (i-) phases in particular have attracted the interest of scientists, not only because of their exotic lattice structure. A question that arises from the very beginning is why nature should prefer quasiperiodic to periodic order. The lattice structure of these phases is based on an icosahedron, i.e., a polyhedron that has fivefold symmetry and cannot serve as a unit cell of a periodic crystal. It is clear that minimization of the internal energy cannot be achieved without a decrease in the kinetic energy of free charge carriers. Now it is well known that the formation of icosahedral phases does lead to a significant reduction in the metallic properties of initial metals.
Due to this reduction, the icosahedral phases differ from conventional metals, both quantitatively and qualitatively. The main quantitative difference lies in the fact that these phases have an anomalously low (~10
19–20 cm
−3) concentration of conduction carriers in the low temperature limit; i.e., the average valence (electrons/atom) in the alloy at low temperatures is
e/
a ~ 10
−3. As a consequence, the icosahedral phases have a low, but finite (~100 Ω
−1·cm
−1), metal-like conductivity, as well as low values of the Pauli susceptibility and electronic heat capacity. These differences are reflected in the hypothesis of the pseudogap. According to photoelectron spectroscopy experiments, the pseudogap has a width of ~1 eV [
1].
The main qualitative differences are associated with a significant variability of the number of charge carriers at finite temperatures. The concentration of thermally induced charge carriers (TICC) increases very rapidly with increasing temperature. At 1000 K, this concentration differs only slightly from the atomic density of the substance; i.e., the average valence in the alloy at high temperatures is
e/
a ~ 1. Consequently, an increase in the temperature leads to a very rapid increase in the electrical conductivity (negative TCR—temperature coefficient of resistivity) and to a very rapid enhancement in the paramagnetism. The amplitudes of these TICC-associated giant thermal effects are many times larger than those of the corresponding parameters of metal-like ground state carriers [
2].
Since there are various aspects of the lattice structure, three scenarios of the reduction nature of the metallic properties in quasicrystals have been discussed in the literature. On the one hand, the quasilattice has no long-range periodic order in the arrangement of atoms. In the general case, this means that quasicrystals are similar to disordered systems in which the Anderson localization can play a significant role [
3]. On the other hand, quasicrystals have a long-range quasiperiodic order. Thus, they can be considered as a limiting case of the Hume-Rothery phases, where all wave vectors of the ideal quasilattice are vectors of reflection. At the Fermi level, ideally, there arises an energy gap, whereas in fact a pseudogap is formed. Finally, quasicrystals have an icosahedral short-range order. The reduction in the metallic properties can be associated with the confinement of initially valence electrons through the exchange coupling of electrons in the formation of chemically saturated (covalent) bonds [
4,
5,
6].
A large number of experimental studies into the physical properties of stable icosahedral (i)-phases were performed soon after the discovery of these phases. The result of these studies was somehow paradoxical: no physical properties of i-phases assumed from their long-range quasiperiodic nature were identified [
7]. Therefore, the long-range icosahedral order and the Hume–Rothery–Jones mechanism (a contact between the Brillouin zone boundaries and the Fermi surface) should be excluded from consideration, both based on the above mentioned paradox and on the fact that TICC-associated thermal effects are observed at temperatures higher than the melting temperature where the zone structure is destroyed [
8,
9]. The results of numerous experiments carried out to investigate the effect of quasilattice structural perfection on the electrical properties of quasicrystals (see [
2] and references therein) also allow the structural disorder and the Anderson localization mechanism to be excluded from consideration. The reasoning is quite simple. The effect exerted by a structural disorder on the electrical conductivity of quasicrystals is opposite to that of the Anderson mechanism.
Insensitivity of TICC-associated effects to the aggregate state means also that the structure-forming factor of these effects is the short-range order in the spatial arrangement of atoms. Along with that, the following facts should be taken in consideration. Reference [
10,
11] provided a direct evidence of covalent bonds in the electron density distribution of AlMnSi and AlReSi icosahedral quasicrystalline 1/1 cubic approximants using a combination of the maximum-entropy method and the Rietveld method. In reference [
12], the covalence in AlPdRe quasicrystals was experimentally confirmed from the atomic density and the quasilattice constant. Based on the data obtained, a conclusion was made that localization via exchange pairing is a dominant factor of the formation of the electronic structure of phases with the icosahedral short-range order and that pseudogap is a consequence of such localization.
Thus, among the above scenarios, the localization through the exchange coupling, which was justly called neither recurrent [
5] nor chemical [
6], but the Heitler-London (HL) localization by the authors of the first quantum mechanical theory of covalent binding [
13], is considered to be the most possible scenario. Accordingly, the distinctive properties of i-phases should be associated with spatially localized electron excitations.
2. Features of the Electronic Specific Heat Capacity
Calorimetry has been traditionally considered an effective tool that provides information on the mechanisms of energy absorption by elementary electronic and lattice excitations. Therefore, calorimetric investigations were performed for a number of quasicrystalline compounds with different chemical compositions and structural qualities in various temperature ranges from ultralow temperatures to melting points [
14,
15,
16,
17,
18]. Despite a large variety of objects, all these investigations share a common trait. It has been assumed that the electronic component of the specific heat of quasicrystals over the entire range of temperatures is determined by the contribution γT linear in the temperature, where γ is the Sommerfeld coefficient. As is known, this contribution is rather small. For typical metals at a charge carrier concentration of ~10
23 cm
–3 and room temperature, this contribution is no more than 0.5% of the lattice specific heat [
19]. For quasicrystals, the corresponding contribution is even smaller and does not exceed 0.1%. This contribution was ignored, and the entire experimentally measured specific heat was considered to constitute the lattice specific heat.
Possibly, the approximation that the lattice plays a dominant role does not involve a large error but requires the justification for quasicrystals. The point is that the Sommerfeld model describes metal systems with a constant number of charge carriers. According to indications of a finite residual resistance and a linear electronic contribution to the specific heat at low temperatures, the quasicrystals are metals; however, they do not belong to systems with a constant number of charge carriers. At moderate and high temperatures, the number of TICCs can be several tens of times larger than the number of conduction band electrons in the ground state (T = 0 K) of the system [
2].
Earlier we conducted a study of the specific heat capacity of quasicrystals of the Al-Cu-Fe system, with icosahedral phase samples having the Al63Cu25Fe12 and Al62Cu25.5Fe12.5 nominal compositions. The purpose of these experiments was to verify whether the linear-in-temperature metal-like contribution γТ is the sole contribution to the electronic heat capacity of quasicrystals, or TICCs are capable of making their own contribution.
It is obvious that, if the heat capacity of singular electronic excitations exists, it will manifest itself as the excess heat capacity with respect to the sum of the lattice heat capacity
Clat and the metal-like heat capacity of ground state conduction electrons C
ml = γT, that is,
At the first stage, the measurements of the heat capacity and thermal expansion coefficient, which is necessary to convert C
p into C
v, were performed in the temperature range from 1.5 to 400 K. It is a well-studied region, where a noticeable increase in the electrical conductivity (negative TCR) and an enhancement in the paramagnetism have been observed and where, consequently, a singular contribution can manifest itself. It was found that the inclusion of the lattice heat capacity C
lat within the approximation of the Debye model leads to a very strong dependence of the final result on the model assumptions. To avoid this difficulty, we assessed a contribution of the lattice heat capacity C
lat in the approximation of the empirical Gruneisen law, which implies a linear relation of the lattice heat capacity to the linear expansion coefficient. Details can be found in [
20,
21].
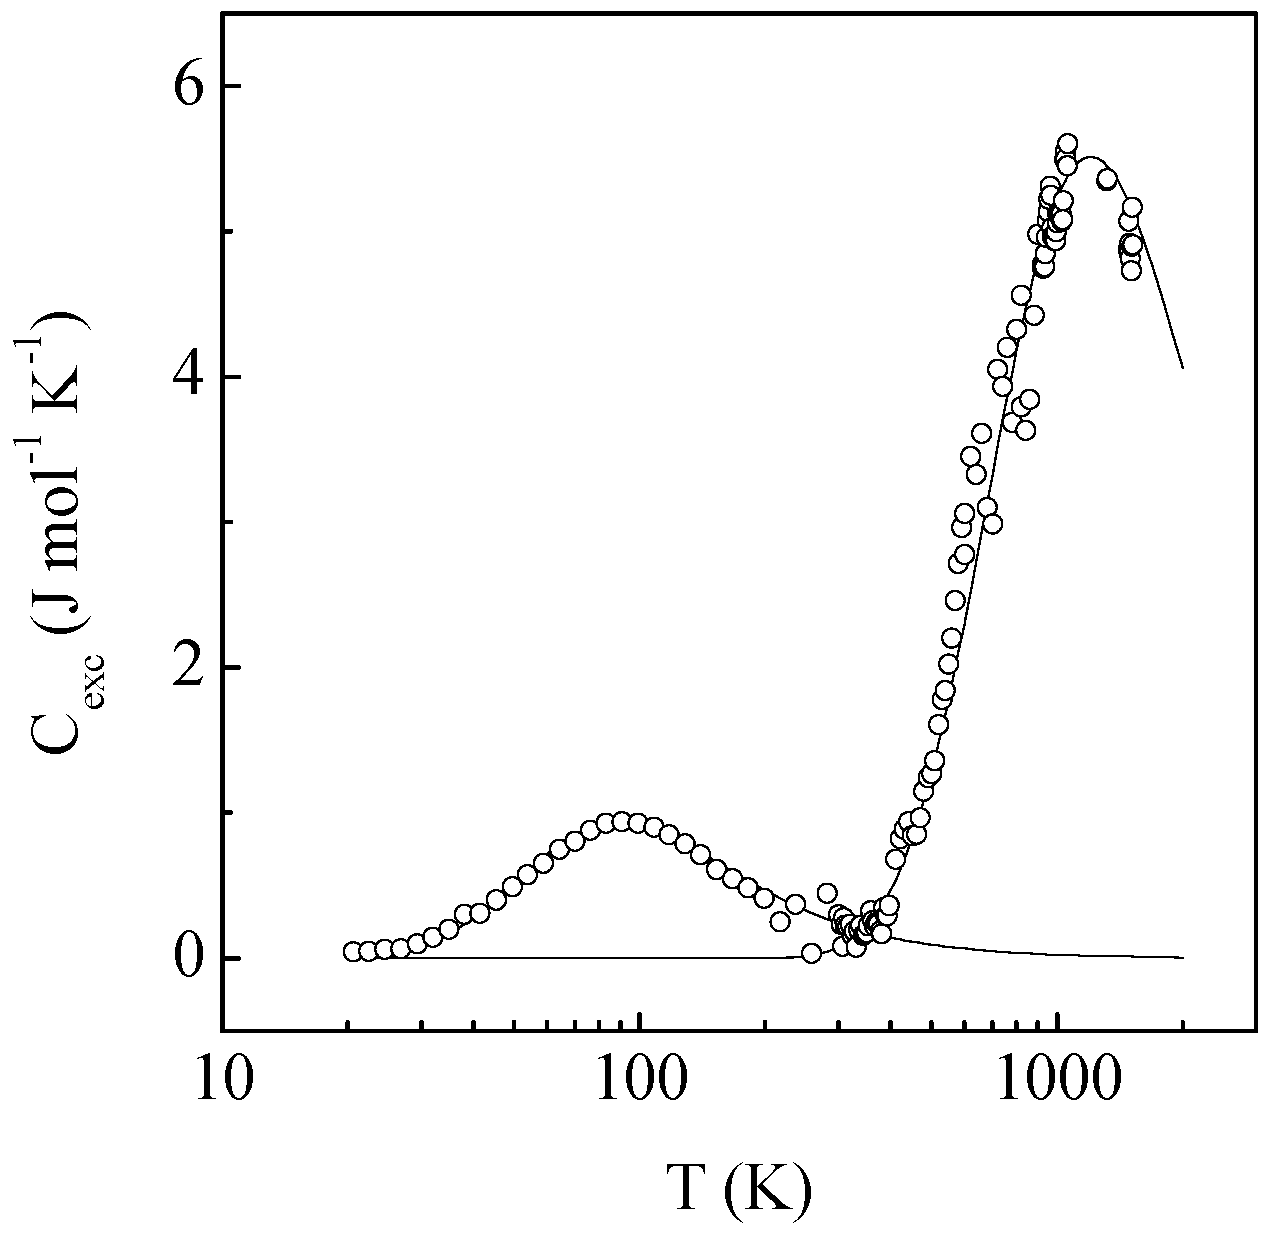
The result turned out to be remarkable in two respects. On the one hand, the excess heat capacity is a curve with a maximum at about 90 K (
Figure 1), which is well approximated by the Schottky function in the simplest case of two level excitations. This is shown by a solid line in
Figure 1. On the other hand, the excess heat capacity almost completely disappears at near room temperature, whereas the singular thermal effects in both the electrical conductivity and the paramagnetism continue to increase with increasing temperature up to 1000–1200 K [
2].
In order to clarify the situation, it was necessary to extend the calorimetric experiment to the high temperature range of 300–1000 K. We discovered that the excess heat capacity also appears and clearly manifests itself in the total heat capacity C
total at high temperatures significantly exceeding the Dulong-Petit limit. We determined the excess heat capacity in this temperature range with respect to this limit. The asymptotic approximation to this limit may be assessed using the Debye model, exactly which we chose to perform. Details can be found in [
8,
18].
As a result, we have observed a peculiar pattern. The high temperature excess heat capacity (see
Figure 1) rather rapidly increases from 400 K, passes through an inflection point in the region of 750 K, and then continues to increase more slowly to the boundary of the experiment at 920 K. The experimentally revealed portion of the curve resembles the ascending branch of the Schottky thermal anomaly, but the further course of the curve remains unclear [
22].
We performed further heat capacity measurements up to the region of 1650 K, which significantly exceeds the melting temperature of the substance (1280 K). The reason is that melting is preceded by solid phase structural transformations. The endothermic effects of these transformations in the temperature range of 1100–1280 K are so strong that the behaviour of the “base line” of the actual heat capacity of the substance within the boundaries of the solid state becomes undefined. The extension of the experiment further along the region of melts showed that the excess heat capacity of melts is a decreasing function of the temperature, i.e., the excess heat capacity curve has a maximum at about 1200 K and resembles the Schottky anomaly. The approximation by the Schottky function in the temperature of 400–1650 K is also shown by a solid line in
Figure 1. It is quite satisfactory. Details of the experiment and the analysis results can be found in [
8,
9].
The results of all stages of the calorimetric experiment being generalized are shown in
Figure 1. The resulting C
TLE (T) curve is double peaked. It is unlikely that the heat capacity is a continuous function of the temperature. Rather, it consists of two functionally similar, but not interconnected parts; therefore their sum can be approximated by two contributions of the Schottky type [
23] in the form of Equation (2) with excitation energies δE
1 = 0.02 eV and δE
2 = 0.25 eV, respectively.
According to the traditional treatment of the Schottky anomalies [
23], the system under consideration has a few types of two-level excitations. They can be phason excitations, electron excitations or crystal field induced splitting of atom level excitations [
14,
15,
16,
17,
22]. We noticed that the two-level excitations (TLE) density determined from the excess heat capacity is very close to the TICC density determined from the Hall-effect [
20]. This is why we prefer electronic excitations to all other possibilities. We thereby postulated that the system under consideration has a few types of two-level electron traps—energetically and spatially well-localized states. The source of these traps may well be covalent binding mentioned above. The source of two-level excitations (TLE) may well be the splitting of the covalent binding state into “conjugated” (bonding/antibonding) levels.
In that case, the revealed features of the electron heat capacity turn out to be in good agreement with the HL-localization scenario.
3. A Two-Component Model of the Electronic Structure
In order to see whether the TLE concept provides a better understanding of the quasicrystals physics, we have considered a strongly structured density of states (DOS) model obtained by a formal superimposition of two sort of electronic spectra—continual and discrete. The continual spectrum is represented by the conduction band with a large pseudo-gap; the discrete one is represented by a set of extremely narrow pairwise conjugated levels—ground and excited—centred with respect to EF. By suggesting that HL-localization (not the pseudogap) is the electron stabilizing factor of the quasilattice, we postulated also that the continual and discrete components are autonomic subsystems, i.e., the thermally activated carriers do not get into the conduction band. They propagate on the excited levels of the traps by hopping or tunnelling.
It was surprising to discover that this naive model leads to highly interesting implications in understanding a number of experimental observations [
24,
25]. Let us briefly consider the main observations, which reveal the interconnection of the distinctive thermal effects with TLE density.
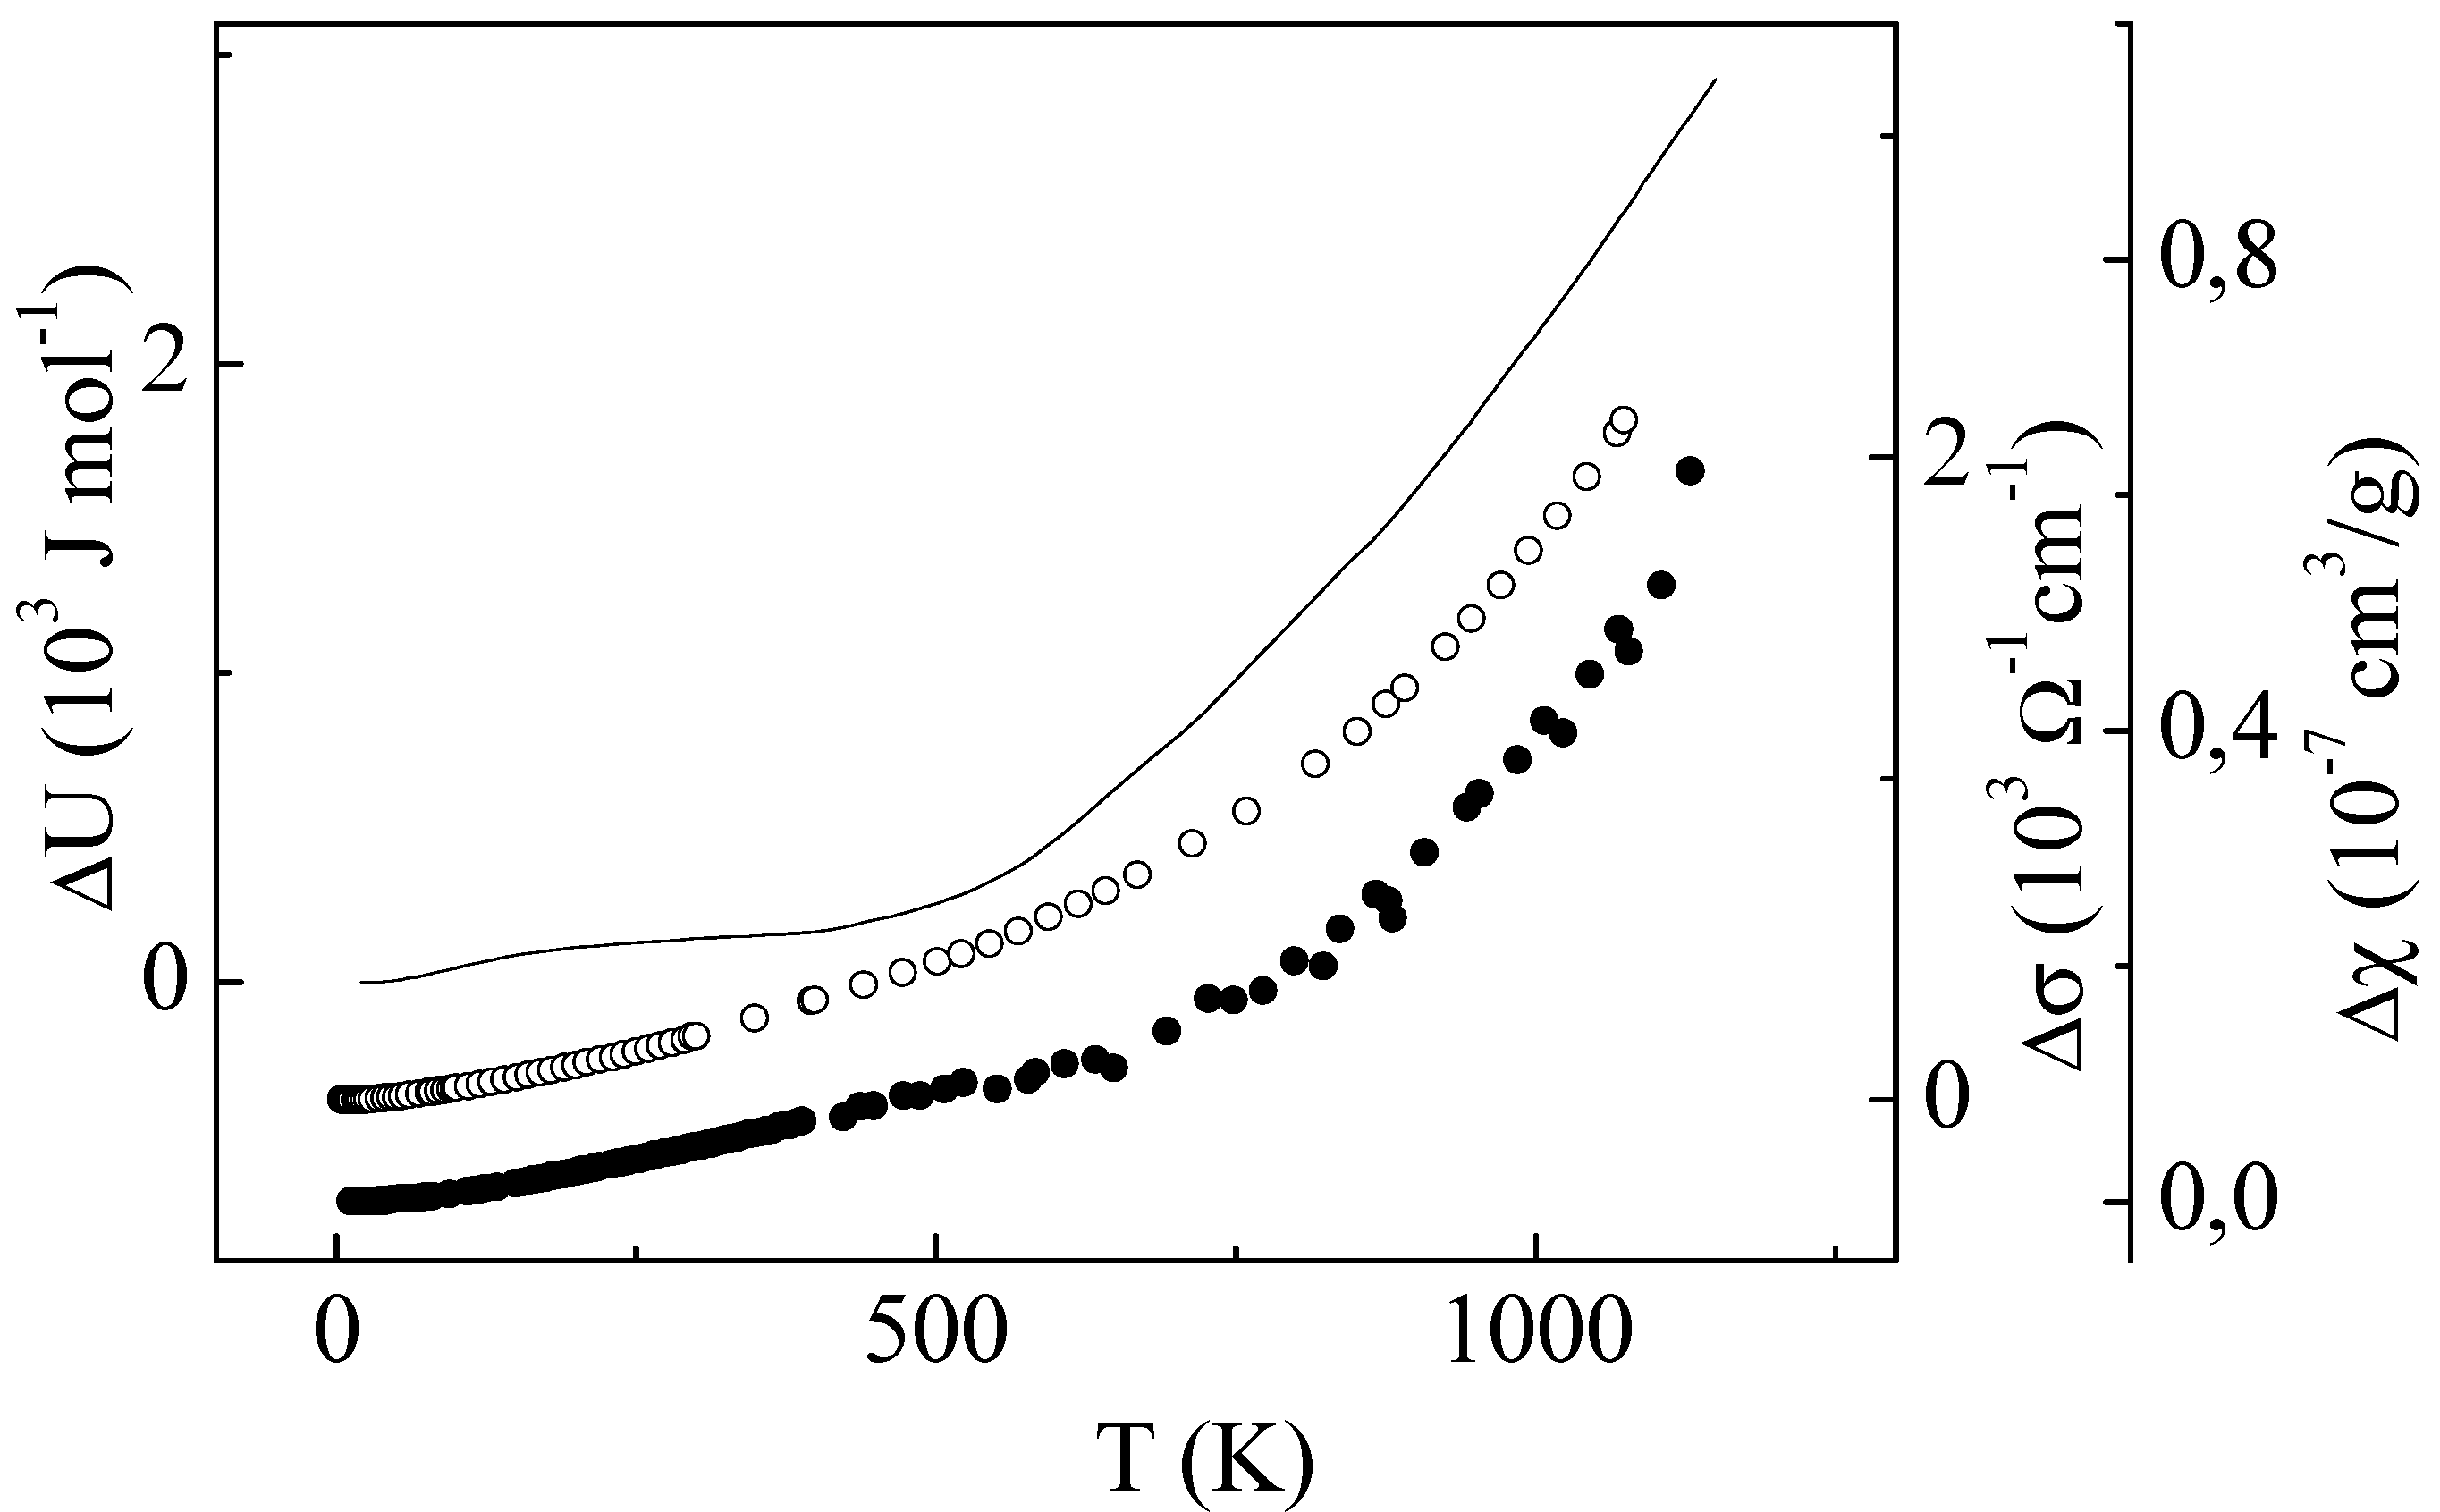
The heat capacity, as is known, reflects the rate of change in the internal energy of the system and, accordingly, the number of TLEs with variations in temperature. Therefore, during each stage of the investigation, we analysed the behaviour of the quantities that can be linearly related to the TLE concentration, namely, the increment in the internal energy of the system ΔU, the increment in the electrical conductivity Δσ, the increment in the magnetic parameter Δ(χ
T), and the increment in the inverse Hall effect Δ(1/
RH) in the specified temperature range [
22]. With the attainment of the complete picture of the excess heat capacity and its approximation by two Schottky anomalies, there appeared a unique possibility to demonstrate this relation as a whole.
Figure 2 shows the temperature-induced components of the electrical conductivity, magnetic susceptibility and singular part of the internal energy U
TLE(T). The latter dependence was obtained by the numerical integration of the experimental curve C
TLE(T). Well-coordinated behaviour of all the curves is evident. On the other hand, the dependence U(T) differs by obvious signs of alternating curvature, and the origin of this behaviour is clear enough. Since the singular heat capacity
CTLE, according to Equation (2), consists of two functionally similar parts, the temperature dependence of the number of TLEs also consists of two functionally similar contributions in the form:
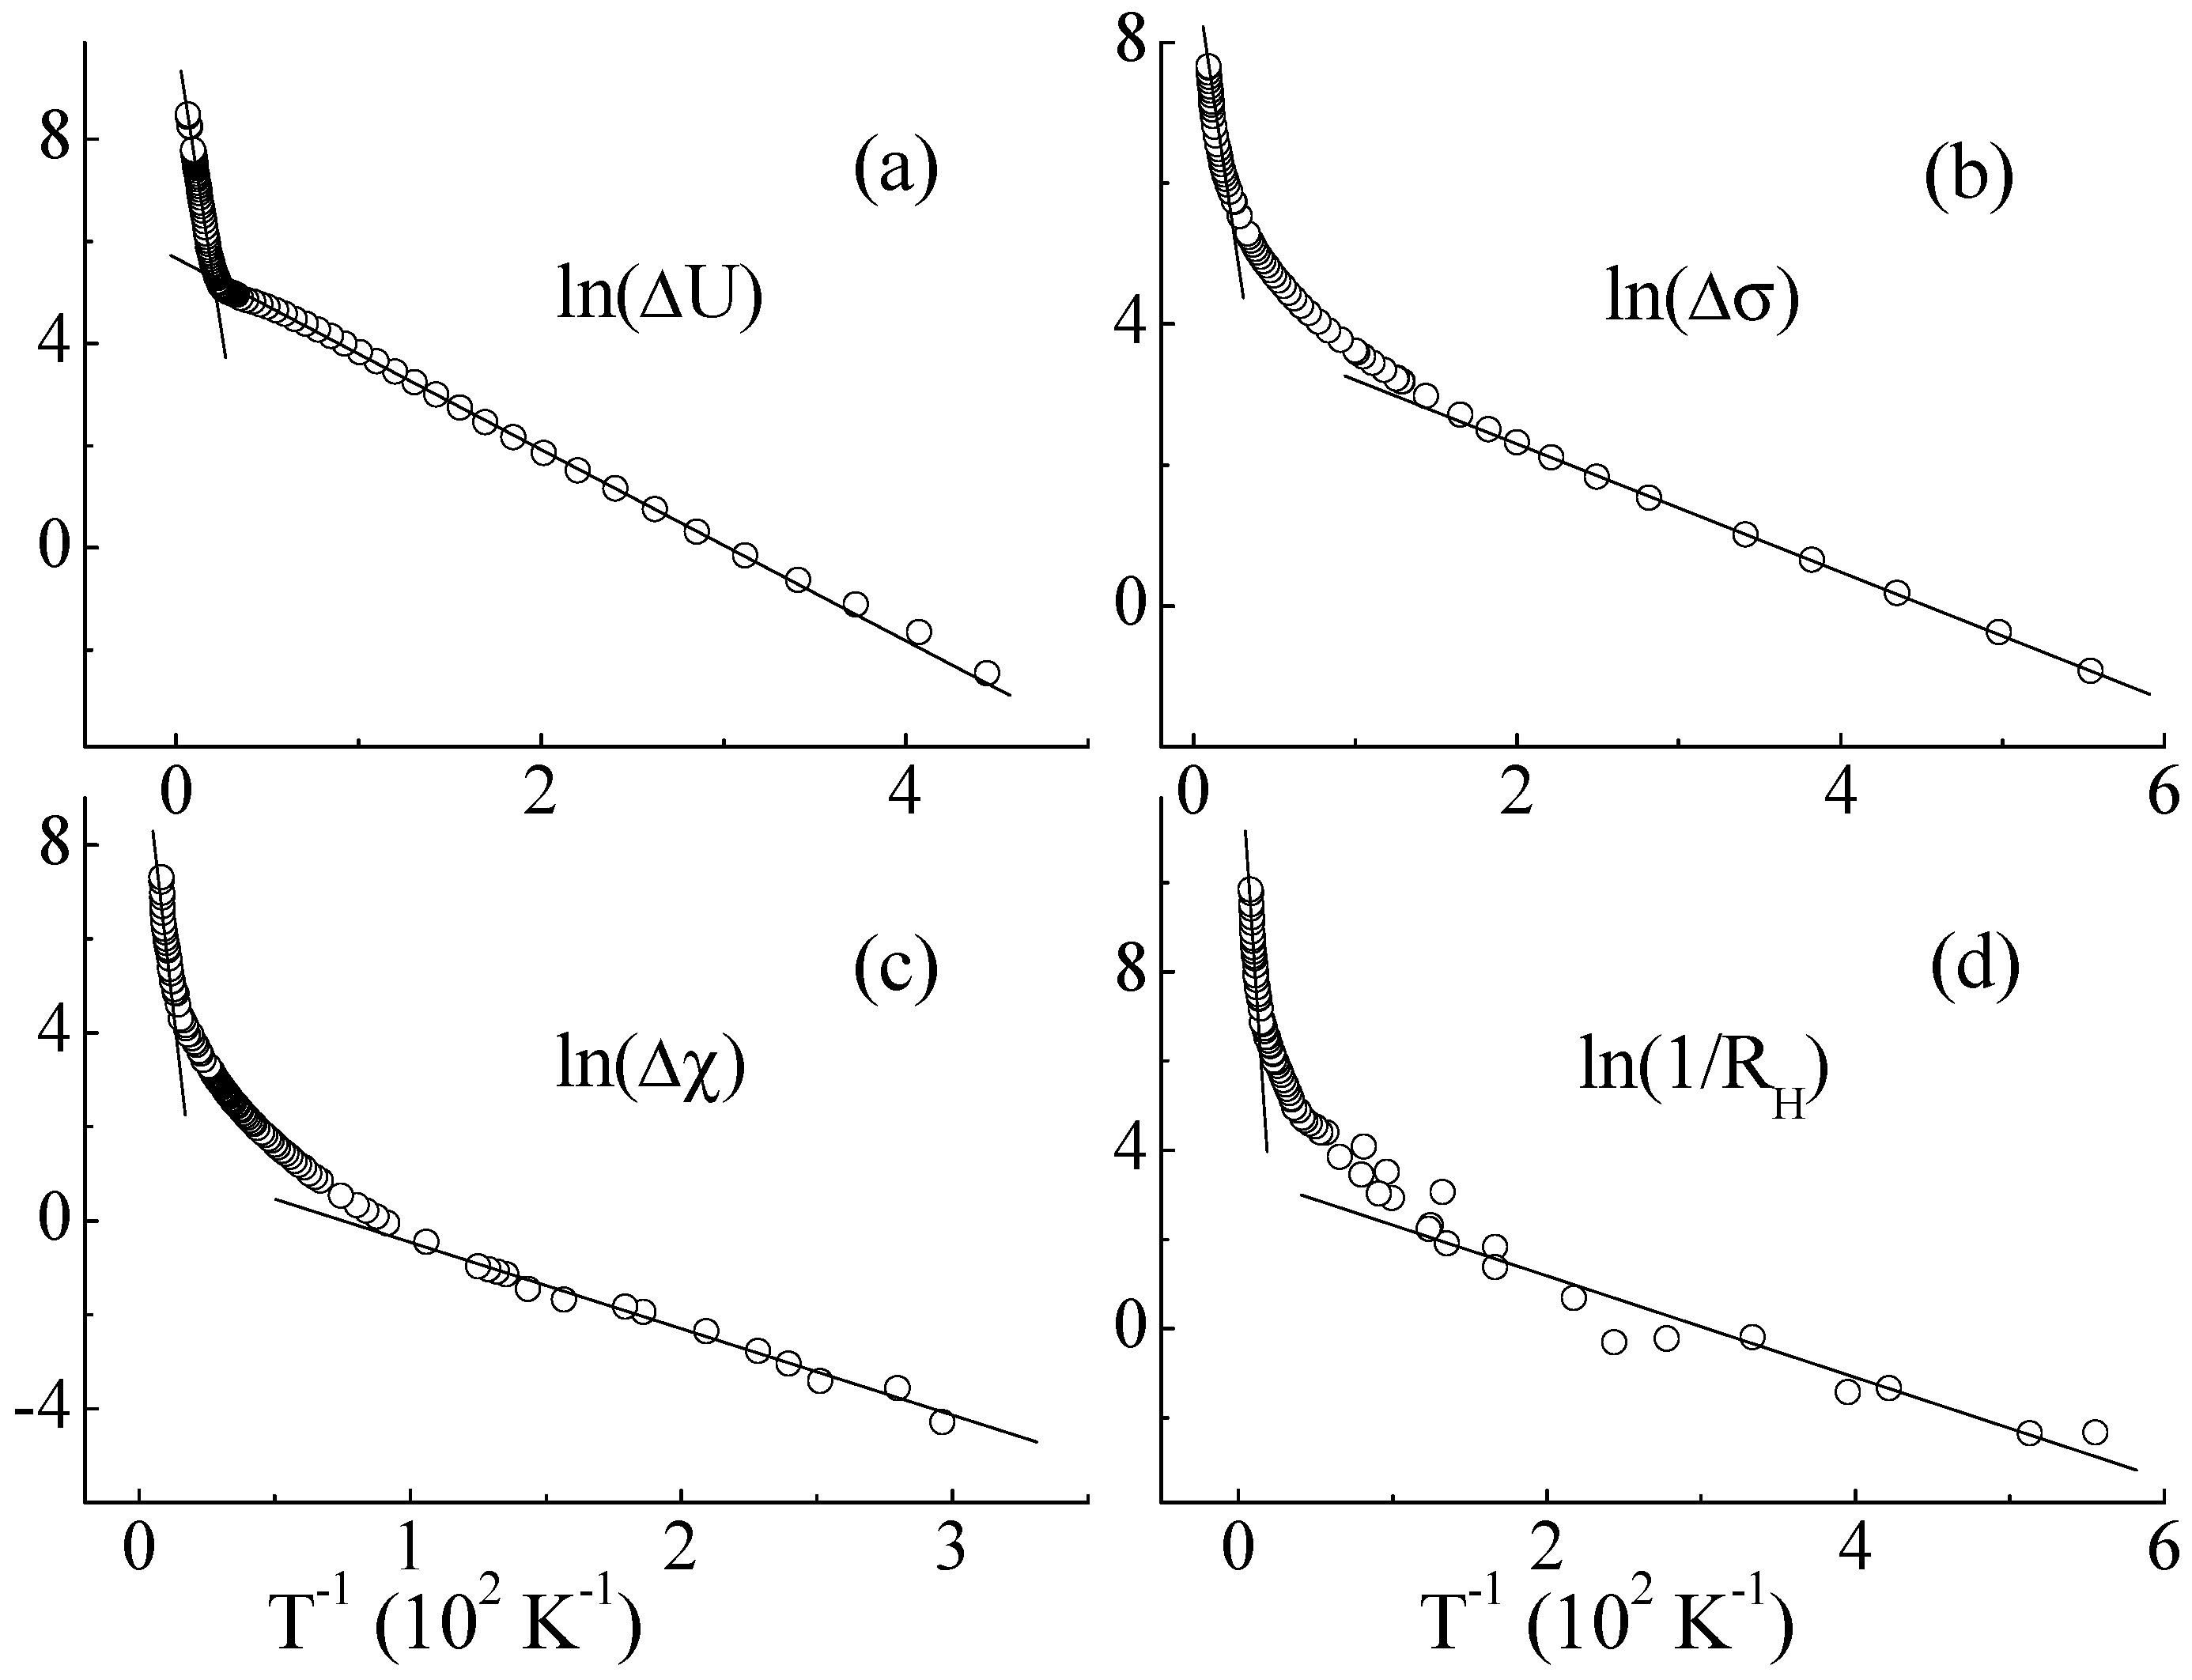
To make sure whether a change in the activation regimes takes place, we do not have to know each contribution separately. It is sufficient to construct the total curve U(T) in the lnU(T) vs. T
−1 coordinates, as shown in
Figure 3a for the Al
63Cu
25Fe
12 icosahedral phase. A change in the activation regimes manifests itself in the fact that the curve has two linear portions. If the temperature dependent components of the electrical conductivity, the magnetic susceptibility, and the inverse Hall-effect, where these contributions are very difficult or impossible to separate, are represented in the same coordinates, then, as seen in
Figure 3b–d, there appear patterns that are identical to that in
Figure 3a.
The well-coordinated behaviour of all the curves on
Figure 2 and the activation regime changes on
Figure 3 mean a direct dependence of the thermally-induced giant effects on TLEs.
The singular heat capacity and singular paramagnetism are trivial implications of TLEs. The understanding of this phenomenon does not require new knowledge. It is sufficient to remember that the ground state of each trap is diamagnetic. The excited state of each trap is paramagnetic. The rest are determined by the population of the states according to Equation (2). A different situation occurs with the TLE conductivity. The case in point is the conduction over the excited states of the same type traps is carried out by of hopping or tunnelling. We have not found a theoretical justification of such conductivity in the literature. From the experimental point of view, there is no difficulty in justifying this conductivity. If the conductivity of this type exists, it should manifest itself as an additive component to the conductivity of residual carriers, σ
ml. Qualitatively, this implication is confirmed by the empirical relationship known as Inverse Matthiessen Rule [
26]. According to this rule, the electronic transport in quasicrystals is determined by additive contributions to the electrical conductivity, rather than to the electrical resistivity as in metals, i.e.:
Strange as it may seem, the most unusual postulate of our model that the continual and discrete components being autonomic subsystems coincide in energy is in agreement with experiment. Indeed, the threshold excitation energy obtained from the description of the low temperature part of the excess heat capacity is δE
1 ~ 0.02 eV and, as follows from the description of the high-temperature part of the excess heat capacity, it is δE
2 ~ 0.25 eV. The pseudogap width, according to photoelectron spectroscopy, as was noted above, is equal to ~1 eV. The Fermi energy of residual metal like carriers in the free electron approximation and at a charge carrier concentration of 10
20 cm
–3 is E
F ~ 0.3 eV. It is easy to see that spatially localized states, if they exist, coincide in energy with the continuum of residual carriers. In the framework of homogeneous localization models, such a coincidence is impossible [
27]. It may mean that in quasicrystals, we are dealing with a special sort of inhomogeneous electronic system with a dual manifestation of inhomogeneity, namely, in the form of several generations of electron traps and in the form of the coexistence of extended and spatially localized states with the same energies. In any case, it means definitely that the conjugated levels of the traps should be separated by real gaps, not pseudogaps. To verify how realistic this implication we turned to the analysis of the spectral characteristics of quasicrystals.
4. Correlations between TLE Heat Capacity and Tunnelling Spectra
Icosahedral phases in aluminium alloys with transition metals have been actively studied in the last two decades by scanning tunnelling spectroscopy and point contact spectroscopy methods with various types of junctions-planar [
28,
29], point [
30,
31], and break [
31,
32]. It was shown that the dependences of the tunnel conductance (G = dI/dV) on the bias voltage (V) are strongly nonlinear characteristics exhibiting numerous features such as zero bias anomalies (ZBA), maxima, humps, and inflection points with a characteristic scale of several units to several hundred meV.
The fine structure of G(V) curves is usually explained by the fact that it is the image of the fine structure of the electron density of states near the Fermi level. In other words, it is implicitly assumed that the tunnel current through a quasicrystal junction is due to quantum transitions between delocalized states on different sides of the barrier. In the one-electron approximation, a quite reasonable picture of the electron density of states of the icosahedral structure is obtained in the form of a comb of extremely narrow peaks separated by pseudogaps [
28,
29,
30,
31,
32].
At the same time, another remarkable feature of tunnel experiments remains neglected. The fine structure of G(V) curves in quasicrystals strongly depends on the effective area of a tunnel junction. In the case of a large area of the junction (>10 nm2), G(V) curves have an “averaged” shape with a sign-alternating curvature, but smoothly increase with V. In the case of a small area of the junction (<1 nm2), G(V) curves have a “local” oscillatory shape.
In view of the pronounced topographic aspect of tunnel spectra, the authors of [
33,
34,
35,
36] concluded that an additive scheme of the tunnel conductance is implemented in quasicrystals. A G(V) curve consists as if of two independent components: the field-independent part G
0, which is due to remaining delocalized conduction electrons, and the field-dependent part G
v, which is due to energetically and spatially well localized electrons:
It turns out that the fine structure is inherent only in the component G
v. It is obvious that, in view of the spatial localization of the features of G
v, extremely narrow peaks of the density of states should be separated by real gaps rather than by pseudogaps. Consequently, multiple ZBA would be expected in the spectrum. However, this is not the case in experiments. A single ZBA is always observed near V = 0. This specificity of real spectra was the first reason for doubt that the fine structure of G(V) curves is the direct image of the electron density of states [
36] and for the possibility of another mechanism.
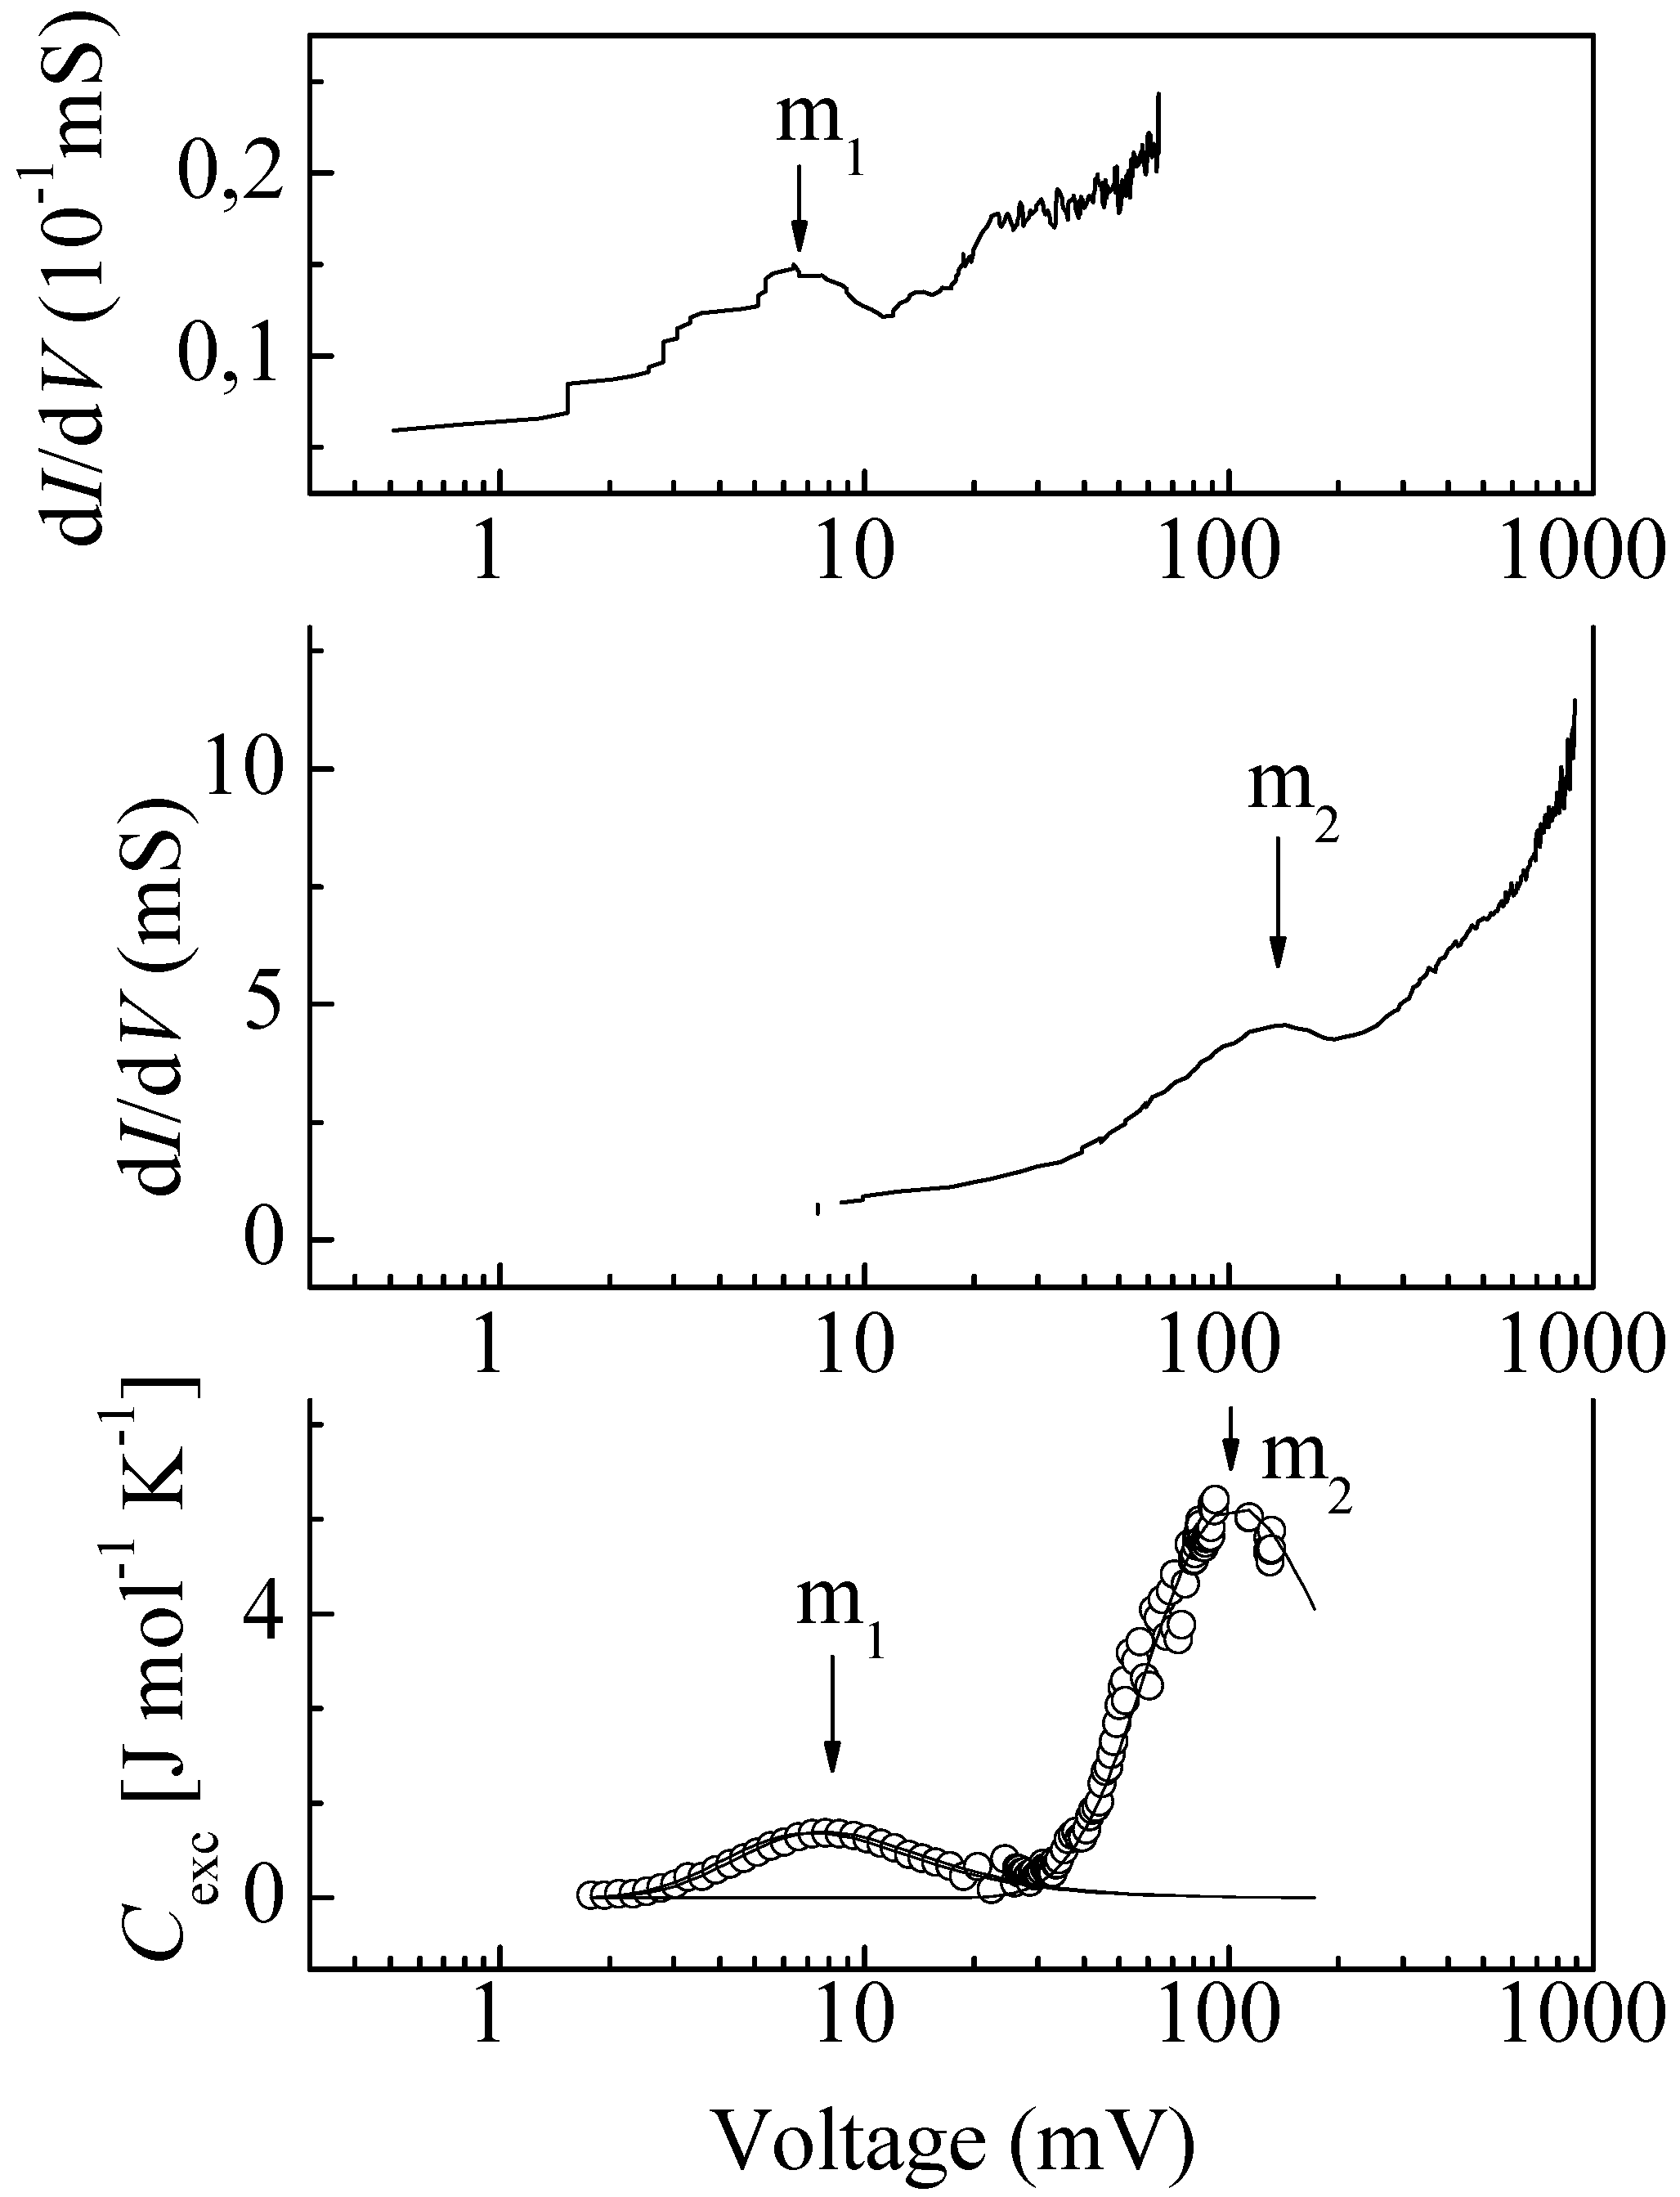
A topographic similarity of electronics states from the excess specific heat and from the field dependent part of tunnel spectra stimulated us to seek correlations between these characteristics. We directly compared the local and averaged G(V) curves obtained in the experiments with break junctions for i-phase of Al
64Cu
23Fe
13 in [
32] and the C
TLE (T) curve that we obtained for the i-phase of Al
62Cu
25Fe
12 and obtained the picture shown in
Figure 4. All results in this figure are in situ, but all curves are represented in the same energy format. It is seen that the tunnel and thermal characteristics have visually similar maxima (they are indicated by arrows in
Figure 4) at close energies.
It was hypothesized that maxima of the tunnel conductance, as well as maxima of the excess specific heat, can be attributed to two-level excitations of electron traps. To this end, it should be assumed that quasicrystals contain charge carriers whose density depends on the electric field as the population of the upper level in the Schottky model depends on the temperature [
23]:
Under the assumption that the mobility (μ
e) of these carriers slightly depends or does not depend on the field, it is easy to show that the conductance depends on V as:
Because of the mathematical identity expressions, Equations (2) and (7), simple and clear understanding of the identity of heat and tunnel maxima is achieved.
This identity gives a key to the understanding of a microscopic mechanism of elementary electric terms. The thermal terms given by Equation (2) are by definition due to the internal thermal emission of electrons between conjugate levels of electron traps. Consequently, electrical terms given by Equation (7) are due to the internal field emission (Zener effect) [
37] between the same levels. This fact is fundamentally changing the understanding of the fine structure of the tunnelling spectra.
By analogy with the excess specific heat, it is reasonable to expect that the field-dependent components G
v should generally be sums of numerous elementary terms given by Equation (7), differing in the splitting energy of conjugate levels of traps. Under this assumption, we analysed in detail the local and averaged G
v(V) curves using Equation (7) as a trial function [
38].
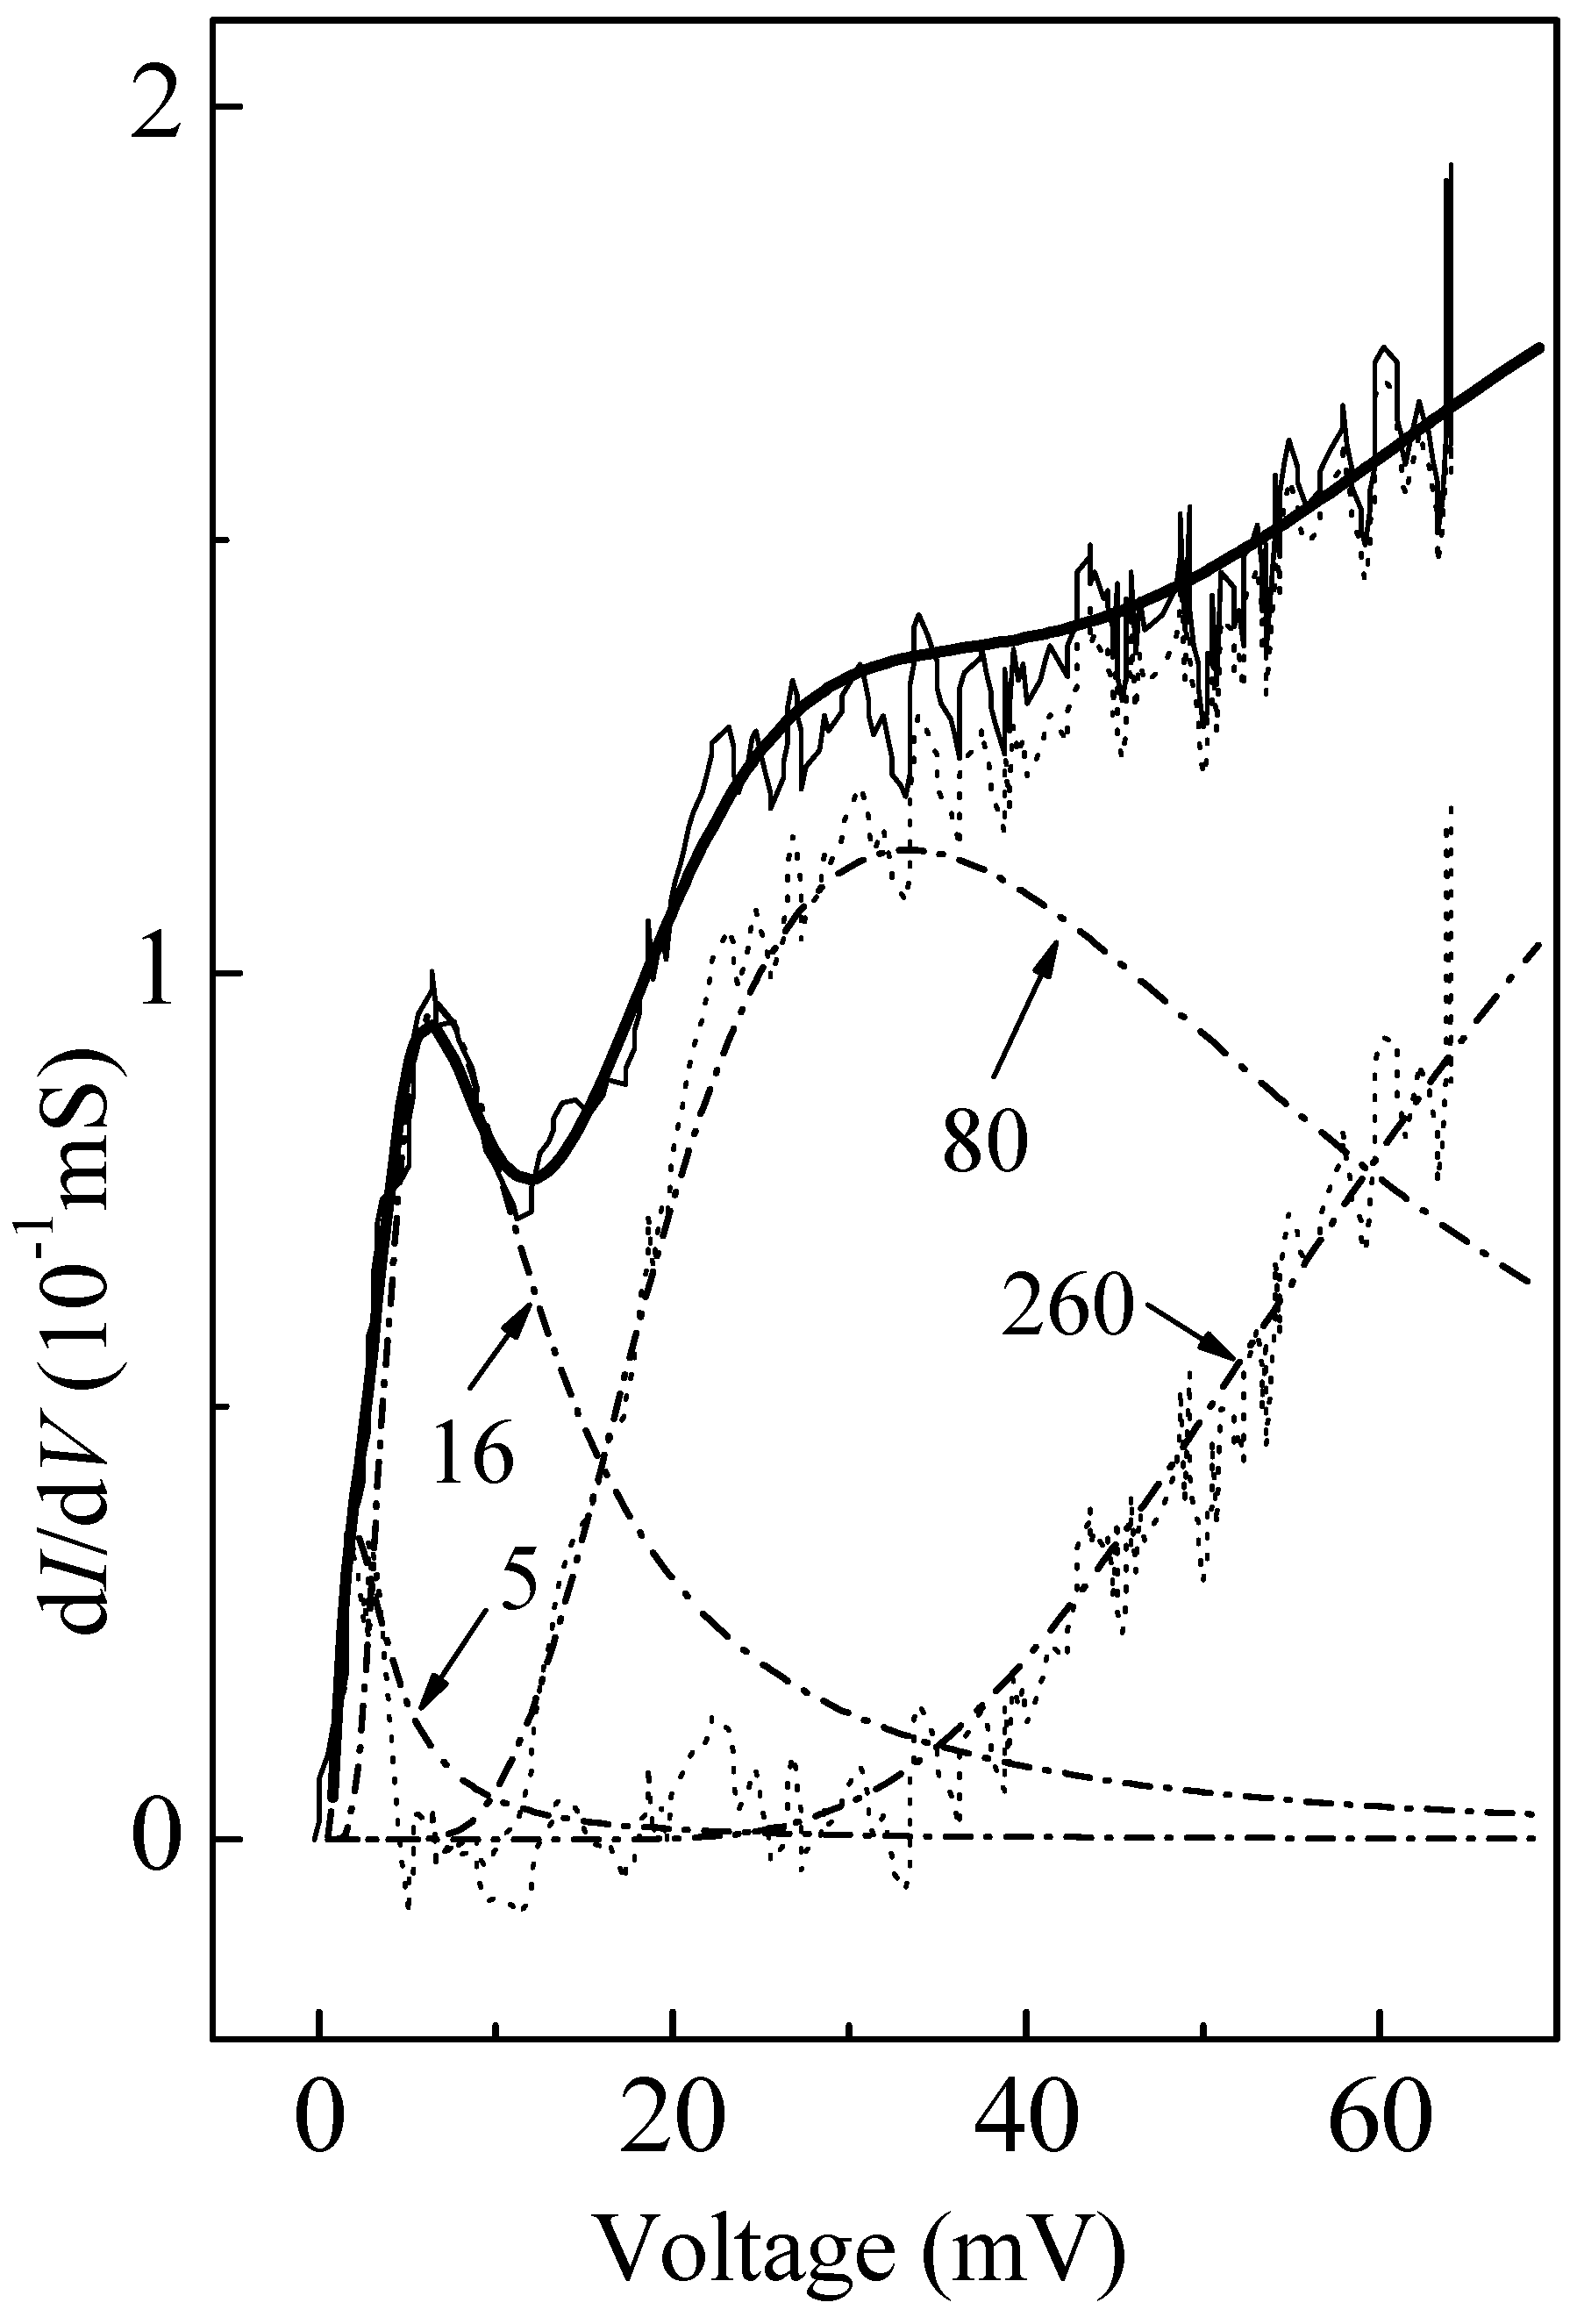
The thin solid line in
Figure 5 is the local spectrum from [
32] in direct energy coordinates. This curve clearly demonstrates the typical discussed features—ZBAs, pronounced maxima, and pronounced humps. First, we approximate the maximum as the best-defined feature with the reference at the point of maximum. The result is shown by dash-dotted line 16. The description is not the best, but the reference to the maximum point gives the characteristic energy of two-level excitations δE = 16 meV, which is close to δE = 19 meV obtained from the specific heat [
25].The result is close to the expected one and is not unique. It is easy to see that dependence Equation (7) near V = 0 reproduces the ZBA feature of the tunnel spectrum.
We apply Equation (7) to approximate the difference between the local experimental curve and the calculated curve 16. This residual is shown in
Figure 5 by the dotted line. It has a small maximum near 2 meV and a hump near 30 meV. The approximations of these two features by Equation (7) are shown by dash-dotted lines marked by the numerals 5 and 80 meaning δE
i corresponding to the best fit. The dotted line is a similar residual after the subtraction of lines 5, 16, and 80. This line has only one characteristic feature, ZBA, which is described by the dash-dotted line marked by the numeral 260. This residual is best approximated with the parameter δE
i = 260 meV, which almost coincides with the second characteristic energy of two-level excitations from the specific heat δE
i = 250 meV [
25].
As is seen, the tunnel curve in the range 0 < V < 65 meV is deconvoluted into four elementary terms with the energies 5, 16, 80, and 260 meV. The thick solid line in
Figure 5 is the sum of these terms. The sum generally approximates the experimental data well. It is seen also that this sum leads to the hump features and to the fact that only a single ZBA with the smallest δE
i is visible. The remaining ZBAs become hidden.
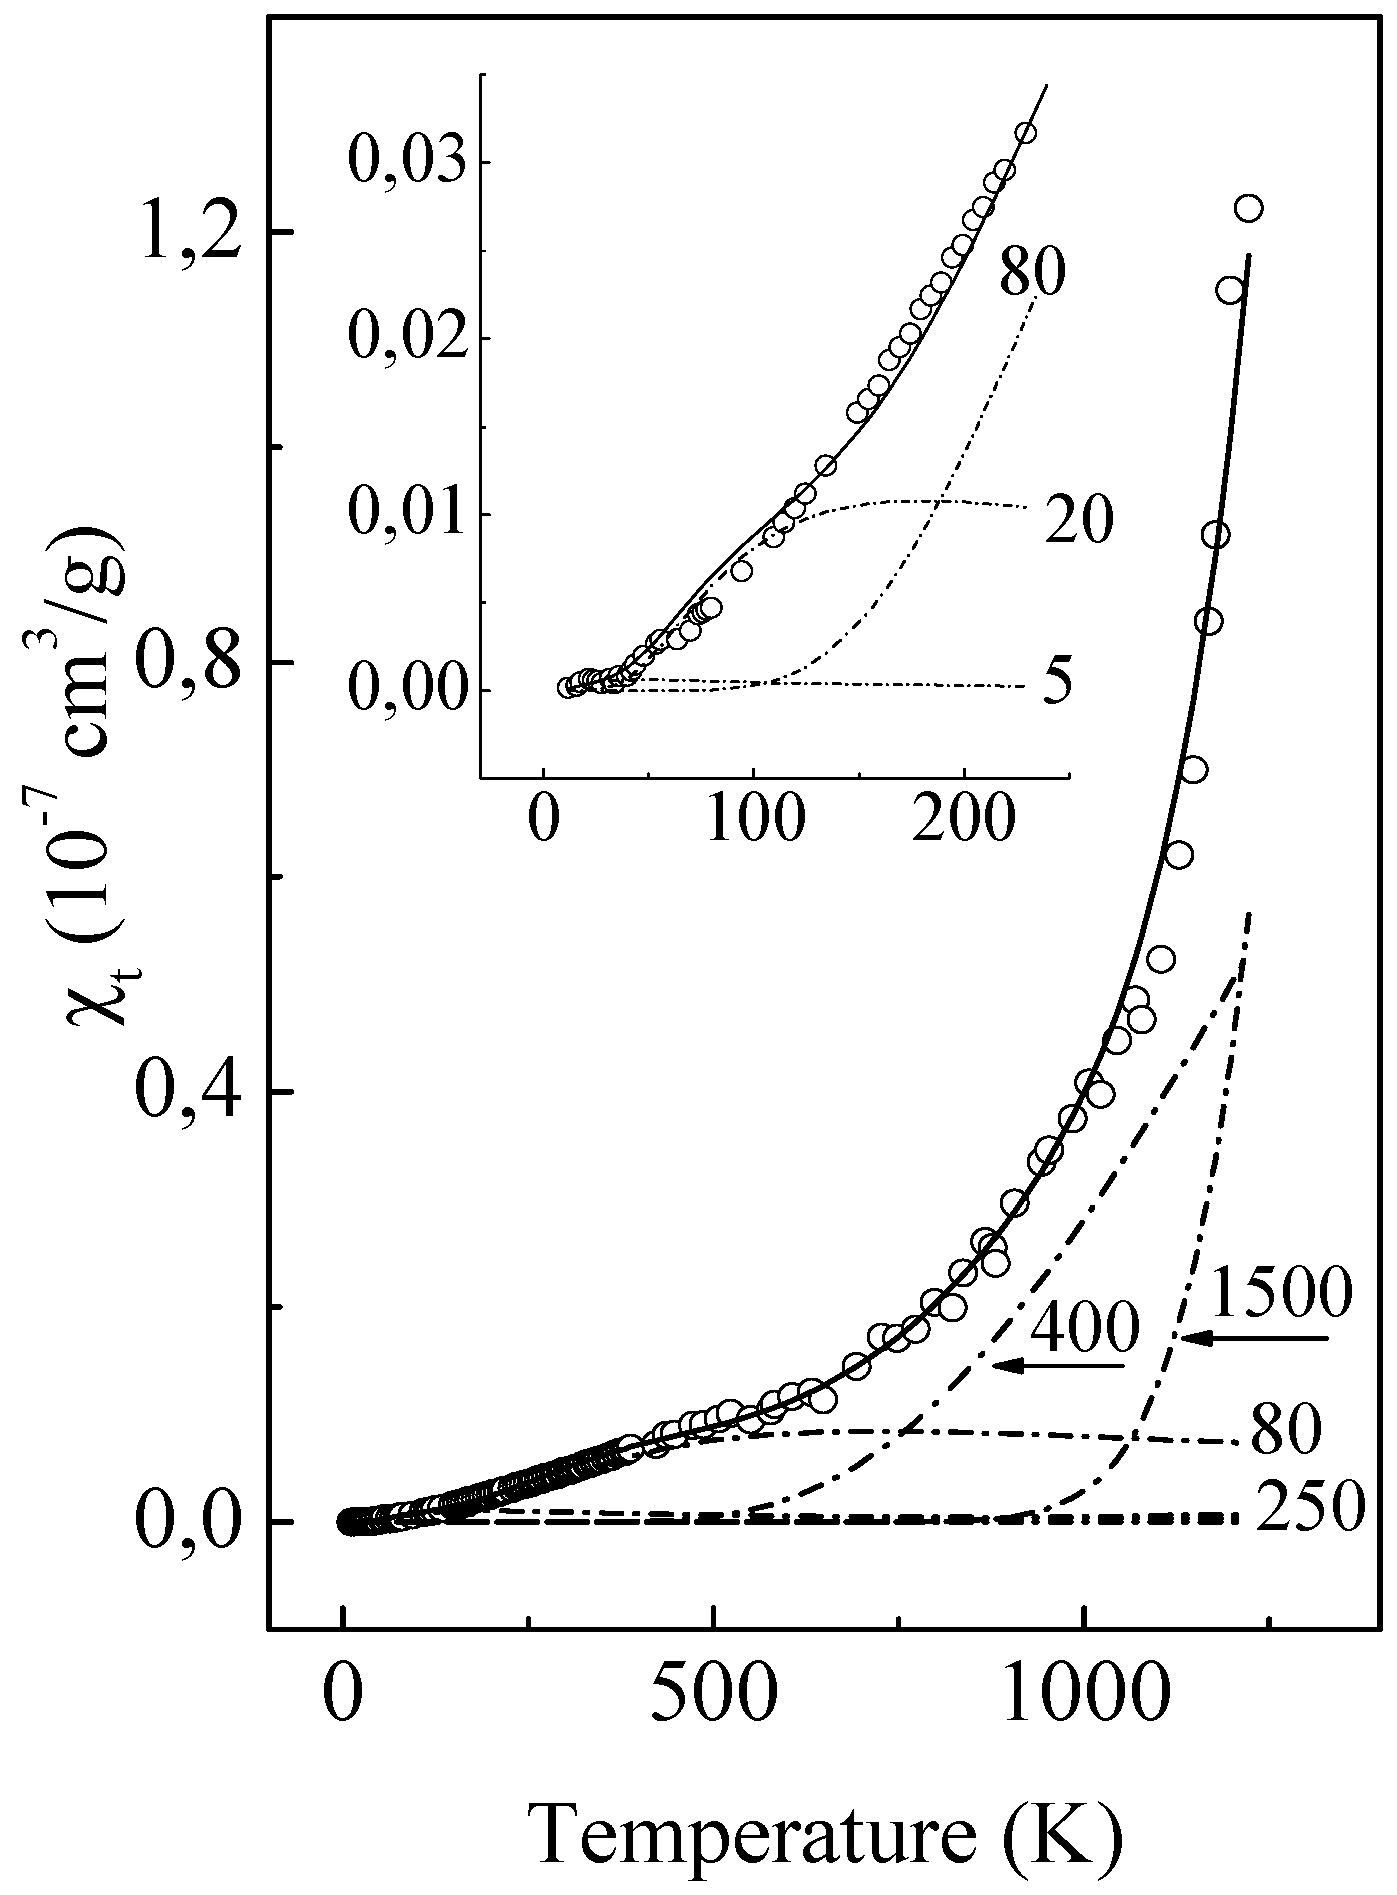
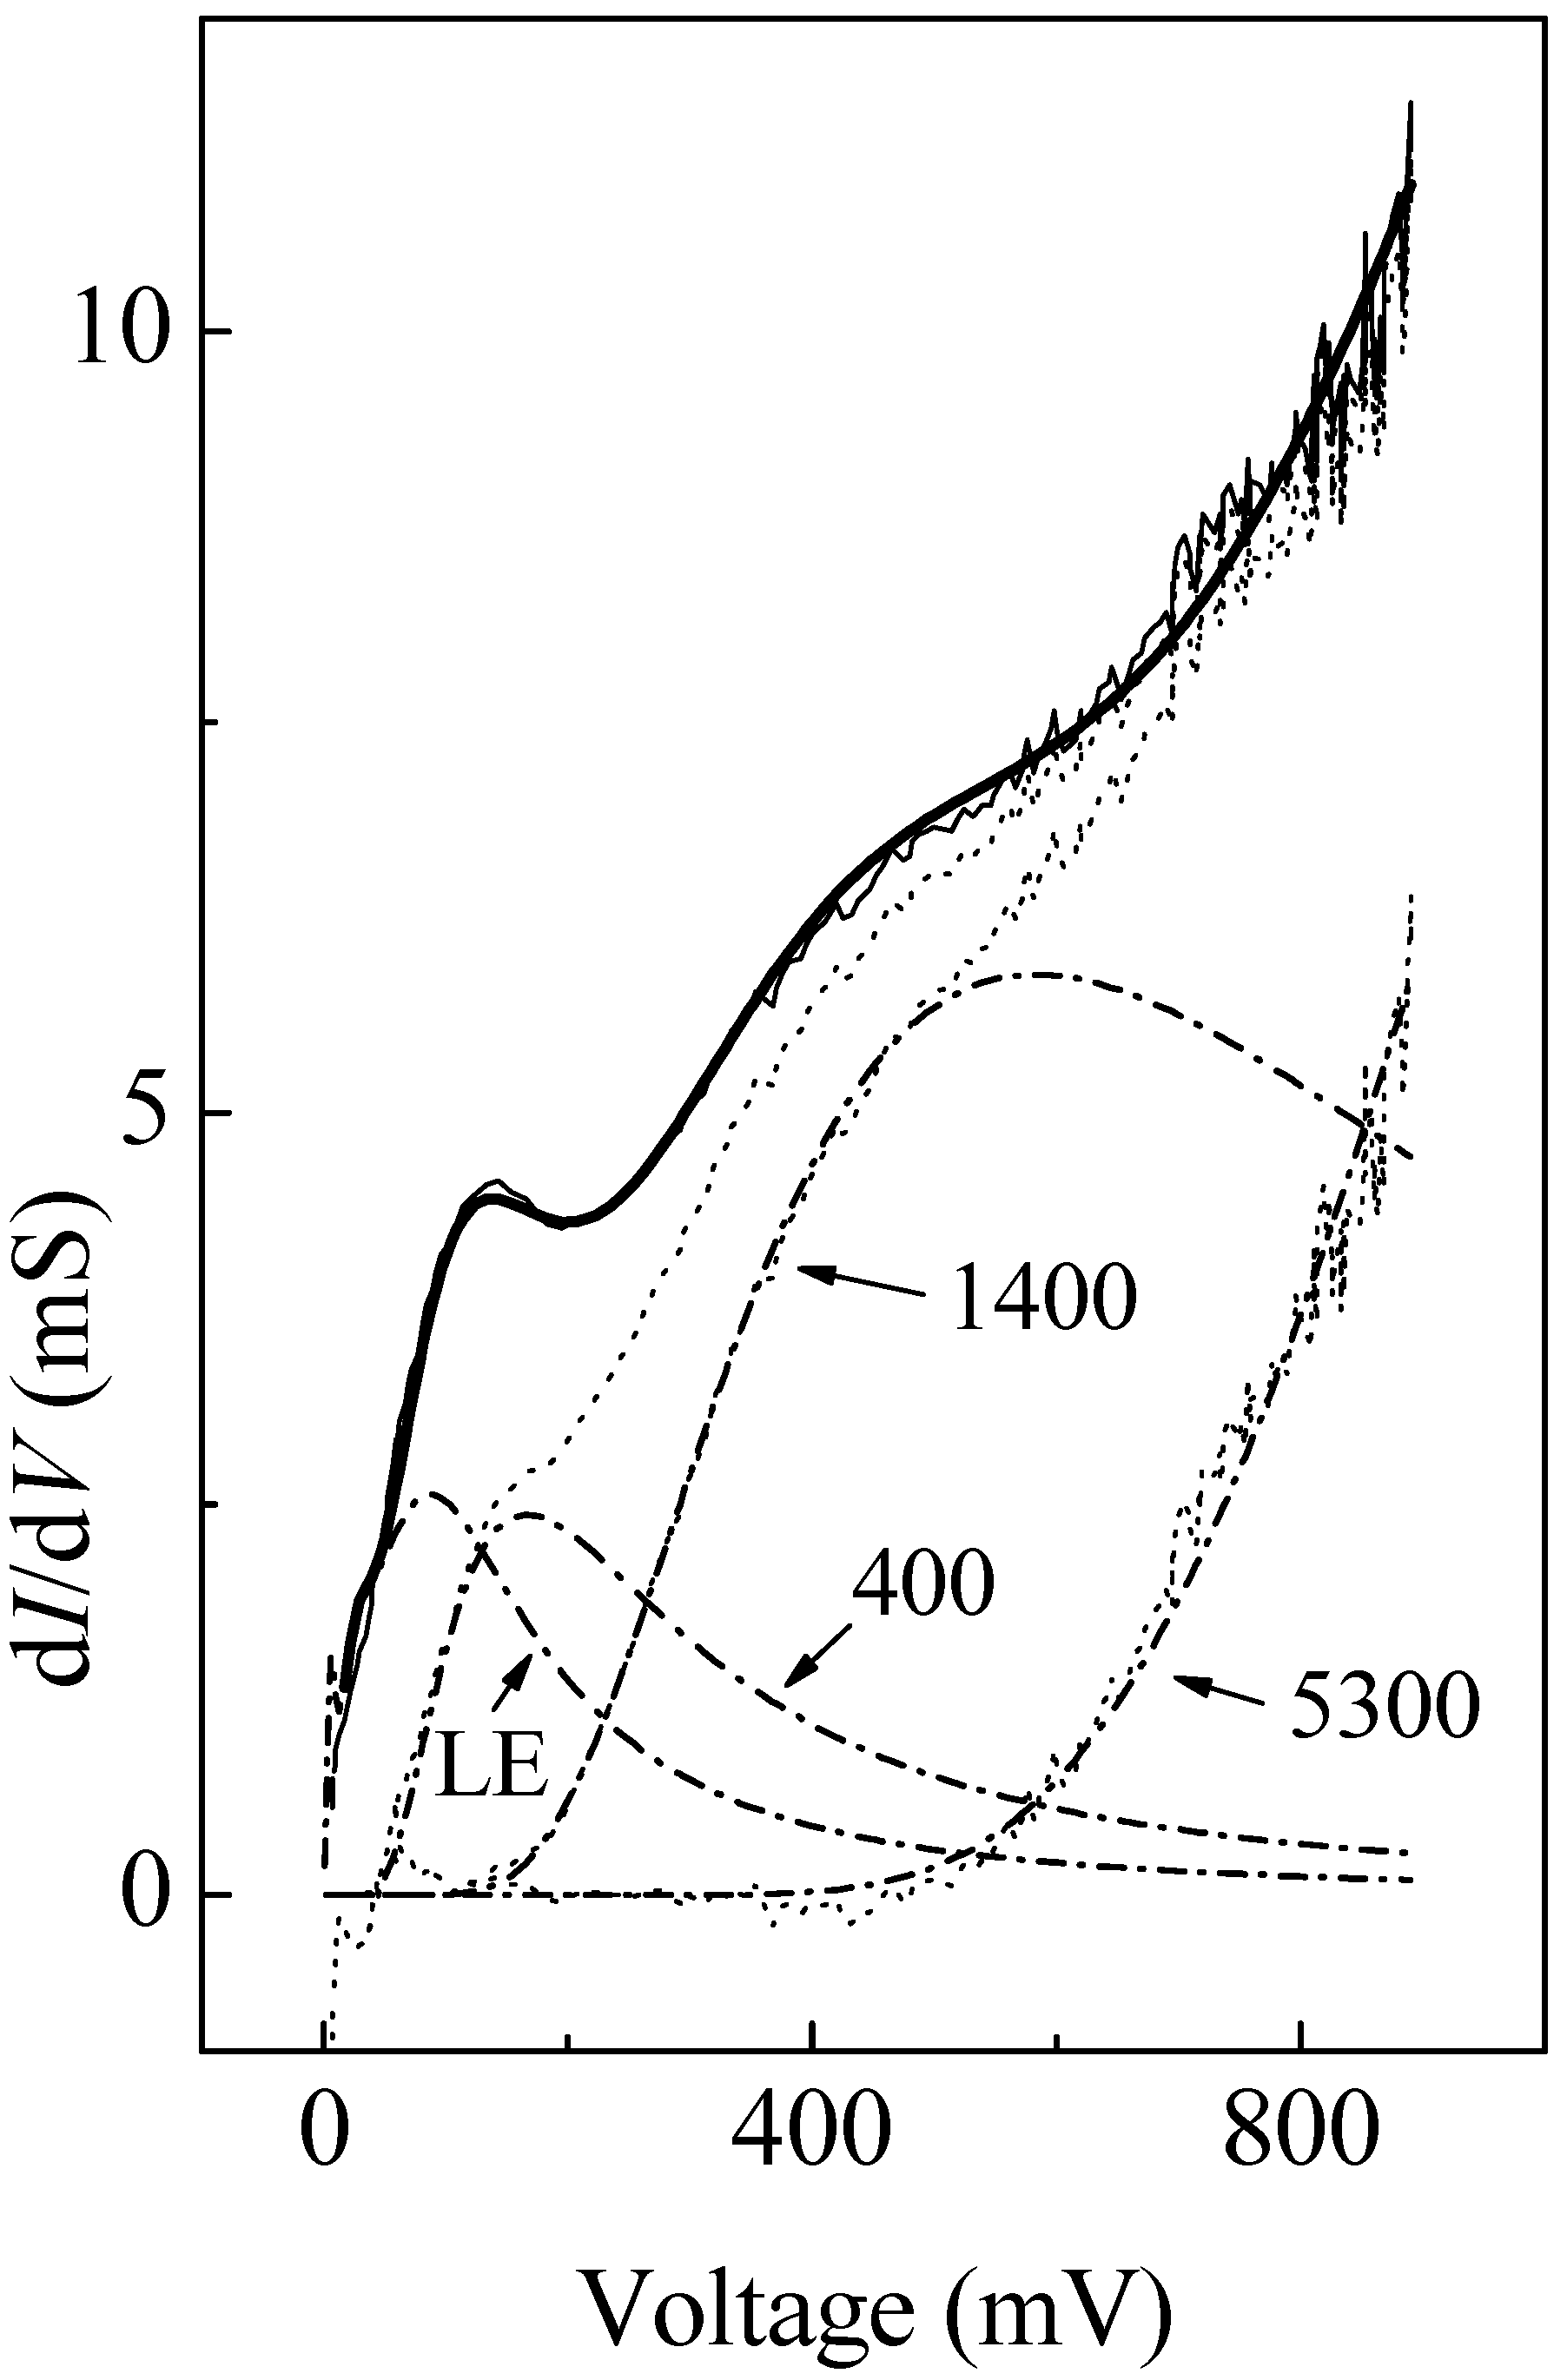
Figure 6 shows the average spectrum from [
32] in the energy range 0 < V < 850 meV, which is significantly wider than the capabilities of a thermal experiment. The high-energy part of the curve exhibits two pronounced features: maximum and hump.
The results of the analysis using Equation (7) are shown as dash-dotted lines in
Figure 6. Additional elementary terms with the characteristic energies δE
i = 400, 1400, and 5300 meV are detected. The procedure of their separation is similar to that described above. The only explanation that needs to be done relates to accounting the low-energy part of the spectrum in order to obtain a residual. The averaged curve in this part of the spectrum is strongly smoothed but is due seemingly to the same elementary terms as the above local curve. In view of this circumstance, to approximate the low-energy part of the spectrum at V < 70 meV, we used the entire set of “local” characteristic energies in the form of the LE contribution. This is the reason why the “high energy” residual shown by the dotted line in
Figure 6 exhibits “dips” near V = 0. This does not affect the approximation of the high-energy residual of the averaged curve and this entire curve by the set of elementary terms (Equation (7)) with the characteristic energy gaps δE
i = 5, 16, 80, 260, 400, 1400, and 5300 meV. The latter is shown by a thick solid line in
Figure 6.
One may think that such a large number of gaps were used solely for the purpose of a qualitative fit. However, this is not exactly so.
5. Two-Level Excitations and Optical Spectra
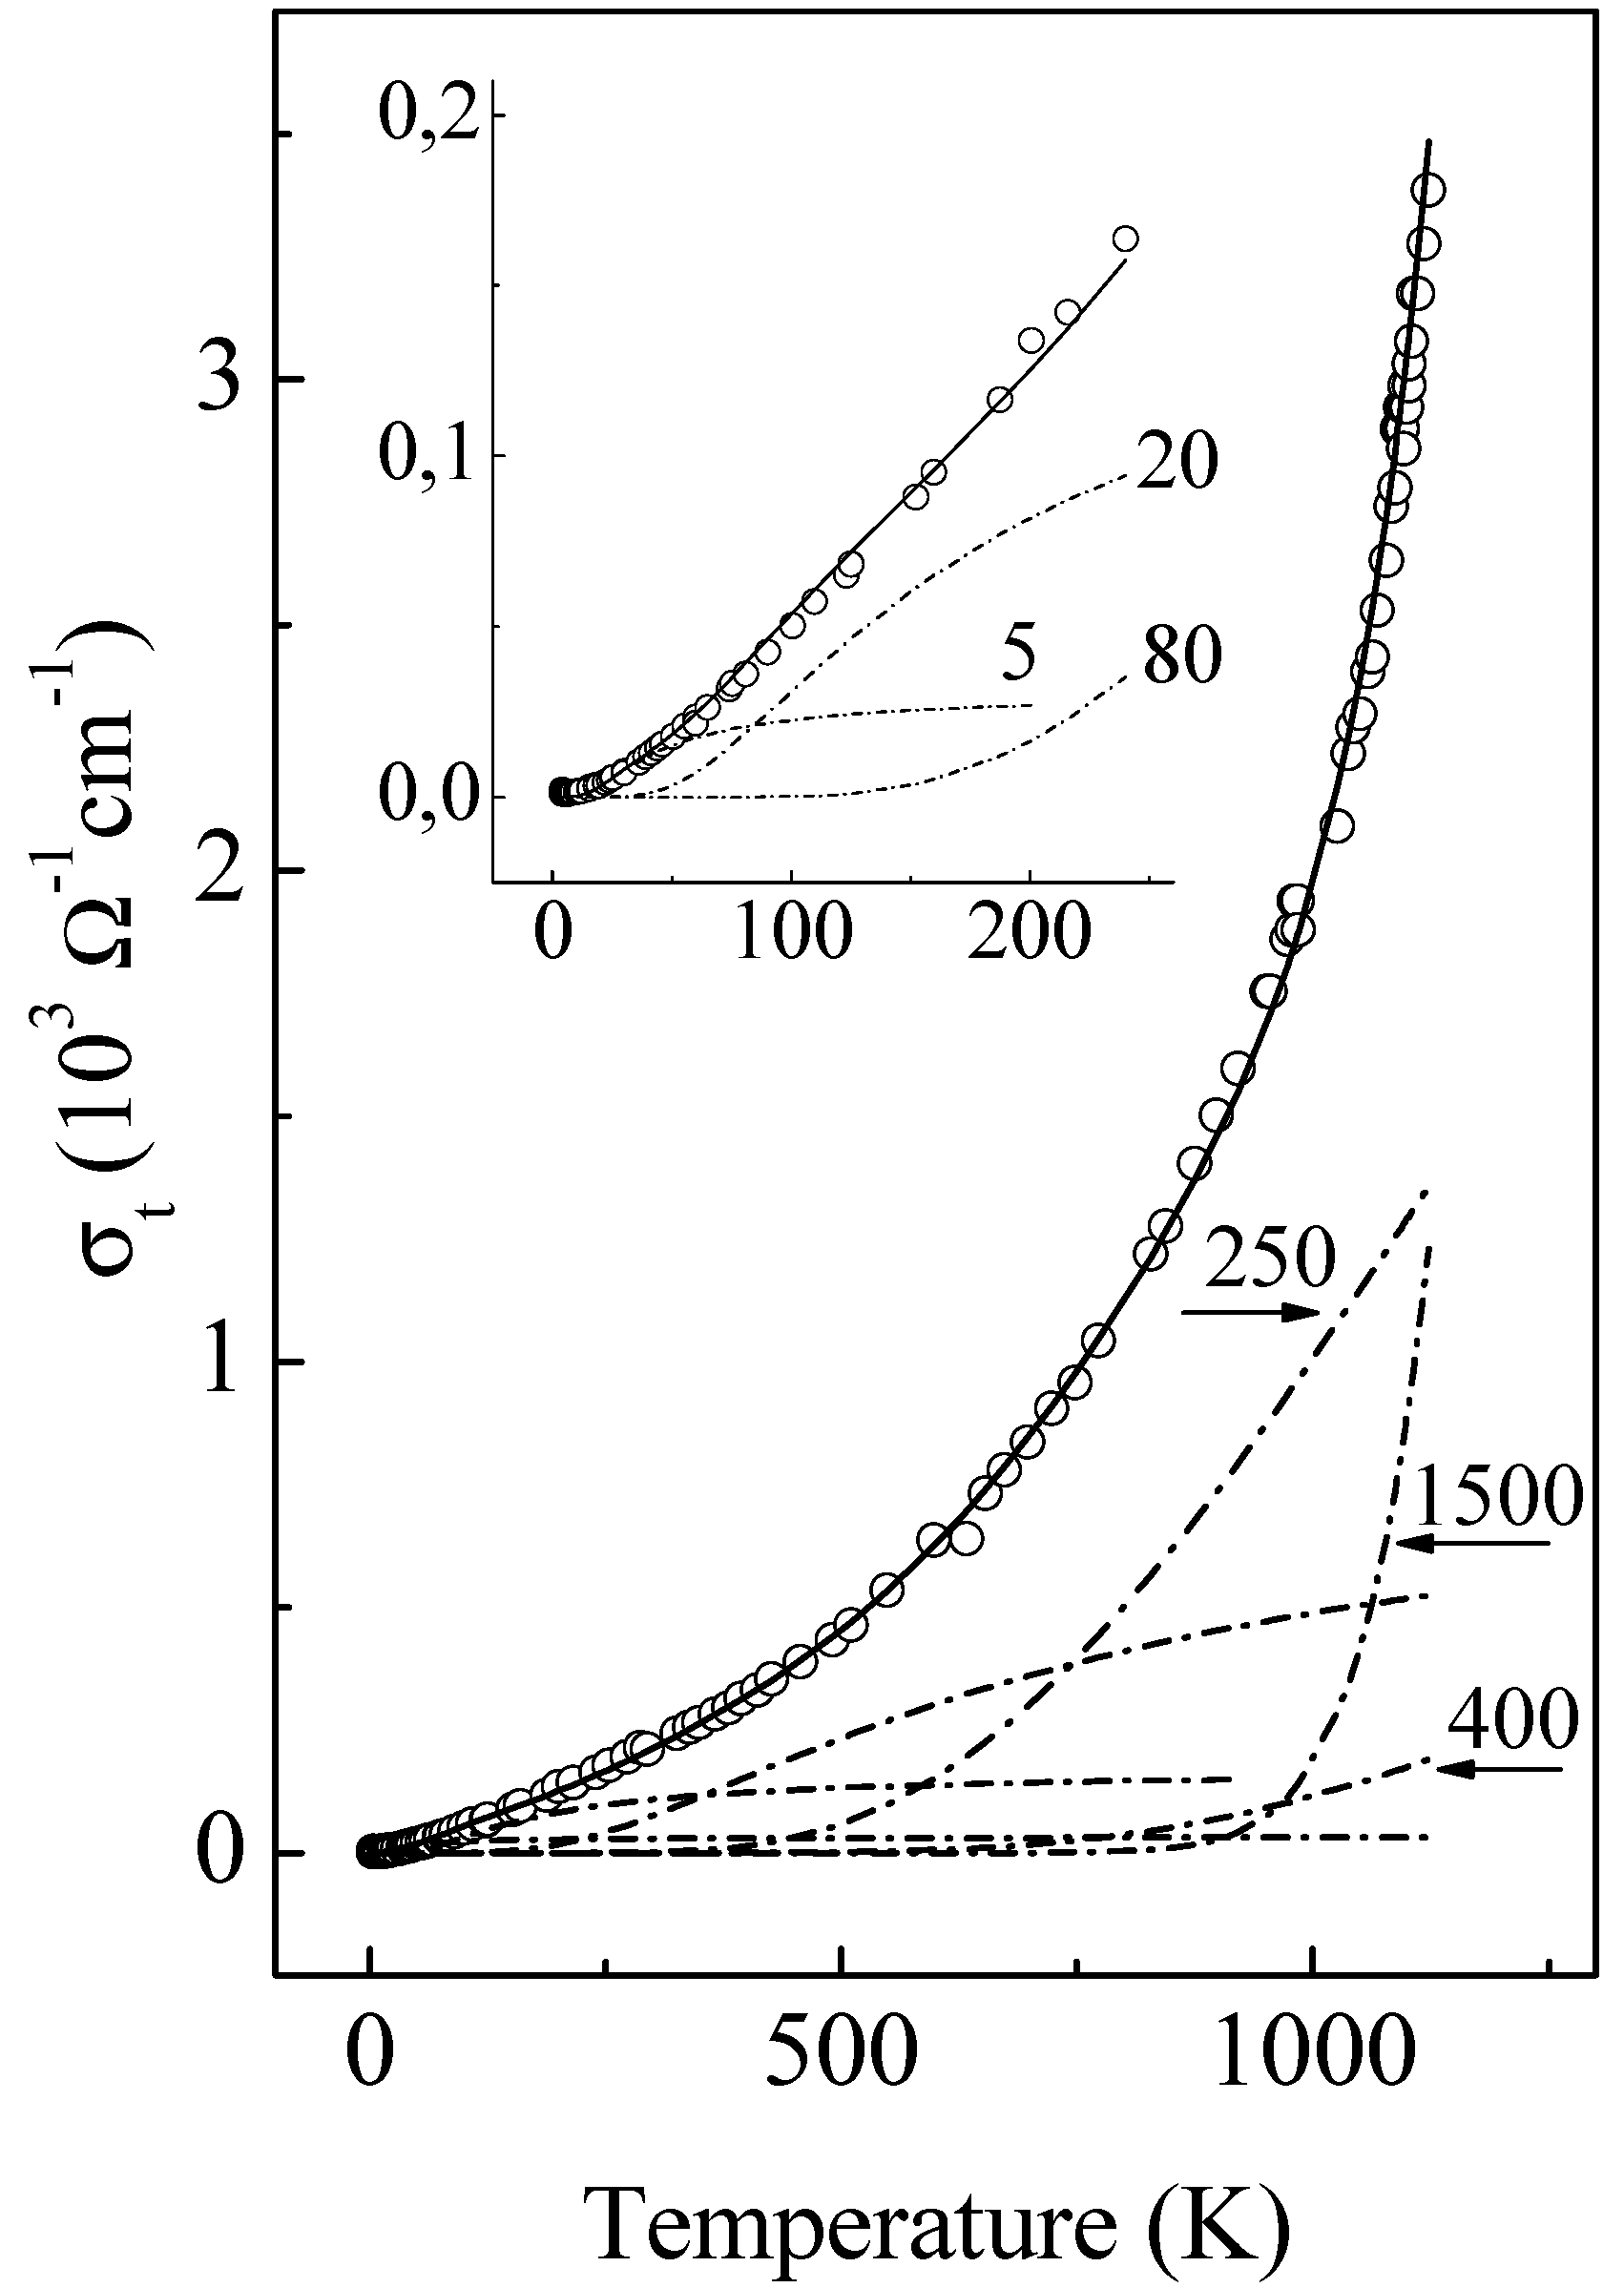
It is well known that optical investigations, performed across a broad spectral range, are a powerful experimental tool for identifying the spectrum of excitations. We were able to identify a set of δEi values as the real gaps. If so, a distinctive feature of the behaviour of optical conductivity σ (ω) in quasicrystals should be the summary effect of the same set of resonance absorption peaks.
The optical conductivity σ(ω) of Al
63Cu
25Fe
12 at room temperature is shown in
Figure 7 in accordance with experimental data [
39]. It presents an intense, broad and practically featureless (except for maximum) band occupying virtually the all range of frequencies from 40 up to 25,000 cm
−1. A number of authors have reported the existence of the similar bands in various icosahedral systems: AlPdMn [
40], AlMnSi [
41], AlPdRe [
42], and AlCuFeB [
43]. Accordingly, there exist three possible explanations for the band. It may be associated with strong scattering of electrons and then the maximum occurs at ω = 1/τ [
44]; it may be associated with the direct gap in the zone structure and then σ(ω) = const x(ω − E
g)
1/2/ω [
42]; and, finally, it may be associated with resonance absorption [
43] in the form of:
Here, ω0i, ωi, and γi are the ith mode resonance frequency, damping, and mode strength of the ith harmonic oscillators, respectively.
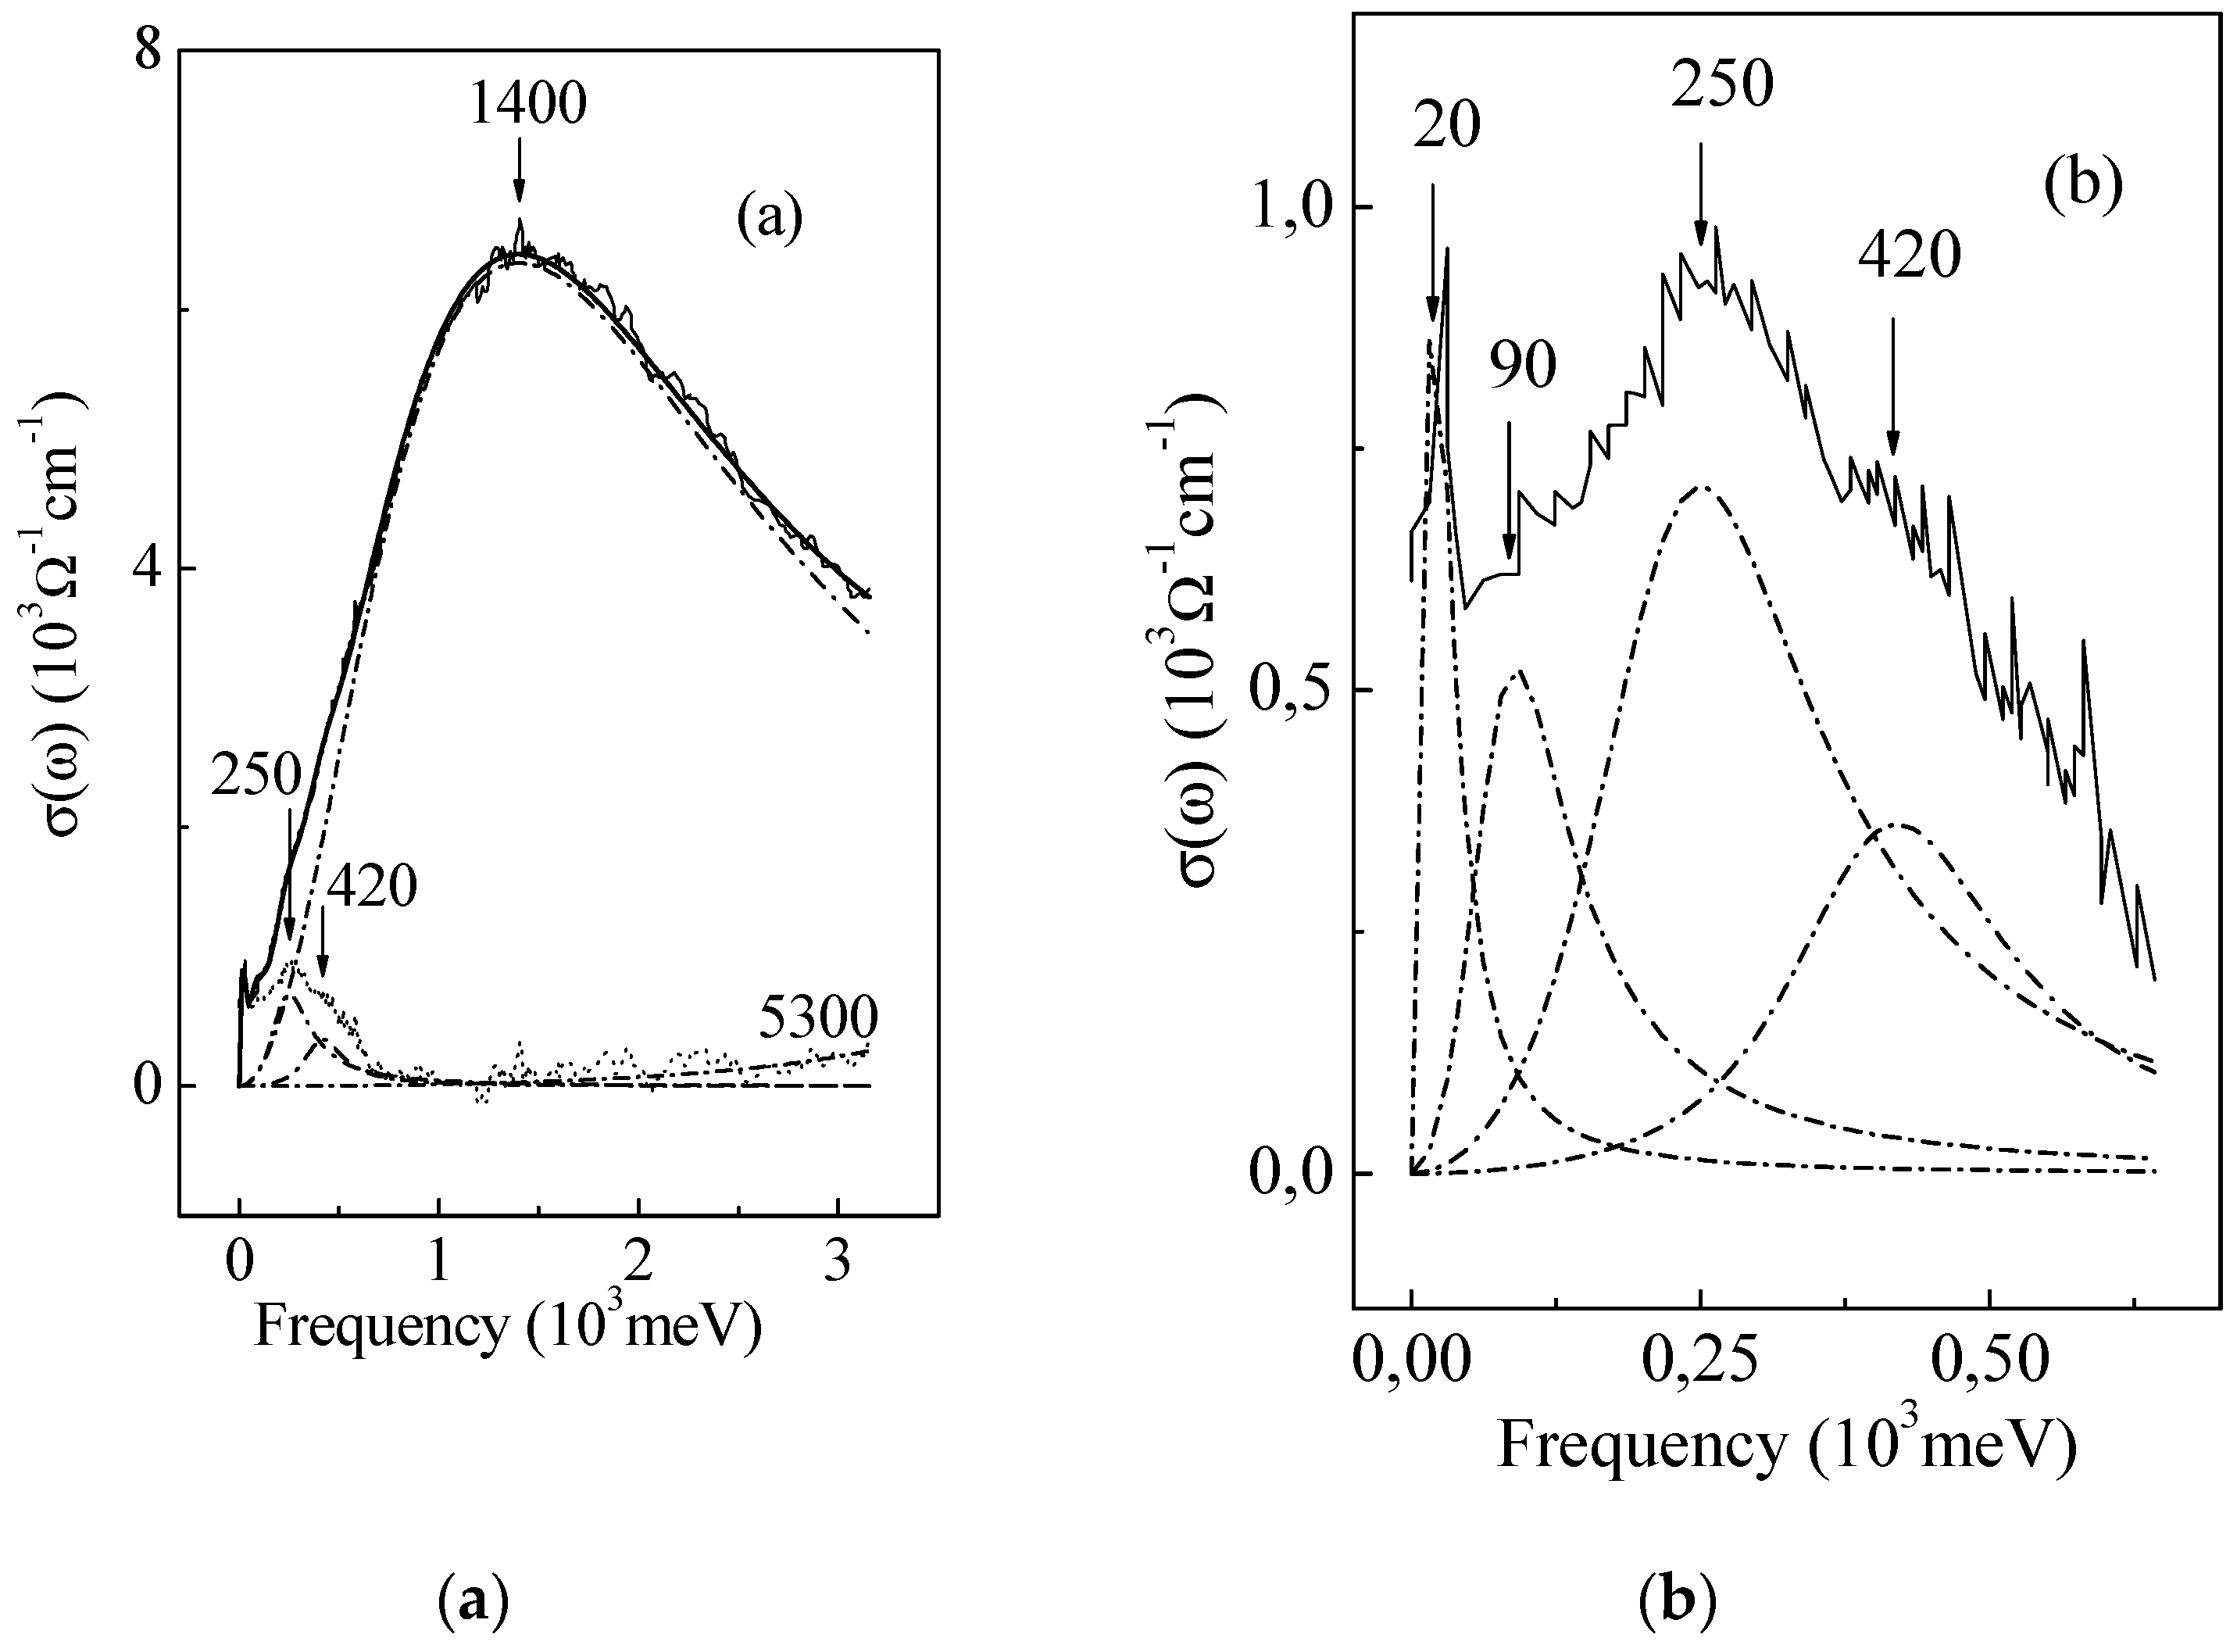
In the latter case, the maximum occurs at ω0 = δEi directly. It was not so hard to see that the band maximum in Al63Cu25Fe12 i-phase at about 1.4 eV coincides very well with δEi = 1400 meV from tunnelling experiment. We used this coincidence to deconvolute the broad band for a set of elementary optic terms using a Lorentzian peak (Equation (8)) as a trial function.
First, we approximate the maximum as the best-defined feature with the reference at the upper part of the curve. The result is shown by dash-dotted line on
Figure 7a. Intriguing was the difference between the experimental curve and the calculated curve ”1400”. This residual is shown in
Figure 7a by dotted line and in
Figure 7b at an enlarged scale by the solid line. Surprisingly, the visual revealed three peaks at about 420, 250 and 20 meV. There is a small residue in the high energy part of the spectrum. It is shown in
Figure 7a by dotted line. The dash-dotted line shows the description of this residue by elementary term Equation (8) with δE
i = 5300 meV. Unfortunately, the maximum of the peak, if it exists, takes place outside the experimental range. As to the peak with the smallest excitation energy at about 5 meV in tunnelling experiment, it could not be observed at room temperature. To achieve the best description, shown by a thick solid line in
Figure 7a, we needed yet another peak at 90 meV shown by dash-dotted line in
Figure 7b.
Therefore, it can be considered that practically all the gaps identified in the tunnelling experiment were confirmed by an independent optical experiment.
7. Conclusions
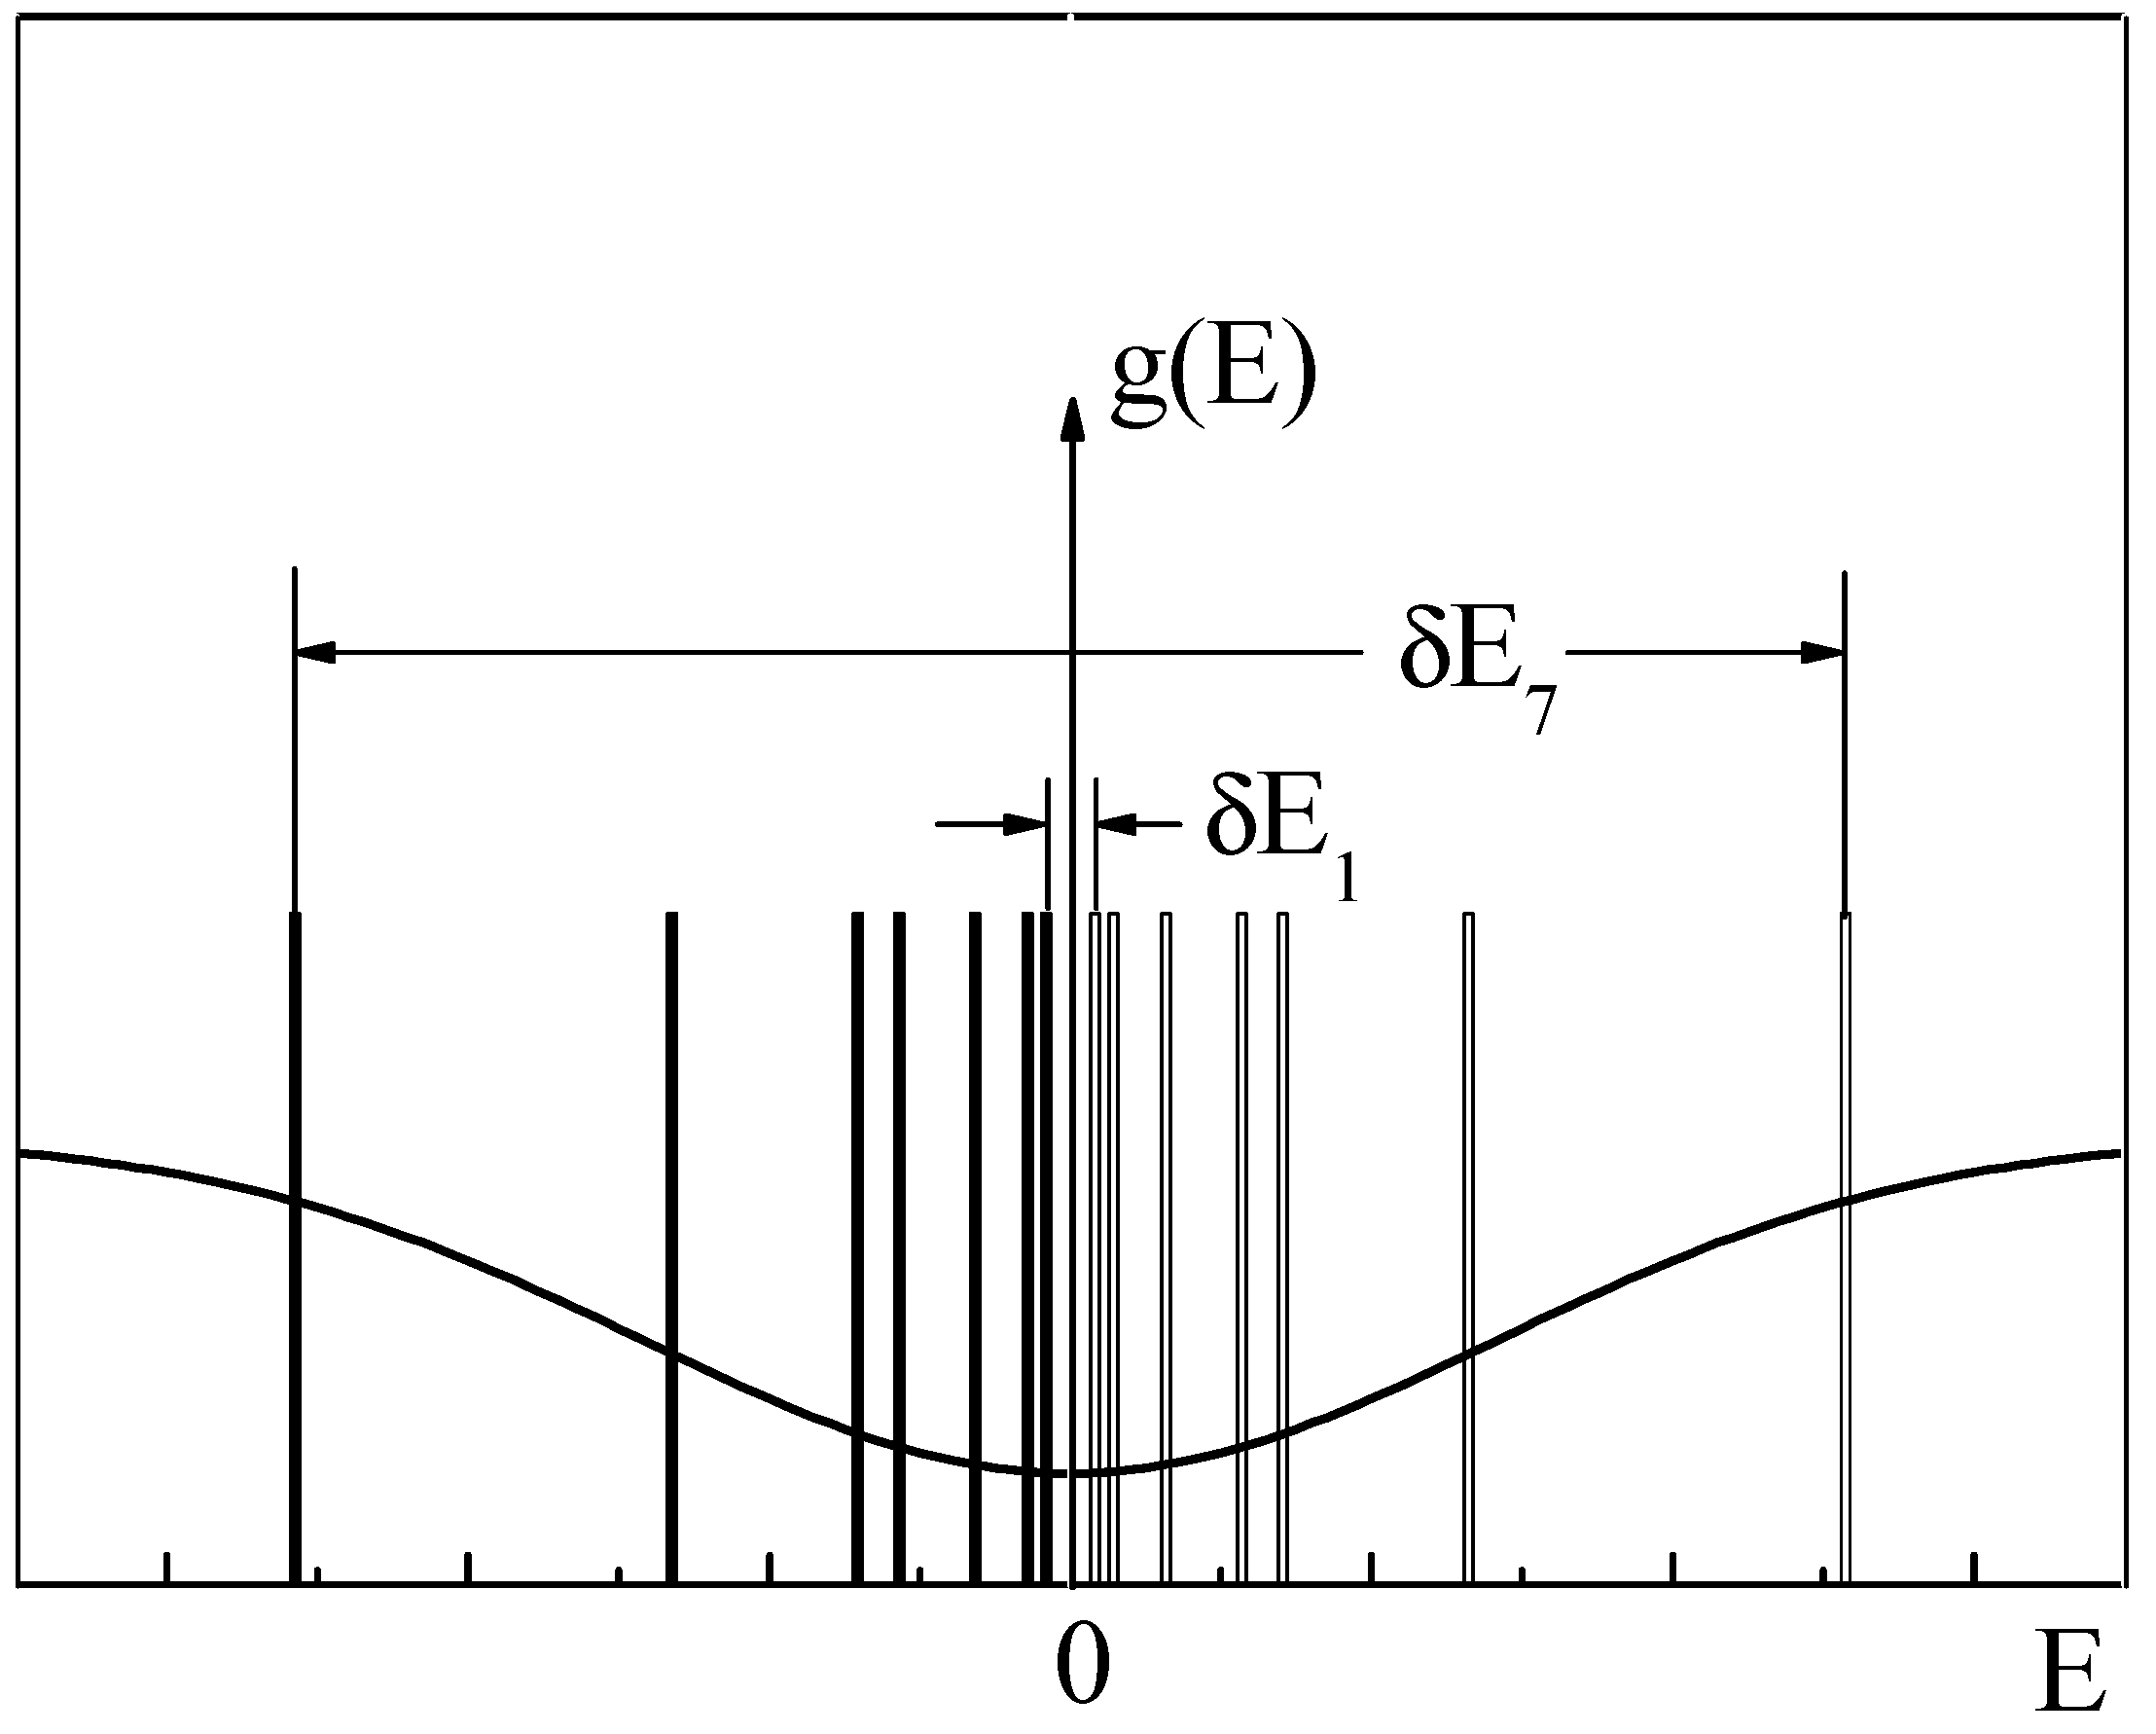
Such, in general terms, are the implications of our supposition that an excess heat capacity in quasicrystals is electronic in nature and is a sum of the Schottky thermal anomalies. To complete the above, remains to update the model of the electronic structure proposed earlier [
24,
25], taking into account the new data. The most comprehensive spectrum of two-level excitations (seven terms) in the range of 5 to 5300 meV was achieved by analysis of the tunnel characteristics. A slightly narrower spectrum (six terms) from 20 to 5300 meV was produced by the analysis of the optical conductivity. Finally, excess heat capacity analysis revealed two types of excitations. It is remarkable that a variety of experimental tools have revealed, to a greater or lesser extent, the same row of characteristic energies. This evidences that this row is an essential feature of the systems discussed. For the Al-Cu-Fe i-phases studied, such a row is a set of characteristic energies 5, 19, 80, 250, 400, 1400 and 5300 meV. With this knowledge, the updated scheme of the two-component model of the electronic structure is presented in
Figure 10.
On the other hand, the supposition that the continual and discrete components in our model are autonomic subsystems is confirmed firmly enough by Ziner’s mechanism of the fine structure of tunnel spectra.
Thus, the idea of designing the electronic structure with a simple (non-hybridizing) superimposition of continual and discrete components is confirmed by numerous experiments. Earlier, the idea was used in the theoretical model [
46]. Discrete component has been included in the DOS model by means of a self-similar Dirac comb along with a parabolic pseudogap. There is impressive external similarity between
Figure 10 and Figure 1 in [
46]. The physical relevance of this similarity requires a further study.
To conclude, the purpose of this investigation was to see what new knowledge calorimetric experiments can provide to the solution of the problem of singular electronic states in quasicrystals. Within the traditional understanding of the Schottky thermal anomalies, it can be definitely said that singular electronic states are a source of local two-level excitations and that the system of these excitations is not homogeneous. It should also be noted that with the present understanding of the nature of the residual metal-like carriers in quasicrystals, singular electronic states can coexist with the continuum of the conduction band states. The physicality of this implication also requires additional study.

