High Performance Negative Dielectric Anisotropy Liquid Crystals for Display Applications

Abstract
:1. Introduction
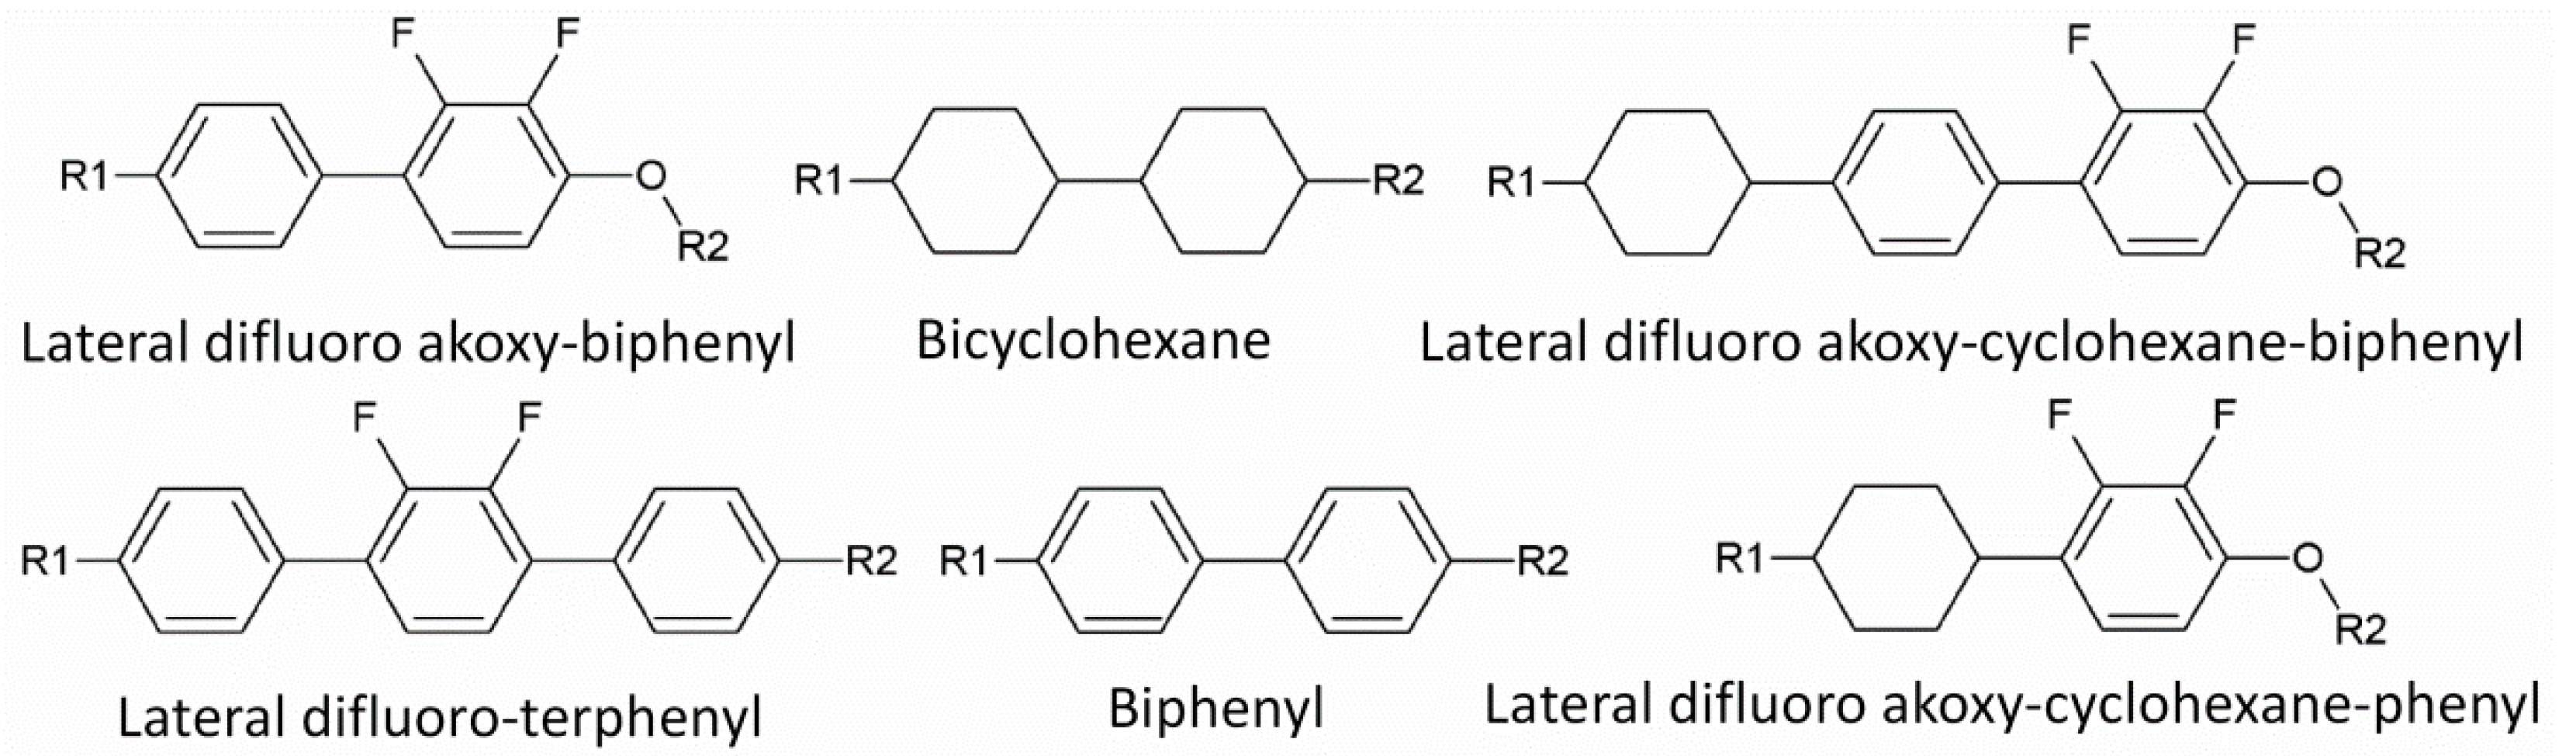
 < 0) liquid crystals (LCs) [1,2], in which the parallel permittivity (ε//) is smaller than the perpendicular one ( ), have been widely used for direct-view and projection displays. The common feature of a negative Δε LC is that lateral polar substituents induce a dipole moment perpendicular to the principal molecular axis [3,4,5]. As described in [6], there are several approaches to induce polarity perpendicular to the molecular axis, such as (i) using certain polar linking groups (e.g., ester); (ii) adding a polar unit at an axial position of a cyclohexane ring; (iii) positioning polar unit(s) in lateral positions of an aromatic ring; and (iv) using heterocyclic rings with the heteroatom off-axis. However, the off-axis polar group would decrease the aspect ratio of the cylindrical molecular shape and hence tend to disturb the liquid crystal phase stability. Furthermore, the magnitude of the Δε value will generally be much smaller than that of a positive Δε LC. To use multiple polar groups to enhance Δε often causes solubility problems or increases the rotational viscosity. Different off-axis polar groups, such as cyano and fluoro, have been employed to enlarge perpendicular dipole moment. To avoid image flickering [7], high resistivity is another crucial requirement for obtaining a high voltage-holding-ratio for active matrix liquid crystal displays (LCDs). A sufficiently large Δε helps to lower the driving voltage, which in turn lowers the power consumption of a mobile display. Fluoro group provides an excellent resistivity [8], modest dipole moment, and low viscosity. Laterally fluorinated liquid crystals [9], i.e., (2,3) difluorinated biphenyl, terphenyl [10] and tolane [11] usually exhibit a high resistivity and a modest Δε.
2. Response Time of Negative Δε LCs

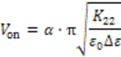
 (Z,t) is the deformed angle of the LC directors, E is the applied electric field, γ1 is the rotational viscosity of the LC, and Kii is the elastic constant corresponding to the LC alignment. For a negative Δε LC in IPS or FFS cell, the electric field mainly induces twist deformation [14,16]. Thus, Kii can be approximated by K22 (twist elastic constant) [24]. On the other hand, in a VA cell Kii is generally a weighted average of K11 (splay elastic constant) and K33 (bend elastic constant) [19]. However, under small angle approximation, K33 dominates and the contribution of K11 can be ignored. The rising process of LC directors can be accelerated by applying a high voltage for a short time, which is called overdrive method [25,26]. Meanwhile, during the decay period, if the holding voltage is close to threshold voltage (Vth), the decay time will be very slow. To speed up this relaxation process, the voltage can be turned off for a short period and then a small holding voltage is applied to keep the LC at the desired gray level; this is known as undershoot method [27]. However, the free relaxation time is intrinsically dependent on the LC properties and cell configuration. By substituting E = 0 into Equation (1), we can obtain the equation for the free relaxation process:


3. Negative Δε LCs for FFS Mode
3.1. Low Viscosity Negative Δε LCs

| LC Mixture | Tc (°C) | Δn (633 nm) | Δn (550 nm) | γ1/K33 (ms/μm2) | γ1 (mPas) | Δε |
|---|---|---|---|---|---|---|
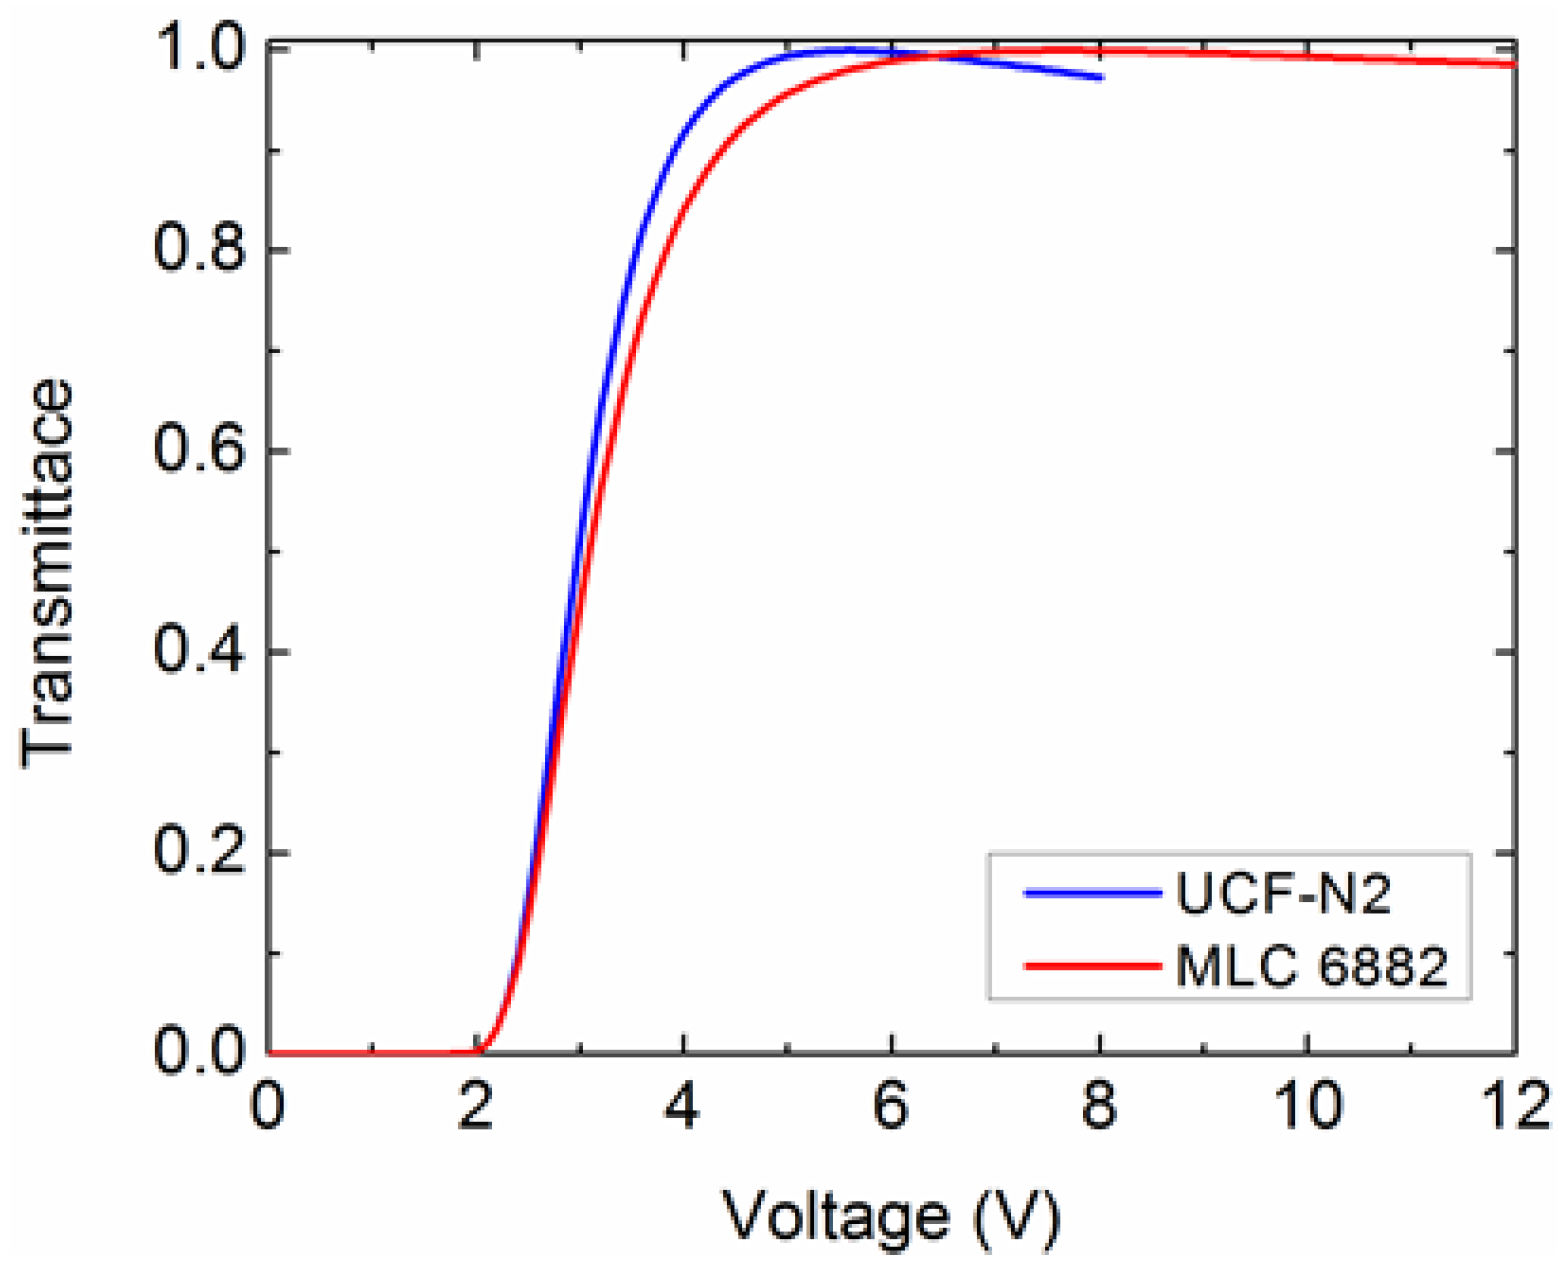
| MLC 6882 | 69 | 0.097 | 0.098 | 8.44 | 108 | −3.1 |
| UCF-N1 | 73.3 | 0.116 | 0.119 | 9.06 | 122.8 | −3.82 |
| UCF-P1 | 73.3 | 0.116 | 0.119 | 9.06 | 122.8 | 10 |
| HAV | 89.5 | 0.108 | 0.110 | 6.97 | 98.53 | −3.79 |
| ZOC | 79 | 0.101 | 0.103 | 5.60 | 93.34 | −4.36 |
| UCF-N2 | 75 | 0.112 | 0.117 | 6.00 | 94.71 | −3.77 |


3.2. Device Configuration

3.3. Phase Retardation Effect
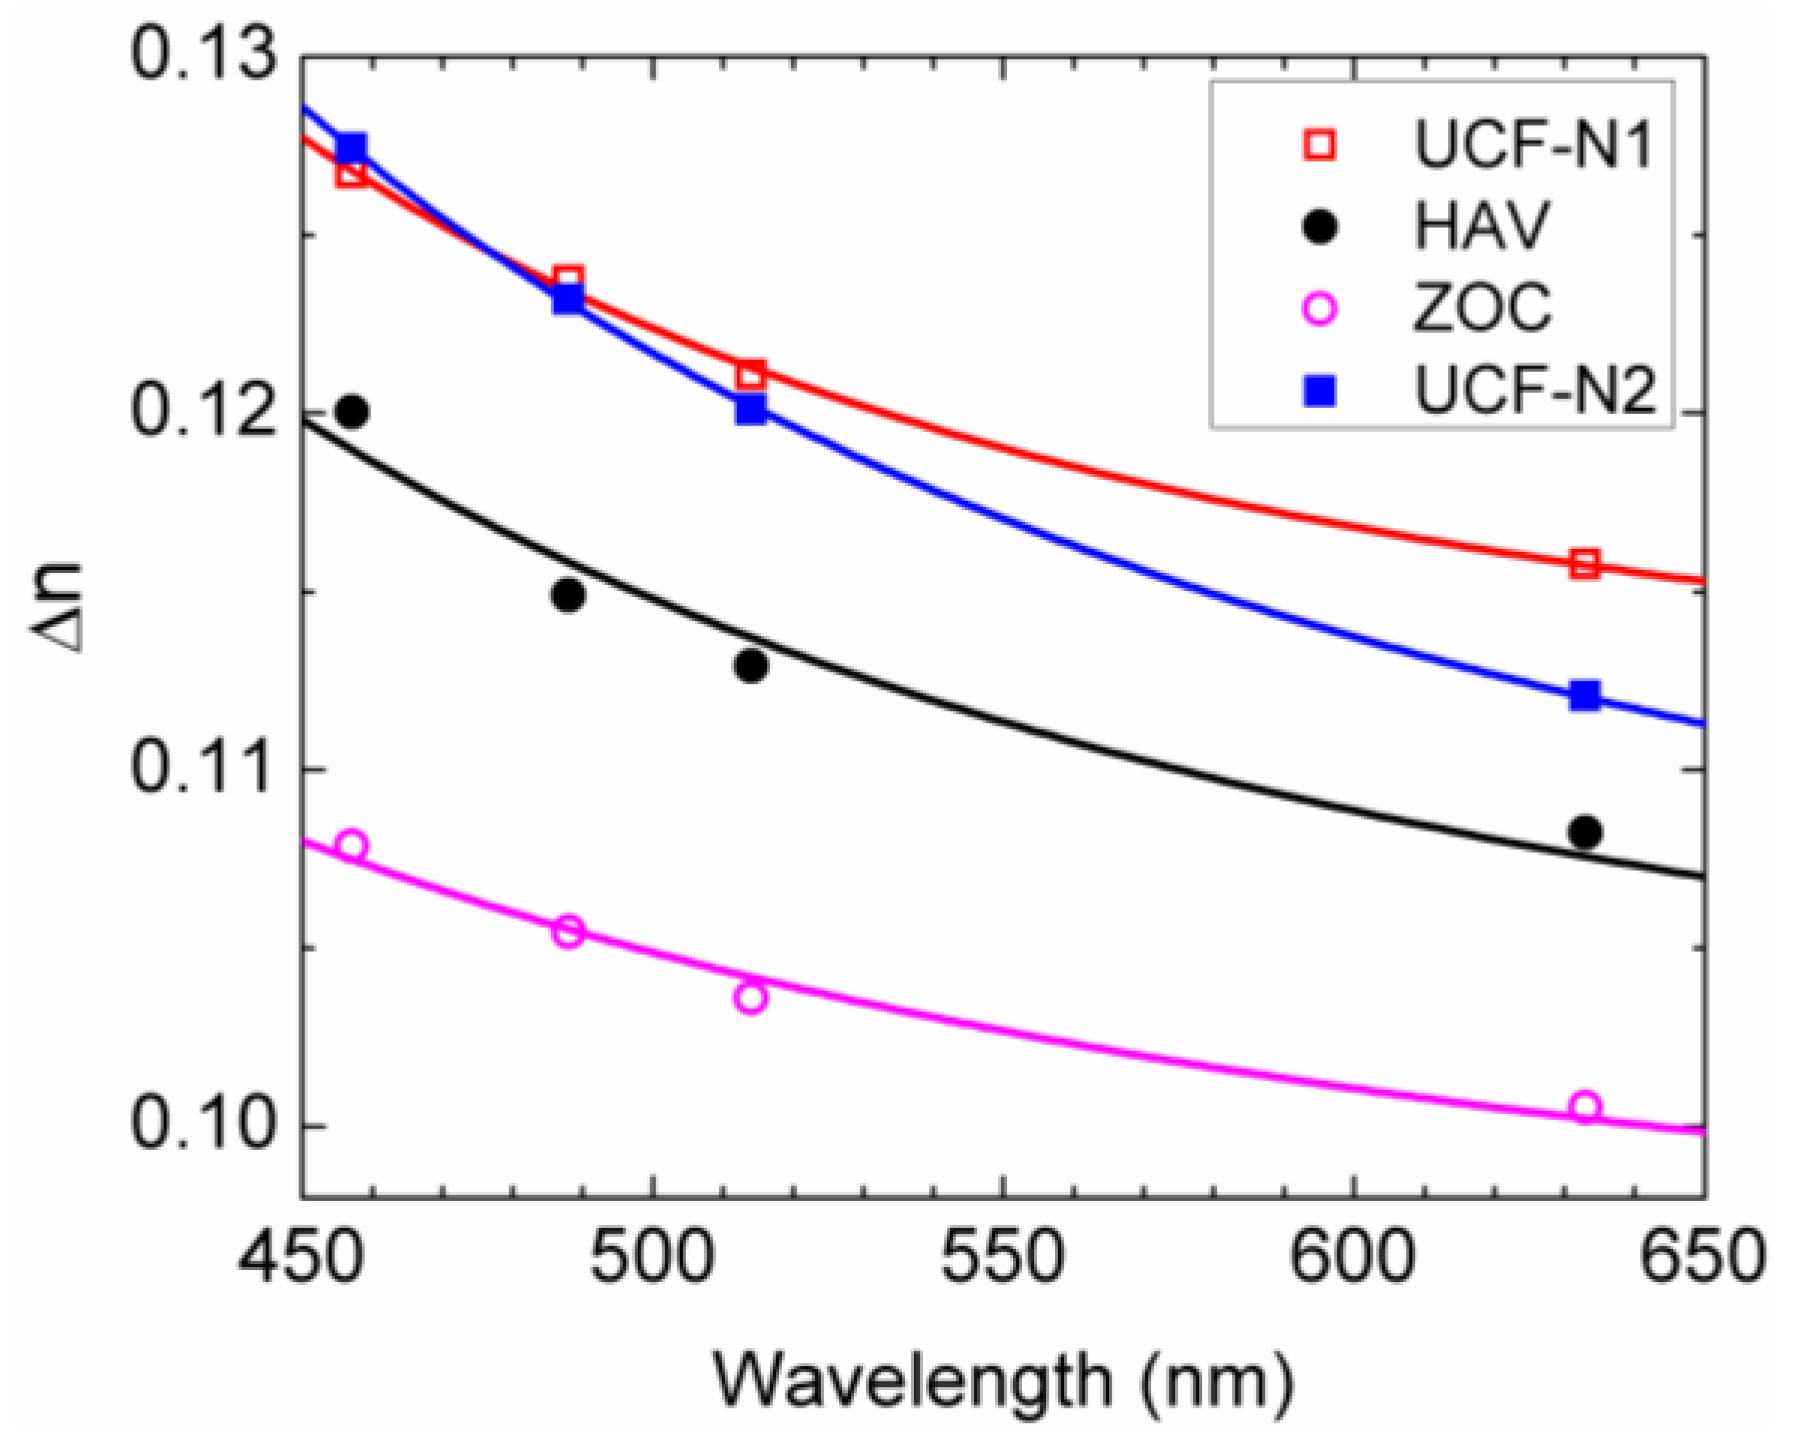
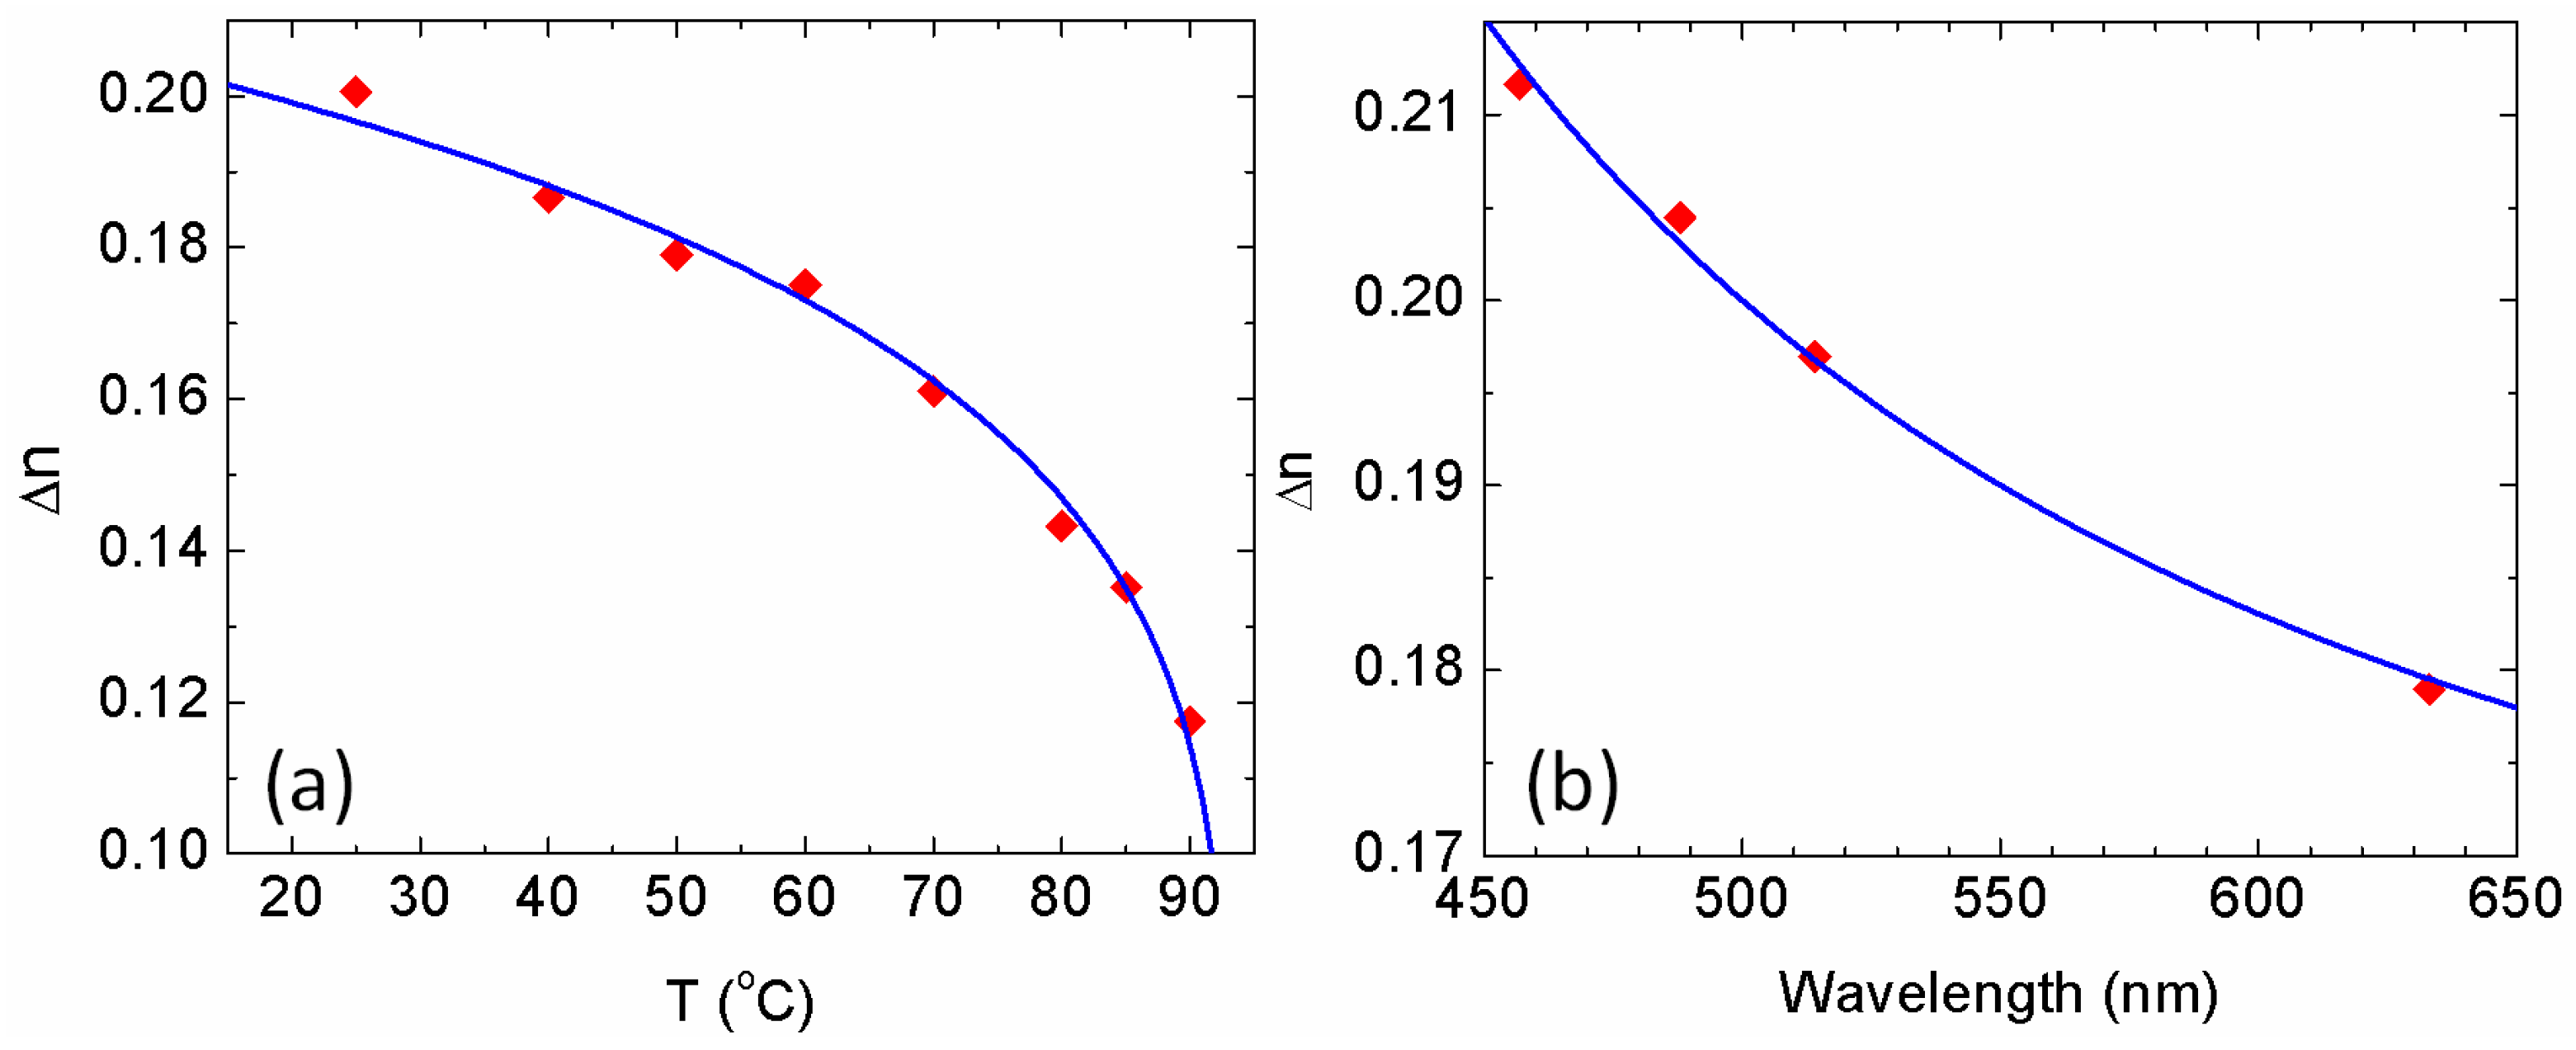
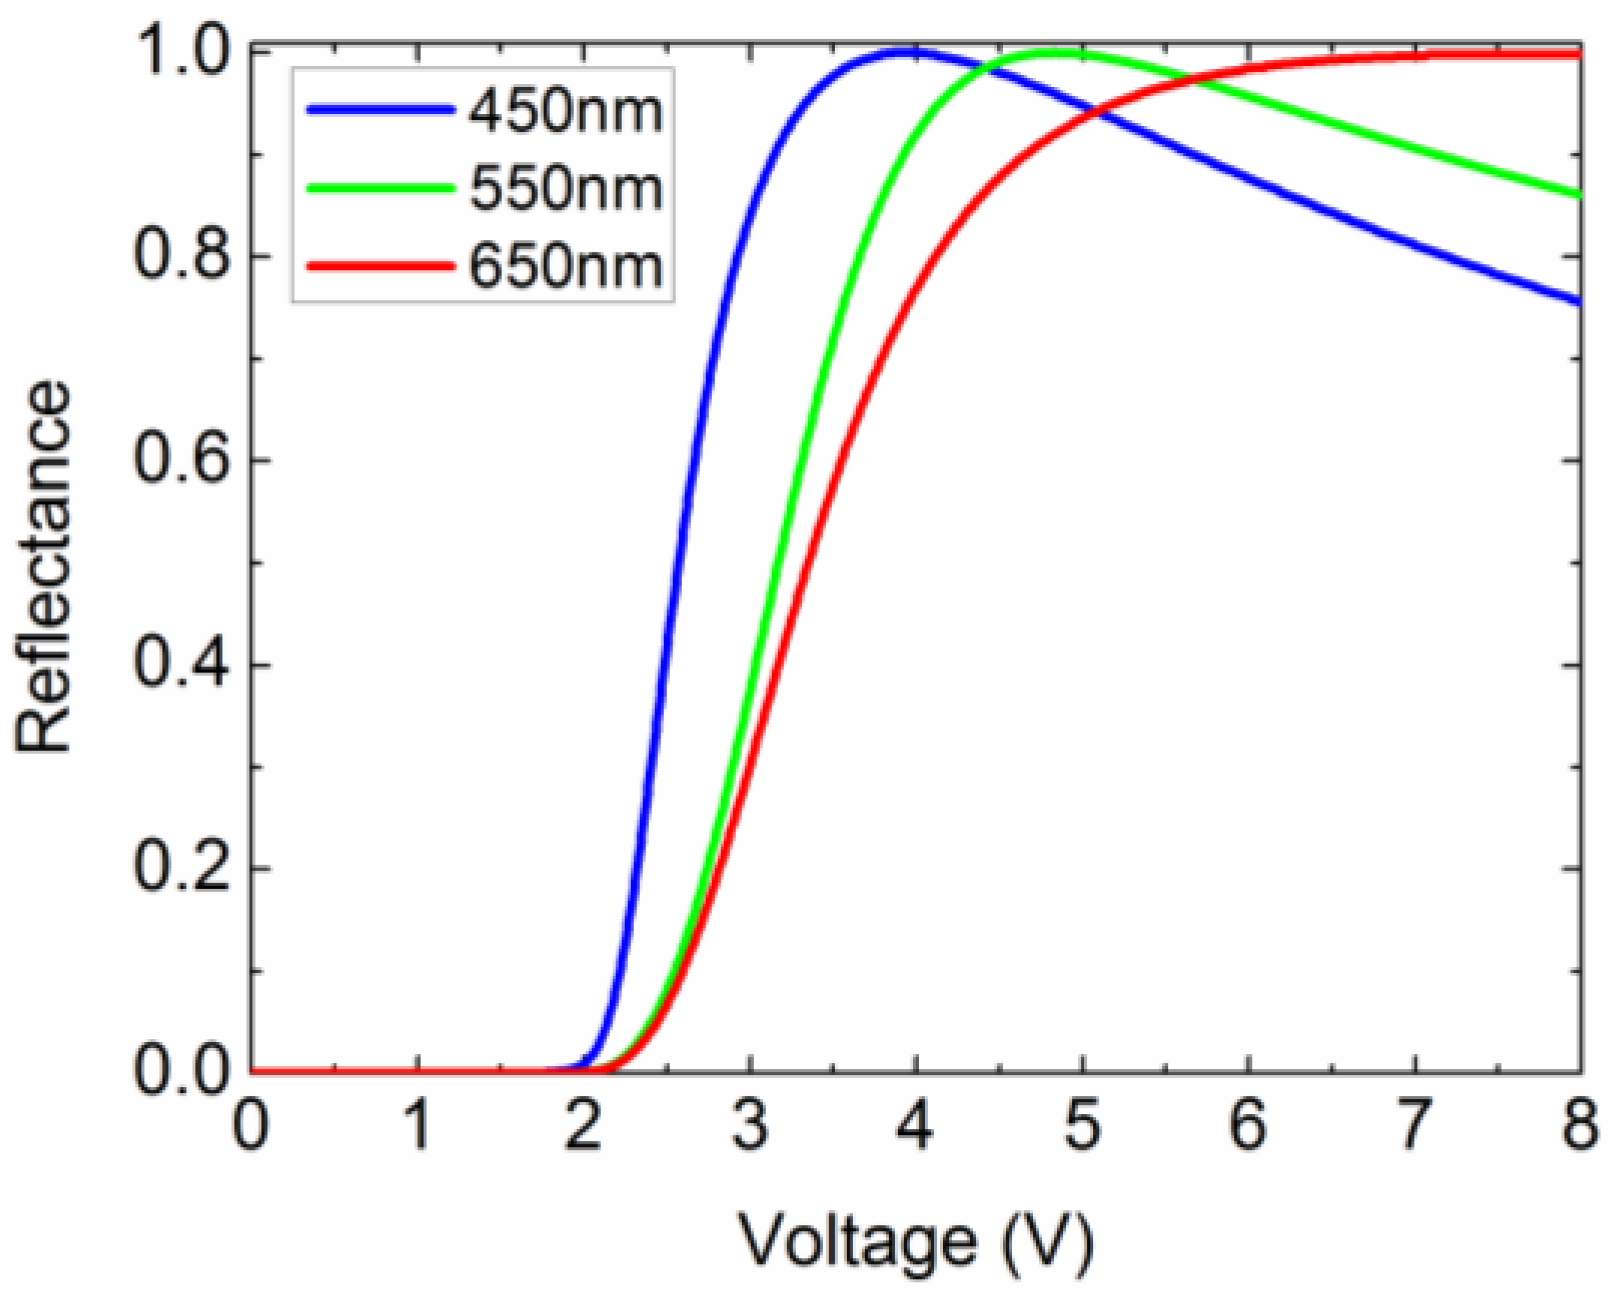
3.4. Wavelength Effect


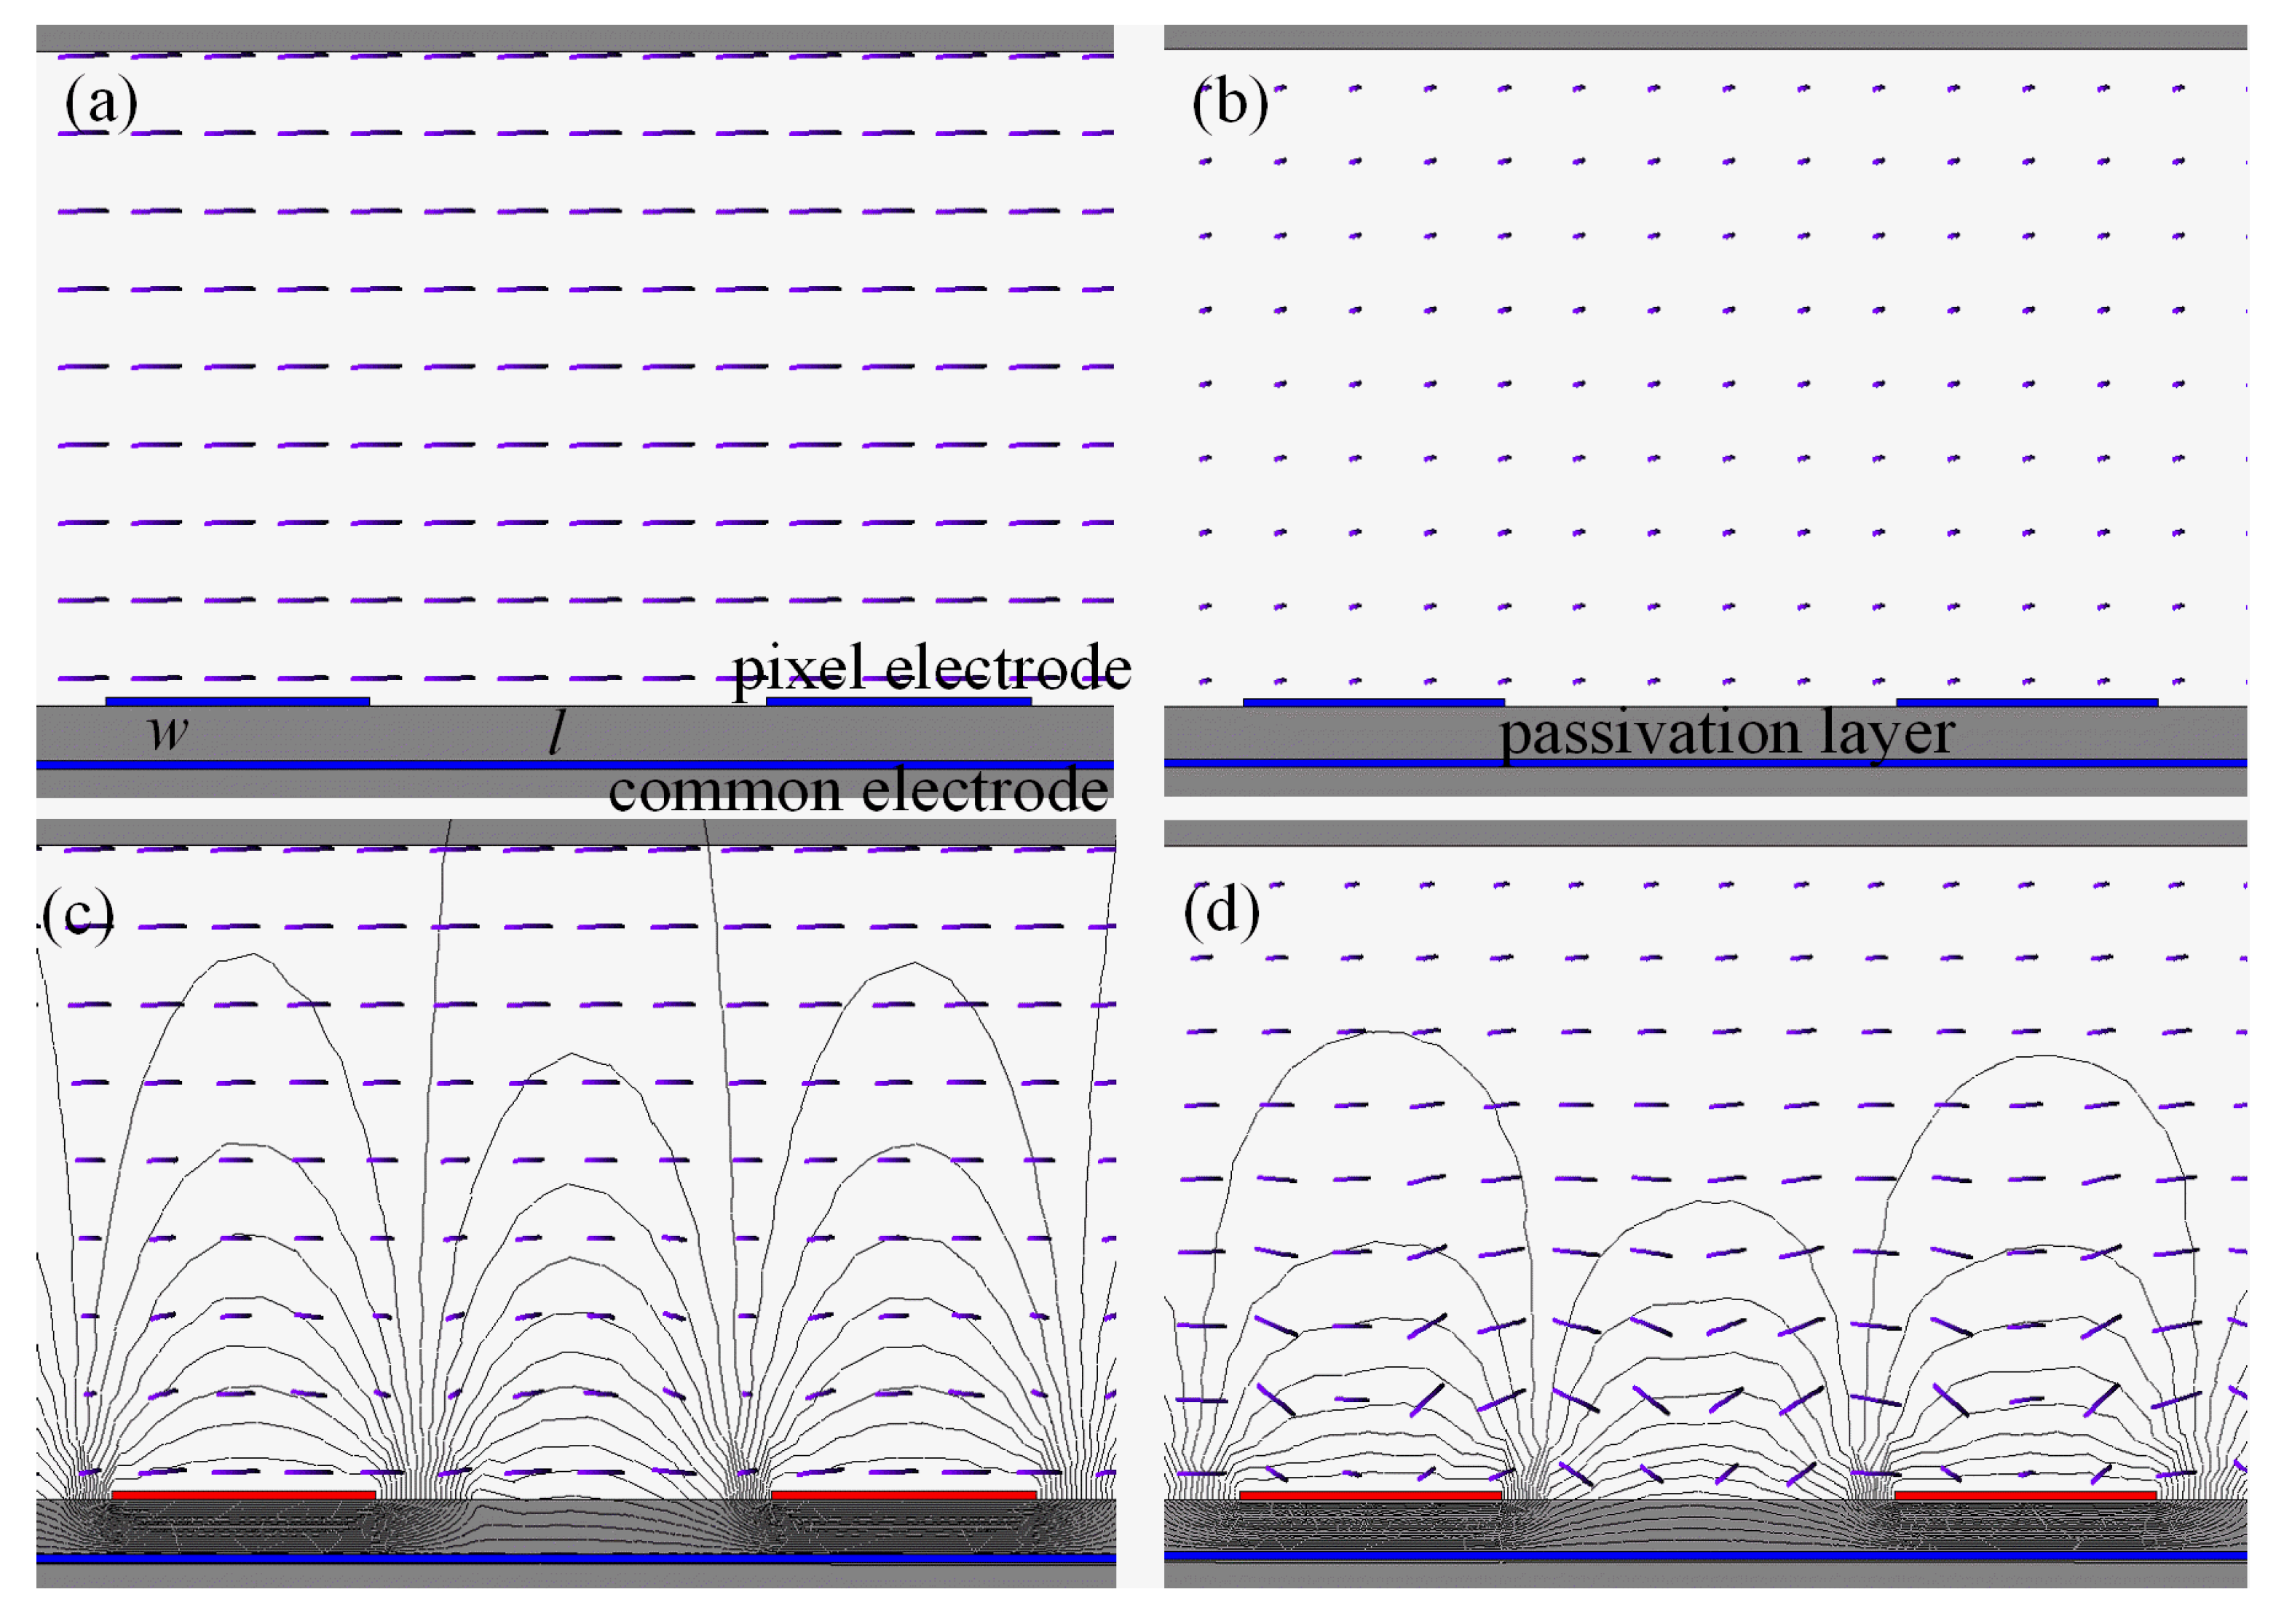
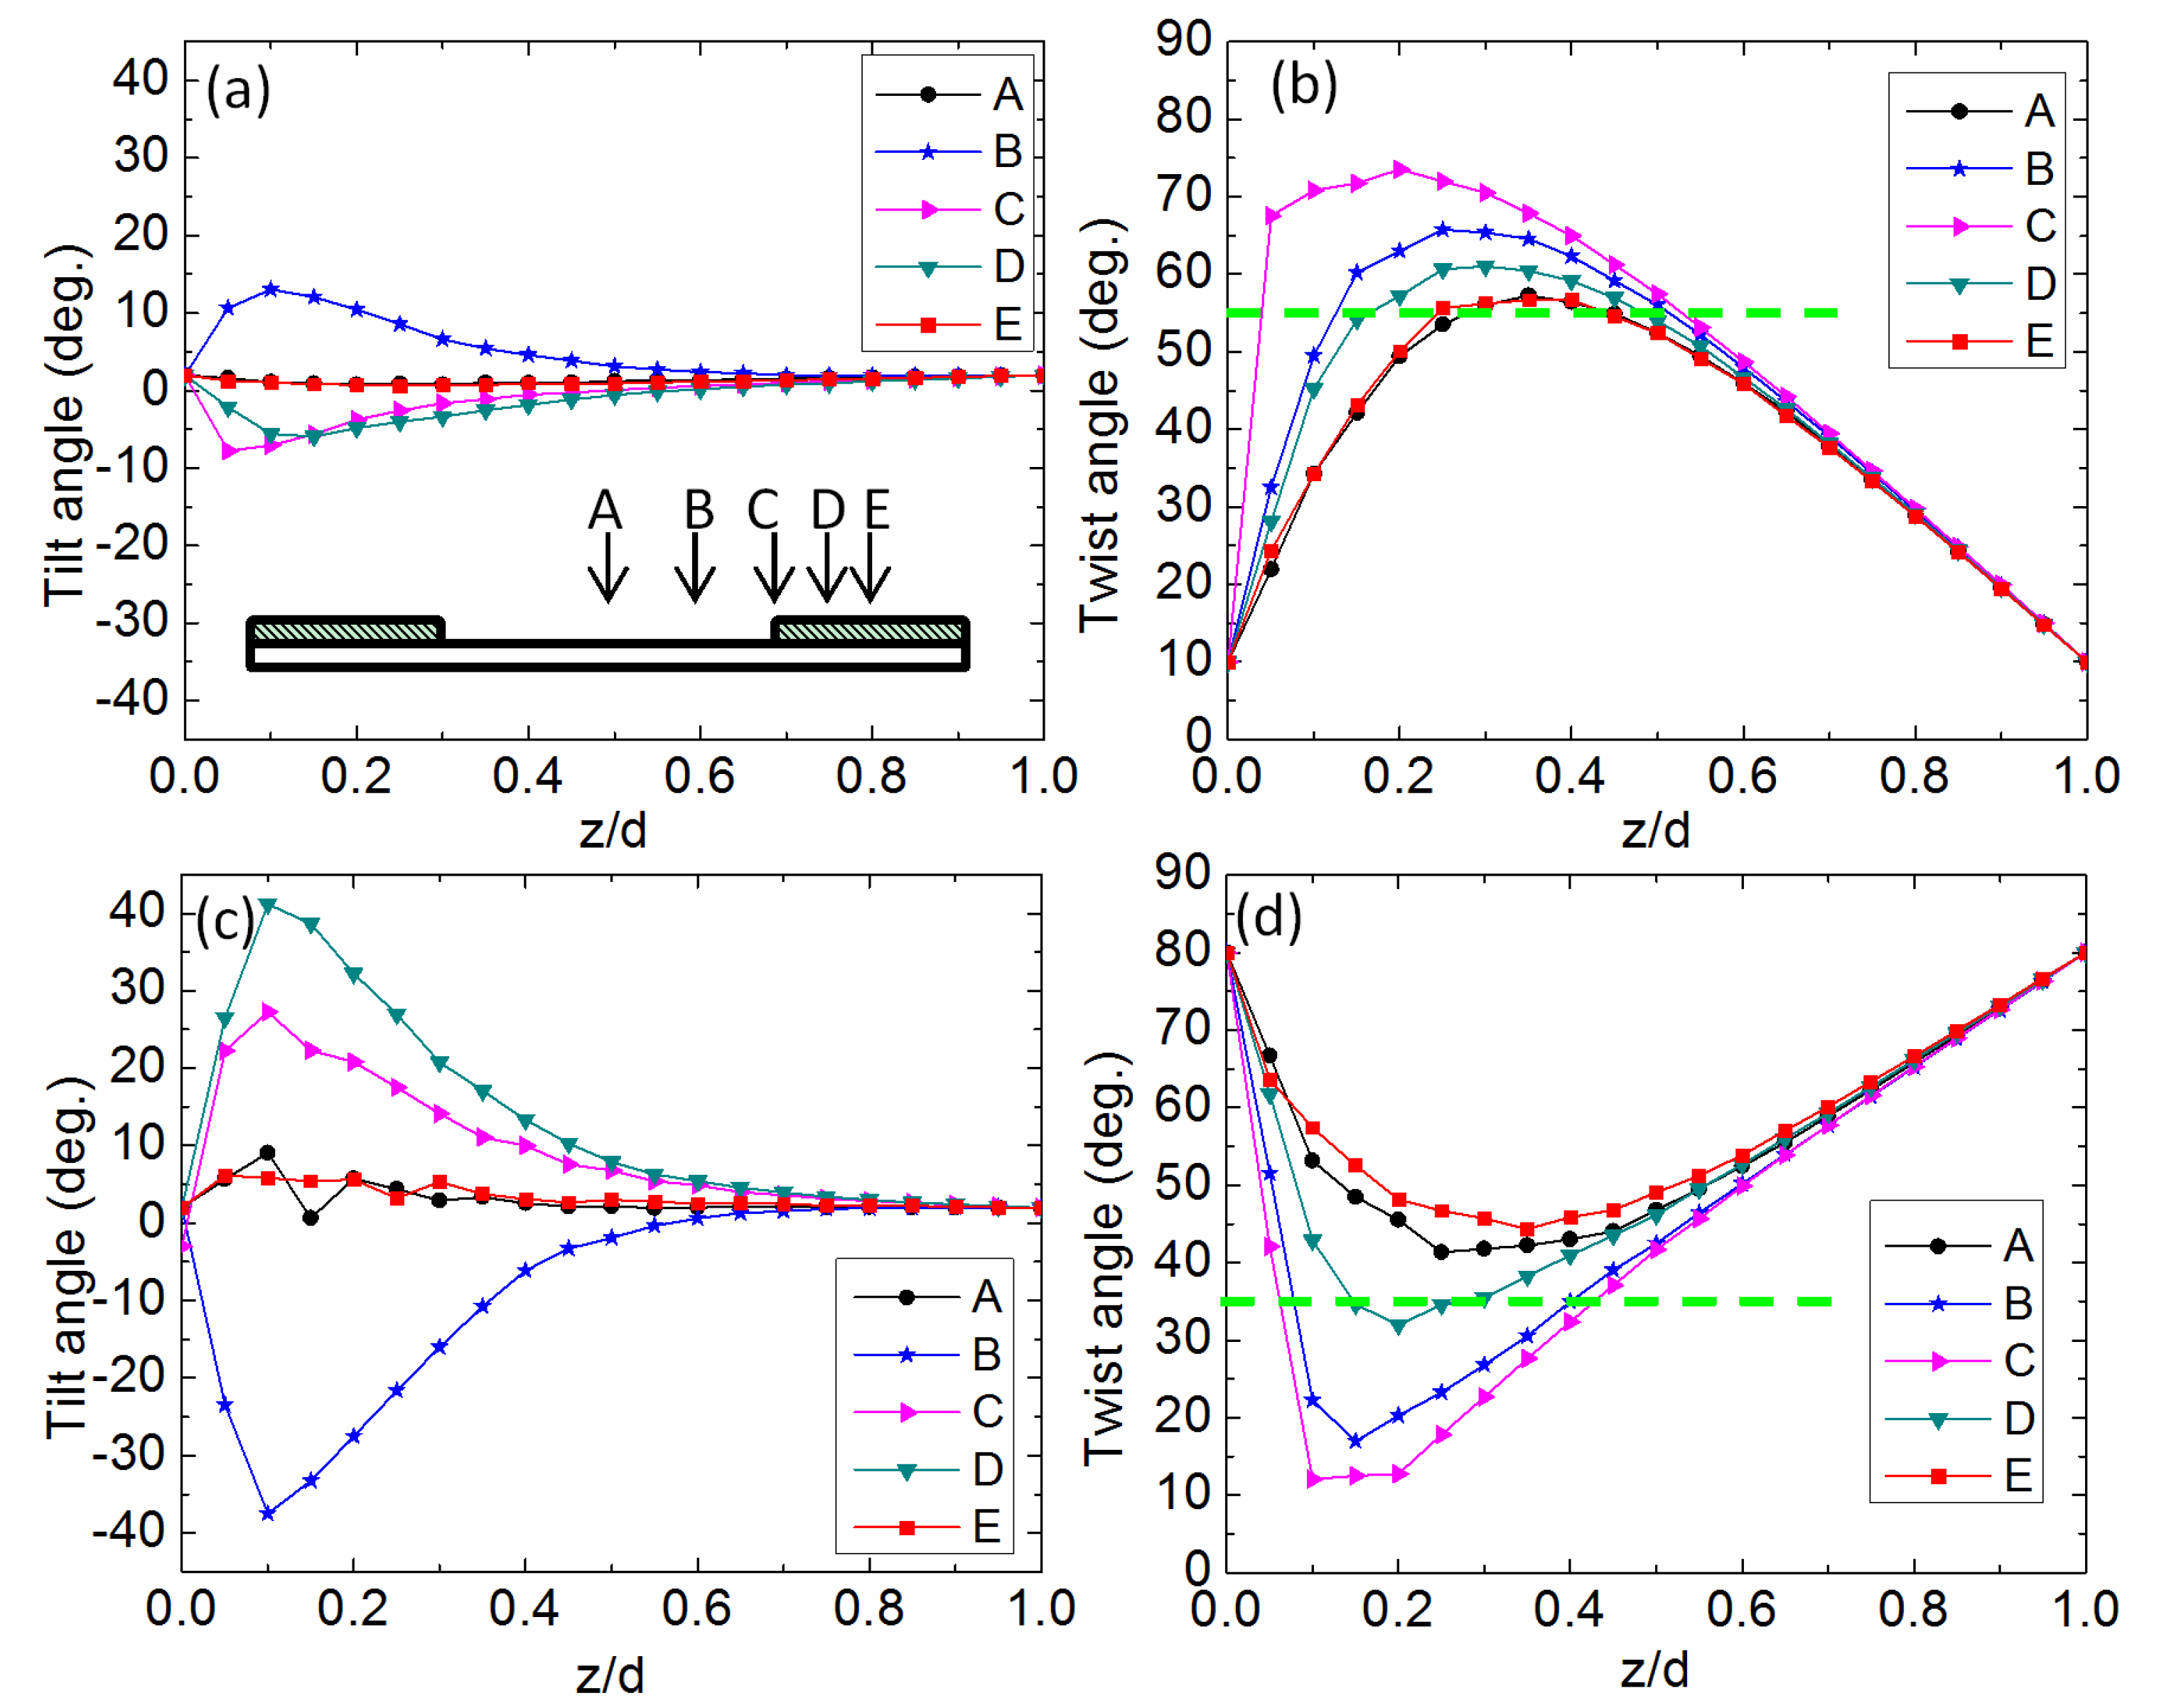
3.5. Director Deformation Distribution
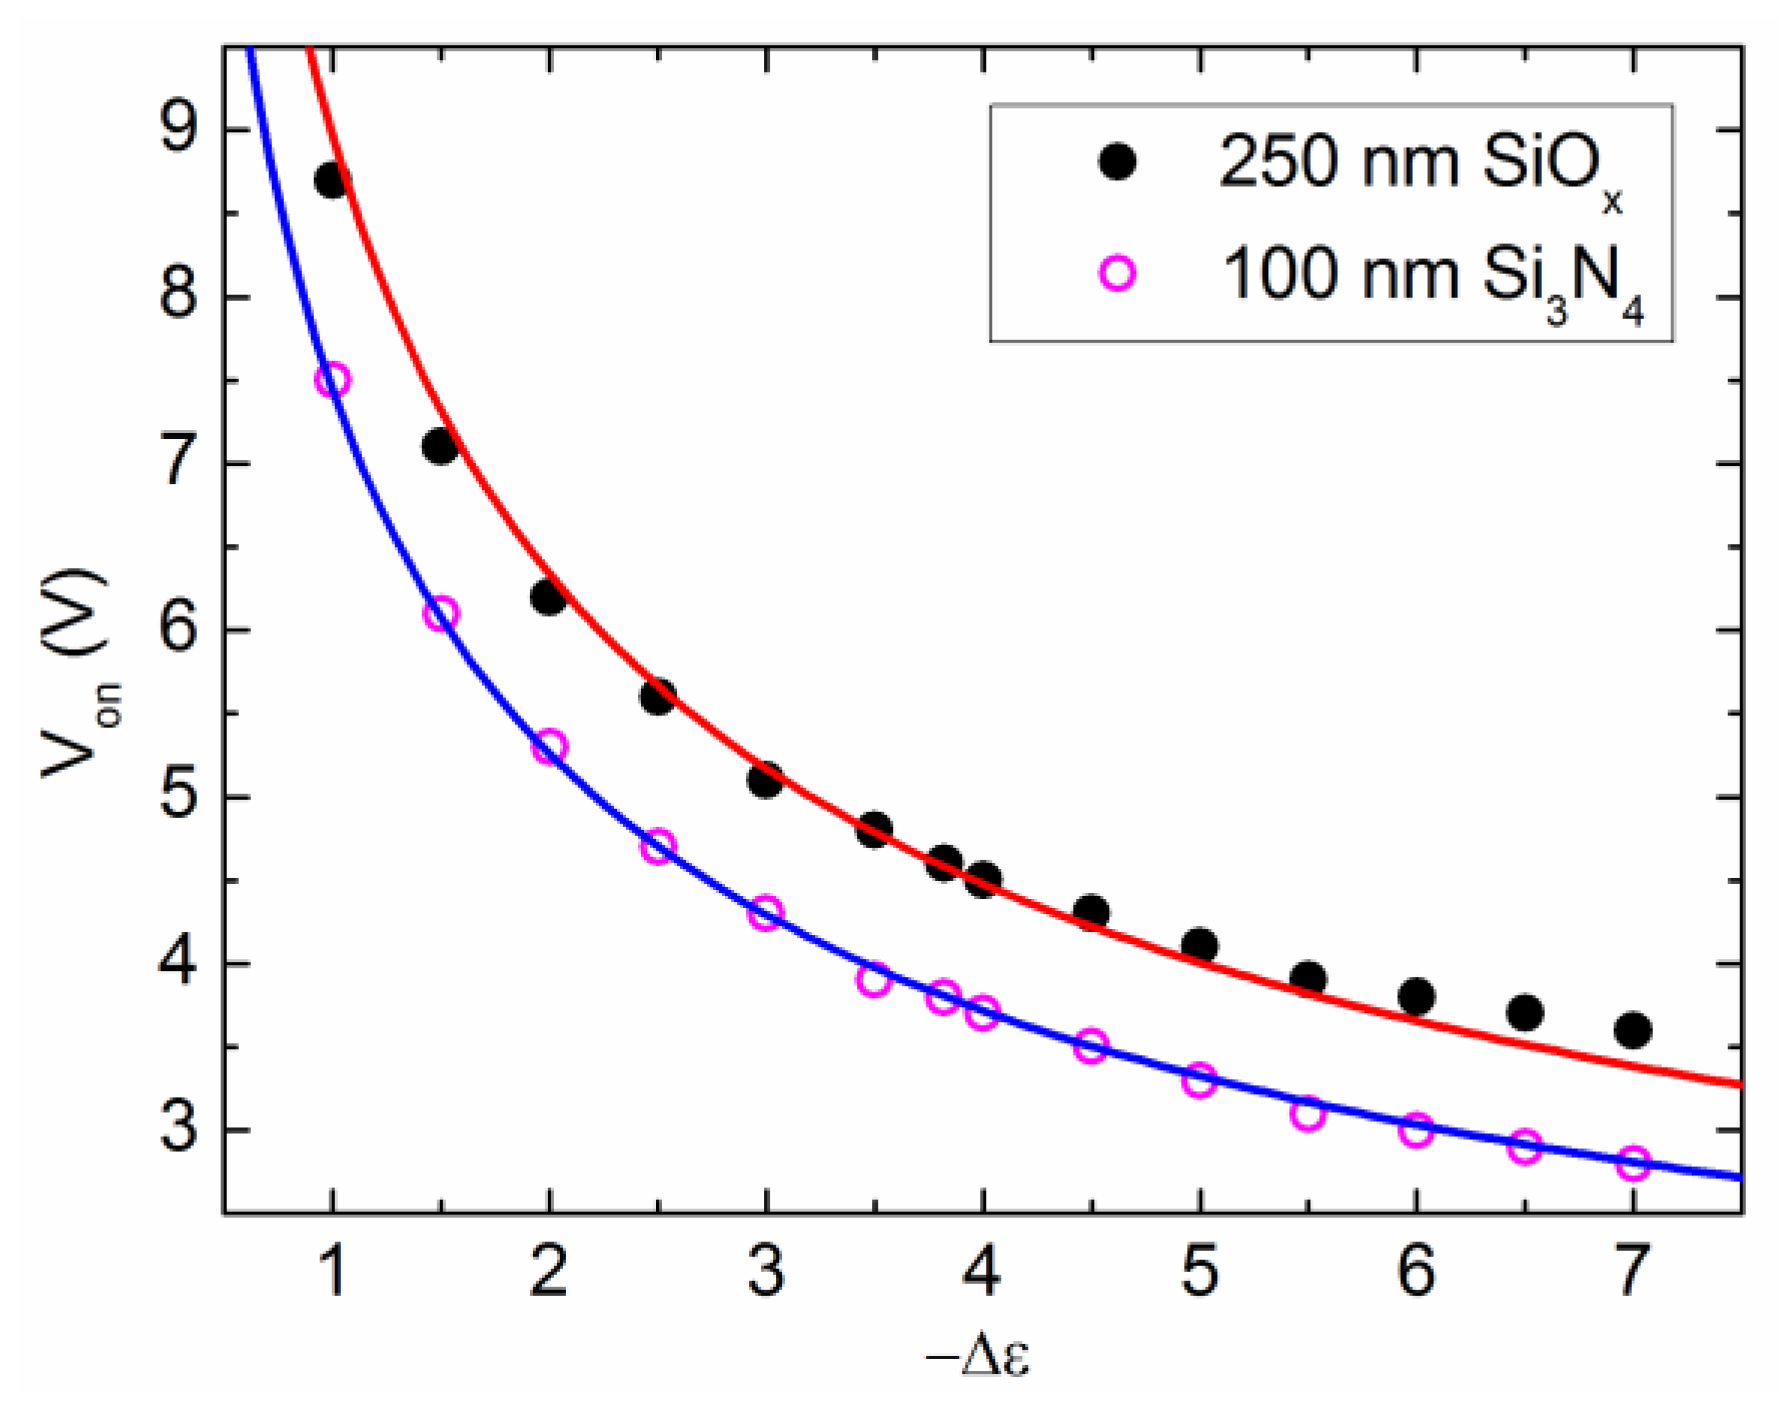
3.6. Low Operation Voltage
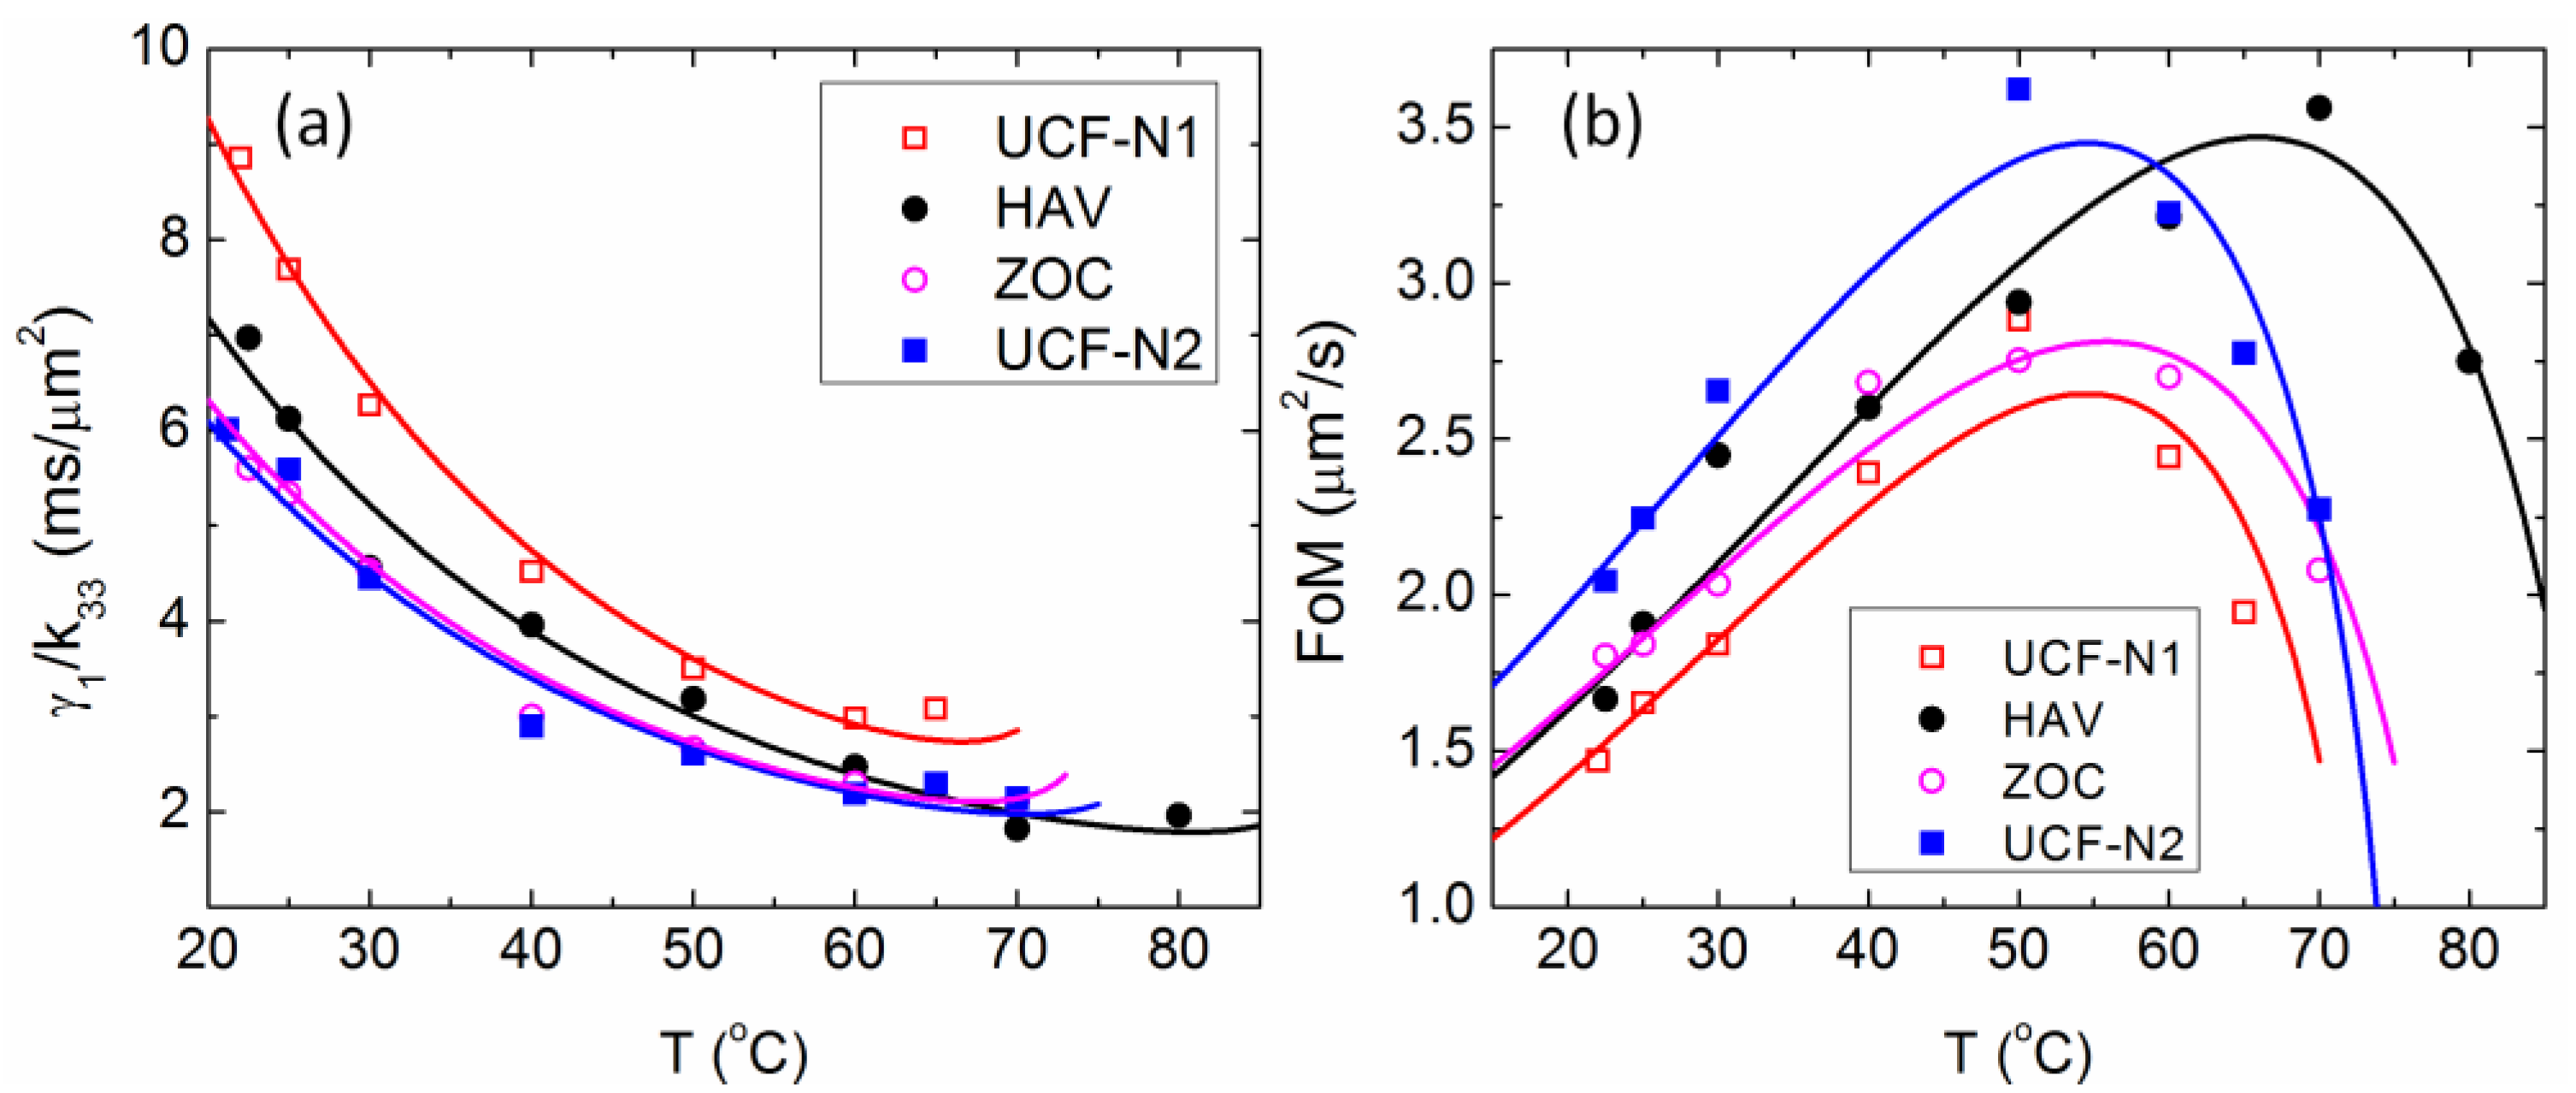
3.7. Response Time
3.8. Summary
4. Negative Δε LCs for VA Mode
4.1. LCOS
4.1.1. LC Material
4.1.2. Physical Properties

4.1.3. Simulation Results for VA LCOS
| Final Level | |||||||||
|---|---|---|---|---|---|---|---|---|---|
| Initial Level | – | 1 | 2 | 3 | 4 | 5 | 6 | 7 | 8 |
| 1 | – | 2.36 | 1.75 | 1.39 | 1.13 | 0.91 | 0.69 | 0.26 | |
| 2 | 0.34 | – | 1.31 | 1.13 | 0.95 | 0.79 | 0.60 | 0.22 | |
| 3 | 0.33 | 1.33 | – | 1.02 | 0.88 | 0.73 | 0.56 | 0.20 | |
| 4 | 0.34 | 1.19 | 1.03 | – | 0.83 | 0.69 | 0.53 | 0.18 | |
| 5 | 0.34 | 1.10 | 1.01 | 0.91 | – | 0.68 | 0.53 | 0.17 | |
| 6 | 0.35 | 1.04 | 0.98 | 0.88 | 0.78 | – | 0.53 | 0.16 | |
| 7 | 0.37 | 1.01 | 0.96 | 0.88 | 0.79 | 0.68 | – | 0.15 | |
| 8 | 0.40 | 1.01 | 0.97 | 0.90 | 0.83 | 0.74 | 0.63 | – | |
4.1.4. UV Stability
4.1.5. Summary
4.2. MVA Mode
5. Conclusions
Acknowledgments
Conflicts of Interest
References
- Kirsch, P.; Heckmeier, M.; Tarumi, K. Design and synthesis of nematic liquid crystals with negative dielectric anisotropy. Liq. Cryst. 1999, 26, 449–452. [Google Scholar] [CrossRef]
- Kirsch, P.; Reiffenrath, V.; Bremer, M. Nematic liquid crystals with negative dielectric anisotropy: Molecular design and synthesis. Synlett 1999, 1999, 389–396. [Google Scholar] [CrossRef]
- Klasen, M.; Bremer, M.; Tarumi, K. New liquid-crystal materials for active matrix displays with negative dielectric anisotropy and low rotational viscosity. Jpn. J. Appl. Phys. 2000, 39, L1180–L1182. [Google Scholar] [CrossRef]
- Kirsch, P.; Tarumi, K. A novel type of liquid crystals based on axially fluorinated cyclohexane units. Angew. Chem. Int. Ed. 1998, 37, 484–489. [Google Scholar] [CrossRef]
- Schadt, M. Liquid crystal materials and liquid crystal displays. Annu. Rev. Mater. Sci. 1997, 27, 305–379. [Google Scholar] [CrossRef]
- Hird, M.; Goodby, J.W.; Toyne, K.J. Nematic materials with negative dielectric anisotropy for display applications. Proc. SPIE 2000, 3955, 15–23. [Google Scholar] [CrossRef]
- Ogata, M.; Ukai, K.; Kawai, T. Visual fatigue in congenital nystagmus caused by viewing images of color sequential projectors. J. Disp. Technol. 2005, 1, 314–320. [Google Scholar] [CrossRef]
- Chen, Y.; Sun, J.; Xianyu, H.; Wu, S.T.; Liang, X.; Tang, H. High birefringence fluoro-terphenyls for thin-cell-gap TFT-LCDs. J. Disp. Technol. 2011, 7, 478–481. [Google Scholar] [CrossRef]
- Hird, M. Fluorinated liquid crystals—Properties and applications. Chem. Soc. Rev. 2007, 36, 2070–2095. [Google Scholar] [CrossRef]
- Gray, G.W.; Hird, M.; Toyne, K.J. The synthesis of several lateral difluoro-substituted 4,4′′-dialkyl- and 4,4′′-alkoxyalkyl-terphenyls and a rationalisation of the effect of such substitution on mesophase type and transition temperatures. Mol. Cryst. Liq. Cryst. 1991, 204, 43–64. [Google Scholar] [CrossRef]
- Wu, S.T.; Hsu, C.S.; Chen, J.M. Room temperature difluoro-tolane and diphenyl-diacetylene liquid crystals with negative dielectric anisotropy. Mol. Cryst. Liq. Cryst. 1997, 304, 441–445. [Google Scholar] [CrossRef]
- Li, Y.; Chen, Y.; Yan, J.; Liu, Y.; Cui, J.; Wang, Q.; Wu, S.T. Polymer-stabilized blue phase liquid crystal with a negative Kerr constant. Opt. Mater. Express 2012, 2, 1135–1140. [Google Scholar] [CrossRef]
- Ge, Z.; Zhu, X.; Wu, T.X.; Wu, S.T. High transmittance in-plane switching liquid crystal displays. J. Disp. Technol. 2006, 2, 114–120. [Google Scholar] [CrossRef]
- Oh-e, M.; Kondo, K. Electro-optical characteristics and switching behavior of the in-plane switching mode. Appl. Phys. Lett. 1995, 67, 3895–3897. [Google Scholar] [CrossRef]
- Lee, S.H.; Lee, S.L.; Kim, H.Y. Electro-optic characteristics and switching principle of a nematic liquid crystal cell controlled by fringe-field switching. Appl. Phys. Lett. 1998, 73, 2881–2883. [Google Scholar] [CrossRef]
- Chen, Y.; Luo, Z.; Peng, F.; Wu, S.T. Fringe-field wwitching with a negative dielectric anisotropy liquid crystal. J. Disp. Technol. 2013, 9, 74–77. [Google Scholar] [CrossRef]
- Yun, H.J.; Jo, M.H.; Jang, I.W.; Lee, S.H.; Ahn, S.H.; Hur, H.J. Achieving high light efficiency and fast response time in fringe field switching mode using a liquid crystal with negative dielectric anisotropy. Liq. Cryst. 2012, 39, 1141–1148. [Google Scholar] [CrossRef]
- Schiekel, M.F.; Fahrenschon, K. Deformation of nematic liquid crystals with vertical orientation in electrical fields. Appl. Phys. Lett. 1971, 19, 391–393. [Google Scholar] [CrossRef]
- Kahn, F.J. Electric-field-induced orientational deformation of nematic liquid-crystals: Tunable birefringence. Appl. Phys. Lett. 1972, 20, 199–201. [Google Scholar] [CrossRef]
- Takeda, A.; Kataoka, S.; Sasaki, T.; Chida, H.; Tsuda, H.; Ohmuro, K.; Sasabayashi, T.; Koike, Y.; Okamoto, K. A super-high image quality multi-domain vertical alignment LCD by new rubbing-less technology. SID Symp. Dig. Tech. Pap. 1998, 29, 1077–1080. [Google Scholar] [CrossRef]
- Ohmuro, K.; Kataoka, S.; Sasaki, T.; Koike, Y. Development of super-high-image-quality vertical-alignment-mode LCD. SID Int. Symp. Dig. Tech. Pap. 1997, 28, 845–850. [Google Scholar]
- Cuypers, D.; De Smet, H.; Van Calster, A. VAN LCOS microdisplays: A decade of technological evolution. J. Disp. Technol. 2011, 7, 127–134. [Google Scholar] [CrossRef]
- Khoo, I.C.; Wu, S.T. Optics and Nonlinear Optics of Liquid Crystals; World Scientific: Singapore, 1993. [Google Scholar]
- Yang, D.K.; Wu, S.T. Fundamentals of Liquid Crystal Devices; Wiley: New York, NY, USA, 2006. [Google Scholar]
- Wu, S.T.; Wu, C.S. Small angle relaxation of highly deformed nematic liquid crystals. Appl. Phys. Lett. 1988, 53, 1794–1796. [Google Scholar] [CrossRef]
- Xu, D.; Rao, L.; Tu, C.-D.; Wu, S.-T. Nematic liquid crystal display with submillisecond grayscale response time. J. Disp. Technol. 2013, 9, 67–70. [Google Scholar] [CrossRef]
- Wu, S.T. Nematic liquid crystal modulator with response time less than 100 μs at room temperature. Appl. Phys. Lett. 1990, 57, 986–988. [Google Scholar] [CrossRef]
- Wu, S.T.; Margerum, J.D.; Meng, H.B.; Dalton, L.R.; Hsu, C.S.; Lung, S.H. Room-temperature diphenyl-diacetylene liquid-crystals. Appl. Phys. Lett. 1992, 61, 630–632. [Google Scholar] [CrossRef]
- Wu, S.T.; Hsu, C.S.; Shyu, K.F. High birefringence and wide nematic range bis-tolane liquid crystals. Appl. Phys. Lett. 1999, 74, 344–346. [Google Scholar] [CrossRef]
- Sekine, C.; Fujisawa, K.; Iwakura, K.; Minai, M. High birefringence phenylacetylene liquid crystals with low viscosity. Mol. Cryst. Liq. Cryst. 2001, 364, 711–718. [Google Scholar] [CrossRef]
- Gauza, S.; Jiao, M.; Wu, S.T.; Kula, P.; Dąbrowski, R.; Liang, X. High birefringence and low viscosity negative dielectric anisotropy liquid crystals. Liq. Cryst. 2008, 35, 1401–1408. [Google Scholar] [CrossRef]
- Lee, S.H.; Lee, S.M.; Kim, H.Y.; Kim, J.M.; Hong, S.H.; Jeong, Y.H.; Park, C.H.; Choi, Y.J.; Lee, J.Y.; Koh, J.W. Ultra-FFS TFT-LCD with Super Image Quality and Fast Response Time. SID Symp. Dig. Tech. Pap. 2001, 32, 484–487. [Google Scholar] [CrossRef]
- Lee, S.H.; Lee, S.L.; Kim, H.Y.; Eom, T.Y. A novel wide-viewing-angle technology: Ultra-Trans View™. SID Symp. Dig. Tech. Pap. 1999, 30, 202–205. [Google Scholar] [CrossRef]
- Blinov, L.M.; Chigrinov, V.G. Electrooptic Effects in Liquid Crystal Materials; Springer-Verlag: New York, NY, USA, 1994. [Google Scholar]
- Lee, J.H.; Park, K.H.; Kim, S.H.; Choi, H.C.; Kim, B.K.; Yin, Y. AH-IPS: Superb display for mobile device. SID Symp. Dig. Tech. Pap. 2013, 44, 32–33. [Google Scholar] [CrossRef]
- Wen, C.H.; Gauza, S.; Wu, S.T. High-contrast vertical alignment of lateral difluoro-terphenyl liquid crystals. Appl. Phys. Lett. 2005, 87, 191909:1–191909:3. [Google Scholar] [CrossRef]
- Clark, M.G.; Raynes, E.P.; Smith, R.A.; Tough, R.J.A. Measurement of the permittivity of nematic liquid-crystals in magnetic and electric-fields using extrapolation procedures. J. Phys. D Appl. Phys. 1980, 13, 2151:1–2151:11. [Google Scholar]
- Wu, S.T.; Wu, C.S. Experimental confirmation of the Osipov-Terentjev theory on the viscosity of nematic liquid-crystals. Phys. Rev. A 1990, 42, 2219–2227. [Google Scholar] [CrossRef]
- Wu, S.T.; Efron, U.; Hess, L.D. Birefringence measurements of liquid-crystals. Appl. Opt. 1984, 23, 3911–3915. [Google Scholar] [CrossRef]
- Haller, I. Thermodynamic and static properties of liquid crystals. Prog. Solid State Chem. 1975, 10, 103–118. [Google Scholar] [CrossRef]
- Wu, S.T. Birefringence dispersions of liquid-crystals. Phys. Rev. A 1986, 33, 1270–1274. [Google Scholar] [CrossRef]
- Wu, S.T.; Lackner, A.M.; Efron, U. Optimal operation temperature of liquid-crystal modulators. Appl. Opt. 1987, 26, 3441–3445. [Google Scholar] [CrossRef]
- Lien, A. Extended Jones Matrix representation for the twisted nematic liquid-crystal display at oblique-incidence. Appl. Phys. Lett. 1990, 57, 2767–2769. [Google Scholar] [CrossRef]
- Ge, Z.B.; Wu, S.T.; Kim, S.S.; Park, J.W.; Lee, S.H. Thin cell fringe-field-switching liquid crystal display with a chiral dopant. Appl. Phys. Lett. 2008, 92, 181109:1–181109:3. [Google Scholar]
- Hong, S.H.; Park, I.C.; Kim, H.Y.; Lee, S.H. Electro-optic characteristic of fringe-field switching mode depending on rubbing direction. Jpn. J. Appl. Phys. 2000, 39, L527–L530. [Google Scholar]
- Sun, Y.; Zhang, Z.; Ma, H.; Zhu, X.; Wu, S.T. Optimal rubbing angle for reflective in-plane-switching liquid crystal displays. Appl. Phys. Lett. 2002, 81, 4907–4909. [Google Scholar] [CrossRef]
- Jiao, M.; Ge, Z.; Song, Q.; Wu, S.T. Alignment layer effects on thin liquid crystal cells. Appl. Phys. Lett. 2008, 92, 061102:1–061102:3. [Google Scholar]
- Hatsumi, R.; Kubota, Y.; Moriya, K.; Kubota, D.; Tanabe, T.; Kusunoki, K.; Hirakata, Y.; Koyama, J.; Yamazaki, S.; Nakamura, A.; Chubachi, Y. Driving method of FFS-Mode OS-LCD for reducing eye strain. SID Symp. Dig. Tech. Pap. 2013, 44, 338–341. [Google Scholar] [CrossRef]
- Lu, R.; Zhu, X.; Wu, S.T.; Hong, Q.; Wu, T.X. Ultrawide-view liquid crystal displays. J. Disp. Technol. 2005, 1, 3–14. [Google Scholar] [CrossRef]
- Zhu, X.; Ge, Z.; Wu, S.T. Analytical solutions for uniaxial-film-compensated wide-view liquid crystal displays. J. Disp. Technol. 2006, 2, 2–20. [Google Scholar] [CrossRef]
- Armitage, D.; Underwood, I.; Wu, S.T. Introduction to Miscrodisplay; Wiley: Hoboken, NJ, USA, 2006. [Google Scholar]
- Brennesholtz, M.S.; Stupp, E.H. Projection Displays; Wiley: Chichester, UK, 2008. [Google Scholar]
- Gauza, S.; Zhu, X.; Piecek, W.; Dabrowski, R.; Wu, S.T. Fast switching liquid crystals for color-sequential LCDs. J. Disp. Technol. 2007, 3, 250–252. [Google Scholar] [CrossRef]
- Wu, S.T.; Wu, C.S. Mixed-mode twisted nematic liquid crystal cells for reflective displays. Appl. Phys. Lett. 1996, 68, 1455–1457. [Google Scholar] [CrossRef]
- Lee, S.; Mao, C.C.; Johnson, K.M. Fast-switching liquid-crystal-on-silicon microdisplay with Framebuffer pixels and surface-mode optically compensated birefringence. Opt. Eng. 2006, 45, 127402:1–127402:8. [Google Scholar]
- Fan-Chiang, K.H.; Wu, S.T.; Chen, S.H. Fringing-field effects on high-resolution liquid crystal microdisplays. J. Disp. Technol. 2005, 1, 304–313. [Google Scholar] [CrossRef]
- Wang, H.; Wu, T.X.; Zhu, X.; Wu, S.T. Correlations between liquid crystal director reorientation and optical response time of a homeotropic cell. J. Appl. Phys. 2004, 95, 5502–5508. [Google Scholar] [CrossRef]
- Chen, Y.; Peng, F.; Wu, S.T. Submillisecond-response vertical-aligned liquid crystal for color sequential projection displays. J. Disp. Technol. 2013, 9, 78–81. [Google Scholar] [CrossRef]
- Wen, C.H.; Gauza, S.; Wu, S.T. Photostability of liquid crystals and alignment layers. J. Soc. Inf. Disp. 2005, 13, 805–811. [Google Scholar] [CrossRef]
- Kim, S.S. The world’s largest (82-in) TFT-LCD. SID Symp. Dig. Tech. Pap. 2005, 36, 1842–1847. [Google Scholar] [CrossRef]
- Miyachi, K.; Kobayashi, K.; Yamada, Y.; Mizushima, S. The world’s first photo alignment LCD technology applied to Generation Ten factory. SID Symp. Dig. Tech. Pap. 2010, 41, 579–582. [Google Scholar] [CrossRef]
- Lee, S.H.; Kim, S.M.; Wu, S.T. Emerging vertical-alignment liquid-crystal technology associated with surface modification using UV-curable monomer. J. Soc. Inf. Disp. 2009, 17, 551–559. [Google Scholar] [CrossRef]
- Hong, H.; Shin, H.; Chung, I. In-plane switching technology for liquid crystal display television. J. Disp. Technol. 2007, 3, 361–370. [Google Scholar] [CrossRef]
© 2013 by the authors; licensee MDPI, Basel, Switzerland. This article is an open access article distributed under the terms and conditions of the Creative Commons Attribution license (http://creativecommons.org/licenses/by/3.0/).
Share and Cite
Chen, Y.; Peng, F.; Yamaguchi, T.; Song, X.; Wu, S.-T. High Performance Negative Dielectric Anisotropy Liquid Crystals for Display Applications. Crystals 2013, 3, 483-503. https://doi.org/10.3390/cryst3030483
Chen Y, Peng F, Yamaguchi T, Song X, Wu S-T. High Performance Negative Dielectric Anisotropy Liquid Crystals for Display Applications. Crystals. 2013; 3(3):483-503. https://doi.org/10.3390/cryst3030483
Chicago/Turabian StyleChen, Yuan, Fenglin Peng, Takashi Yamaguchi, Xiaolong Song, and Shin-Tson Wu. 2013. "High Performance Negative Dielectric Anisotropy Liquid Crystals for Display Applications" Crystals 3, no. 3: 483-503. https://doi.org/10.3390/cryst3030483