The thermodynamic properties of three different Mg films, namely Mg/Ti/Pd, Mg/Ta/Pd and Mg/Fe/Pd were investigated using hydrogenography. All of them show qualitatively and quantitatively similar results. Consequently, experimental data for only one set of films, i.e., Mg/Ta/Pd are presented here.
2.1. Hydrogenography Experiments on Mg/Ta/Pd Films
Mg hydride is known for its slow kinetics, especially at low temperatures. To verify the quasi-equilibrium state of the hydrogenation process at these temperatures, loading at 333 K was performed twice with a different measuring times. Based on our previous experience, the time of the first loading was set to 35 h and during the second one it was increased to 44 h. Both absorption isotherms show the same (de-)hydrogenation behavior, proving that no kinetic factor is influencing the experimental results. It is worth mentioning that the unloading isotherm was measured for 72 h.
The pressure-transmission-isotherms of Mg/Ta/Pd thin films for the whole temperature range measured are collected in
Figure 1. All isotherms show very flat plateaus in both absorption and desorption. As a sloping pressure plateau in nano-sized materials is often related to kinetic problems [
9,
10], this is an additional proof that we indeed probe the equilibrium properties of the Mg/Ta/Pd films.
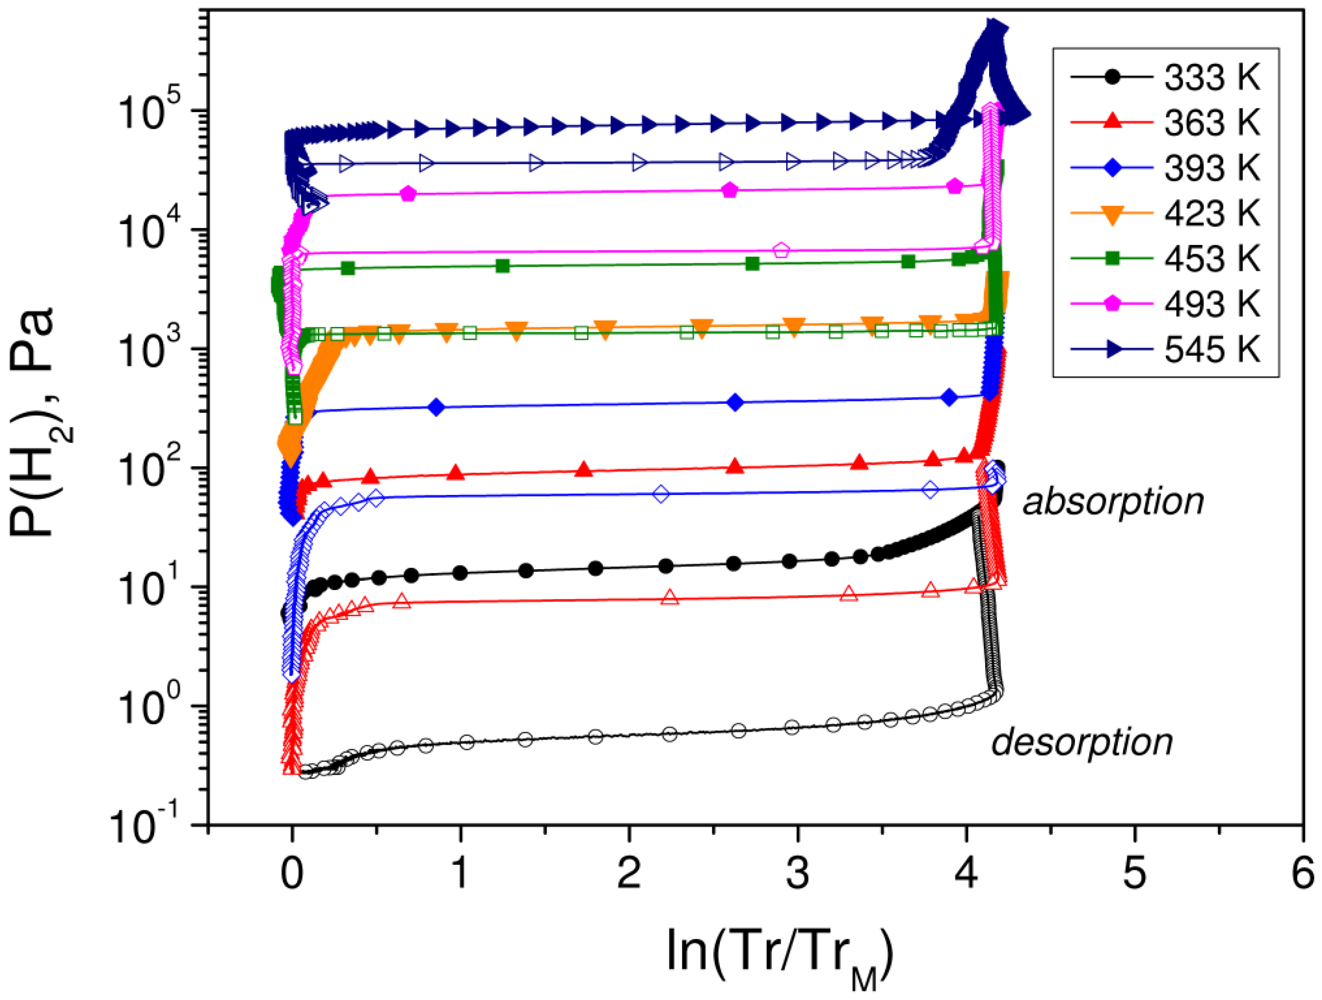
Figure 1.
Pressure-transmission-isotherms of the Mg/Ta/Pd thin films during hydrogen absorption (filled symbols) and hydrogen desorption (open symbols) in a wide temperature range. Tr and TrM is the optical transmission of the films during (de-)hydrogenation and in the metal state, respectively.
Figure 1.
Pressure-transmission-isotherms of the Mg/Ta/Pd thin films during hydrogen absorption (filled symbols) and hydrogen desorption (open symbols) in a wide temperature range. Tr and TrM is the optical transmission of the films during (de-)hydrogenation and in the metal state, respectively.
It can be seen from
Figure 1 that some of the desorption Pressure-Transmission-Isotherms (PTI’s), namely at 333 K and 363 K show an unusual behavior—An increase of the lnTr/Tr
M during a decrease of the hydrogen pressure. This effect is connected to the sequence of the hydrogenation of the layers within the stack and does not mean that the hydrogen concentration in the material is increasing. If we compare the enthalpy of hydride formation/decomposition between different layers in Mg/Ta/Pd film, the first layer that should load is MgH
2 (∆
H = −74.5 kJ/molH
2 [
11]), the next one is TaH
x (∆
H = −72.4 kJ/molH
2 [
12]) and, finally, PdH
x (∆
H = −39 kJ/molH
2 [
13]). The unloading procedure proceeds in a reversed order: Pd–Ta–Mg. It is worth mentioning, that Mg and Ta behave oppositely,
i.e., Ta darkens during hydrogen loading and transmits more light during hydrogen unloading. Thus, Mg/Ta/Pd film becomes darker (lnTr/Tr
M increases) on dehydrogenation due to Ta layer.
From the equilibrium plateau pressures of the corresponding PTI’s the Van‘t Hoff plot was constructed (
Figure 2). The calculated enthalpy and entropy of hydride formation and decomposition are: ∆
Habs = −61.6 kJ/molH
2, ∆
Sabs = −110.9 J/K molH
2 and ∆
Hdes = −78.3 kJ/molH
2, ∆
Sdes = −136.1 J/K molH
2, respectively.
There is a substantial scattering of the reported desorption bulk enthalpies of MgH
2 [
11,
14,
15,
16,
17,
18,
19,
20,
21], ranging from −67.0 kJ/molH
2 [
11] to −81.3 kJ/molH
2 [
20,
21]. The thermodynamic properties of our Mg films in desorption are in a very good agreement with few bulk references [
15] and, in general, fall within the experimental spread. Among this spread Bohmhammel
et al. [
19] calculated the mean value, which appears to be close to Stampfer result [
11],
i.e., −74.5 kJ/molH
2. By taking this average (Stampfer) value as a reference one, the enthalpy of hydride decomposition of the Mg/Ta/Pd films, measured by hydrogenography, is then lower by 3.8 kJ/molH
2 than bulk data.
A comparison of hydrogenation thermodynamics of Mg bulk with thin films is much more difficult. Most of the literature values on bulk MgH
2 rely on desorption experiments, whereas only a few references could be found describing formation enthalpies and entropies of magnesium hydride [
22]. The enthalpy and entropy of hydride formation, measured by Pedersen
et al. [
22] in the temperature range 533–698 K is −70 kJ/molH
2 and −126 J/K molH
2, respectively, which agree pretty well with theoretical predictions by Selvam
et al. [
22]. Taking the Pedersen [
22] data as a reference, the hydrogenation enthalpy of Mg/Ta/Pd films deduced from our optical approach is by 8.4 kJ/molH
2 higher than magnesium bulk.
There exist several studies devoted to the thermodynamics of magnesium hydride at low temperatures (
T < 393 K) using films. Thus, based on room temperature electrochemical measurements of hydrogen equilibrium pressures, Vermeulen
et al. [
24] calculated the enthalpy of hydride formation (−72 kJ/molH
2) and decomposition (−74 kJ/molH
2) in 200 nm MgH
2 films, which is found quite similar to bulk values mentioned above. Their estimates, however, are based on one temperature only (298 K) and assume the entropy of hydride formation of −130.8 J/K molH
2 in absorption and desorption. Somewhat contradictive results have been measured on 380 nm Mg films in the temperature range 290–370 K by piezoelectric quartz crystal microbalance (gravimetric method) [
25]. The enthalpy of hydride formation derived from the pressure-concentration-isotherms is −60.7 ± 6.3 kJ/molH
2, which is very close to the hydrogenography results. The enthalpy of hydride decomposition, −71.0 ± 4.2 kJ/molH
2, is relatively close to the electrochemistry data, but in a disagreement with the hydrogenography.
Figure 2.
Van't Hoff plot of the Mg/Ta/Pd films. Filled and open symbols represent absorption and desorption, respectively. Thermodynamic parameters are calculated from the regression analysis. Data for bulk MgH
2 [
3] and MgH
2–V 3at.%–Ti 2at.% [
26], thin [
24] and thick MgH
2 films [
25] are shown for comparison. Red diamonds are the calculated absorption and desorption equilibrium pressures from the Van't Hoff equation using Pedersen [
22] and Stampfer [
11] thermodynamic parameters, respectively.
The difference in thermodynamics of Mg films studied by means of hydrogenography and electrochemistry/gravimetry follows from the difference in the (de-)hydrogenation pressures and, accordingly, hysteresis behavior (
Figure 2). A possible cause for the discrepancy between various techniques is connected, in our opinion, to the different hydrogen concentration in the films upon hydrogenation. Thus, due to relatively high current densities used in the electrochemical measurements, 300 nm thick Mg films were loaded only up to 1.2 H/M [
27]. In order to prevent delamination of the films from the substrate in the gravimetric experiments, thick Mg films (380–800 nm) were allowed to absorb no more than 0.3 H/M [
25]. As the hydrogen-induced deformations are directly related to the amount of hydrogen in a sample [
28], one can conclude that not fully hydrided thick Mg films, measured by electrochemistry and gravimetry, possess a lower stress state with respect to the fully hydrided one. Lower mechanical stresses along with a smaller volume expansion will inevitably result in a smaller expansion work in thick Mg films. This, consequently, would lead to a lower substrate influence than in thin Mg films, studied by hydrogenography. Hydrogenography samples to have a full hydrogen capacity because: (i) a larger pressures range and/or a longer measuring time than in thicker films and (ii) the fact that the transmission/reflection optical spectra of MgH
2 thin films could be accurately modeled using the bulk MgH
2 dielectric functions.
2.2. Hysteresis Behavior and Stress-Strain Analysis of Mg/Ta/Pd Thin Films
A comparison between Mg/Ta/Pd films and Mg bulk reveal two distinct characters of the hysteresis behavior, depending on the temperature (
Figure 2). At high temperatures,
T ≥ 523 K, the ratio between absorption and desorption equilibrium pressures in films becomes essentially the same as in bulk [
3,
26],
i.e., P
abs/P
des ≈ 2, proving that thin film optical results are in line with the bulk volumetric data. At lower temperatures (
T < 423 K) the difference in hysteresis between thin films and bulk becomes much more pronounced. The largest deviation is observed at 300 K and 333 K, where the experimentally derived hysteresis is 40.4 at and 20.2, respectively, which is much larger than in magnesium bulk at the same temperatures (
Figure 2, red diamonds); since there is no bulk data available at these temperatures, the bulk pressures are extrapolated from the high temperatures using absorption and desorption enthalpies and entropies of Pedersen [
22] and Stampfer [
11], respectively.
A larger hysteresis in Mg/Ta/Pd films than in bulk Mg at low temperatures is assumed to be caused by the clamping effect. One way to check this is to apply the stress-strain model, similar to one presented in [
9], to Mg/Ta/Pd films.
According to the stress-strain model [
9], the hysteresis increase in films with respect to bulk takes place as a consequence of the expansion constraints related to the substrate and, consequently, a larger elastic + plastic work upon (de-)hydrogenation:
Here R is the gas constant, T is the absolute temperature, V
M is the molar volume of the metal,
cβα is the maximum hydrogen concentration in the β and α phase and σ and ε correspond to the stresses and volume strain in the Mg/Ta/Pd thin films, respectively. To prove that our assumption is correct, we need to solve numerically the right part of the Equation (1) and compare it with the experimentally measured hysteresis in thin films and bulk Mg. However, as our Mg films become X-ray amorphous (loses long-range crystallinity) in the hydrogenated state after several (de-)hydrogenation cycles, it is impossible to utilize the same approach as used in [
9] to calculate stresses and strains upon hydrogen loading and unloading. Thus, in this calculation we rely mostly on literature values of (
cβ − cα), σ and ε of MgH
2 thin films.
According to the Mg-H phase diagram [
29], the solubility of hydrogen at temperatures below 650 K is negligible (3 × 10
−6 H/M at 300 K) in the α-phase and close to the theoretical capacity of MgH
2,
i.e., 2 H/M, in the β-phase. The width of the plateau, (
cβ −
cα) in bulk systems is therefore close to 2. In thin films, due to a larger amount of grain boundaries [
10] the α- and the β-phase solubility limits are usually affected by the high defect concentration, changing the actual plateau width. Indeed, recent electrochemical studies observe a substantial—2 orders of magnitude—increase of the α-phase solubility in Mg films as compared to bulk [
27]. The same authors observed a decrease in the β-phase solubility down to 1.8 H/M for 165 nm thick Mg film. As the value of
cα remains very small, 2 × 10
−4 H/M at 300 K, the plateau width is basically controlled by the β-phase hydrogen solubility and equals to 1.8. Because of a sufficiently long loading times (24 h at 333 K) used in the hydrogenography measurements and a 3 times lower film thickness, we believe that Mg/Ta/Pd films can achieve hydrogen capacities on similar level as 1.8 H/M or even higher. For our calculations, we assume the plateau width in Mg/Ta/Pd films to be 1.8 H/M.
Using curvature bending technique, Ludwig measured mechanical stresses in Pd [
30] and Mg
2Ni [
31] films during hydrogen loading. In spite of the fact that these materials represent two completely different classes of hydrogen storage materials, namely interstitial and complex hydrides, the experimentally measured in-plane compressive stresses of Pd and Mg
2Ni films are found to be comparable: −1.2 GPa and −1.4 GPa, respectively. Surprisingly, the approximately 3 times larger volume expansion and the presence of a structure transformation in Mg
2Ni upon hydrogenation do not have any substantial influence on the stress build up in these films. Following the same logic, the in-plane mechanical stresses in Mg films should be of the same order of magnitude. Thus, in the calculation the maximum hydrogenation stress in Mg film is taken equal to Mg
2Ni,
i.e., −1.4 GPa, since Mg is much more similar to Mg
2Ni in terms of structure transformation and volume expansion than to Pd.
It was observed in [
9], that the expansion of clamped Pd films is very similar to that of Pd bulk. This volume expansion occurs by means of plastic deformations and only in the vertical direction,
i.e., by increasing the film thickness. A similar situation takes place in Mg/Ta/Pd films. Recent experiments on thick Mg films [
32], Mg/Ti multilayers [
33] and thin Mg films [
34] by means of profilometry, X-ray and Neutron reflectometry, respectively, show a thickness increase of about 30%, which is very similar to the expansion in magnesium hydride bulk. Thus, the volume strain in Mg/Ta/Pd films, ε
ν, resembles Mg bulk upon hydrogen loading as well.
Values for the in-plane compressive stress and the volume expansion were used to construct the stress-strain curve and to calculate the expansion (elastic + plastic) work in Mg/Ta/Pd films during (de-)hydrogenation cycle (
Figure 3). Since there is no experimental data on tensile stresses to implement it in the strain-stress analysis, no change of the sign is depicted in the stress-strain curve. Therefore, a simplified picture with only the compressive stresses in Mg films was used in this work.
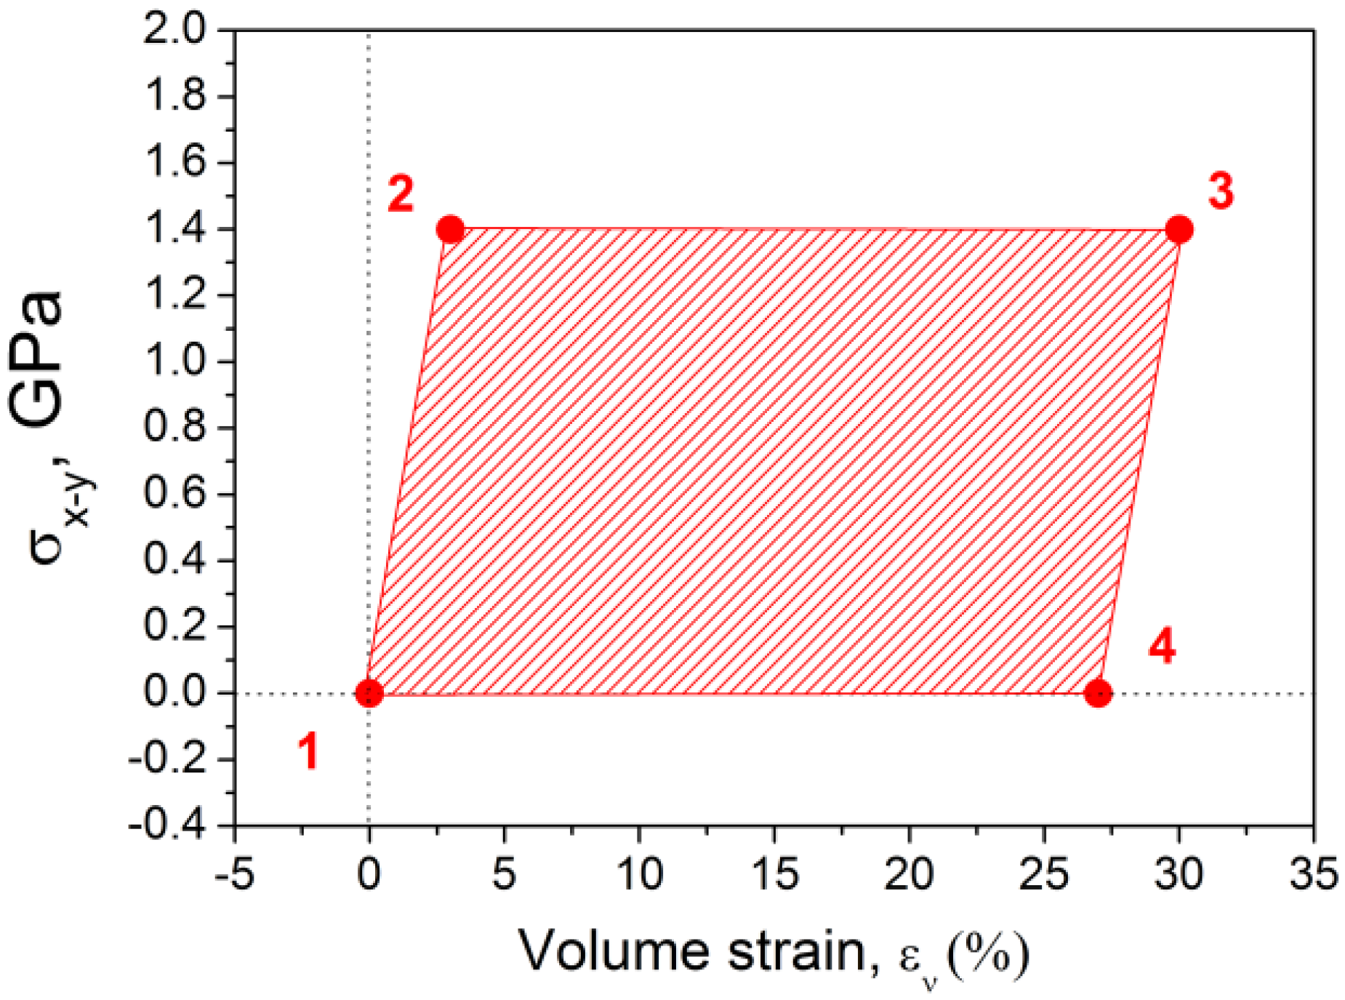
Figure 3.
Stress-strain curve of the Mg/Ta/Pd thin films during (de-)hydrogenation; numbers represent different hydrogenation and dehydrogenation steps, namely elastic expansion of the film (1–2), plastic deformations (2–3), elastic recovery (3–4) and plastic deformations (4–1), returning the films to its initial state (1). The positive numbers on the y-axis represent the compressive stress, whereas the negative numbers stand for the tensile stress in Mg/Ta/Pd films.
At point 1, the Mg film is in the metallic state. The initial compressive stress is taken as zero. As was observed in the clamped Pd films [
9], the mechanical stress changes from tensile to compressive during hydrogen loading and unloading. Analogous behavior is expected to occur in Mg/Ta/Pd films,
i.e., non-zero tensile stress in the metallic state. Since the presence of a tensile stress would just shift the whole stress-strain curve downwards while not affecting quantitative conclusions, in this particular case we assumed a zero initial stress.
By absorbing a very small amount of hydrogen the Mg film expands elastically. As it reaches the Yield point—point 2—the nature of the deformation changes from elastic to plastic. The Yield point is taken the same as the maximum stress in Mg/Ta/Pd film, considering the elasto-plastic behavior of our samples [
9]. The elastic volume strain, calculated from the Hooke’s law and by taking into account the Young modulus of Mg (45 GPa [
35]) is equal to 3.1%. Following hydrogen absorption results in a substantial volume increase of the Mg film with no variation in the stress state. The film deforms only plastically until it reaches the total volume strain of 30%, point 3 (
Figure 4).
Upon dehydrogenation, first elastic relaxation shrinks the film to point 4. The elastic recovery involves the same amount of stress decrease and the same amount of volume change as during the loading process, namely 3% (1–2). Then plastic deformations return the film to the initial state, point 1. It is worth mentioning that the dehydrogenation (step 4–1) in Mg films is expected to take place with a change of the stress-state from compressive to tensile, which is the driving force for the unloading reaction [
8]. However, for simplicity, we neglect here the negative stresses.
The mechanical work, performed by the Mg film upon (de-)hydrogenation cycle evaluated from the area of the polygon in
Figure 3 [
36]. A substitution of the estimated mechanical work,
![Crystals 02 00710 i002]()
=0.378 GJ/m
3, molar volume of Mg,
VM = 13.97 × 10
−6 m
3/mol and Mg film phase boundaries, (
cβ − cα) =1.8 into the left side of Equation (1) yields the Gibbs free energy change, ∆
Ghyst of 2.93 kJ/(mol H). Substituting the hydrogenography data for the experimentally observed hysteresis (
Pabs/Pdes) in Mg film (40.4) and the calculated hysteresis for Mg bulk (2.5) (
Figure 3, red diamonds) at 300 K with the gas constant,
R = 8.314 J/(K·mol) into the right hand side of Equation (1) leads to a value of 3.47 kJ/(mol H). The agreement between experimentally measured
hysteresis in Mg/Ta films and Mg bulk (left side of Equation (1)) and the calculated mechanical work (right side of the Equation (1)) is remarkable and proves that the hysteresis increase Mg films is related to the substrate clamping and caused by an expansion (mostly plastic) work during (abs-)desorption cycle.
A similar type of calculations has been conducted for Mg/Ta/Pd films at 333 K. The Gibbs free energy change is taken the same, because of a minor influence of the temperature on the stress-strain curve of Mg films at 333 K with respect to 300 K. The measured hysteresis of the Mg/Ta/Pd films, plugged in the right-side of the Equation (1) along with the Mg bulk hysteresis (
Figure 2, red diamonds) give the value of 3.18 kJ/(mol H), which again fits very well the calculated Gibbs free energy, ∆
Ghyst of 2.93 kJ/(mol H).
These examples clearly show a good agreement between the stress-strain theory and experimental results at low temperatures. However, at elevated temperatures the agreement becomes poor. In
Figure 4 we plot the hydrogenography measured absorption/desorption pressures ratio (black circles) for Mg/Ta/Pd and a calculated one (red diamonds) using Equation (1) in the whole temperature range. In the estimated pressure ratio we assume no temperature dependence of the stress-strain model parameters, namely stress, volume strain, molar volume and the plateau width. As can be seen, the slope of the lines is not the same and the difference between them is increasing with temperature. Obviously, the stress-strain parameters do require a temperature correction.
2.3. A temperature Correction of the Stress-strain Analysis
There are four parameters in the stress-strain model, i.e., VM(T), (cβ − cα)(T), σ(T), εν(T), whose temperature dependence should be considered.
The temperature dependence of the molar volume of metallic Mg can be assessed from the coefficient of thermal expansion (CTE) of a material. Using the linear CTE of Mg, α = 24.8 × 10⁻⁶ K−1 and assuming an isotropic linear expansion, the molar volume change upon temperature increase is estimated from the following equation:
Here
![Crystals 02 00710 i004]()
and
![Crystals 02 00710 i005]()
are the molar volume of metallic Mg at room temperature (RT) and the difference between the operating temperature and RT, respectively. The temperature dependence of the molar volume was used to recalculate the hysteresis in Mg/Ta/Pd films (
Figure 4, open squares). As expected, the temperature correction of Mg molar volume has a minor effect on the calculated pressures ratio, since the thermal expansion coefficient is of the order of 10
−6.
Figure 4.
Comparison of the experimentally measured hysteresis (Pabs/Pdes) in Mg/Ta/Pd films (black circles) and the calculated one with no temperature correction (red diamonds), with a molar volume temperature correction (open squares) and with a stress temperature correction (blue stars).
Figure 4.
Comparison of the experimentally measured hysteresis (Pabs/Pdes) in Mg/Ta/Pd films (black circles) and the calculated one with no temperature correction (red diamonds), with a molar volume temperature correction (open squares) and with a stress temperature correction (blue stars).
For the same reason,
i.e., very small thermal expansion coefficient, the volume strain of Mg films,
εν, should not strongly depend on the temperature. No substantial temperature variation of the width of the plateau, (c
β − c
α), is expected either for Mg films below 573 K, taking into account the phase diagram of MgH
2 [
29].
Hydrogenation stresses, on the other hand, should dependent strongly on temperature. Hydrogenation stress is composed of an elastic and a plastic part, changing with temperature. The maximum elastic stress or elastic limit or Yield point (point 2 on the stress-strain curve,
Figure 3) depends on the Young modulus of a material and elastic strain, whereas the plastic stress, which defines the maximum mechanical stress (point 3 on the stress-strain curve,
Figure 3), depends on the stress relaxation, mainly by means of dislocations movement. In our analysis we consider the elasto-plastic behavior of Mg films, which implies the equality of maximum elastic and plastic stresses. However, there are separate physical phenomena responsible for their temperature dependence.
One of the reasons why the elastic limit is decreasing with temperature is connected to a temperature dependence of Young modulus, E and its influence on the elastic limit. The magnitude of the Young modulus is a measure of the resistance to separation of adjacent atoms, which, in fact, represents the interatomic bonding force. As the atomic forces are decreasing with temperature (due to an increase of atomic separation distance, r), the Young modulus also diminishes with temperature.
The temperature dependence of the Young modulus for most of materials could be described by the theoretical relationship proposed by Varshni [
37]:
where
E(
0) is the Young modulus at zero temperature,
![Crystals 02 00710 i007]()
is the Einstein characteristic temperature in the absence of electronic effects and
s is the high temperature limit of the temperature derivative
dE/
dT. At lower temperatures the
E/
T curve is non-linear, whereas at higher temperatures (
T > 273 K) the
Evs.T dependence could be approximated by a linear equation [
38]. Based on the parameters proposed by Varshni [
37] for Mg, we constructed the dependence of the Young modulus on temperature and calculated the slope of the linear part of the curve,
dE/
dT in the temperature range 300–600 K (inset in
Figure 5). The temperature dependence of Mg,
dE/
dT= −18 × 10
6 Pa/K is found relatively weaker than in other materials, like Aluminum (−46 × 10
6 Pa/K) and Nickel alloys (−68 × 10
6 Pa/K) [
38]. According to this dependence, the young modulus of Mg of 45 GPa at ambient temperature reduces to 40.8 GPa at 553 K.
An increase in the temperature should also influence the strain
ε as the hydrogen solubility depends on T [
29]. However, taking into account a minor hydrogen concentration in the α-phase in the temperature range 300–553 K, the elastic strain in Mg considers virtually the same. From the Hooke’s equation it follows that a decrease of Young modulus with no change in strain results in a decrease of the Elastic limit. In
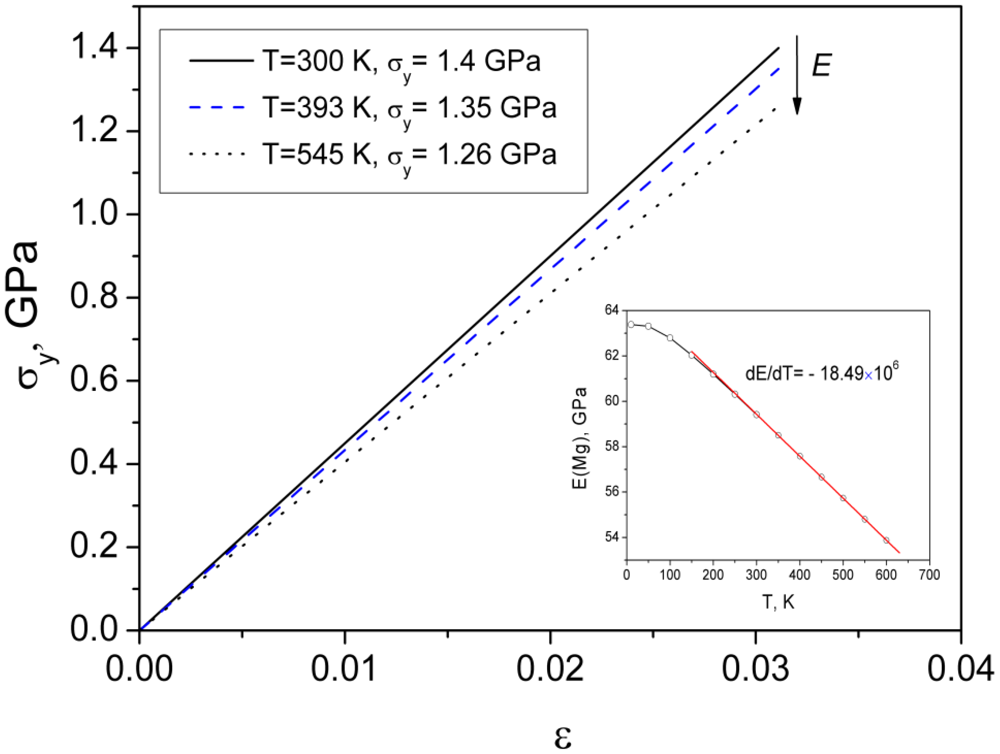
Figure 5 we plot the Yield point,
σy in Mg/Ta/Pd films as a function of the Young modulus, estimated at different temperatures; the elastic strain is taken the same as in the stress-strain curve,
Figure 3 (point 2). According to our calculations, the elastic limit decreases from 1.4 GPa to 1.26 GPa when the temperature increases from RT to 553 K. The temperature dependence of the Yield stress in the whole temperature range is presented in
Figure 6 (B, blue line).
Figure 5.
Temperature dependence of the Elastic limit/Yield stress, σ
y in Mg films. The inset shows the temperature dependence of the Young modulus of Mg, reproduced using Equation (3) and the parameters from Varshni [
37]; the slope of the linear part of the curve is calculated from the regression analysis.
Besides the Young modulus, the Elastic limit is also influenced by the grain size via the Hall-Petch relationship [
39]:
where
σo is a materials constant for the starting stress for dislocation movement,
ky is the strengthening coefficient and
D is the average grain diameter. This relation is essentially empirical and was proposed to describe the Yield stress of materials with grain size in the micrometer range. It has been proven recently to be valid also for a nanocrystalline metals with grain size down to 20 nm [
40].
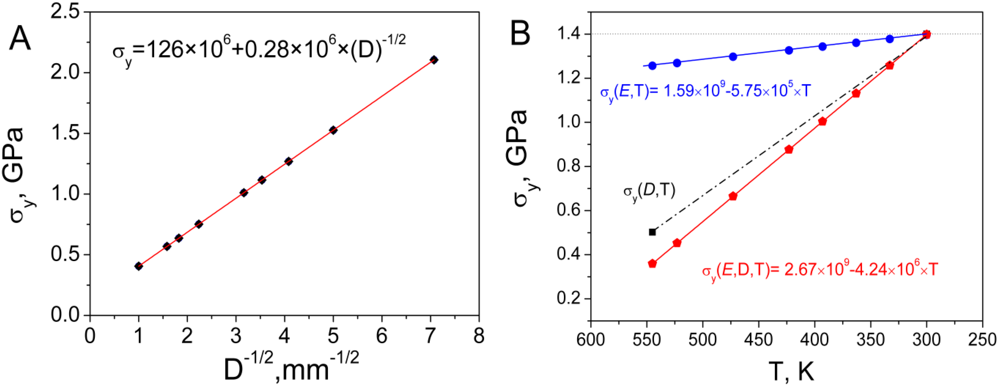
The Yield stress dependence on Mg grain size is presented in
Figure 6A. For the calculation, the literature values of the Hall-Petch slope,
ky = 0.28 × 10
6 Pa × m
1/2 and σ
o = 126 MPa at room temperature of polycrystalline magnesium with 26–1000 nm grain were used [
41,
42]; a temperature dependence of the parameters in Equation (4) has been disregarded. From
Figure 6A it can be concluded that the initial (at 300 K, before temperature treatment) grain size of Mg/Ta/Pd films is about 40 nm, taking into account that the Yield stress of Mg films is 1.4GPa at room temperature (
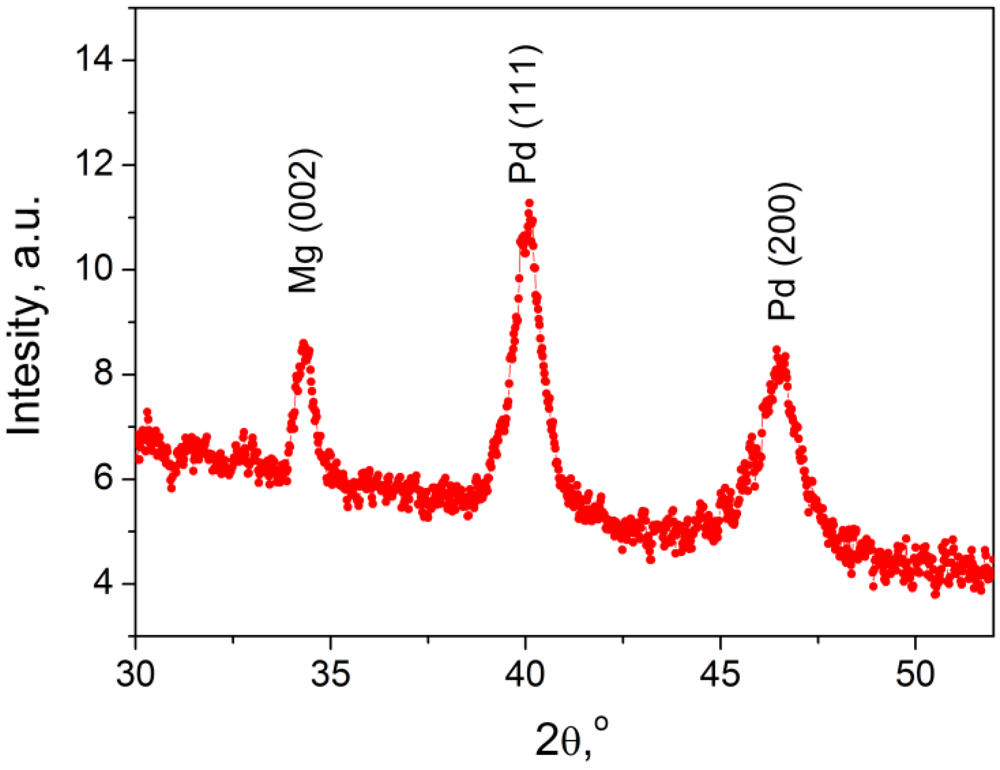
Figure 3). A similar grain size was estimated from the room temperature XRD experiments of Mg/Ta/Pd films (
Figure 7), where the analysis of (002) reflection of Mg structure, using the Scherrer formula, gives the average grain size of 20 nm.
Figure 6.
(A) Dependence of the Yield stress on grain size in Mg films. (B) Effect of the Young modulus, σy(E,T) (blue line), grain size σy(D,T) (black dotted line) and their combined influence, σy(E,D,T) (red line) on the Yield stress in Mg films. Solid lines are linear fits with the corresponding temperature dependences and the dotted line is just a guide for the eye. Dashed line at 1.4 GPa represents the Yield stress of Mg film with no temperature correction.
The analysis of the grain growth in Mg films with temperature is somewhat difficult. Grain growth is a temperature-activated and non-linear process [
42]. It proceeds more rapidly as temperature increases, which is connected to an enhancement of diffusion rate with rising temperature. In addition to the temperature effect, the grain growth is also facilitated by means of hydrogen-induced Ostwald ripening [
43]. An increase of the grain size of about 3 times during hydrogen cycling of Pd films was observed even at room temperature [
44]. Because of a scarcity of the experimental data, the mathematical description of the grain size growth with temperature and its influence on the Yield stress has not been conducted. However, in order to have an idea on the order of numbers, an attempt was made to estimate the Yield stress in Mg films at the highest experimental temperature, 545 K.
Our preliminary analysis indicate that hydrogenation cycling at 333 K, followed by an annealing at 545 K for about 1–2 h should result in a grain growth up to 300–400 nm; please note that the thin films behavior might be different from bulk. The Elastic limit of magnesium film with an average grain size of 350 nm is then reduces to about 0.5 GPa at 545 K, which is noticeably lower than the Elastic limit of Mg film with 40 nm grain size at RT (
Figure 6A). By comparing the influence of the Young modulus change, σ
y(E,T) and grain growth, σ
y(D,T) with temperature on the Yield stress in
Figure 6B, we concluded that the latter has a much more pronounced effect.
A combination of σ
y(E,T) and σ
y(D,T) gives a total reduction of the Yield point. Since there are limited amount of points on the σ
y(D,T) dependence, only two temperatures, namely 300 K and 545 K have been considered. Adding up of both contributions resulted in the Elastic limit of 0.37 GPa and 1.4 GPa at 545 K and 300 K, respectively. Assuming that the combined dependence, as well as the σ
y(E,T), has a linear character we have made a linear fit through these two points (red line,
Figure 6B) and estimated the Yield stress in the whole temperature range. It is worth mentioning that the final Yield stress at 545 K in Mg films, 0.37 GPa is very close to that one of Pd buckled film, 0.4 GPa [
9]. The fact that both, Pd buckled films and Mg/Ta/Pd films at 545 K resembles behavior of the corresponding bulk materials means the same minor influence of the clamping effect, which support our calculations of the Yield point in Mg films.
Apart from the Yield stress change, the temperature increase also reduces the maximum mechanical stress in the plastic regime upon film hydrogenation (point 3,
Figure 3). Plastic deformations occur by the glide of dislocations, which require certain activation energy. The energy that has to be provided for dislocation to overcome the barrier during slip determines the dependence of the stress on temperature. When the energy barrier is sufficiently small for thermal energy (~kT) to be significant, thermal vibrations of the crystal atoms may assist the dislocation to move and overcome obstacles, opposing dislocation motion [
45]. Therefore, at low temperatures this energy is provided in the form of mechanical work, while with increasing temperature the thermal energy contributes to the total energy and enables partly or fully to overcome the barrier, lowering the mechanical work. Furthermore, a reduction of the mechanical work also takes place at the expanse of a decrease of grain boundaries, which acts as a pinning centre for dislocation slip.
Figure 7.
XRD scan of the Mg(50 nm)/Ta(10 nm)/Pd(20 nm) film, taken at room temperature using Cu Kα1 radiation.
Figure 7.
XRD scan of the Mg(50 nm)/Ta(10 nm)/Pd(20 nm) film, taken at room temperature using Cu Kα1 radiation.
A decrease of the Yield stress (point 2) and the maximum stress, point 3 on the stress-strain curve (
Figure 3) with temperature leads to a decrease of the total elastic + plastic expansion work in Mg/Ta/Pd films during (de-)hydrogenation cycle. By using the temperature dependence of the Yield stress, σ
y(E,D,T) and taking into account the elasto-plastic behavior of Mg films we then calculate the Gibbs free energy change, ∆
Ghyst in the whole temperature range. The recalculated pressure ratio with the stress-temperature correction (blue stars,
Figure 4) now exhibit a very good agreement with the experimental hysteresis (black circles). This example proves that the stress-strain theory with a proper temperature correction of the involved parameters is able to predict hysteresis behavior in metal hydride thin films in a wide temperature range.
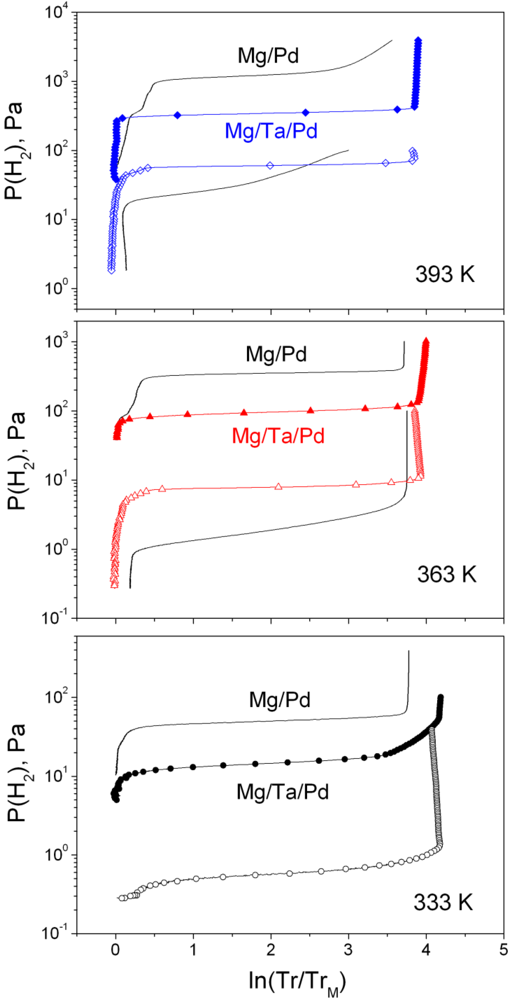
2.4. Hydrogenography Experiments on Mg/Pd Films
Mg films with direct contact with Pd are measured simultaneously with Mg/Ta/Pd films to study the effect of the Pd cap-layer on the thermodynamic properties. Because of an extensive alloying between Mg and Pd [
25,
46Error! Reference source not found.] on one hand and kinetics issues on the other hand, the temperature range is reduced to 333–393 K, where we measure three PTI’s in absorption and only two in desorption (
Figure 8).
Figure 8.
Comparison between Pressure-Transmission-Isotherms (PTI’s) of the Mg/Pd and Mg/Ta/Pd films in the temperature range 333–393 K. Solid and solid+symbol lines represent (de-)hydrogenation behavior of Mg/Pd and Mg/Ta/Pd films, respectively.
Figure 8.
Comparison between Pressure-Transmission-Isotherms (PTI’s) of the Mg/Pd and Mg/Ta/Pd films in the temperature range 333–393 K. Solid and solid+symbol lines represent (de-)hydrogenation behavior of Mg/Pd and Mg/Ta/Pd films, respectively.
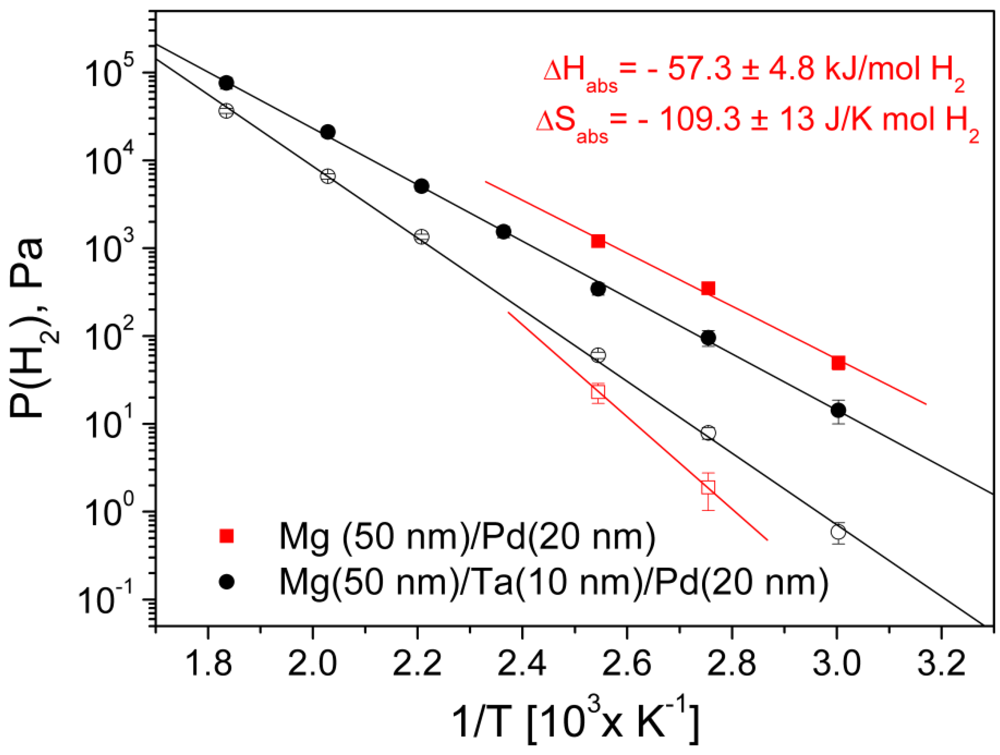
Absorption equilibrium pressures in Mg/Pd films increases by 3.6–3.7 times at each temperature in the studied temperature range. Thus, the upwards shift of absorption by means of Pd capping layer is almost parallel with respect to Mg/Ta/Pd films (
Figure 9).
It is difficult to draw any solid conclusion form the desorption measurements. First of all, there are only two experimental points, which is not enough to calculate the thermodynamic parameters. Secondly, tilted desorption isotherms point out that the equilibrium conditions have not been established during the experiments due to kinetics and/or alloying reasons and that the pressure estimation error is quite high. Nevertheless, it is clear that the hydrogen unloading in Mg films with a direct contact with Pd capping layer takes place at lower hydrogen pressure (about 2.5–4 times lower) with respect to Mg films without the Mg/Pd interface (
Figure 8 and
Figure 9).
Figure 9.
Van‘t Hoff plot of Mg films with (red squares) and without (black circles) a direct contact with Pd cap-layer. The error bars of the equilibrium pressure estimation are also presented.
Figure 9.
Van‘t Hoff plot of Mg films with (red squares) and without (black circles) a direct contact with Pd cap-layer. The error bars of the equilibrium pressure estimation are also presented.
The exact reason why the hysteresis expands when the Mg/Pd interface is present remains unclear. Baldi
et al. [
46] have proposed an explanation based on the elastic clamping of Mg layer by means of Pd, having affinity to form an alloy with Mg. This model suffers from explaining the complete (de-)hydrogenation behavior of Mg films, still, we think that the formation of Mg-Pd alloy at the interface is the main reason for the destabilization, observed in Pd capped Mg films.
Temperature, hydrogen treatment or even sputtering process can lead to an interdifussion of Mg into Pd layer and vice versa [
25], forming a Mg-rich Mg-Pd alloy (Mg
9P
1, Mg
6Pd
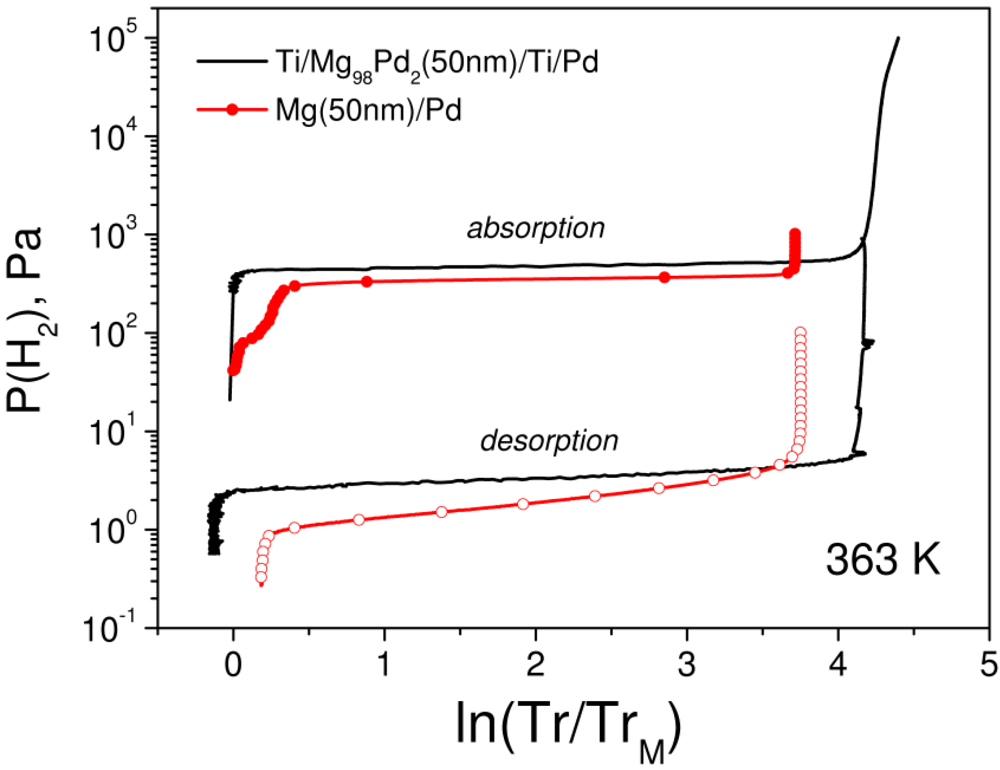
1). This interface alloy, apparently, remains coherent with the rest of the film and becomes stiffer than Mg itself. Upon hydrogenation, a larger expansion (elastic and plastic) work is therefore required to expand Mg films with the interface Mg-Pd alloy than without it, shifting absorption plateau to a higher pressures. A similar phenomenon is responsible for a decrease of the equilibrium pressure during desorption, expanding the whole hysteresis. Obviously, there is no difference whether the Mg-Pd alloy is formed at the interface or dispersed throughout whole volume of Mg film, as the (de-)hydrogenation behavior of the Mg/Pd films is in very good agreement with co-sputtered Mg
98Pd
2 samples [
48] (
Figure 10)
In conclusion, to measure the intrinsic thermodynamics and hysteresis behavior of a Mg film, it should be decoupled from the Pd capping layer, by, for instance, an additional layer in-between Mg and Pd. This layer should not form any alloy with Mg and, preferably, with Pd and should be penetrable for hydrogen diffusion. These precautions should be taken into account for any metal hydride material under consideration, which forms an alloy with Pd.
Figure 10.
Pressure-transmission-isotherms of the co-sputtered Mg98Pd2 and sandwiched Mg/Pd film at 363 K.
Figure 10.
Pressure-transmission-isotherms of the co-sputtered Mg98Pd2 and sandwiched Mg/Pd film at 363 K.


 =0.378 GJ/m3, molar volume of Mg, VM = 13.97 × 10⁻⁶ m3/mol and Mg film phase boundaries, (cβ − cα) =1.8 into the left side of Equation (1) yields the Gibbs free energy change, ∆Ghyst of 2.93 kJ/(mol H). Substituting the hydrogenography data for the experimentally observed hysteresis (Pabs/Pdes) in Mg film (40.4) and the calculated hysteresis for Mg bulk (2.5) (Figure 3, red diamonds) at 300 K with the gas constant, R = 8.314 J/(K·mol) into the right hand side of Equation (1) leads to a value of 3.47 kJ/(mol H). The agreement between experimentally measured hysteresis in Mg/Ta films and Mg bulk (left side of Equation (1)) and the calculated mechanical work (right side of the Equation (1)) is remarkable and proves that the hysteresis increase Mg films is related to the substrate clamping and caused by an expansion (mostly plastic) work during (abs-)desorption cycle.
 and
and  are the molar volume of metallic Mg at room temperature (RT) and the difference between the operating temperature and RT, respectively. The temperature dependence of the molar volume was used to recalculate the hysteresis in Mg/Ta/Pd films (Figure 4, open squares). As expected, the temperature correction of Mg molar volume has a minor effect on the calculated pressures ratio, since the thermal expansion coefficient is of the order of 10−6.
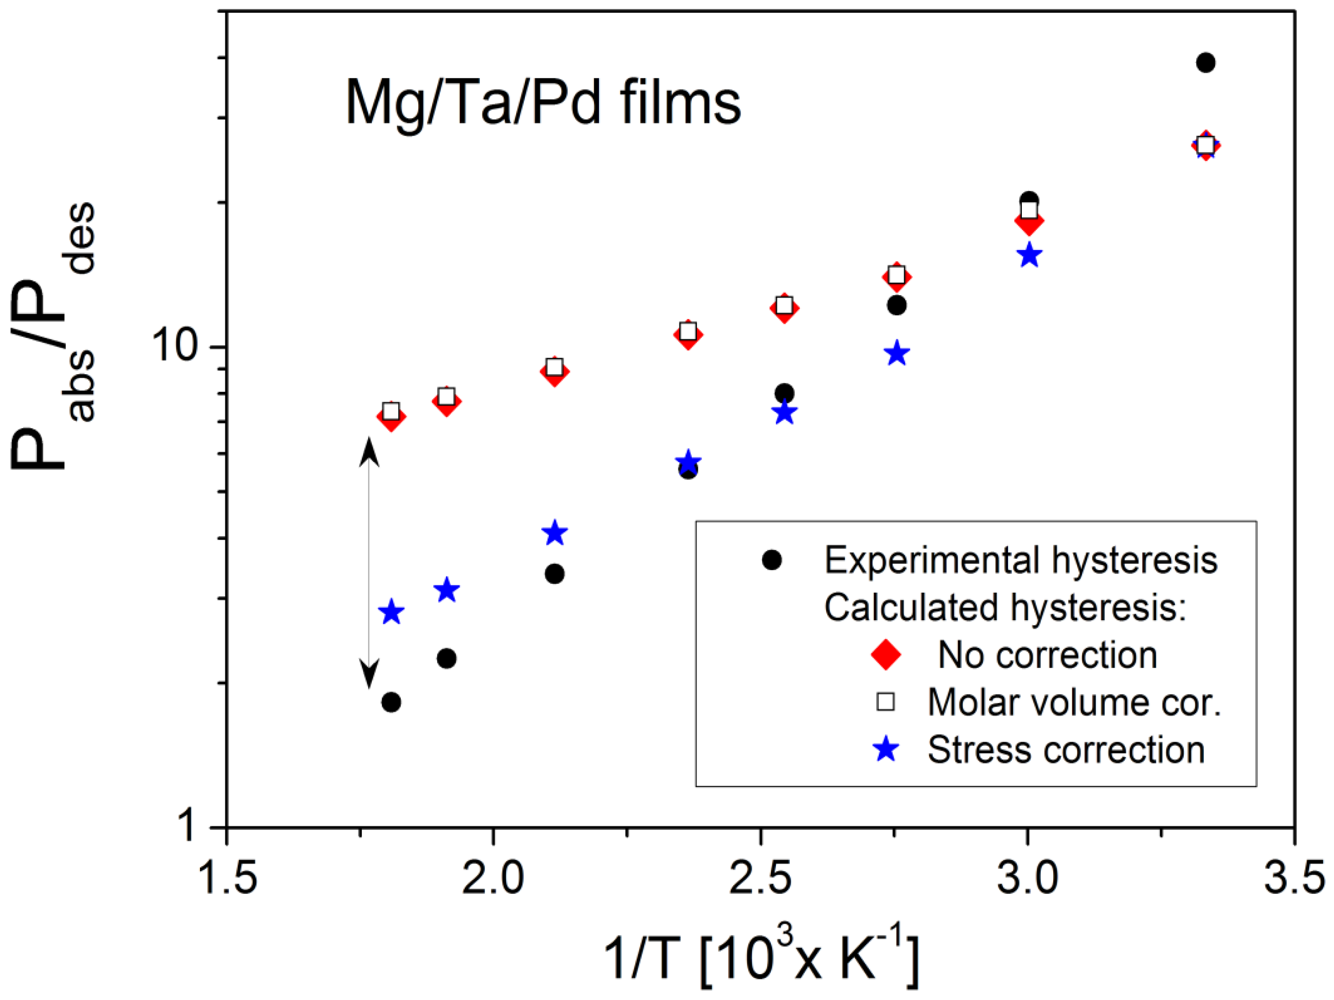

 is the Einstein characteristic temperature in the absence of electronic effects and s is the high temperature limit of the temperature derivative dE/dT. At lower temperatures the E/T curve is non-linear, whereas at higher temperatures (T > 273 K) the Evs.T dependence could be approximated by a linear equation [38]. Based on the parameters proposed by Varshni [37] for Mg, we constructed the dependence of the Young modulus on temperature and calculated the slope of the linear part of the curve, dE/dT in the temperature range 300–600 K (inset in Figure 5). The temperature dependence of Mg, dE/dT= −18 × 106 Pa/K is found relatively weaker than in other materials, like Aluminum (−46 × 106 Pa/K) and Nickel alloys (−68 × 106 Pa/K) [38]. According to this dependence, the young modulus of Mg of 45 GPa at ambient temperature reduces to 40.8 GPa at 553 K.