Article

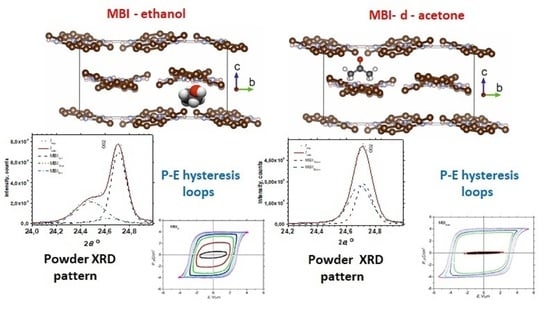
Structural Properties and Dielectric Hysteresis of Molecular Organic Ferroelectric Grown from Different Solvents

1
Ioffe Institute, 26 Politekhnicheskaya, 194021 St. Petersburg, Russia
2
Institute of Problems of Mechanical Engineering, 61 Bolshoy pr. V.O., 199004 St. Petersburg, Russia
*
Author to whom correspondence should be addressed.
Crystals 2021, 11(11), 1278; https://doi.org/10.3390/cryst11111278
Submission received: 18 September 2021 / Revised: 12 October 2021 / Accepted: 18 October 2021 / Published: 21 October 2021
(This article belongs to the Special Issue Research and Development of Ferroelectric Material)

Abstract

:
A comparative analysis of crystal structure, Raman spectra, and dielectric hysteresis loops was carried out for organic ferroelectric crystals of 2-methylbenzimidazole (MBI) grown from ethanol (MBIet), acetone (MBIac), deuterated acetone (MBId-ac), or prepared by sublimation from gas phase (MBIgas). Raman spectroscopy shows identical frequencies of molecular vibrations in all studied crystals, proving the same molecular structure. At the same time, a detailed analysis of the asymmetry of the powder XRD reflection profiles indicates the presence of nano-scaled regions with the same MBI symmetry and crystal structure but slightly different sizes and unit cell parameters. The formation of the MBI modifications is associated with possible penetration of solvent molecules into the voids of the MBI crystal structure. Dielectric hysteresis loops in MBIet and MBId-ac crystals at room temperature demonstrate significantly different values of coercive fields Ec. Analysis of hysteresis loops within the framework of the Kolmogorov-Avrami-Ishibashi (KAI) model shows that the polarization switching in MBId-ac occurs much faster than in MBIet crystals, which in the KAI model is associated with different values of the characteristic frequency ω0 and the activation field Ea of the domains wall motion.

Graphical Abstract

1. Introduction

At present, an active search and study of new organic and semi-organic ferroelectrics and related materials is underway. Among the attractive properties of such compounds are their low cost, lightness, flexibility, and the potential for creating on their basis biocompatible, environmentally friendly devices for collecting side energy (harvesting), field sensors, three-dimensional (3D) printing, information recording, etc. [1]. Scientific interest in organic and semi-organic ferroelectrics is mainly associated with a variety of microscopic mechanisms leading to the appearance of ferroelectricity in them. These include, in particular, the phenomena of tautomerism, spontaneous ordering of hydrogen ions in chains formed by hydrogen bonds, cooperative displacement of atomic groups, and charge transfer between molecules in different crystallographic planes. Moreover, it is important to note that these mechanisms can be combined in one material [2].
Notable progress in the field of organic ferroelectrics was associated with the discovery of ferroelectricity in polymers polyvinylidene fluoride PVDF and P(VDF-TrFE) [3], organic molecular crystals of croconic acid (CA) [4], which have a high value of spontaneous polarization Ps = 30 μC/cm2 at room temperature, as well as a number of other high temperature small-molecular hydrogen bonded ferroelectric crystals [2] including 2-methylbenzimidazole (MBI) [5].
The ferroelectric properties of MBI (C8N2H8) crystals were discovered in [5]. Studies of crystals and films of this organic ferroelectric are currently being carried out with increasing intensity. The crystals of MBI attract attention, because at room temperature they have low values of coercive fields Ec ~ 2–3 V/μm, which is about an order of magnitude lower than in ferroelectric polymers, and spontaneous polarization Ps ~ 5–7 μC/cm2. In micron-thick MBI films obtained by the method of scraping (solution shearing) [6] and in textured MBI films obtained by evaporation from solution [7,8,9,10] or physical vapor deposition [11], polarization switching occurred in an electric field of several Volts. Ferroelectric properties of MBI crystals and films are retained up to the melting point Tm ≈ 450 K, and an important property of MBI is the ability to switch polarization in different directions perpendicular to the pseudotetragonal axis by low fields [5,6,7,8,9,10,11].
Equilibrium ferroelectric domain structures of MBI crystals were visualized by piezoelectric force microscope (PFM) on (001)tetr cleavage [5] (in tetragonal notation) and by atomic force microscope (AFM) using the scanning Kelvin probe microscopy on the (110)tetr microcrystal surface with a polarization component perpendicular to the surface [12]. The electrostatic force microscopy mode also made it possible to visualize ferroelastic domain walls [12]. It was shown that, in the case of a microcrystal, the influence of a locally applied electric pulse caused displacement of both ferroelectric and ferroelastic domain walls [12]. Recent studies have shown that a feature of this molecular crystal consisting of heterocyclic molecules is the unusually efficient generation of terahertz radiation, which makes it possible to study the 3D distribution of spontaneous polarization and its changes under the action of an electric field [13]. Optical visualization of 180° ferroelectric domains in MBI films by birefringent field-modulation imaging technique based on use of Pockels effect was realized in [14].
Relatively high values of spontaneous polarization, low values of coercive fields, resistance to a large number of polarization switches [6], the possibility of switching in different directions, and efficient generation of terahertz radiation, show that this material may be promising for applications, which increases the requirements for the quality of crystals and films.
MBI single crystals and films have been grown by vacuum sublimation [5,11] or evaporation from a solution of chemically prepared MBI powder in organic solvents [6,7,8,9,10]. It is known that, when growing crystals from solutions, the solvent can significantly affect the properties of the crystals obtained, and at present the influence of the solvent is being intensively studied [15,16,17,18,19,20,21,22,23,24,25,26]. In particular, the growth of organic crystals from aqueous solutions can be accompanied by the appearance of liquid inclusions, that is, a non-crystallized liquid solution (mother liquor), physically enclosed in a growing crystal [15]. The presence of such inclusions can lead to the appearance of the temperature dependences of the dielectric constant or heat capacity of features characteristic of first-order phase transitions [17]. The crystals grown from aqueous solution can also include the water molecules as part of crystal structure [18,19]. Depending on the solvent the new compounds may crystallize, in which the solvent molecule is part of the crystal structure [16,20,21]. Effect of solvent choice on crystal morphology and polymorphism was studied in a number of works [15,16,22,23,24,25,26]. In addition, when using organic solvents, one can expect that solvent molecules will enter the voids of the crystal structure of the grown crystal [15]. Their presence, similar to the action of other defects, can significantly change the ferroelectric properties of crystals, affecting the rate of formation of critical nuclei with the opposite orientation of spontaneous polarization, the magnitude of the activation field Ea, which determines the rate of motion of domain walls, and the characteristic frequency, which is responsible for the switching rate.
The aim of this work was to compare the crystal structure, microstructure, chemical composition and ferroelectric properties of 2-methylbenzimidazole single crystals grown by evaporation from solutions of ethanol (MBIet), acetone (MBIac), deuterated acetone (d-acetone) (MBId-ac) and by sublimation from the gas phase (MBIgas). The most important characteristic of ferroelectric materials is polarization switching; therefore, comparative study of the structural and nonlinear dielectric properties (hysteresis loops) of MBI crystals obtained from various solvents is of interest. Special attention was paid to the characteristic frequencies of polarization switching, and the magnitude of the activation field, which determines the velocity of the domain wall move under the action of the electric field.

2. Materials and Methods

In previous works, MBI crystals were prepared by vacuum sublimation [5] or grown from an ethanol solution [8,9] or ethanol: methanol: water mixture [27]. For the growth of MBI films in a closed volume, an organic solvent N, N-dimethylformamide [6] was used. The texted MBI films with spherulite structure were grown by evaporation from the ethanol solution [7,8,9,10]. Similar types of texted MBI films have been obtained by physical vapor deposition (PVD) method [11].
In this work, MBI crystals were grown by evaporation from a solution in ethanol (MBIet), acetone (MBIac), d-acetone (C3D6O) (MBId-ac) and by sublimation from gas phase (MBIgas). The choice of the solvents is due to the fact that MBI dissolves in them quite well, and the molecules of ethanol and acetone differ in size, structure, and chemical composition; in particular, there is no OH hydroxyl group in acetone and d-acetone. In addition, ethanol and acetone differ in the rate of evaporation and the possible presence of water molecules in them. It was of interest to study the effect of these differences on the properties of MBI crystals obtained from these solvents.
The crystals were grown using chemically prepared MBI powder. To remove impurities, the powder was recrystallized several times in ethanol. As a result, colorless crystals were obtained. The purified crystals were dissolved in ethanol or acetone to obtain almost saturated solutions, and from them at room temperature, millimeter-sized crystals were grown by evaporation. The crystallization process in acetone and d-acetone proceeded much faster than in ethanol due to the higher rate of acetone evaporation. The crystals also were grown by sublimation: the MBI crystals were heated in closed volume up to T ~ 400 K, at which the intensive sublimation process begins, and MBI crystallization from the gas phase occurred on a glass surface at room temperature. The air pressure in the volume was ~10−2 Torr.
Images of MBI crystals grown from ethanol (MBIet) are presented in [8]. Figure 1 shows photographs of MBI crystals obtained from d-acetone (MBId-ac) and gas phase (MBIgas). Unlike crystals grown from ethanol, which are plates with a thickness of h ~ 400–700 μm, thinner colorless MBId-ac plates of approximately equal thickness h ~ 200 μm were grown from acetone (Figure 1a). Bulk MBIgas crystals of small size were obtained from the gas phase (Figure 1b). The images of transparent MBId-ac plates in a polarizing microscope in crossed polarizers are uniformly darkened, indicating the absence of twins and intergrowths in them.
Powders obtained by grinding MBIet, MBIac, MBId-ac, and MBIgas single crystals were used as samples for X-ray diffraction (XRD) studies. Some details of the XRD experiment and the analysis of XRD patterns are described in Ref. [19] and in Supplementary Materials (SM) to this article. Only brief necessary information on these issues will be given here.
The measurements were carried out on a D2 Phaser XRD powder diffractometer (Bruker AXS, Karlsruhe, Germany) using monochromatic Cu-Kα radiation (mean wavelength λ = 1.5418 Å), monochromatized by Ni filter, and a semiconductor linear X-ray detector LYNXEYE (Bruker AXS, Karlsruhe, Germany). For measurements of the MBIet and MBIgas powders, we used low-background sample holders in the form of polished single-crystal Si plates (119), whereas a standard sample holder with an amorphous plastic lining was used to measure MBIac and MBId-ac powders (see more extended description in Supplementary Materials Section 1). Because of a strong solubility of MBI, it was not possible to use liquids (ethanol, acetone) to exclude the effects of preferred orientation during the preparation of powder samples for X-ray measurements. To reduce the possible effects of preferred orientation during measurements, the samples were rotated about the axis of the sample holder, which coincided with the axis of the X-ray goniometer. To calculate the microstructural parameters and unit cell parameters of crystalline phases from X-ray diffraction data the programs SizeCr [28] and CelSiz [29] have been used. All calculations were done for Cu-Kα1 wavelength (λ = 1.540598 Å) after corrections of XRD patterns for the contribution of Cu-Kα2 radiation using the EVA program [30]. The angle corrections (zero shift Δ2θzero and displacement Δ2θdispl∙cos(θ)), obtained as a result of the additional measurements of the samples mixed with powder XRD standard Si640f (NIST, Gaithersburg, MD, USA), were also applied to reflections selected from the X-ray diffraction patterns.
Raman spectroscopic measurements were carried out on both MBI powders and single crystals. Raman spectra were obtained in the spectral range 80–3300 cm−1 using an Alpha 300R confocal microscope (Witec, Ulm, Germany) in backscattering geometry using a laser diode operating at a wavelength λ = 532 nm with power of 32 mW. The incident light was linearly polarized along or perpendicular to the longest edge of the crystal. There was no polarizer in the path of the scattered light.
Dielectric hysteresis loops were measured in the Sawyer-Tower circuit. A sinusoidal electric voltage was applied along the [110]tetr axis in the 1 1 ¯ 0 tetr crystallographic plane of the crystals described in pseudotetragonal symmetry. An electric field with an amplitude of up to Em = 6 V/μm from a Γ3-123 oscillator and a TREK 2220 (Trek Inc., Denver, CO, USA) amplifier was applied to the crystal using silver paste electrodes. The sample capacity did not exceed 1–3 pF. The measurements were carried out at a frequency range of f = 50–60 Hz. The signal was taken from a 0.1 µF reference capacitor and recorded with a GDS-71062A digital oscilloscope.

3. Results and Discussion

3.1. Raman Spectroscopy

A detailed analysis of the Raman spectra of MBI crystals grown from ethanol and their comparison with the spectra known in the literature is given in [19]. Figure 2 shows the Raman spectra of MBI samples grown from acetone, d-acetone and ethanol. The spectra consist of a number of narrow bands caused by intramolecular vibrations of MBI molecules of different natures, in particular, stretching vibrations of carbon–hydrogen valence bonds (ν ~ 3000 cm−1), carbon–nitrogen and carbon–carbon valence bonds (ν ~ 600–1700 cm−1), bending of benzene and imidazole rings (ν ~ 100–120 cm−1). A characteristic feature of the MBI spectrum is a strong band at ν ~ 1545 cm−1 belonging to stretching vibrations of carbon–nitrogen double bonds in the imidazole ring. This band is observed in all MBI crystals grown from various solutions (see Figure 2). In contrast, this band is absent in the MBI compounds with inorganic acids [19], in which the MBI molecules are in a protonated form with a single valence carbon–nitrogen bond in the imidazole ring.
Comparison of the Raman spectra of MBIet, MBIac and MBId-ac samples shows their almost complete identity (Figure 2, Table 1). The absence of additional bands and frequency shifts of bands in the crystals under study indicates the same molecular composition of these samples and the presence of identical valence bonds in them. It is noteworthy that we did not find in the Raman spectra any signs of the presence of deuterium ions in the MBId-ac crystals grown from d-acetone. Replacement of hydrogen ions with deuterium ions in the MBI structure should affect the frequencies of stretching vibrations of carbon-hydrogen bonds in the benzimidazole ring (line N1) and in the methyl group (lines N2,3) which should be shifted to the region of 2100–2200 cm−1 [31]. In this frequency range, as the experiment shows, there are no lines in all MBI samples. This means that deuterium ions in MBId-ac crystals were not included in the structure, and all studied MBI crystals had the same chemical composition. This is not surprising, since replacing hydrogen with deuterium requires the use of solvents in which the deuterium ion is bonded to a more electronegative ion, as in deuterated methanol (CH3-OD) or heavy water (D2O). Nevertheless, the fact that deuterium has not replaced hydrogen allows us to disregard the changes in ferroelectric properties associated with substitution, and to consider only changes in the crystal structure.

3.2. Powder XRD

The crystal structure of ferroelectric MBI belongs to the noncentrosymmetric Pn space group, but noncentrosymmetric deformations of crystal lattice are very small and cannot be detected in XRD experiments. For this reason, MBI crystal structure is described by pseudosymmetric tetragonal space group P42/n [33]. Assignment of the MBI crystal to a noncentrosymmetric Pn space group is proved mainly by the presence in MBI crystals of ferroelectric [5,6,7,8,9,10,11] and piezoelectric [5,34] properties, and the observation of ferroelectric [5,12] and ferroelastic domains [12].
X-ray phase analysis showed that, excluding the discrepancy in the intensity of reflections due to the large influence of the effects of preferred orientation, all reflections on XRD patterns from MBIet, MBIac, MBId-ac and MBIgas powder samples can be attributed to MBI structure (see Supplementary Materials Figure S1 as an example of comparison of experimental and theoretical XRD patterns simulated using single crystal data [33] by means of the PCW program [35]). In accordance with the XRD study of MBI single crystal grown in an inert gas atmosphere [33] (CCDC code 1199885), the MBI structure is characterized by tetragonal space group P42/n (86) and unit cell parameters a = 13.950(9) Å and c = 7.192(3) Å.
A thorough inspection of the reflection profiles showed that the XRD patterns from the MBId-ac and MBIgas samples are characterized by rather narrow reflections with profiles close to symmetrical (Figure 3b). In contrast to that, the MBIac sample is characterized by wider and clearly asymmetric reflections profiles, and the MBIet sample shows a pronounced asymmetry or even a splitting of the reflections (Figure 3a).
The asymmetry of reflections can be described as an overlapping of the reflections with symmetrical profiles arising from nano-scaled regions of different sizes characterized by the same MBI structure, but slightly different unit cell parameters. In the following text, these regions of the MBI samples will be called phases.
For XRD patterns of all samples, all reflections extracted from the observed asymmetrical reflections are characterized by the ratio of the half-width at half of the maximum (FWHM) to the integral width of the observed reflections (Bint), lying in the range of 0.637 ≈ 2/π < FWHM/Bint < (4∙ln(2)/π)1/2 ≈ 0.939 (Figure 4 and Figures S1–S7 of Supplementary Materials), i.e., they are reflections of the pseudo-Voigt (pV) type [36]. To obtain the quantitative microstructural characteristics (the sizes of crystallites D and microstrains εs in them), the measured XRD patterns were analyzed by the methods of the XRD line profile analysis (LPA), namely the Williamson–Hall plot (WHP) [37] and Size-Strain plot (SSP) [38] techniques realized for the pV reflections in the SizeCr program [28] (instrumental broadening is corrected according to the procedure [39] for pV reflections; coefficients of Scherer, KScherrer = 0.94 [40], and Stokes, Kstrain = 4 [41], were used during the calculations; in the case of εs = 0 model, the crystallite sizes are calculated by Scherrer equation for each reflection and the mean value of D is obtained using the least squares averaging). The WHP and SSP graphs for all samples (MBIac, MBId-ac, MBIet and MBIgas) and all considered models (one-, two- or three-phase description) are shown in Figures S2–S9 of the Supplementary Materials. Corresponding quantitative results for all models and methods applied to all samples are summarized in Table S1 of the Supplementary Materials. Since the SSP method is much more sensitive to the presence of the contribution of microstrains and is more accurate (see [38] and Supplementary Materials Section 1), the results of SSP will be discussed further. Final quantitative results (crystallite sizes D and absolute mean microstrain εs values) obtained using the LPA SSP technique for all samples are presented in Table 2. Table 2 also presents the unit cell parameters of the detected MBI crystalline phases calculated by means of least squares method using the program Celsiz [29].
It should be noted that in the LPA WHP and SSP techniques, the parameters of the XRD reflections are refined independently of each other. Since the reflections are processed independently, the observed asymmetry of reflections in the samples can be described equally well by both two and a larger number of independent reflections when using LPA technique, varying their angular Bragg positions 2θ and FWHM. As a result, the true number of separated reflections (i.e., the number of the crystal phases existing in the sample) required to describe the XRD patterns remains uncertain in the LPA. However, in the Le Bail (LB) fitting method [42], the theoretical Bragg positions 2θ of the reflections and their FWHM are determined by the refined parameters of the structure and microstructure of the corresponding phases, which makes it possible to find the minimum number of the crystalline phases necessary to describe the measured XRD patterns. In order to make a choice among models with one, two or three MBI phases, and to confirm the presence of microstrains and quantitative results on the sizes of crystallites and microstrain values, a whole-pattern fit of the calculated XRD patterns to experimental ones was performed by the LB method using the TOPAS program [43,44].
The LB method does not require knowledge of the coordinates of the atoms, as in the Rietveld method, and, in addition, the influence of the effects of preferential orientation is leveled. It is only necessary to know the space group and the initial approximate values of the unit cell parameters of the phases, which were taken from Table 2. In addition, the non-structural parameters of the XRD patterns were refined, such as the scale factors of the crystalline phase, zero shift and displacement angular 2θ corrections, as well as the background parameters. Using first principles (fundamental parameters, FP) reflection type [43,45], the instrumental broadening of the reflections was simulated by TOPAS during the LB fitting from the known geometry and slit sizes parameters of the diffractometer.
The main reasons for the broadening of the XRD reflections are the small size of the crystallites, on which XRD occurs, and the presence of microstrains in the crystallites. Taking into account this fact, the microstructural parameters were refined during the LB fitting. In TOPAS these are the mean crystallite size and the absolute value of the mean microstrain e0. For the aim of comparison with the value of the crystallite size D obtained by SizeCr, the parameter Lvol-FWHM calculated in TOPAS from the refined parameters of FWHM of reflections utilizing the same coefficient of the Scherrer equation KScherrer = 0.94 is considered here as crystallite size.
In the LB method, the weight contents of the crystalline phases in the samples are not calculated due to the lack of information about the atomic content of the phases. However, since all the crystalline phases observed in the samples are MBI phases with approximately the same unit cell volumes, it can be assumed with a good degree of accuracy that the masses of their unit cells are almost the same. Based on this assumption, the weight content of the MBI phases was calculated as the fraction occupied by the area under the strongest reflections of these phases with Miller indices hkl = 002 without the background contribution, from the area of the total reflection 002, WtMBIi (wt.%) = SMBIiSMBIj·100%. Other details of the LB fitting (five-spectral line description of the Cu- emission [46], background type and weight used in the LB refinement) are the same as described in the Ref. [19].
The results of the final models with best quality of the LB fitting are summarized in Table 3 for all samples. Results obtained for other models are shown in Supplementary Materials Table S2. An example of graphical results of the LB fitting is shown in Figure 4 for MBIac sample in the final model of two-phase description. For other models and samples, the graphical results are shown in Figures S10–S13 of Supplementary Materials (due to the use of an amorphous plastic lining in the sample holder during XRD measurements of a small amount of powder (see Section 2 and Supplementary Materials Section 1), XRD patterns of MBId-ac and MBIac samples show a weak amorphous halo).
Final results of the LB fitting the profile of 002 reflection with contribution of the individual MBI phases are shown in Figure 5 on an extended scale for all samples. Taking into account the contribution of an additional MBI phase (third phase in case of MBIet and second phase for other samples) leads to a drastic improvement of the quality of the LB fitting. The amplitude of the difference diagram Idiff decreased by ~1.3–1.7 times (cf. parts (a) and (b) at Supplementary Materials Figures S9, S11, S12, and Figure 4, and Supplementary Materials Figure S10). The fit of reflection profiles has improved significantly (Figure S13 of Supplementary Materials). Agreement factors have decreased considerably (Table 3 and Table S2 in Supplementary Materials), proving the formation of the additional MBI phases. For example, weighted profile factor Rwp for the samples MBIet and MBIac characterized by clearly asymmetrical reflection profiles (Figure 3a) decreased by 2.29% and 2.17%, respectively. At the same time, for the MBId-ac and MBgas samples, which are characterized by almost symmetric reflection profiles, Rwp decreased by 3.11% and 6.34% correspondingly, which unambiguously indicates the formation of additional crystalline phases in these samples.
LB refinement confirmed the presence of the microstrains in the phases where they were detected in the SSP calculations (see Table 2 and Table 3). Taking into account the microstrain contribution to the broadening of the reflections, the Rwp factors decreased by ~0.05–0.5% for different samples. The final values of the agreement factors are rather small, reaching values Rwp = 4.29–6.36% for different samples (Table 3). The crystallite sizes obtained using TOPAS (Lvol-FWHM from the LB method, Table 3) and SizeCr (D according to the SSP technique, Table 2) coincide well within 1–2 e.s.d.s, Lvol-FWHM = D. However, the coincidence of the microstrain parameters e and εs obtained using TOPAS and SizeCr, correspondingly, is within 2–3 e.s.d.s only (Table 2 and Table 3). It is probably that the difference is connected with peculiarities of the microstrain calculation formalism in the programs. The definition of the microstrain is the same in the SizeCr [38] and TOPAS [43]. However, unlike the SizeCr, which follows the formalism described in the literature (for example, [50,51]), the TOPAS (version 5) uses the reflection FWHM value expressed in units of ‘radian θ’, and not ‘radian 2θ’, as in SizeCr, when calculating the microstrain in the Stokes-Wilson expression (macro e0_from_strain in the file topas.inc of TOPAS).
Thus, the microstrain parameter e obtained using TOPAS is connected with the parameter εs from SizeCr as εs(%) = 2∙e(%). Indeed, for most phases this relation is true within 1–2 e.s.d.s (Table 3). An exception is here the MBIgas sample. This is probably due to the fact that because of the close values of the Bragg angles of reflections of the different phases in the sample MBIgas, it is difficult to separate the individual reflections from the observed summary reflection and to obtain correct values of the reflection parameters for calculations by the graphical LPA methods. Thus, the LPA (SSP) and LB fitting methods mutually confirm and complement each other. Refinement of the microstructural parameters by LB fitting gives their values with smaller e.s.d.s.
So, the XRD analysis shows that the use of ethanol, acetone or d-acetone as solvents, as well as the growth of MBI crystals from the gas phase leads to the formation of several MBI phases, with slightly different unit cell parameters and markedly different sizes of crystallites and microstrains in them (Table 3). In the MBIet sample, the best fit of the experiment and calculation was obtained by taking into account three phases. In the MBIac sample, as well as in MBId-ac and MBIgas, a fairly good description is achieved in the two-phase model.
One of the phases (MBI1) detected in the samples is characterized by the volume (Vcell = 1399.3(2) Å3–1403.4(1) Å3) and, accordingly, the unit cell parameters close to ones in MBI single crystals (Vcell = 1399.6(1.4) Å3) from Ref. [33]. Based on this similarity, we will further call this phase the “first” (or “main”) phase. The size of the crystallites in “first” phases is quite large and, according to the results of the LB refinement, reaches ~100 nm (Table 3). The maximum weight percentage of the “first” phase is observed in MBIet (59.0(1) wt.%) and MBIgas (68.2(2) wt.%) samples. The lowest content of such a phase is in the samples of MBId-ac (42.6(1) wt.%) and MBIac (36.1(1)). The crystallites of the “main” phase exhibit microstrains in the values of εs = 2∙e ~ 0.1%.
An additional phase (MBI2) with larger parameters and, accordingly, a larger volume of the unit cell is formed in the samples (see Table 3, Vcell = 1405.7(2) Å3–1437(2) Å3). Further, this phase will be called the “second” (or “additional”) phase. The weight fraction of the “second” phase is 32.8(1) wt.% in the MBIet sample and 31.8(2) wt.% in MBIgas. Its fraction is maximal in MBIac samples (63.9(1) wt.%) and MBId-ac (57.4 (1) wt.%). The “second” phase is characterized by two to four times smaller crystallite sizes (~30–60 nm, Table 3) than the “first” phase. In the crystallites of the phases MBI2ac, MBI2d-ac and MBI2et, microstrains are zero or close to zero (εs ~ 0%). Microstrains of εs ~ 0.1%–0.2% were detected in the crystallites of the “second” phase of the MBIgas sample according to the results of SSP and LB refinement.
The presence of two or three phases with MBI-type structure, but with slightly different unit cell parameters, allows us to explain the observed asymmetry of the XRD reflections (weak in MBIgas and MBId-ac and clearly noticeable in MBIac samples), developing into a splitting of the reflections in MBIet samples (Figure 5). As an illustration, Table 4 shows the ratio ΔVcell/Vcell_Phase1 of the difference in the volumes of the unit cells of the “second” (and “third” for MBIet) and “main” phases detected in the samples to the volume of the unit cell of the “main” phase. As can be seen, the largest deviations ΔVcell/Vcell_Phase1 = 2.67(2)% and 1.09(2)% are characteristic, respectively, for the MBI2et and MBI3et phases of the MBIet sample, the observed reflections of which are the most asymmetric and practically show splitting. In this case, the reflections of different MBI phases with the same Miller indices are most different by the magnitude of the Bragg angles 2θ. The deviation value is reduced to the intermediate value ΔVcell/Vcell_Phase1 = 0.61(1)% for the MBIac sample with markedly asymmetric reflections. For MBId-ac and MBIgas samples with weakly asymmetric reflections, this parameter is reduced to ΔVcell/Vcell_Phase1 = 0.42(2)% and 0.31(3)%, respectively. For these samples, the difference between the parameters of the unit cell of the “main” and “additional” phases is minimal. As a result, the Bragg angles of reflections of different phases with the same hkl are close, and the total reflection observed as a result of their superposition is nearly symmetrical.
The MBIet sample obtained in ethanol also contains a small amount (8.2(1) wt.%) of the third phase, transitional in terms of unit cell and crystallite sizes between the “main” MBI1et and “additional” MBI2et phases (MBI3et phase in Table 3, Vcell = 1415.1(3) Å3, crystallite size 68(2) nm, microstrain εs ~ 0.2%).
The formation of phases in MBI crystals with slightly different unit cell parameters is apparently related to the peculiarities of the MBI crystal structure. In Figure 6, the structure is shown in projections on the crystallographic planes (100)tetr and (001)tetr drawn by program Vesta [52] according to the results of a single-crystal XRD study of a crystal grown in an inert-gas atmosphere [33]. The crystal lattice has a layered structure (Figure 6a), and the shortest distances between the layers are from ~0.41 nm to ~0.54 nm, mostly ~0.53 nm. There are also pores in the layers with sizes between atoms of ~0.50 nm (Figure 6b). During the growth of crystals, molecules of a suitable size from the environment can be randomly incorporated into the pores of the layers of the MBI structure, forming interstitial defects and leading to the formation of phases with the MBI-type structure, but with slightly larger unit cell parameters due to the incorporated molecules.
The “main” phases MBI1et, MBI1ac, MBI1d-ac and MBI1gas (Table 3), which are characterized by large crystallite sizes ~100 nm and unit cell parameters and volume close to those found for MBI single crystals from Ref. [33] grown in an inert gas, are probably attributed to phases in which foreign molecules have not penetrated, or, in any case, only a small number of them have penetrated.
The size of ethanol molecules CH3-CH2-OH ~0.52 nm [53] corresponds well to the distances between the layers and the pore sizes in the layers. When crystals grow, ethanol molecules can easily penetrate between the layers and into the pores, forming interstitial defects and leading to the formation of two additional phases (MBI2et and MBI3et) in the MBIet sample. The differences in the parameters of the unit cells of the “first” phase MBI1et without embedded molecules and the “second” phase MBI2et with the largest number of embedded ethanol molecules can reach very noticeable values (Table 3). As a result, strongly asymmetric summary MBI reflections are formed, close to splitting (Figure 3a and Figure 5a).
Acetone molecules CH3-C(O)-CH3 are larger than ethanol molecules. The molecular diameter of acetone is 0.616 nm [54], which is slightly larger than the sizes of voids in the structure of pure MBI (Figure 6). However, during the growth of MBIac crystals in liquid acetone, acetone molecules apparently penetrate into the voids of the structure, leading to the formation of an additional phase (MBI2ac) with an increased volume of the unit cell. It is probable that the number of embedded acetone molecules is not as large as in the case of ethanol, however, due to the larger size of acetone molecules and their greater molecular weight, their effect on the MBI structure extends further from the site of penetration than in the case of ethanol. As a result, due to the smaller number of embedded molecules, the unit cell volume of the “additional” phase of the MBIac sample is noticeably smaller than for the MBIet sample, however, due to the greater influence of the molecules, the volume content and, accordingly, the weight content of this phase is larger (cf. the MBI2ac and MBI2et phases in Table 3). The observed summary reflections from the superposition of the reflections of the two MBI phases are clearly asymmetric, but do not show a tendency to separation, as in the case of the MBIet sample (Figure 3a and Figure 5b).
The CD3-C(O)-CD3 d-acetone molecules are somewhat larger and heavier than the acetone molecules, since the hydrogen (H) atoms in them are replaced by atoms of its isotope, deuterium (D), whose diameter is ~2.44 times larger (the nuclear radius D is 2.1421 fm compared to 0.8783 fm for H [55]). Despite the fact that the increment in the size of the d-acetone molecule is small at the nanometer scale, this is apparently enough to make the penetration of d-acetone molecules into the voids of the MBI structure difficult. As a result, the content of the “additional” MBI phase in the MBId-ac sample is less, and its distortion (i.e., the deviation from the volume of the unit cell of the “main” MBI phase) is noticeably less than in the MBIac (cf. samples MBId-ac and MBIac in Table 3). As a result, the observed summary MBId-ac reflections are characterized by much more symmetrical profiles than for the MBIac sample (Figure 3b and Figure 5c).
In the case of the MBIgas sample, since the vacuum in the growth volume was only ~10−2 Torr (i.e., forevacuum), they were not absolutely protected from atmospheric air containing water molecules. The H2O water molecules are noticeably smaller than the sizes of the voids of the MBI structure. According to various data, their molecular diameter is only 0.26 nm [56] or 0.386 nm [54]. Obviously, they can easily penetrate into the voids of the MBI structure without having a noticeable structural effect. As a result, a “second” phase is formed in the MBIgas sample with unit cell parameters close to the parameters of the MBI1gas phase without embedded molecules (see the MBI2gas phase in Table 3). The observed summary MBI reflections from the superposition of the MBI1gas and MBI2gas phase reflections are characterized by fairly symmetrical profiles, showing only a slight asymmetry (Figure 3b and Figure 5d).
The penetration of ethanol, acetone, d-acetone or water molecules into the voids of the MBI structure leads to a decrease in the size of the coherent X-ray scattering areas, i.e., the sizes of crystallites corresponding to the “second” and “third” additional phases with an increased volume of unit cells due to the influence of the molecules (see the phases MBI2et, MBI3et, MBI2ac, MBI2d-ac and MBI2gas in Table 3). Apparently, the change in the absolute mean values of microstrain in the crystallites of the prepared samples is also associated with the influence of the embedded molecules (Table 3).
Thus, the analysis of XRD patterns shows that in the MBI samples obtained from solutions in ethanol, acetone, deuterated acetone and from the gas phase, apart from the main MBI phase, there are additional phases with a slightly larger unit cell volume. The formation of additional MBI phases is associated with the penetration of solvent or water molecules from the growth environment into the voids of the MBI structure. Penetration leads to a smaller size of the crystallites as compared to the main phase without embedded foreign molecules as well as to a change in the mean microstrains. The largest number of additional MBI phases with the most distorted unit cell parameters is formed during the growth of crystals in ethanol. Apparently, this is a size effect due to the fact that the molecular diameter of ethanol is comparable to the size of the voids of the MBI structure into which ethanol molecules are embedded. At larger (acetone or d-acetone) or smaller (water) molecular sizes compared to the sizes of the voids of the MBI structure, a smaller number of additional phases is formed and also the changes in the volumes of the unit cells are smaller.

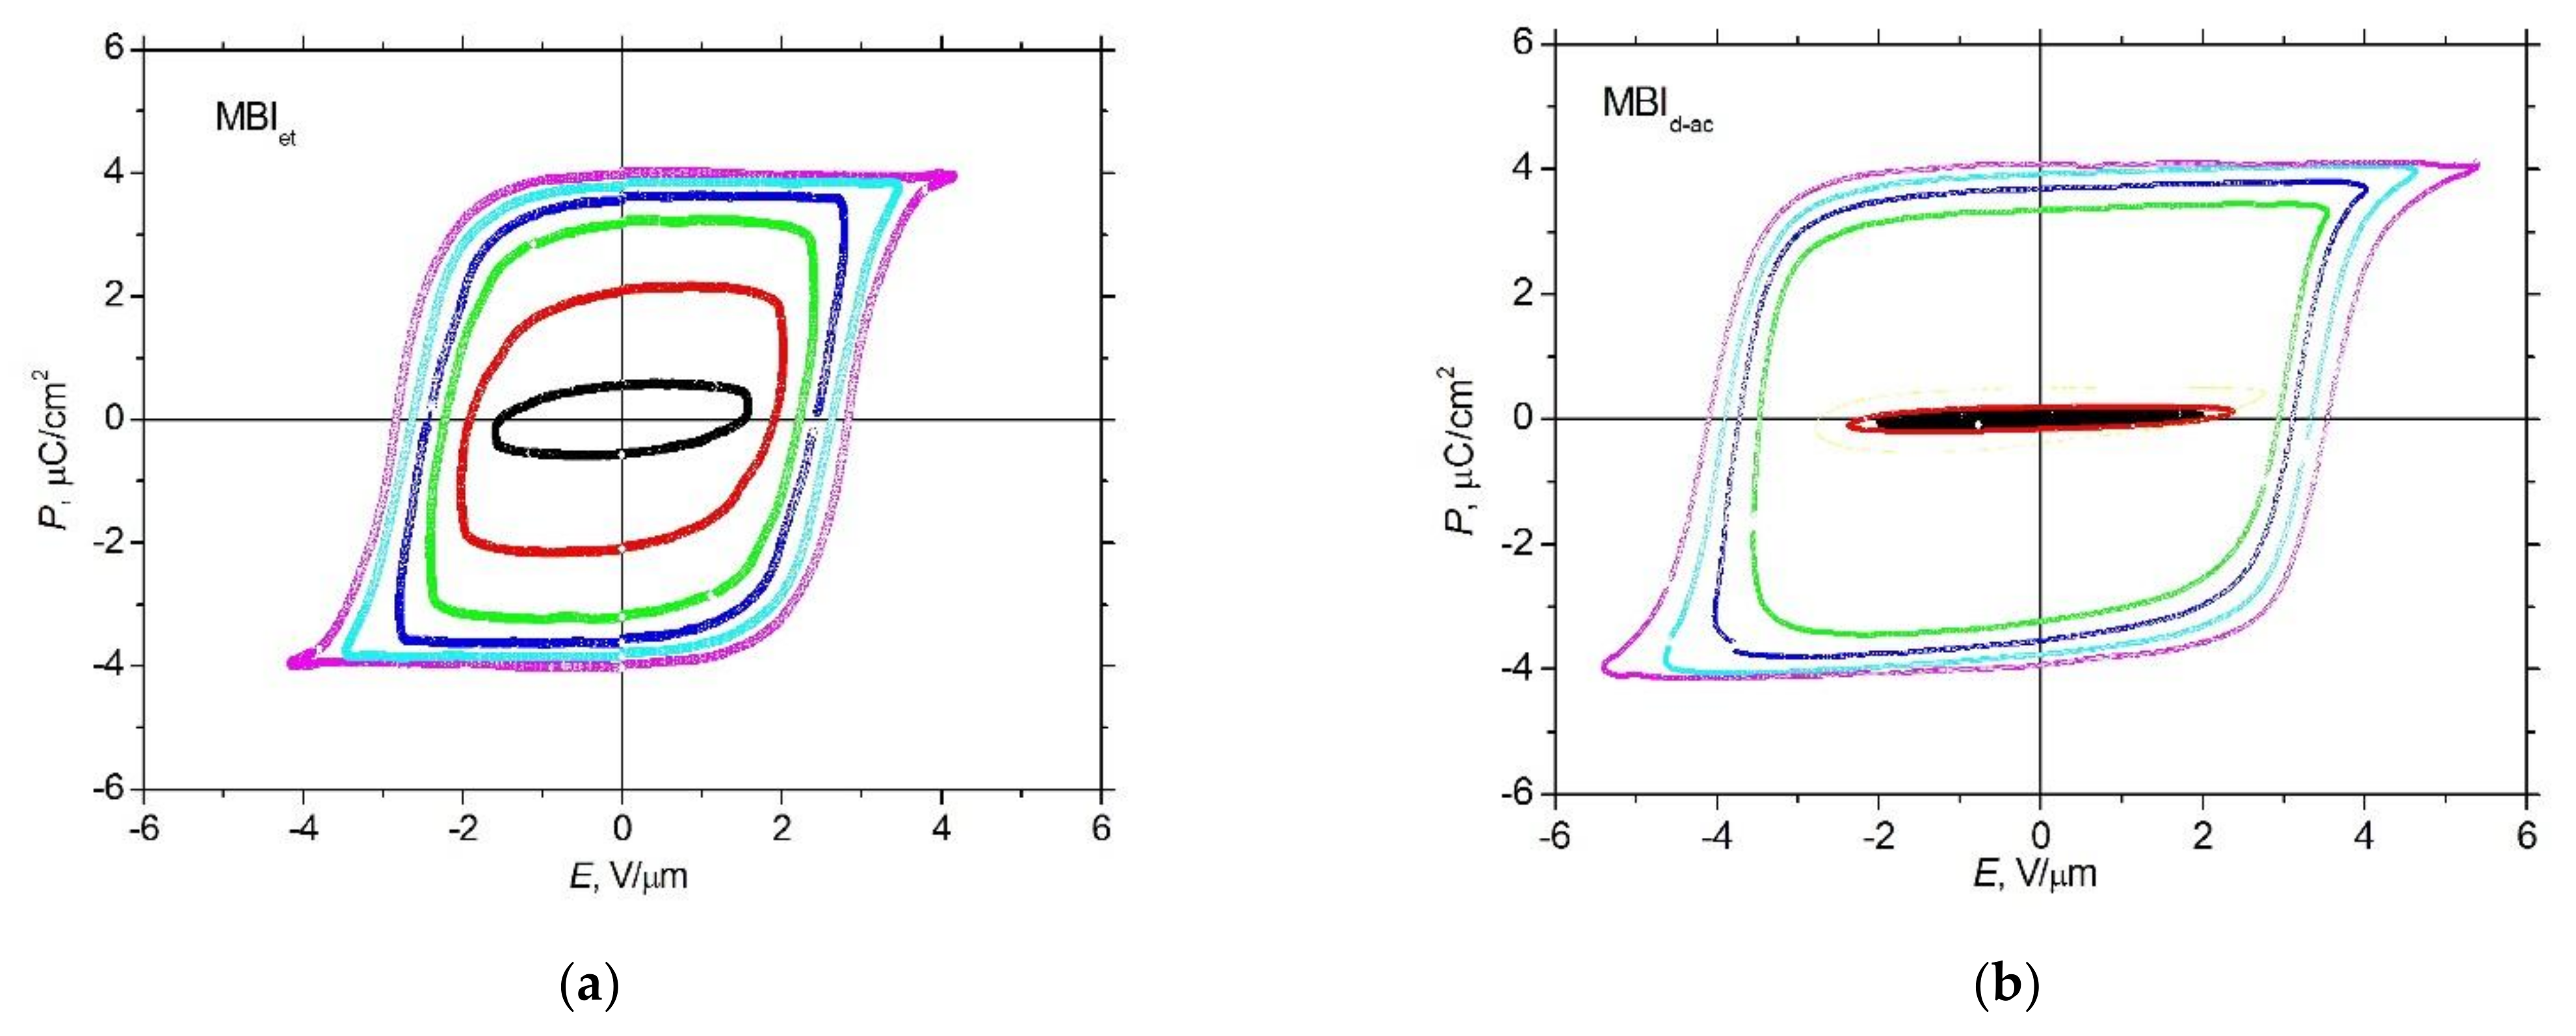
3.3. P-E Measurements

As shown in XRD analysis, the MBId-ac and MBIgas powder samples involve two MBI crystalline phases with close unit cell volumes characterized by very small asymmetry of the observed reflection profiles and narrow reflection width. In contrast to that, MBIet and MBIac powder samples exhibit the clear presence of at least three and two phases, correspondingly, with wide XRD reflection width. Below we compare dielectric hysteresis loops of MBId-ac crystals with nearly uniform crystal structure and MBIet in which uniformity is much less.
The analysis of dielectric hysteresis loops in MBI single crystals and films obtained by evaporation from ethanol is given in Refs. [8,9,10]. The simulation of hysteresis loops at different values of the electric field amplitude Em, its frequency, and also different temperatures, carried out within the Kolmogorov-Avrami-Ishibashi (KAI) model [57,58,59], taking into account Merz’s law [60], showed that the activation field for the motion of domain walls Ea decreases by a factor of about 3–4 with temperature increase up to 380 K, tending to zero at T ~ Tm  430 K [9,61]. This indicates the presence in the MBI of a potential ferroelectric transition in the vicinity of the melting point.
Figure 7 shows the dielectric hysteresis loops of MBI crystals grown from ethanol and d-acetone for various amplitudes of the electric field Em. An electric field was applied along the crystal axis [110]tetr. It is seen that the saturated hysteresis loops of MBId-ac crystals have noticeably higher coercive fields (Ec = 3.8 V/μm) than those of MBIet (Ec = 2.8 V/μm). It is worth noting that at room temperature the hysteresis loops in MBI samples grown from gas phase also reveal high values of Ec [5] comparable with those observed in MBId-ac.
Significant differences are also observed in the behavior of the remnant polarization Prem. Figure 8a shows the dependencies of Prem on the amplitude of the sinusoidal electric field Em in MBId-ac and MBIet. The Prem(Em) dependence in the case of MBId-ac is shifted towards higher amplitudes and is characterized by a sharper increase in the remnant polarization than in the case of MBIet. The maximum values of the derivative dPrem/dEm in MBId-ac and MBIet, calculated from experimental data in units of relative permittivity, are 36 and 32, respectively. The Prem(Em) dependence in the case of MBId-ac for different frequencies and comparison with calculations (see below) is presented in Figure 8b. Thus, the polarization switching process in MBI crystals obtained from ethanol and d-acetone exhibit significant differences.
To describe the shape of dielectric hysteresis loops and get the parameters characterizing the switching process, the 1D Janta model [62] was used, which gives analytical expressions for simulating dielectric loops. The model is a case of the KAI (β-model) [57,58,59], taking into account Merz’s law [60] for the velocity of domain walls sideway motion:
v = v∞· exp(−Ea/E)
where Ea is the activation field, v is the velocity of motion of the domain wall in an infinitely strong field. The model describes the change in the volume of the switched phase for a given dimension of the domain topology (1D, 2D). Since this approach, as was shown earlier for Triglycine sulfate (TGS) [63], best describes the amplitude dependences of polarization loops, here the main attention will be paid to modeling a set of loops obtained at different amplitudes of a sinusoidal signal. The value of activation field Ea for TGS obtained using the model [63] corresponds well to that from direct observation of the domain wall moving under electric field [64,65].
In the 1D model [62], it is assumed that there are randomly located non-switchable domains in the form of infinitely thin planes with linear density N. This condition means that the model does not take into account the small time required to create the through domains, and assumes that the switching time is determined by the lateral displacement of the domain walls (KAI β-model). The presence in MBI of flat ferroelectric domain walls moving under the action of an electric field, has been recently shown in [12] by AFM using the Kelvin- and the electrostatic mode.
The hysteresis loop 1D model is described by the following expression for the relative change to the polarization in the loop [62]:
P P s = 1 1 + t a n h   ω 0 ω · I π , E m E a   · e x p 2 ω 0 ω · I ω t , E m E a I ω t , E m E a = 0 ω t e x p E a E m s i n x d x ,
where ω0 = v·N is the characteristic frequency of the system, Ps the spontaneous polarization, Em and f the amplitude and frequency of the sinusoidal electric field, correspondingly, and ω = 2πf. The model has two dimensionless parameters, ω 0 ω and E m E a , which determine the shape of the hysteresis loop. To get these parameters, we fitted the experimental and calculated dielectric hysteresis loops P(E), as well as the dependences of the remnant polarization on the electric field amplitude Prem(Em) (Figure 8). Since the model used does not take into account the dependence of the polarization on the field associated with the sample capacity, the linear dependence of the polarization on the field P = α·E, was subtracted from the experimental dependences.
Calculations of dielectric hysteresis loops at different field amplitudes were carried out using expressions (2). The parameters of the model were chosen so that the theoretical loops were as close as possible to the experimental ones. Optimal parameters were obtained from the minimum of the loss function corresponding to standard deviation and including a quadratic deviation of the calculated values of the remnant polarization from the experimental ones. To estimate the errors of the parameters Ea and ω0, the loss function was calculated for different values of the parameters. The error of the parameter Ea was found from the condition that the loss function should not exceed its minimum value by more than by factor of 2. The parameter ω0 for each given Ea was chosen to minimize the loss function.
Figure 9 shows the experimental (bold lines) and calculated (thin dashed lines) dependences of polarization on the electric field P(E) for various values of the electric field amplitude in MBIet at a frequency f = 50 Hz (Figure 9a) and in MBId-ac at a frequency f = 60 Hz (Figure 9b) when the phase of the electric field changes from 0 to π. For MBIet crystals, the dependences P(E) at different amplitudes of the electric field can be well described for the following model parameters: activation field Ea = 11 ± 3 V/μm and f0 = 6.25 ± 1.0 kHz. In the case of MBId-ac crystals, the smallest deviations of the calculated and experimental dependences of polarization on the electric field were obtained at an approximately doubled value of Ea =24 ± 3 V/μm, and an order of amplitude higher value of f0 = 62.5 ± 10.5 kHz.
As can be seen from Figure 9, the theoretical description of saturated hysteresis loops in the region of high fields (in the beak of the hysteresis loop) in the case of MBIet turns out to be much better than in MBId-ac. To bring the calculated hysteresis loops in MBId-ac crystals closer to those obtained experimentally, we assumed that this sample contains regions with different characteristic frequencies f01 and f02. In this case, the best description of the experimental loops in MBId-ac crystals was obtained by taking into account two additive contributions P1 and P2 to the polarization from regions with characteristic frequencies: f01 = 62.5 kHz and f02 = 6.25 kHz and an activation field Ea = 24 V/μm. The expression describing the hysteresis loop in this case has the form:
          P P s = 0.88 · P 1 P s + 0.12 · P 2 P s
The coefficients 0.88 and 0.12 in expression (3) represent the weight that the regions with P1 and P2 contribute to the dielectric hysteresis loop. In fact, these coefficients reflect the volumes of regions with different parameters of polarization switching.
Figure 10a shows the experimental (bold lines) and calculated (thin dashed lines) dependences of the hysteresis loops at different field amplitudes taking into account two contributions to the polarization P1 and P2 with characteristic frequencies f01 = 62.5 ± 10.5 kHz and f02 = 6.25 ± 1.0 kHz, respectively, and Ea = 24 ± 3 V/μm for MBId-ac.
The second term indicates the presence in the MBId-ac sample of small regions in which the polarization is not saturated in field E ~ 5 V/μm (green dash-dotted P2 line in Figure 10b). Accounting for two contributions significantly reduces the difference between experimental and calculated curves (Figure 10b), which leads to a decrease in the root-mean-square deviations by about a factor of 2 (Supplementary Materials, Table S3). Note that taking into account two contributions also allows a much better description of the Prem(Em) dependencies in MBId-ac sample (Figure 8a).
Comparison with known ferroelectrics shows that, at room temperature, the activation field in MBIet Ea ~ 11 V/μm is higher than in BaTiO3 (Ea ~ 0.6 V/μ) [66] and TGS (Ea ~ 0.011, 0.053, 0.2 V/μm in different electric field intervals) [63,64,65,67], lower than in PbTiO3 (Ea ~ 20 V/μm) and Ea ~ 100 V/μm in PZT film [68]. In MBId-ac the activation field Ea ~ 24 V/μm is higher than in BaTiO3 and TGS, and comparable with PbTiO3. In ferroelectric polymer films of P(VDF-TrFE), Ea ~ 103 V/μm [69] is approximately two orders of magnitude higher than in MBI, which can be related to the specific features of the crystal structure of polymer films.
Thus, the growth of MBI crystals in d-acetone in comparison with ethanol leads to an approximately twofold increase in the activation field Ea and an increase in f0 by an order of magnitude. Calculations show that an increase in the coercive field Ec in MBId-ac crystals in comparison with MBIet is mainly due to an increase in the activation field Ea, and a sharper increase in Prem(Em) (Figure 8) reflects an increase in the characteristic frequency f0.
The sideways motion of a ferroelectric domain wall for the case of a thermally activated regime was considered in the Miller and Weinreich (MW) theory [70], which was used to estimate the domain wall (σw) and the critical nucleus energy (Uc) in various ferroelectrics. According to the MW theory, sideways motion of the domain wall is possible because thermal fluctuations help the wall to overcome the potential barrier Uc in a field E. To estimate the energy Uc of the critical nucleus, the following conditions of the MW theory must be satisfied: the length l of the critical triangular nucleus along the polarization is much larger than its width a (l/a >> 1); the nucleus thickness c is approximately one lattice constant; the magnitude of a should be larger than the corresponding lattice parameter in accordance with the MW theory; at temperatures and fields used in the experiment, the system should be in thermo-activated regime Uc > kBT. Using the experimental values of Ea and Ps, the dielectric constant εa = 8 and the lattice parameters, we can estimate the energy of the critical nucleus Uccσw3/2σp1/2/PsE and the domain wall energy σw, as a function of E. For E ≤ 6 V/μm, the condition of the thermo-activated regime Uc > kBT is satisfied both in MBIet and in MBId-ac. Calculations show that (for E = 1.5 V/μm) in MBIet σw 0.45 mJ/m2 and Uc ≈ 6 kBT, and in MBId-ac σw ≈ 0.92 mJ/m2 and Uc ≈ 14 kBT.
Domain wall energy σw ≈ 0.45–0.92 mJ/m2 in MBI is significantly smaller than in the P(VDF-TrFE) films (σw ≈ 60 mJ/m2) [69], PbTiO3 (132 mJ/m2) and comparable with BaTiO3 (3–17.5 mJ/m2) [66] and TGS (0.6–0.9 mJ/m2) [64,65] crystals. Since MW theory gives a somewhat underestimated value of the domain wall energy, the calculated values should be considered as its lower limit. The smaller value of the energy σw in MBI is, obviously, due to the lower values of the polarization and larger value of the lattice parameters than in inorganic ferroelectrics.

4. Conclusions

The presented study showed that MBI crystals grown from different solvents, having almost identical chemical composition and type of crystal structure, can, at the same time, have different microstructure and dielectric properties. This is manifested in the presence of various crystalline MBI phases (regions) with the same structure but slightly different unit cell and microstructure parameters in crystals, as well as in the difference in parameters describing the polarization switching process caused by the motion of ferroelectric domain walls. These differences are most evident between MBIet and MBId-ac crystals (and also MBIgas). The appearance of the MBI phases with slightly different parameters of the crystal structure can be associated with the possible entry of solvent molecules into the pores or cavities between the layers of the MBI crystal lattice, which can lead to an increase in the lattice parameters and, accordingly, the volume of the unit cell of these phases.
The number of different MBI phases and the difference in the values of the parameters characterizing their crystal structure may indicate the degree of homogeneity of the crystals. In the case of MBI, the most homogeneous structure is observed for crystals grown from d-acetone MBId-ac and from the gas phase MBIgas, in which two phases with very small differences in lattice parameters were found. The crystals of MBIet (three phases) and MBIac (two phases) are much less homogeneous. The differences in the degree of homogeneity seem to correlate with the size of the solvent molecules, since the d-acetone > acetone > ethanol sequence corresponds to a decrease in molecular size and homogeneity of MBI crystals grown from these solutions. When the size of the molecules is significantly smaller than the size of the structural voids (as in the case of water molecules in MBIgas), the uniformity of the MBI crystals increases again, probably due to the smallness of the impact of such molecules.
Differences in homogeneity are also manifested in the process of polarization switching by an electric field. Calculations of the switching parameters from analysis of hysteresis loops at different amplitudes of the alternating field turned out to be very sensitive for detection of the uniformity of the material. Calculations have shown that in “inhomogeneous” MBIet crystals, the activation field Ea, which determines the dependence of the velocity of motion of domain walls on the electric field, turns out to be approximately two times less than in “homogeneous” MBId-ac crystals. The characteristic frequency f0 in MBId-ac is an order of magnitude higher than in MBIet. Such a difference in the parameters characterizing the domain wall motion seems natural, since usually a decrease in the number of defects in a crystal, i.e., an increase in homogeneity, is accompanied by an increase in the coercive field. The presence of structural defects helps the walls to overcome the energy barrier, which leads to a decrease in the energy of the critical nucleus.
Unlike MBIet in “homogeneous” MBId-ac crystals the presence of not only a region with high values of f0, but a small part of a volume (about 10%) with a lower value of characteristic frequency f0, is detected. The f0 parameter in the used model depends mainly on the number of through non-switchable infinitely thin domains N. This number correlates with the energy of the critical nucleus with the opposite direction of polarization at a boundary with the electrode. The presence of small regions with a lower value of f0 in MBId-ac may be associated with a change of boundary conditions at the electrode which increases the energy of the critical nucleus for creating of through domains.

Supplementary Materials

The following are available online at https://www.mdpi.com/article/10.3390/cryst11111278/s1, Figure S1: an example of comparison of experimental and theoretical XRD patterns. Figures S2–S9: WHP and SSP graphs, and D(2θ) distributions in studied MBI crystals for 1-phase or 2-phase or 3-phase models. Figures S10–S13: the final graphical results of LB fitting of the XRD patterns in studied MBI crystals. Figure S14: Experimental (Iexp) and calculated (Icalc) profiles of the XRD reflection with Miller indices hkl = 002 for samples (a) MBIet, (b) MBIac, (c) MBId-ac and (d) MBIgas in LB fitting models with one and two MBI phases (two and three phases in the case of MBIet). Table S1: Parameters a and c of the tetragonal unit cell, the mean size D of the crystallites, and the absolute average value εs of the microstrain in them for the MBI phases obtained from XRD data using the Celsiz (a and c) and SizeCr (D and εs by means of the WHP and SSP methods) programs. Table S2: Results of fitting diffraction patterns by the LB method using the TOPAS program, Table S3: Root mean square (RMS) deviations of the calculated hysteresis loops from the experimental ones for MBIet and MBId-ac.

Author Contributions

E.B., Conceptualization, project administration, methodology, data curation, writing—review and editing, funding acquisition; A.A.L., Methodology, investigation, software, validation, writing—original draft preparation; A.F., Methodology, writing—original draft preparation, investigation; A.R., Methodology, investigation, software; B.K., Methodology, data curation, supervision, writing—original draft preparation, writing—review and editing. All authors have read and agreed to the published version of the manuscript.

Funding

The reported study was funded by RFBR and NSFC, project number 21-52-53015.

Data Availability Statement

The data presented in this study are available on request from the corresponding author.

Acknowledgments

The work was carried out with use of the equipment and software of the Joint Research Center “Materials science and characterization in advanced technology” (A. F. Ioffe Physical-Technical Institute of Russian Academy of Sciences) and the unique scientific installation “Physics, Chemistry and Mechanics of Crystals and Thin Films” of the Institute of Problems of Mechanical Engineering IPME RAS, (St. Petersburg). The authors are grateful to F.B. Svinarev and A.A. Bondarenko for their help in measuring the dielectric properties and in calculations of loops.

Conflicts of Interest

The authors declare no conflict of interest.

References

  1. Park, C.; Lee, K.; Koo, M.; Park, C. Soft Ferroelectrics Enabling High Performance Intelligent Photo Electronics. Adv. Mater. 2020, 2004999. [Google Scholar] [CrossRef]
  2. Horiuchi, S.; Ishibashi, S. Hydrogen-Bonded Small-Molecular Crystals Yielding Strong Ferroelectric and Antiferroelectric Polarizations. J. Phys. Soc. Jpn. 2020, 89, 051009. [Google Scholar] [CrossRef]
  3. Kawai, H. The Piezoelectricity of Poly (vinylidene Fluoride). Jpn. J. Appl. Phys. 1969, 8, 975–976. [Google Scholar] [CrossRef]
  4. Horiuchi, S.; Kobayashi, K.; Kumai, R.; Ishibashi, S. Proton tautomerism for strong polarization switching. Nat. Commun. 2017, 8, 14426. [Google Scholar] [CrossRef]
  5. Horiuchi, S.; Kagawa, F.; Hatahara, K.; Kobayashi, K.; Kumai, R.; Murakami, Y.; Tokura, Y. Above-room-temperature ferroelectricity and antiferroelectricity in benzimidazoles. Nat. Commun. 2012, 3, 1308. [Google Scholar] [CrossRef] [Green Version]
  6. Noda, Y.; Yamada, T.; Kobayashi, K.; Kumai, R.; Horiuchi, S.; Kagawa, F.; Hasegawa, T. Few-Volt Operation of Printed Organic Ferroelectric Capacitor. Adv. Mater. 2015, 27, 6475. [Google Scholar] [CrossRef]
  7. Balashova, E.V.; Krichevtsov, B.B.; Svinarev, F.B.; Zaitseva, N.V. Thin films of a new organic single-component ferroelectric 2-methylbenzimidazole. Sci. Tech. J. Inf. Technol. 2016, 16, 801–808. [Google Scholar] [CrossRef]
  8. Balashova, E.V.; Krichevtsov, B.B.; Svinarev, F.B.; Zaitseva, N.V.; Pankova, G.A. Structural and Dielectric Properties of Organic Ferroelectric 2-Methylbenzimidazole. J. Surf. Invest. X-ray Synchrotron Neutron Tech. 2018, 12, 233–239. [Google Scholar] [CrossRef]
  9. Balashova, E.V.; Svinarev, F.B.; Ankudinov, A.V.; Pankova, G.A.; Lityagin, G.A.; Kunkel, T.S.; Krichevtsov, B.B. Polarization switching, dielectric, structural and elastic properties of 2-Methylbenzimidazole crystals and films. Ferroelectrics 2019, 538, 74–82. [Google Scholar] [CrossRef]
  10. Svinarev, F.B.; Balashova, E.V.; Krichevtsov, B.B. Dielectric properties of self-assembled spherulite films of organic ferroelectric 2-methylbenzimidazole. Ferroelectrics 2019, 543, 167–174. [Google Scholar] [CrossRef]
  11. Yuan, Y. Growth and Characterization of Molecular Ferroelectric Thin Films. A Dissertation for the Degree of Dr. Ph., Lincoln, Nebraska. 2021. Available online: https://digitalcommons.unl.edu/mechengdiss/165 (accessed on 18 April 2021).
  12. Balashova, E.V.; Krichevtsov, B.B.; Kunkel, T.S.; Ankudinov, A.V. AFM Visualization of Ferroelastic and Feroelectric Domains in 2-Methylbenzimidazole C8H8N2 Crystals. J. Surf. Invest. X-ray Synchrotron Neutron Tech. 2021, 11, 58–61. (In Russian) [Google Scholar] [CrossRef]
  13. Kinoshita, Y.; Sotome, M.; Miyamoto, T.; Uemura, Y.; Arai, S.; Horiuchi, S.; Hasegawa, T.; Okamoto, H.; Kida, N. Observation of the Three-Dimensional Polarization Vector in Films of Organic Molecular Ferroelectrics Using Terahertz Radiation Emission. Phys. Rev. Appl. 2020, 14, 054002. [Google Scholar] [CrossRef]
  14. Uemura, Y.; Matsuoka, S.; Tsutsumi, J.; Horiuchi, S.; Arai, S.; Hasegawa, T. Birefrigent field-modulation imaging of transparent ferroelectrics. Phys. Rev. Appl. 2020, 14, 024060. [Google Scholar] [CrossRef]
  15. Griesser, U.J. The Importance of Solvates. In Polymorphism: In the Pharmaceutical Industry; Hilfiker, R., Ed.; Wiley-VCH Verlag GmbH & Co. KgaA: Weinheim, Germany, 2006; Chapter 8; pp. 211–233. [Google Scholar] [CrossRef]
  16. Losev, E.A.; Mikhailenko, M.A.; Achkasov, A.F.; Boldyreva, E.V. The effect of carboxylic acids on glycine polymorphism, salt and co-crystal formation. A comparison of different crystallisation techniques. New J. Chem. 2013, 37, 1973–1981. [Google Scholar] [CrossRef]
  17. Lemanov, V.V.; Yarmarkin, V.K.; Egorov, V.M.; Pankova, G.A.; Zaitseva, N.V.; Markova, L.A. Phase transitions in crystals of protein amino acids with trapped drops of water solutions. Phys. Solid State 2012, 54, 346–349. [Google Scholar] [CrossRef]
  18. Klitou, P.; Pask, C.M.; Onoufriadi, L.; Rosbottom, I.; Simone, E. Solid-State Characterization and Role of Solvent Molecules on the Crystal Structure, Packing, and Physiochemical Properties of Different Quercetin Solvates. Cryst. Growth Des. 2020, 20, 6573–6584. [Google Scholar] [CrossRef]
  19. Balashova, E.V.; Svinarev, F.B.; Zolotarev, A.A.; Levin, A.A.; Brunkov, P.N.; Davydov, V.Y.; Smirnov, A.N.; Redkov, A.V.; Pankova, G.A.; Krichevtsov, B.B. Crystal structure, Raman spectroscopy and dielectric properties of new semi-organic crystals based on 2-methylbenzimidazole. Crystals 2019, 9, 573. [Google Scholar] [CrossRef] [Green Version]
  20. Rosbottom, I.; Ma, C.Y.; Turner, T.D.; O’Connell, R.A.; Loughrey, J.; Sadiq, G.; Davey, R.J.; Roberts, K.J. Influence of Solvent Composition on the Crystal Morphology and Structure of p-Aminobenzoic Acid Crystallized from Mixed Ethanol and Nitromethane Solutions. Cryst. Growth Des. 2017, 17, 4151–4161. [Google Scholar] [CrossRef] [Green Version]
  21. Ward, M.R.; Oswald, I.D.H. Hidden Solvates and Transient Forms of Trimesic Acid. Crystals 2020, 10, 1098. [Google Scholar] [CrossRef]
  22. Jiang, M.; Ni, X.-W. Effects of solvents and impurity on crystallization kinetics and crystal properties in a reactive crystallization of paracetamol. J. Cryst. Growth 2019, 523, 125150. [Google Scholar] [CrossRef]
  23. Davey, R.J.; Mullin, J.W.; Whitting, M.J.L. Habit Modification of Succinic Acid Crystals Grown from Different Solvents. J. Cryst. Growth 1982, 58, 304–312. [Google Scholar] [CrossRef]
  24. Hod, I.; Mastai, Y.; Medina, D.D. Effect of solvents on the growth morphology of DL-alanine crystals. Cryst. Eng. Comm. 2011, 13, 502–509. [Google Scholar] [CrossRef]
  25. Tanaka, Y.; Matsuoka, M. Selection of Solvents for Organic Crystal Growth from Solution. J. Cryst. Growth 1990, 99, 1130–1133. [Google Scholar] [CrossRef]
  26. Chewle, S.; Emmerling, F.; Weber, M. Effect of Choice of Solvent on Crystallization Pathway of Paracetamol: An Experimental and Theoretical Case Study. Crystals 2020, 10, 1107. [Google Scholar] [CrossRef]
  27. Zieliński, W.; Katrusiak, A. Colossal Monotonic Response to Hydrostatic Pressure in Molecular Crystal Induced by a Chemical Modification. Cryst. Growth Des. 2014, 14, 4247–4253. [Google Scholar] [CrossRef]
  28. Levin, A.A.; Levichkova, M.; Hildebrandt, D.; Klisch, M.; Weiss, A.; Wynands, D.; Elschner, C.; Pfeiffer, M.; Leo, K.; Riede, M. Effect of film thickness, type of buffer layer, and substrate temperature on the morphology of dicyanovinyl-substituted sexithiophene films by X-ray methods. Thin Solid Films 2012, 520, 2479–2487. [Google Scholar] [CrossRef]
  29. Maunders, C.; Etheridge, J.; Wright, N.; Whitfield, H.J. Structure and microstructure of hexagonal Ba3Ti2RuO9 by electron diffraction and microscopy. Acta. Cryst. B 2005, 61, 154–159. [Google Scholar] [CrossRef] [PubMed] [Green Version]
  30. Diffrac Suite Eva Version 5.1.0.5; Brucker AXS: Karlsruhe, Germany, 2019.
  31. NSRDS. Tables of molecular vibrational frequencies consolidated Volume 1. Nat. Stand. Ref. Data Ser. Nat. Bur. Stand. 1972, 39, 164. [Google Scholar]
  32. Güllüoglu, M.T.; Özduran, M.; Kurt, M.; Kalaichelvan, S.; Sundaraganesan, N. Molecular structure and vibrational spectra of 2- and 5-methylbenzimidazole molecules by density functional theory. Spectrochim. Acta A 2010, 76, 107–114. [Google Scholar] [CrossRef] [PubMed]
  33. Obodovskaya, A.E.; Starikova, Z.A.; Belous, S.N.; Pokrovskaya, I.E. Crystal and molecular structure of 2-methylbenzimidazole. J. Struct. Chem. 1991, 32, 421–422. [Google Scholar] [CrossRef]
  34. Horiuchi, S.; Tsutsumi, J.; Kobayashi, K.; Kumai, R.; Ishibashi, S. Piezoelectricity of Strongly Polarized Ferroelectrics in Prototropic Organic Crystals. J. Mater. Chem. C 2018, 6, 4714–4719. [Google Scholar] [CrossRef]
  35. Kraus, W.; Nolze, G. Powder Cell—A program for the representation and manipulation of crystal structures and calculation of the resulting X-ray powder patterns. J. Appl. Cryst. 1996, 29, 301–303. [Google Scholar] [CrossRef]
  36. Langford, J.I.; Cernik, R.J.; Louer, D. The Breadth and Shape of Instrumental Line Profiles in High-Resolution Powder Diffraction. J. Appl. Phys. 1991, 24, 913–919. [Google Scholar] [CrossRef]
  37. Terlan, B.; Levin, A.A.; Börrnert, F.; Simon, F.; Oschatz, M.; Schmidt, M.; Cardoso-Gil, R.; Lorenz, T.; Baburin, I.A.; Joswig, J.-O.; et al. Effect of Surface Properties on the Microstructure, Thermal, and Colloidal Stability of VB2 Nanoparticles. Chem. Mater. 2015, 27, 5106–5115. [Google Scholar] [CrossRef]
  38. Terlan, B.; Levin, A.A.; Börrnert, F.; Zeisner, J.; Kataev, V.; Schmidt, M.; Eychmüller, A. A Size-Dependent Analysis of the Structural, Surface, Colloidal, and Thermal Properties of Ti1−xB2 (x = 0.03–0.08) Nanoparticles. Eur. J. Inorg. Chem. 2016, 6, 3460–3468. [Google Scholar] [CrossRef]
  39. Rehani, B.R.; Joshi, P.B.; Lad, K.N.; Pratap, A. Crystallite size estimation of elemental and composite silver nano-powders using XRD principles. Indian J. Pure Appl. Phys. 2006, 44, 157–161. [Google Scholar]
  40. Scherrer, P. Bestimmung der Grösse und der inneren Struktur von Kolloidteilchen mittels Röntgenstrahlen. Nachr. Königl. Ges. Wiss. Göttingen. 1918, 26, 98–100. [Google Scholar]
  41. Stokes, A.R.; Wilson, A.J.C. The diffraction of X-rays by distorted crystal aggregates. Proc. Phys. Soc. Lond. 1944, 56, 174–181. [Google Scholar] [CrossRef]
  42. Le Bail, A.; Duroy, H.; Fourquet, J.L. Ab-initio structure determination of LiSbWO6 by X-ray powder diffraction. Mat. Res. Bull. 1988, 23, 447–452. [Google Scholar] [CrossRef]
  43. TOPAS Version 5; Technical reference; Brucker AXS: Karlsruhe, Germany, 2014.
  44. Coelho, A.A. TOPAS and TOPAS-Academic: An optimization program integrating computer algebra and crystallographic objects written in C++. J. Appl. Cryst. 2018, 51, 210–218. [Google Scholar] [CrossRef] [Green Version]
  45. Cheary, R.W.; Coelho, A.A. A fundamental parameters approach to X-ray line-profile fitting. J. Appl. Cryst. 1992, 25, 109–121. [Google Scholar] [CrossRef]
  46. Berger, H. Study of the K alpha emission spectrum of copper. X-ray Spectrom. 1986, 15, 241–243. [Google Scholar] [CrossRef]
  47. Hill, R.J.; Fischer, R.X. Profile Agreement Indices in Rietveld and Pattern-Fitting Analysis. J. Appl. Cryst. 1990, 23, 462–468. [Google Scholar] [CrossRef]
  48. Levin, A.A.; Filatov, S.K.; Paufler, P.; Bubnova, R.S.; Krzhizhanovskaya, M.; Meyer, D.C. Temperature-dependent evolution of RbBSi2O6 glass into crystalline Rb-boroleucite according to X-ray diffraction data. Z. Kristallogr. Cryst. Mater. 2013, 228, 259–270. [Google Scholar] [CrossRef]
  49. Bérar, J.-F.; Lelann, P.J. ESD’s and estimated probable error obtained in Rietveld refinements with local correlations. J. Appl. Cryst. 1991, 2, 1–5. [Google Scholar] [CrossRef]
  50. Langford, J.I.; Delhez, A.R.; de Keijser, T.H.; Mittemeijer, E.J. Profile Analysis for Microcrystalline Properties by the Fourier and Other Method. Aust. J. Phys. 1988, 41, 173–187. [Google Scholar] [CrossRef] [Green Version]
  51. Balzar, D. Voigt-function model in diffraction line-broadening analysis. In Defect and Microstructure Analysis by Diffraction; Snyder, R.L., Fiala, J., Bunge, H.J., Eds.; IUCr, Oxford Uni, Press: Oxford, UK, 1999; pp. 94–126. [Google Scholar]
  52. Momma, K.; Izumi, F. VESTA 3 for three-dimensional visualization of crystal, volumetric and morphology data. J. Appl. Cryst. 2011, 44, 1272–1276. [Google Scholar] [CrossRef]
  53. Van der Bruggen, B.; Schaep, J.; Wilms, D.; Vandecasteele, C. Influence of molecular size, polarity and charge on the retention of organic molecules by nanofiltration. J. Membr. Sci. 1999, 156, 29–41. [Google Scholar] [CrossRef]
  54. Nadykto, A.B.; Yu, F. Uptake of neutral polar vapor molecules by charged clusters/particles: Enhancement due to dipole-charge interaction. J. Geophys. Res. 2003, 108, 4717. [Google Scholar] [CrossRef] [Green Version]
  55. Table of experimental nuclear ground state charge radii: An update. At. Data Nucl. Data Tables 2013, 99, 69–95. [CrossRef]
  56. Xiangli, F.; Chen, Y.; Jin, W.; Xu, N. Polydimethylsiloxane (PDMS)/Ceramic Composite Membrane with High Flux for Pervaporation of Ethanol-Water Mixtures. Ind. Eng. Chem. Res. 2007, 46, 2224–2230. [Google Scholar] [CrossRef]
  57. Kolmogorov, A.N. K statisticheskoi teorii kristallizacii metallov [To the statistical theory of the crystallization of metals]. Izv. Akad. Nauk SSSR Ser. Mat. 1937, 1, 355–359. (In Russian) [Google Scholar]
  58. Avrami, M. Kinetics of Phase Change. J. Chem. Phys. 1939, 7, 1103. [Google Scholar] [CrossRef]
  59. Ishibashi, Y.; Takagi, Y. Note on ferroelectric domain switching. J. Phys. Soc. Jpn. 1971, 31, 506–510. [Google Scholar] [CrossRef]
  60. Merz, W.J. Domain formation and domain wall motions in ferroelectric BaTiO3 single crystals. Phys. Rev. 1954, 95, 690–698. [Google Scholar] [CrossRef]
  61. Svinarev, F.B.; Balashova, E.V.; Pankova, G.A.; Krichevtsov, B.B. Polarization switching in single crystals and films of 2-methylbenzimidazole. J. Phys. Conf. Ser. 2018, 1038, 012117. [Google Scholar] [CrossRef] [Green Version]
  62. Janta, J. The influence of the shape of domains on the ferroelectric hysteresis loop. Ferroelectrics 1971, 2, 299–302. [Google Scholar] [CrossRef]
  63. Nakatani, N. The dependence of the coercive field of tri-glycine sulfate on frequency, amplitude and temperature. J. Phys. Soc. Jpn. 1972, 32, 1556–1559. [Google Scholar] [CrossRef]
  64. Dontsova, L.I.; Popov, E.S.; Shil’nikov, A.V.; Bulatova, L.G.; Tikhomirova, N.A.; Shuvalov, L.A. Influence of temperature changes on the domain structure and surface energy density of domain walls in triglycine sulfate crystals. Kristallografiya 1981, 26, 758. (In Russian) [Google Scholar]
  65. Tikhomirova, N.A.; Pikin, S.A.; Shuvalov, L.A.; Dontsova, L.I.; Popov, E.S.; Shilnikov, A.V.; Balatova, L.G. Visualization of static and dynamics of domain structure in triglycine sulfate by liquid crystals. Ferroelectrics 1980, 29, 145. [Google Scholar] [CrossRef]
  66. Savage, A.; Miller, R.C. Temperature Dependence of the Velocity of Sidewise 180° Domain-Wall Motion in BaTiO3. J. Appl. Phys. 1960, 31, 1546–1549. [Google Scholar] [CrossRef]
  67. Hatano, J.; Suda, F.; Futama, H. Domain-Wall Orientations and Domain Shapes of Ferroelectric TGS and TGSe Crystals. Ferroelectrics 1978, 20, 265–266. [Google Scholar] [CrossRef]
  68. Tybell, T.; Paruch, P.; Giamarchi, T.; Triscone, J.-M. Domain Wall Creep in Epitaxial Ferroelectric PbZr0.2Ti0.8O3 Thin Films. Phys. Rev. Lett. 2002, 89, 097601. [Google Scholar] [CrossRef] [PubMed] [Green Version]
  69. Hu, W.J.; Juo, D.-M.; You, L.; Wang, J.; Chen, Y.C.; Chu, Y.H.; Wu, T. Universal Ferroelectric Switching Dynamics of Vinylidene Fluoride-trifluoroethylene Copolymer Films. Sci. Rep. 2013, 4, 4772. [Google Scholar] [CrossRef] [Green Version]
  70. Miller, R.C.; Weinreich, G. Mechanism for the sidewise motion of 180° domain walls in barium titanate. Phys Rev. 1960, 117, 1460–1466. [Google Scholar] [CrossRef]
Figure 1. Photographs of MBI crystals grown from a d-acetone solution (a) and a gas phase (b).
Crystals 11 01278 g001
Figure 2. Raman spectra of MBI crystals grown from acetone, d-acetone, and ethanol. For convenience Raman spectra for different samples are shifted along the vertical axis. Panels (a) and (b) show different frequency ranges.
Crystals 11 01278 g002
Figure 3. XRD patterns of MBIet and MBIac (a) and MBId-ac and MBIgas (b) powder samples in vicinity of hkl = 002 reflection, normalized and shifted to the same 2θ Bragg angle position. Contributions of background and Cu-2 radiation are corrected.
Crystals 11 01278 g003
Figure 4. The final graphical results of LB fitting of the XRD patterns of powder MBIac samples (model ‘2 phases’ in Table 3 and Supplementary Materials, Table S2). The Miller indices hkl of some selected reflections are shown. Theoretical Bragg angular positions of the reflections of the crystalline phases MBI1ac and MBI2ac (‘1a’ and ‘2a’ in the Figure 4), calculated from the refined parameters of their unit cells, are shown by vertical bars. The experimental (Iexp), calculated (Icalc) and difference (Idiff = IexpIcalc) XRD diagrams are represented by lines of different styles and colors.
Crystals 11 01278 g004
Figure 5. Simulation of XRD pattern in vicinity of reflection 002 in MBIet (a), MBIac (b), MBId-ac (c), and MBIgas (d), fitted using LB technique in the frame of three-phase model for MBIet and two-phase model for other samples. Background contribution is subtracted. The estimated weight content is shown.
Crystals 11 01278 g005
Figure 6. MBI structure according to XRD structure data of Ref. [33] in projection on (100)tetr (a) and (001)tetr (b) crystallographic planes. Sorts of atoms (C, N, H) are indicated. The indicated distances shown by numbers are equal (1) 0.537 nm, (2) 0.406 nm, (3) 0.491 nm, (4) 0.520 nm, (5) 0.525 nm, (6) 0.536 nm, (7) 0.402 nm, (8) 0.442 nm, (9) 0.504 nm, (10) 0.476 nm and (11) 0.539 nm. Schematic representation of changes in the MBI lattice along c axis under incorporation of an ethanol molecule between layers (c,d).
Crystals 11 01278 g006
Figure 7. Dielectric hysteresis loops of MBI crystals grown from (a) ethanol (f = 50 Hz) for different values of the electric field amplitudes Em = 4.15, 3.46, 2.78, 2.40, 2.02, 1.59 V/μm and (b) d-acetone (f = 60 Hz) for Em = 5.38, 4.63, 4.02, 3.54, 2.38, 1.98 V/μm.
Crystals 11 01278 g007
Figure 8. Room-temperature dependence of the remnant polarization Prem on the amplitude of the electric field Em (a) in MBIet (f = 50 Hz) and MBId-ac (f = 60 Hz) and (b) in MBId-ac for different frequencies f of the electric field. Lines in (a) and (b) correspond to theoretical calculations (see text). In (a) the curves 1 and 2 correspond to account for one characteristic frequency: f0 = 6.25 kHz for MBIet, and f0 = 62.5 kHz for MBId-ac, respectively. The curve 3 corresponds to accounts of two characteristic frequencies: f0 = 6.25 kHz and f0 = 62.5 kHz for MBId-ac.
Crystals 11 01278 g008
Figure 9. Experimental (bold lines) and calculated (thin dashed lines) dependences of polarization P on electric field E for various values of the electric field amplitude at a frequency f = 50 Hz in MBIet (a) and at a frequency f = 60 Hz in MBId-ac (b); calculation parameters: Ea = 11.2 V/μm and f0 = 6.25 kHz for MBIet (a) and Ea = 24 V/μm and f0 = 62.5 kHz for MBId-ac (b).
Crystals 11 01278 g009
Figure 10. (a) Experimental (bold lines) and calculated (thin dashed lines) P(E) dependencies for different field amplitudes (Ea = 24 V/μm, f = 60 Hz) for MBId-ac. Calculations were carried out taking into account P1 and P2 contributions to polarization with characteristic frequencies f01 = 62.5 kHz and f02 = 6.25 kHz, correspondingly. (b) Experimental P(E) dependence at an amplitude Em = 5.28 V/μm in MBId-ac (red solid line) and calculated P1 and P2 contributions to polarization. Contribution of P1 (blue dotted line), and P2 (green dash-dotted line) are shown taking into account the weighting factor. The total P (cyan dashed line) is calculated in accordance with expression (3).
Crystals 11 01278 g010
Table 1. Raman shifts ν in cm−1 for lines observed in MBIet, MBIac and MBId-ac samples. Last column shows interpretation of lines for MBI from [19,32]. Abbreviations: vs—very strong, s—strong, m—medium, w—weak, b—broad, Γ—out-of-plane bending, δ—in-plane bending, ν—stretching, M—methyl group.
No.MBIetMBIacMBId-acAssignment [19,32]
13065m, 3075m3065m, 3077m3066s, 3077sνCH
22968m2970m2970mCH
32919m, 2929m2919m, 2929m2921mCH
41589m1591m1591sνCC
51545s1546s1547sνCN (double bond) + νCC
61472w, 1488m1483m, 1493m1483w, 1491wCH2 + ΓCCCN + δCCH
71438m, 1452s1440w, 1453s1440m, 1454mδCCH + νCC
81418m, 1425w1420m, 1425m1420m, 1424mδCNH + νCN + νCC + δCCH
101388m1389w1390wCH2 + δCCH
111363m1365m1364mνCC + νCN + MδCH2
121322m1322m1323mδCCH + νCN
131272s1274s, 1279sh1274s, 1279shνCN + νCC + δCCH
141222m1223m1223mδCCH + νCN + νCC
151155m1155m1155mδCCH
161113m, 1120m1113m1113mδCCH + νCC
171044m1045m1046sδCCH + ΓNCCH
181030s1031s1031sνCC + νCN
191004s1006s1005sνCC + δCCH
20960w963w962wΓHCCH + ΓCCCH
21921w 921wΓHCCH + ΓCCCH
22893m894w894wδCCC + δCCH
23868m872w871wΓCCCHHCCN + ΓHCCH+ ΓCCCH
24839s840w841sνCC
25764w 765wΓCCCH + ΓCCCC
26741m742m742mΓCCCH + ΓHCCN
27677s678s677sνCC + δCCC+ δCCN
28657m660m659sΓCNCN + ΓHCCN + ΓCCCN + ΓHNCN
29623w, 628m623w, 628w623m, 628mδCCN + δCCC + νCC
30582s584m584mΓCCCC + ΓCCCN + ΓCCCH
31499s501s501sδCCC + νCC + νCN
32483m485m485mδCCN + δCCC + νCC
33435m436m436mΓCCCC + ΓCCCH + ΓCCNH + ΓCCNC
34329w, 334m330m, 334m330w, 335wΓCCCN + ΓCCNH
35274m283w277w,281wδCCN
36123vs123vs123vsΓCCCN + ΓHCCN, lattice modes?
Table 2. The parameters of the structure (parameters a and c of the tetragonal unit cell) and the microstructure (the mean size D of the crystallites and the absolute mean value εs of the microstrain in them) of the MBI phases obtained from XRD data using the Celsiz (a and c) and SizeCr (D and εs by means of the SSP method) programs. During the measurements, the ambient temperature in the sample chamber was Tmeas = 314 (1) K.
ProgramCelsizSizeCr
WHPSSP
Phasea, Å
c, Å
Vcell, Å3D, nm
εs, %
D, nm
εs, %
MBI from [33] (CCDC code 1199885, Tmeas = 295 K)
MBI13.950(9)
7.192(3)
1399.6(1.4)--
MBI grown in ethanol (MBIet), 3 phases
MBI1et13.958(3)
7.202(2)
1403.1(6)86(23)
0
96(10)
0.10(3)
MBI2et14.056(10)
7.252(5)
1432.8(1.7)44(12)
0
44(12)
0
MBI3et14.002(6)
7.223(3)
1416.1(1.0)53(11)
0
68(7)
0.17(4)
MBI grown in acetone (MBIac), 2 phases
MBI1ac13.939(4)
7.198(3)
1398.5(8)73(13)
0
84(2)
0.08(1)
MBI2ac13.961(5)
7.209(4)
1405.1(1.1)57(5)
0
57(5)
0
MBI grown in d-acetone (MBId-ac), 2 phases
MBI1d-ac13.963(2)
7.201(1)
1403.9(3)103(31)
0
107(8)
0.06(3)
MBI2d-ac13.975(2)
7.208(1)
1407.7(5)79(22)
0
79(22)
0
MBI grown from gas (MBIgas), 2 phases
MBI1gas13.950(4)
7.199(3)
1401.1(8)61(16)
0
79(5)
0.12(2)
MBI2gas13.973(5)
7.211(3)
1408.1(9)56(12)
0
62(2)
0.09(1)
Table 3. Results of fitting diffraction patterns by the LB method using the TOPAS program (During the measurements, the ambient temperature in the sample chamber was Tmeas = 314(1) K).
TOPAS, LB Method
PhaseWt, wt.%
Vcell, Å3
a, Å
c, Å
Lvol−FWHM, nm
e, % a
Rwp, % b
Rp, %
cRwp, % b
cRp, %
RB, % b
MBI from Ref. [33] (CCDC code 1199885, Tmeas = 295 K)
MBI100
1399.6(1.4)
13.950(9)
7.192(3)
-
-
5.2 c-
-
5.9 c
MBI grown in ethanol (MBIet), 3 phases, me.s.d.= 2.964 d
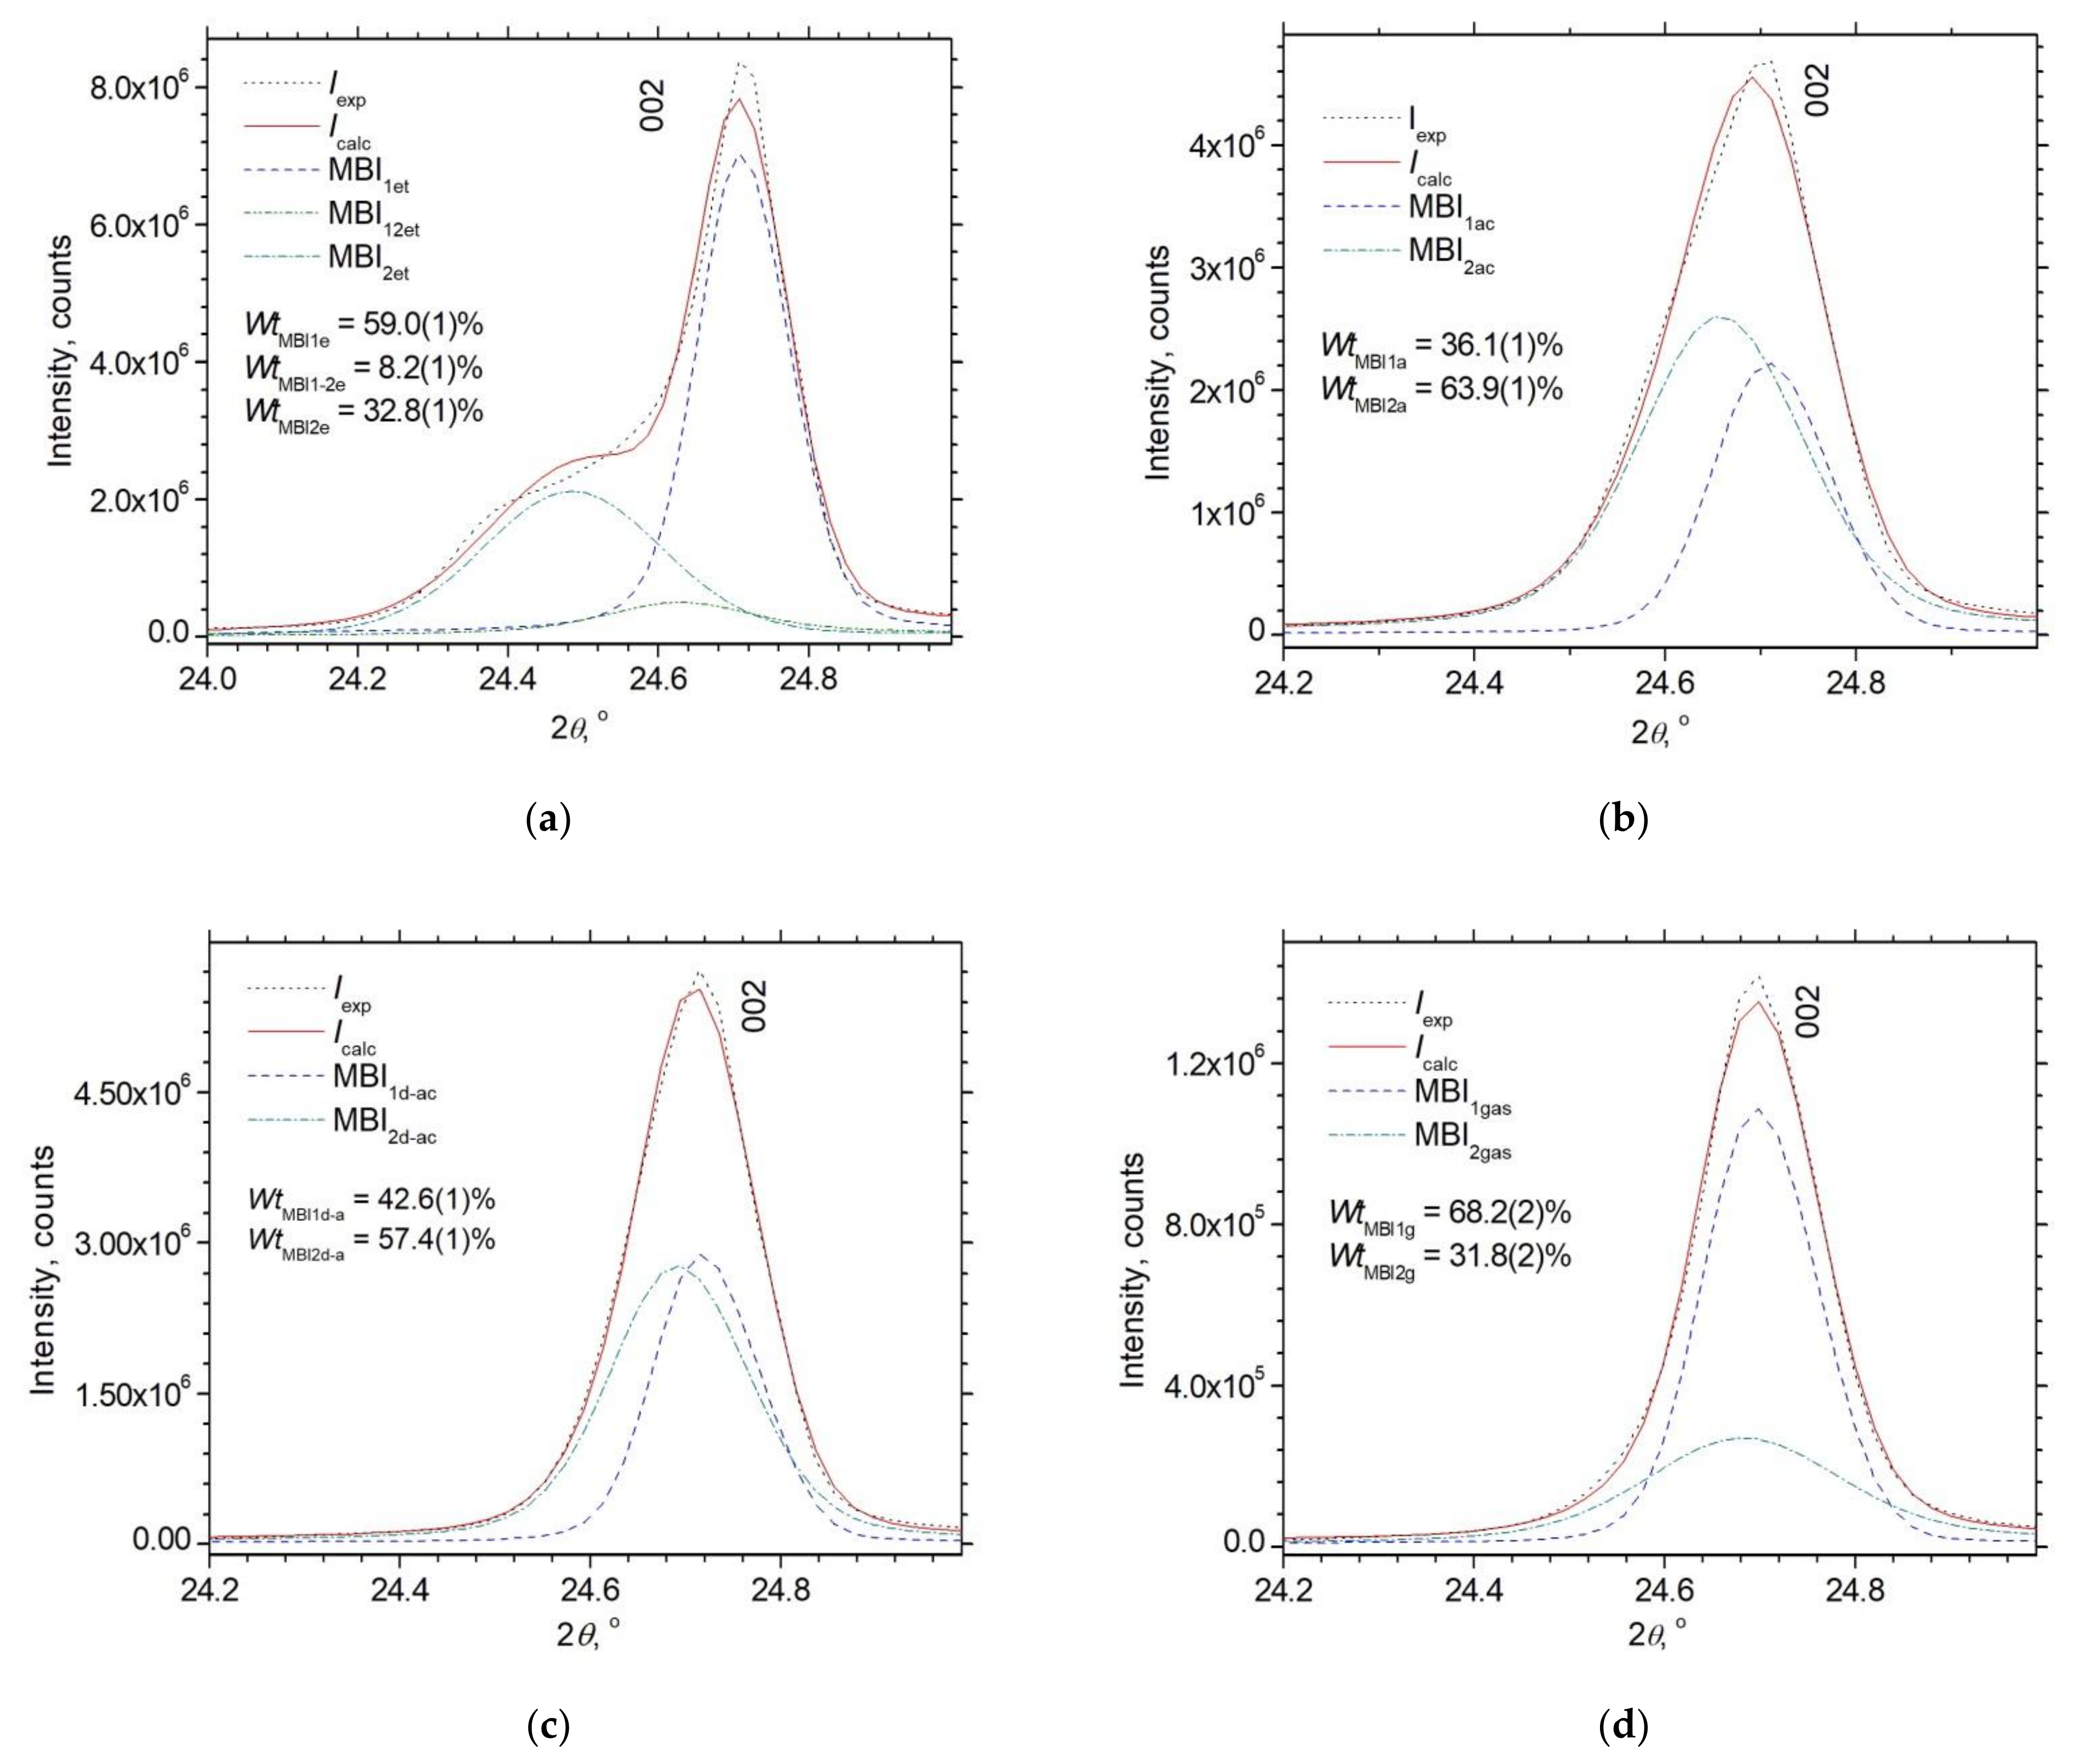
MBI1et59.0(1)
1399.8(1)
13.949(1)
7.1944(2)
112.3(9)
0.055(1)
6.36
4.49
7.52
5.63
0.25
MBI2et 32.8(1)
1437.2(3)
14.070(2)
7.2601(4)
33.0(2)
0.003 (2)
0.25
MBI3et8.2(1)
1415.1(3)
14.001(2)
7.2187(9)
68(2)
0.111(4)
0.27
MBI grown in acetone (MBIac), 2 phases, me.s.d.= 3.637 d
MBI1ac36.1(1)
1399.3(2)
13.943(1)
7.1980(3)
90(2)
0.035(5)
4.29
2.93
7.20
6.53
0.26
MBI2ac63.9(1)
1407.9(1)
13.971(1)
7.2132(2)
50.2(4)
0.000(3)
0.23
MBI grown in d-acetone (MBIdac), 2 phases, me.s.d.= 2.911 d
MBI1d-ac42.6(1)
1403.4(1)
13.9600(5)
7.2013(2)
113.1(7)
0.027(5)
5.81
3.36
9.69
7.61
0.48
MBI2d-ac57.4(1)
1409.3(3)
13.981(2)
7.2096(2)
63.7(4)
0.000(9)
0.16
MBI grown from gas, 2 phases (MBIgas), me.s.d.= 4.000 d
MBI1gas68.2(2)
1401.4(3)
13.950(2)
7.2017(2)
86(2)
0.0(3)
6.36
3.95
8.43
5.85
0.34
MBI2gas31.8(2)
1405.7(2)
13.966(1)
7.2068(4)
51.9(7)
0.09(1)
0.38
a The value of the dimensionless microstrain parameter e0, obtained by refinement using TOPAS (version 5), is converted into a percentage as e = e0∙100%. Lvol-FWHM is the mean value of the crystallite size refined by TOPAS. b Agreement factors of Rietveld analysis (see definition in [47]). Rwp and Rp are weighted profile and profile agreement factors, respectively; cRwp and cRp are their background-corrected analogues; RB is Bragg agreement factor.c Weighted reliability factor Rw and residual factor RF of single crystal structure analysis for 633 reflections with I > 3σ(I). d The estimated standard deviations (e.s.d.s) of the parameters shown in the Table 3 are corrected for underestimation due to serial correlations by multiplying the e.s.d.s of the parameters obtained after LB refinement by the coefficient me.s.d. calculated using the Rietesd program [48] according to the procedure described in Ref. [49].
Table 4. Relative difference of the unit cell volume between the phases of the MBI samples according to results of the LB fitting for two-phase model (three phase model for MBIet sample) summarized in Table 3.
SamplePhase1Phase2ΔVcell/Vcell_Phase1 (%)
MBIgasMBI1gasMBI2gas0.31(3)
MBIdacMBI1d-acMBI2d-ac0.42(2)
MBIacMBI1acMBI2ac0.61(1)
MBIetMBI1etMBI2et2.67(2)
MBIetMBI1etMBI3et1.09(2)
Publisher’s Note: MDPI stays neutral with regard to jurisdictional claims in published maps and institutional affiliations.

