Ex-Situ Synthesis and Study of Nanosized Mo-Containing Catalyst for Petroleum Residue Hydro-Conversion


A.V. Topchiev Institute of Petrochemical Synthesis, Russian Academy of Sciences (TIPS RAS), 119991 Moscow, Russia
*
Author to whom correspondence should be addressed.
Catalysts 2019, 9(8), 649; https://doi.org/10.3390/catal9080649
Submission received: 14 June 2019
/
Revised: 23 July 2019
/
Accepted: 25 July 2019
/
Published: 29 July 2019
(This article belongs to the Special Issue Heavy Oil In Situ Upgrading and Catalysis)
Abstract
:This study represents the results of ex-situ synthesis and research of the properties of concentrated suspensions with new catalysts for petroleum residue hydro-conversion. Suspensions were prepared and stabilized in a petroleum residue medium through reverse emulsions containing water-soluble Mo-precursor and S-containing agents (elemental sulfur, thiocarbamide) in the absence of a solid carrier. The resulting ex-situ catalyst dispersions had Mo content of 6–10 wt % and contained nanosized and submicron catalyst particles stabilized in a petroleum residue medium. The effects of S-containing agents on the properties of catalytic particles (sulfidation level, dispersity, structural and morphological features) were studied. The synthesis conditions for the optimal ex-situ catalyst providing the lowest coke yield (0.2 wt %) and the highest conversion (55.5 wt %) during petroleum residue hydro-conversion in a single pass mode have been determined.
1. Introduction
The processes of hydro-treatment of heavy oil and petroleum residues in the presence of nanosized and ultra-dispersed catalysts without conventional solid carriers in the catalytic system have been actively studied in recent years due to the depletion of light and medium oil reserves and have shown high efficiency [1,2,3,4,5,6,7].
Increased activity and stability of new catalysts (compared to traditional ones) to deactivation by high-molecular feed components allow complete conversion of heavy oil and petroleum residues producing lighter hydrocarbons including motor fuel components and feed for petroleum chemistry. Currently, several hydrogenation processes using highly dispersed catalysts with the stated conversion efficiency of heavy oil feed (estimated by the residue conversion level 500 °C) over 90% are at the stage of pilot testing or introduction to the industrial scale. They include Russian Slurry Hydro-Conversion process (RSH) based on the TIPS RAS technology with suspended catalyst nanoparticles [1,8], Eni’s EST technology [3], HTI’s HCAT [9], Chevron’s LC-slurry [10], and PVDSA-Intevep’s HDH Plus [10].
Properties of the catalysts and their controlled synthesis are of paramount importance since attainability of conversion depends on them. This study is devoted to assessing the effect of the S-containing agent on the properties of catalyst suspensions stabilized in petroleum residue medium and prepared for further application in petroleum residue hydro-conversion.
Hydro-conversion technology was traditionally based on a catalyst synthesized in-situ in a hydro-conversion reactor in the form of nanosized metal sulfide particles [1]. Catalyst particles are formed by thermochemical decomposition and sulfidation of the precursor in the “aqueous precursor solution—heavy oil feed” system (reverse emulsion). Water-soluble salts, particularly ammonium paramolybdate (APM), are used as a precursor in this catalyst preparation method. Water-soluble precursors are generally produced in large volumes and have a relatively low cost compared to alternative oil-soluble precursors used in other hydro-conversion processes [11]. In-situ formation of the active catalyst requires hydrogen sulfide, formed during the destruction of sulfur-containing feed components. As a rule, active nanosized Mo-containing catalyst in a sulfide form can be produced in-situ in a hydrogenation reactor under severe conditions (high temperature, high pressure, and sufficient reaction time) during hydrogenation processing of high-sulfur feedstock (with a sulfur content over 3%) [12,13,14]. Practically, it is often necessary to process low-sulfur petroleum residues, such as the atmospheric residue of gas condensate, shale residue, polymer wastes, biomass, etc. [15]. In this case, it is required to use an ex-situ prepared suspension of an active nanosized catalyst. The synthesis process and study of such catalysts is the subject of this work. The ex-situ synthesized hydro-conversion catalysts should be concentrated in terms of an active catalytic phase, which is stable, and able to accelerate and simplify the introduction of the catalyst to the process. They should not require preliminary sulfidation and additional measures for activation. Regenerability of the catalyst precursor is also highly important.
In this study, the problem of ex-situ synthesis of a dispersed catalyst with MoS2 nanoparticles is solved using reverse emulsions. The continuous phase was represented by petroleum residue with a high content of asphaltenes. This approach has been proven to be efficient in preparing dispersions with ultrafine and nanosized particles of metal oxides or sulfides in dilute suspensions (metal content <0.1 wt % for hydrocarbon phase) [6,16,17] and at a relatively high concentration of stable nanoparticles in the final dispersions (up to 10 wt %) [18,19].
The development of ex-situ methods for preparing catalyst suspensions with active nanoparticles stabilized in the absence of conventional solid carriers and their research can contribute to the science and become an essential step in studying catalytic effects and mechanism of heavy oil hydro-conversion in the presence of catalytic nanoparticles. The objectives of this study were to prepare and characterize a dispersion of nanosized MoS2 and to study the catalytic activity of the MoS2 dispersions in petroleum residue hydro-conversion.
2. Objects and Research Methods
2.1. Agents and Synthesis Process
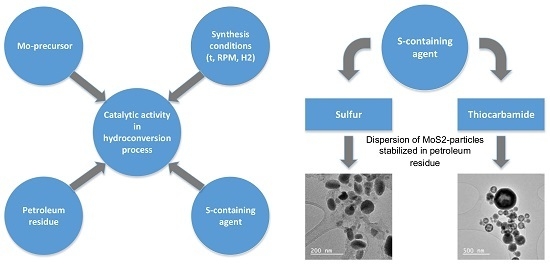
Suspensions of Mo-containing particles were prepared by the method based on reverse emulsions described in References [18,20]. Figure 1 shows a schematic diagram of the catalyst preparation procedure.
The continuous phase of reverse emulsion was represented by heavy petroleum fraction, boiling above 500 °C, prepared by vacuum distillation of heavy crude oil (hereinafter vacuum residue or VR). The properties of vacuum residue are shown in Table 1.
Ammonium paramolybdate (NH4)6Mo7O24 × 4H2O (99 wt % purity) was used as a precursor after dissolving in distilled water at 75 ° C under stirring.
S-containing agents—powdered elemental sulfur (S) (99 wt % purity) and thiocarbamide (TC) (CS(NH2)2) (99 wt % purity) were applied as precursors of H2S, which is required for molybdenum sulfide in this study. Unlike conventional sulfur-containing agents (dimethyl sulfide, dimethyl disulfide, dimethyl sulfoxide, etc.), elemental sulfur and thiocarbamide are non-volatile, non-toxic, and, moreover, available and not expensive. Elemental sulfur is known to be soluble in organic solvents [21], and thiocarbamide is soluble in water [22]. These properties allow the loading of S and TC into the reactionary system as a part of organic (for S) of aqueous (for TC) phase of reverse emulsion. Both agents are often used as a source of sulfur for sulfidation of Mo-containing precursors on a laboratory scale [22,23,24,25]. Formation of H2S in a hydrogen atmosphere occurs at a moderate temperature of ~120–200 °C [26,27] and 180 °C [28], for elemental sulfur and thiocarbamide, respectively.
Hereinafter, the following notation is used: Cat (S) is the catalyst dispersion synthesized using elemental sulfur and Cat (TC) is the catalyst dispersion synthesized using thiocarbamide.
Theoretical studies [19] have shown that, for the complete sulfide by the method used in this study, the ratio of the precursor and sulfide agent must be higher than S/Mo = 2.5 (molar), i.e., an excess of the sulfiding agent is required. Based on this and taking into account possible losses of hydrogen sulfide during the experiment, the loading of reagents was taken to provide S/Mo = 3.0 (molar). (NH4)6Mo7O24 concentration in the aqueous solution for the synthesis of Cat (S) and Cat (TC) was 25 and 32 wt %, respectively. Thiocarbamide was previously dissolved in (NH4)6Mo7O24 solution with the S/Mo molar ratio of 3 under constant stirring at 75 °C. After thiocarbamide dissolved, a color transition from colorless to blue was observed, which indicates that the chemical interaction between TC and ((NH4)6Mo7O24 occurs at the stage of emulsion preparation. Elemental sulfur was preliminary dissolved in the vacuum residue at t = 150 °C with vigorous stirring using an S/Mo molar ratio of 3.
Suspensions of Mo-containing particles were prepared by thermal treatments of reverse emulsions under conditions that ensure evaporation and water removal and provide decomposition and sulfidation of the precursor. The loading of vacuum residue in both synthesis experiments was 300 g. The aqueous phase to VR ratio in the initial emulsion was 0.4 and 0.6 in the synthesis of Cat (S) and Cat (TC), respectively. A mixture of the initial components at a certain ratio was homogenized at 75 °C and 10,000 rpm for 30 min. The resulting emulsion was loaded into the autoclave reactor.
Thermal treatment was conducted in batch mode in an autoclave in a hydrogen environment (0.5 nL/h) with constant stirring (500 rpm) in two stages. At the first stage, thermal treatment was conducted at 150 °C. At the second stage, thermal treatment was conducted at 350 °C. Each stage lasted 5 h. The synthesis temperature was limited to 350 °C in order to prevent thermal cracking of vacuum residue and preserve the stable dispersion state of nanoparticles, which was affected by the presence of thermally unstable native stabilizers in vacuum residue. A high temperature is required to accelerate sulfidation and reduce the time required to start this process.
The thermal treatment conditions and the ratio of components in reverse emulsions were selected based on previous studies [16,18,20].
The final suspensions of sulfide Mo-containing particles stabilized in the medium of vacuum residue after removing by-products (water and gaseous components (ammonia, hydrogen sulfide)) from the reaction medium looked like viscous, non-fluid, black compositions. Preparation and sampling for further studies were carried out in a fluid state after pre-heating the dispersions to 100 °C.
2.2. Research of Catalytic Activity in the Hydro-Conversion Process
Hydro-conversion tests in the presence of ex-situ synthesized sulfide molybdenum-containing catalysts were conducted in the flow mode using the pilot unit described in References [15,16] at constant parameters: temperature 425 °C, feed space velocity 0.4 and 1.4 h–1, pressure 7.0 MPa, and hydrogen/feed ratio 1500 nL/L. The feedstock was prepared by mixing the vacuum residue (94 wt %) and FCC gas oil (6 wt %) with a portion of ex-situ prepared MoS2 suspension. Mixing was conducted under conditions providing homogeneous distribution of the catalyst (temperature of 120 °C, high-shear mixing 15,000 rpm, and mixing time of 40 min). The content of the fraction boiling above 500 °C (hereinafter 500 °C+) in feedstock was 90.5 wt %. The starting feed mixture loaded in the reactor of the pilot unit was represented by the suspension, which contained original feedstock and dispersed MoS2 as the dispersion medium and the dispersed phase, respectively. The loading of ex-situ prepared MoS2 suspension corresponded to Mo content in final feedstock being 0.05 wt %. The catalyst activity was evaluated in terms of product distribution, 500 °C+ conversion per pass, which was determined by the content of the fraction 500 °C+ in liquid hydro-conversion products, and by the yield of coke formed and sedimented on the reactor walls. The object was to determine the synthesis conditions of the most active catalyst, which ensured the lowest coke yield with the highest 500 °C+ conversion per pass. To study the structure and properties of the catalyst removed from the reaction system as part of the hydro-conversion products, samples of toluene-insoluble components (TI) were used, which were isolated by filtration from the 500 °C+ fraction of hydro-conversion products.
To compare the catalytic activity, an experiment with in-situ synthesized molybdenum disulfide [15] was also carried out. In this case, the feedstock loaded to the pilot unit was represented by reverse emulsion. The dispersion medium and the dispersed phase of the emulsion in this experiment were represented by vacuum residue and aqueous solution of the catalyst precursor, respectively. The loading of (NH4)6Mo7O24 aqueous solution corresponded to molybdenum and water content in the final feedstock being 0.05 wt % and 2 wt %, respectively. The catalyst was sulfided in-situ in the reactor as a result of interacting with Mo-containing species with hydrogen sulfide formed during the thermal cracking of sulfur-containing components of vacuum residue in the hydrogen atmosphere.
2.3. Catalyst Characterization Methods
The average particle size for MoS2 dispersions was determined by dynamic light scattering (DLS) (N5 Submicron Particle Size Analyzer, Beckman Coulter) within a particle diameter of 3 to 3000 nm. The test samples of MoS2 dispersions were dissolved in toluene with a 1:8000 ratio (w/v) and homogenized. The measurements were taken at a scattered light angle of 90 °C, temperature of 20 °C, and the He-Ne laser (632.8 nm) used as a light source. DLS results included average particle diameter (D) and polydispersity index (PI). Depending on the values of |PI|, particle size distribution for a sample could be referred to as a monodisperse type (|PI| < 0.1) or a polydisperse type (|PI| > 0.3).
To study the structure and properties of particles of the dispersed phase, samples of toluene-insoluble components (Cat-TI) were separated from suspensions of Mo-containing particles in vacuum residue. The procedure for Cat-TI samples separation included diluting the dispersions with excessive toluene and centrifuging at 10,000 rpm for 5 h. During the centrifuging of diluted suspensions, Mo-containing particles precipitated almost quantitatively and formed a solid precipitate, which was extracted, dried in vacuum at 50 °C, and used for further physicochemical study.
The metal content in dispersions of Mo-containing particles in VR, powdered Cat-TI and TI was determined by flame atomic absorption spectroscopy (AAnalyst 400) with reproducibility (precision) < 5%. CHNS analysis was performed using the EuroEA3000 instrument. The standard deviation for a random component of the measurement error for CHNS analysis makes in case of C and S—0.3 wt %, and for H and N—0.1 wt %. According to the results of the analysis, the molar ratios of the elements to molybdenum were calculated, particularly S/Mo, which characterizes the molybdenum sulfiding level.
Raman spectroscopy analysis of TI-samples was performed on Senterra “Bruker” (wavelength 532 nm, power 2 mW, lens 50× (spot diameter ~3 μm), resolution 3 cm−1, and signal accumulation time—240).
The study of Cat-TI samples by X-ray photoelectron spectroscopy (XPS) was performed using an X-ray photoelectron spectrometer (PHI5500 VersaProbeII, ULVAC-PHI inc.). The samples were pressed into in-foil in a continuous layer. To initiate photoemission, monochromatic Al Kα radiation (hν = 1486.6 eV) with a power of 50 W was used. Areas of analysis with dimensions of 800 × 400 μm2 were formed by rasterizing the radiation beam. The beam diameter was 200 μm. Survey spectra were taken at analyzer transmission energy (Epass) of 117.4 eV with an interval of 1.0 eV. High resolution spectra were recorded at Epass = 23.5 eV with a step of 0.2 eV. The Mo3d and S2p spectra doublets were approximated using the nonlinear least squares method using the Gauss-Lorentz function. The error in estimating the relative intensity of an individual peak was ± 5% for intense lines and ± 10% for low-intensity lines. The absolute error in binding energy did not exceed 0.1 eV for the C1s and O1s spectra and, for the most intense peaks in the Mo3d and S2p spectra, and for low-intensity Mo3d and S2p lines, it can reach 0.3 eV. The spin-orbit splitting of the peaks (Δ) of the Mo3d doublet was fixed by a range of values between 3.13 and 3.15 eV. The ratio of the integral intensities of the peaks Mo3d3/Mo3d5 was 3:2. Δ of the doublet S2p was 1.18 eV. The ratio of the integral intensities of the peaks S2p3/S2p1 was 1:2. The scale of the binding energy of the device was calibrated by the lines Au4f - 84.0 eV and Cu2p3—932.6 eV. Atomic concentrations were determined from common spectra by relative elemental sensitivity factors, using the integral intensities of the following lines: C1s, O1s, S2p, and Mo3p3. The error in the calculation of total concentrations by this methos was within 0.4% (atomic).
X-ray powder diffraction (XRD) studies were performed with Rigaku Rotaflex RU-200 X-ray instrument with a rotating anode equipped with a wide-angle horizontal goniometer D/Max-B. The ICDD PDF-2 diffraction database was used as a reference for phase analysis.
Transmission electron microscopy (TEM), scanning electron microscopy (HAADF STEM), and energy dispersive analysis were performed with the Tecnai G230ST instrument at an accelerating voltage of 300 kV. Samples were prepared by soaking a carbon-coated copper grid in a solution containing TI-samples dispersed in acetone.
Table 2 shows the analysis results for the dispersions of Mo-containing particles in vacuum residue, prepared using different S-containing agents.
3. Results and Discussion
3.1. Study of Ex-Situ Catalyst Characteristics
3.1.1. Dynamic Light Scattering (DLS)
Cat (S) and Cat (TC) dispersions are characterized by an average particle diameter of 209 and 223 nm, respectively (Table 2). The values of polydispersity index (PI) being higher than 0.1 characterize these samples as polydisperse systems. The particle size distribution (Figure 2) showed that the samples are characterized by a wide particle sizes spread compared to the average size. In particular, for Cat (S), the particle sizes range from 40 to 920 nm, and for Cat (TC), the particle sizes range from 40 to 1140 nm, i.e., the dispersed phase in the samples is represented by particles in a nanometer and a submicron range. The DLS method has several drawbacks. In particular, it requires the excessive dilution of the initial samples by transparent solvents. As a result, the stability of nanoparticles may be disrupted due to dissolution of a protective stabilizing layer and aggregation of particles forming clusters with a size increase. Other drawback of the DLS method is connected with a small resolution limited in polydisperse systems with ~0.1 microns in size [29]. Therefore, in order to provide higher accuracy in determining the sizes of Mo-containing particles, Cat-TI samples isolated from catalyst dispersions were further investigated by transmission electron microscopy.
3.1.2. Transmission Electron Microscopy (TEM)
Figure 3 and Figure 4 show TEM images of Cat (S)-TI and Cat (TC)-TI samples. The Cat (S)-TI sample (Figure 3) contains spherical and elongated rounded particles distributed over a carbon-containing “matrix.” Since molybdenum atoms are significantly heavier than carbon atoms, the Mo-containing particles on the images look darker than the carbon-containing “matrix.” The average cluster size of Mo-containing particles calculated from the general images (Figure 3a,b) was 80 nm. At a higher magnification, it can be seen (Figure 3c) that, in clusters, Mo-containing particles have a layered structure. The distance between the layers was ~0.63 nm, which is characteristic of MoS2 [1,18,19,30]. At a higher magnification, it is also seen (Figure 3c,d) that monolayer particles are concentrated in the form of disoriented dark slabs with a thickness of less than 1 nm around spherical and elongated rounded clusters of particles. Most monolayer particles had an average length of 8 nm. Multilayered packets containing two to four layers with the length up to 15 nm were rarely observed.
Figure 4 shows TEM images of the Cat (TC)-TI sample, from which it is clear that more contrasting clusters of Mo-containing particles distributed in a translucent carbon-containing “matrix” have a perfect spherical shape with an average diameter of 120 nm. In the pictures of the general view (Figure 4a,b) and at high resolution (Figure 4c), the volume of the spheres has a clear contrast, which indicates the hollow internal structure of most spherical particles. The walls of hollow spheres had a thickness of 20 to 50 nm and a layered structure, with the distance between the layers of 0.61 to 0.65 nm, which may correspond to MoS2 and Mo3S4 phases (interplanar distance for the (002) MoS2 plane—6.15Å, for the Mo3S4 phase, the interplanar distance for (101) plane—6.4 Å). Hollow particles tended to split, which formed multi-layered elongated particles with three to 12 layers and a length along the layer of 8 to 40 nm (Figure 4g).
Formation of hollow spherical particles and their destruction in the Cat (TC)-TI sample is most likely due to the emission of gaseous ammonia and hydrogen sulfide from the core of the precursor particle toward the surface. Release of ammonia during the synthesis may be explained by decomposition of TC, which was dissolved in the aqueous phase of reverse emulsion with (NH4)6Mo7O24 and, subsequently, crystallized after water evaporation [28]. The reason for the release of hydrogen sulfide from the volume of the solid precursor particle could be the formation of a sulfide form of the precursor—ammonium thiomolybdate ((NH4)2MoS4), which decomposes to MoS2 with the formation of hydrogen sulfide [31].
3.1.3. Scanning Transmission Electron Microscopy and Energy Dispersive Analysis (HAADF STEM), Elemental Mapping
The results of HAADF STEM and elemental mapping of TI samples are shown in Figure 5 and Figure 6. It can be seen that the particles in the Cat (S) -TI sample contain mainly Mo, S, and O. Carbon is localized in the volume of the “matrix” (Figure 5). The geography of the elements’ distribution shows that S in Mo-containing particles is concentrated mainly on the periphery of the particles, and higher concentrations of O are observed in the core of the particles. Formation of the sulfide phase in this sample apparently began at the outer boundary of O-containing particles, and then, as O is replaced in the precursor crystal lattice, the process moved to the center of particles. In the case of incomplete sulfidation by this mechanism, the residual O is most likely localized in the core of the particles, as noted for Cat (S)-TI (Figure 5).
In the Cat (TC)-TI sample, whole and hollow spherical particles contain Mo, S, O, and N. Carbon was localized in the volume of “matrix” (Figure 6). In general, according to the geography of distribution along the volume of spherical particles, a higher concentration of S was observed closer to the core of whole particles, while O and N were much more dispersed and had lower concentrations compared to S. As was assumed above, formation of MoS2 during the Cat (TC) synthesis was preceded by the formation of a sulfur-containing precursor (NH4)2MoS4. When solid (NH4)2MoS4 particles are decomposed, the decomposition rate is higher at the outer boundary next to the dispersion medium heated up to the decomposition temperature. As the outer layers transform, the process moves to the particle core. Hydrogen sulfide formed during the decomposition of (NH4)2MoS4 is released and transferred from the deep layers of the particle to the outer layers. As a result, some particles have a hollow and split structure. In the case of incomplete decomposition of solid (NH4)2MoS4 particles by this mechanism, it can be assumed that S concentration will be higher in the particle core, as noted for Cat (TC)-TI (Figure 6).
3.2. Elemental Analysis
According to the atomic absorption spectrometry (AAS) results, Mo content in VR-based Cat (S) and Cat (TC) dispersions was 6.0 and 10.2 wt %, respectively (Table 2). The presence of other metals (V, Ni, Fe, and Co) in the composition of samples is probably due to native organometallic components of the vacuum residue.
Cat (S)-TI and Cat (TC)-TI samples, according to AAS and CHNS analysis consisted of Mo, S, C, H, and N. The N content was the lowest—0.3 and 1.0 wt % for Cat (S) and Cat (TC), respectively. The presence of N indicates that the solid disperse phase in Cat (S) and Cat (TC) contained residual amounts of initial N-containing reagents (TC, precursor). Calculated S/Mo values for Cat-TI samples were close to 2.0, which corresponds to the stoichiometric ratio of Mo and S in molybdenum disulfide. A high C content and a low H/C ratio indicate that C-containing components were present in Cat-TI samples.
The relatively high content of oxygen (Table 2) and O/Mo ratio for Cat (S)-TI (O/Mo = 3.2 (mol.)) is most likely due to incomplete sulfidation of Mo and the presence of a residual precursor. When elemental sulfur was used as an S-containing agent, incomplete sulfidation of Mo was achieved when compared to the synthesis with thiocarbamide.
3.2.1. Raman Spectroscopy
Figure 7 shows the Raman spectra for Cat-TI samples and for the commercial MoS2. Qualitatively, the spectra were identical. The spectra contained a triplet of signals, which was typically observed for standard MoS2 (380, 405, and 453 cm−1) [18]. The most intense maxima at 380 and 405 cm−1 corresponded to the E12g and A1g modes of hexagonal molybdenum disulfide [32]. The presence of the 453 cm−1 band is explained by the presence of oxidized molybdenum species, which could form during the analysis procedure [33].
Raman lines at 820 and 993 cm–1, being characteristic for Mo-oxide, were observed mainly for the Cat (S)-TI sample. Intensity of these bands was significantly lower when compared to MoS2-bands.
The most intense signals in the spectra (at ~1360 cm−1 and 1560 cm−1) correspond to D and G lines sp2-hydrocarbons in amorphous carbon or disordered graphite with a crystallite size of less than 0.5 µm [34,35]. The appearance of the D band in the graphite spectrum is connected with the appearance of defects in the crystal structure. Therefore, the ratio of the intensities of D and G peaks (ID/IG) serves as a quantitative characteristic of the degree of disordering of the crystallites in the graphite structure [35]. The ID/IG ratio is usually lower for very small crystallites (several nanometers) at a transition to the amorphous structure because the hexagonal structure sp2-carbon begins to disappear. The ID/IG ratio was 0.808 and 0.664 for Cat (S)-TI and Cat (TC)-TI, respectively. Thus, the lower values of ID/IG for Cat (TC)-TI may be due to the formation of more disordered structure of carbonaceous “matrix” in synthesis conditions.
3.2.2. X-ray Photoelectron Spectrometry
Elemental analysis showed that the surface of TI powders included Mo, S, O, and C. The data presented in Table 3 shows that the samples differ markedly by the content of O and C. The Cat (S)-TI sample has the lowest C content and the highest O/Mo value (4.8 (atomic)). The S/Mo atomic ratio correlates with the O/Mo atomic ratio: the higher is O/Mo, the lower is S/Mo. This interrelation of the O/Mo and S/Mo parameters shows that the sulfidation process proceeds by replacing O atoms with S in the crystal lattice of the Mo-containing compound.
Figure 8 and Figure 9 show the approximated high-resolution Mo3d and S2p spectra. The spectra of C1s and O1s were not approximated because the form of spectra did not imply an objective selection of individual components. The approximation results for Mo3d and S2p spectra, as well as binding energy for C1s and O1s spectra, are presented in Table 4.
Approximation of S2p sulfur spectra identified four doublets. The low-energy doublet of 1-1′ for the S2p3 peak with E of 161.8 eV and the high-energy doublet of 4-4′ for S2p3 peak with E of 168.6 eV were observed in all samples. These two doublets correspond to two sulfur states known as sulfide and sulfate. Doublets of 2-2′ and 3-3′ are located between 1-1′ and 4-4′ doublets. Their total intensity changes within 12–14%. The 2-2′ doublet with E of 163.0 eV is on an energy scale between sulfide-sulfur and elemental sulfur and can be attributed to polysulfides S22-. However, in Reference [36], when describing measurements of Mo3d and S2p binding energy for MoOySz films with different values of y and z, it was shown that the energy of the central part in S2p spectrum for molybdenum disulfide and molybdenum oxysulfide did not differ. The doublet in the region of 163,0 eV accompanies the main S2p doublet of 162.5 eV in molybdenum oxysulfides MoOySz. The higher was the y/z ratio, the higher was the MoOySz content. Thus, the doublet at 163.0 eV can be interpreted in two ways including the polysulfide or an additional MoOySz doublet.
The position of 3-3′ doublet (164 to 165 eV) corresponds exactly to the reference value of E for elemental sulfur (164,0 eV) [37]. In both samples, this doublet was slightly higher than the background level. This means that when elemental sulfur was used as the S-containing agent, the synthesis products did not practically contain the elemental sulfur. Molybdenum sulfide is manifested in Mo3d spectra by 1-1′ doublet. Mo3d5 peak E was 228.9–229.1 eV. The proportion of this peak in Cat (S)-TI is the lowest. 2-2′ doublet is slightly shifted to higher energies (229.4–229.7 eV), which can be associated with MoOySz molybdenum oxysulfide. 3-3′ and 4-4′ doublets in the area of molybdenum oxides dominated for both TI-samples [37,38,39,40,41,42,43].
According to Mo3d5 peak with E of 231.7–231.8 eV the 3-3′ doublet is due to Mo2O5, and the 4-4′ doublet is due to MoO3/Mo(SO4)3. The position of this doublet in the samples (233,0 eV) exceeded the reference value by about 0.5 eV, which can be attributed to differential charging associated with the presence of non-conductive phases of molybdenum oxide in the samples.
Comparative analysis of the results for TI samples showed that the main surface phase in Cat (TC)-TI was molybdenum disulfide MoS2, in Cat (S)-TI the surface contained MoS2 along with oxides and sulfate of molybdenum (marked as Mo5+ and Mo6+ in Table 4). The paper [44] notes that the oxidized forms of molybdenum, such as MoO3 and MoO42−, are often present on the surface of samples with sulfides of molybdenum due to the oxidation of nanosized particles during sample preparation.
3.2.3. X-ray Diffraction Analysis
Figure 10 shows x-ray diffraction spectra of the TI-samples. X-ray analysis shows that the studied samples do not contain bulk crystalline phases and have an amorphous-crystalline character. Diffraction patterns contained peaks at 2theta ~ 14, 33–35, 39, 59°, which are characteristic of different crystallographic modifications of molybdenum sulfide (MoS2 (2H, 3R), Mo3S4) [1,13,18,19].
A comparison of the interplanar spacings calculated for the most intensive line at 2theta~14°, according to Bragg’s equation and reference values for MoS2 (2H) (JCPDS # 01-075-1539), MoS2 (3R) (JCPDS # 01-089-2905), Mo3S4 (JCPDS # 01-082-1709) suggests the presence of two forms of molybdenum sulfides: MoS2 (2H) and Mo3S4 in TI-samples.
Peak broadening in the diffraction patterns indicates a low-crystalline structure and a small size of molybdenum sulfide crystalline phases [45]. According to References [1,46], the most intense peak at 2theta∼14° corresponding to the crystallographic plane (002) in molybdenum sulfide structure, may be used to estimate the number of layers in a packet-like cluster, i.e., thickness of elongated cluster, and the set of peaks at higher diffraction angles describes the internal cluster structure. The presence of the (110) peak at 2θ ∼ 59° often indicates the presence of unexfoliated particles (spheres, bundles, etc.).
The estimated size of crystallites was determined by the Scherrer equation (d = kλ/β cos θ), where λ is the wavelength of x-ray radiation (0.154 nm), k is the shape factor, β is the peak width at half height (FWHM), and θ is the Bragg angle. The average number of layers (N) was calculated by using the equation N = d002/d002 (MoS2), where d002 (MoS2) = 6.265 Å (JCPDS # 01-075-1539). As the result of calculations for Cat (S)-TI and Cat (TC)-TI, the size of crystallites determined by the broadening of (002)-peak at 2theta of ∼14° was 38 Å and 17 Å. The average number of layers was 6 and 3, respectively. This value is much lower when compared with the above described characteristics of Mo-containing particles in TI-samples. The difference may be attributed to the growth and aggregation of MoS2 crystallites to larger clusters of nanoscale and submicron particles under synthesis or sample preparation conditions.
Crystalline C-containing phases in diffraction patterns of TI-samples were not identified. Graphite is usually detected in diffraction patterns as the intensive peak at 2theta ~ 26°, being characteristic for a crystallographic (002) plane of the amorphous graphitized carbon [16]. Thus, C-containing components found in TI-samples appear to be represented by amorphous compounds, which act as stabilizers and are firmly associated with the Mo-containing particles, but do not physically appear like coke being poison for the active catalyst. This conclusion is of high practical importance because it confirms the possibility of obtaining highly dispersed catalytic particles stabilized by the components of specially selected hydrocarbon medium in the absence of a solid carrier.
Table 5 summarizes the characteristics of the synthesized ex-situ catalysts. Cat (S) is characterized by a higher content of a residual precursor. The results for Cat (TC) also indicate the presence of a residual precursor, but its amount is lower than for Cat (S). Mo-containing particles in Cat (S) and Cat (TC) dispersions had a different structure: Cat (S) contained spherical and elongated rounded clusters with an average size of 80 nm, and single-layered particles with a length of 8 nm. Cat (TC) contained solid and hollow nanostructured spheres (clusters) with an average size of 120 nm and multilayered packets with three to 12 layers and a length of 8 to 40 nm along the layer. Such differences in particle structure for the synthesized catalysts can provide various effects in catalysis due to the different activity on “rim” and “edge” catalytic sites of MoS2 crystallite [47,48].
3.3. Activity of Ex-Situ Catalysts in Hydro-Conversion
Catalytic activity testing in the hydro-conversion process was carried out in flow mode using a pilot unit at catalyst loading 0.05 wt % Mo, P = 70 atm, T = 425 °C, H2/feed = 1500 nL/L, feed space velocity 0.4 and 1.4 hr−1. The vacuum residue with the properties similar to the catalyst dispersion medium (Table 1) was used as the feedstock in hydro-conversion tests. A particular amount of Cat (S) or Cat (TC) corresponding to molybdenum concentration of 0.05 wt % was introduced into the feedstock and mixed by a high-shear mixer. The size distribution of the dispersed phase in mixtures of Cat (S) or Cat (TC) with hydro-conversion feed was estimated by the DLS method (Figure 11).
The hydro-conversion feed mixture with Cat (S) had particle sizes ranging from 40 to 790 nm and the mixture with Cat (TC) ranging from 40 to 930 nm. The average diameter of particles was 192 and 208 nm and values of polydispersity index 0.31 and 0.54 for Cat (S) and Cat (TC), respectively. After mixing with Cat (S) or Cat (TC), the resulting dispersed systems appeared to be less polydisperse when compared with the initial dispersions of Mo-containing particles (Figure 2). The average particle size was also lower. Thus, a high dispersion state of ex-situ catalyst particles was maintained after dispersing in the feedstock. The resulting suspension of feedstock with the catalyst contained nanosized and submicron particles.
To evaluate the catalytic properties of the Cat (S) and Cat (TC) catalysts, hydro-conversion tests were performed under conditions described above to compare with the in-situ synthesized catalyst described in References [1,15,20]. The results are shown in Table 5. Catalyst activity was evaluated by yield of products, 500 °C+ fraction conversion, and coke yield after hydro-conversion tests in the per pass mode.
After the hydro-conversion tests were completed in the presence of ex-situ catalysts, the liquid product was fractionated and toluene insoluble (TI) samples containing spent catalyst particles were isolated from the 500 °C+ fraction. The structure and properties of spent catalysts were studied for TI samples after tests #1 and #3 (Table 5). Elemental analysis for bulk samples of TI showed that the characteristic feature of these samples was high carbon content (70–80 wt %). Besides, carbon was associated with sulfur, which made it difficult to assess the molybdenum sulfide degree.
Figure 12 shows TEM images of particles in the studied TI powders. The results for TI powder after hydro-conversion in the presence of the Cat (S) catalyst, showed that more dark Mo-containing particles have a different shape (Figure 12a) and are characterized by the size of 50 to 200 nm. While particles of a smaller size are characterized by the presence of the contrast with interplanar distance ~0.63 nm (Figure 12b) being characteristic of MoS2. The S/Mo value is in the range of 0.8 to 3.3 (atomic) in different sample spots. The particle spectra contain Mo, S, O, V, and Ni. In the case of TI powder obtained after hydro-conversion in the presence of the Cat (TC) catalyst, it can be seen that the sample contains rounded Mo-containing particles with some having a hollow structure (Figure 12c,d). The particle size ranges from 40 to 250 nm. The S/Mo value ranges from 0.7 to 2.6 (atomic) in different sample spots. The particle spectra contain Mo, S, O, V, and Ni.
The hydro-conversion results in Table 5 show that Cat (S) and Cat (TC) catalysts differ in activity. At a lower feed rate (0.4 hr−1), which meant a longer feed residence time, Cat (TC) showed much higher values of 500 °C+ conversion (70 wt %) and coke yield (3.4 wt %) compared to what was reached with Cat (S) and an in-situ catalyst. Apparently, this is due to the increased effect of secondary reactions resulting in less saturated distillate products and coke. It is consistent with a high content of olefins for IBP-180 °C and 180–350 °C fractions. As expected, increased content of light hydrocarbons in the liquid product phase in the Cat (TC) test decreases dissolving efficiency of the reaction medium. This results in subsequent aggregation and sedimentation of asphaltenes, which, in turn, increases coke yield. Meanwhile, at a higher flow rate (1.4 hr−1), i.e., at a shorter feed residence time, the presence of Cat (S) and Cat (TC) catalysts showed comparable hydro-conversion results (500 °C+ conversion, coke yield). In particular, conversion of 500 °C + fraction decreased to 31.4 and 28.0 wt %, respectively, and coke yield, in both cases, did not exceed 0.1 wt %. Decreased content of olefins in the distillate fractions indicated a higher activity of Cat (S) catalyst in the C-C bond cracking and saturation reactions.
Thus, a longer feed residence time (feed rate of 0.4 hr−1) in the presence of the Cat (TC) catalyst in hydro-conversion conditions enhances the contribution of secondary reactions, which leads to coke formation (polymerization and polycondensation). The presence of Cat (S) and in-situ catalysts with the same feed residence time in the reaction zone decreased the secondary reactions and coke yield. It should be noted that the total content of light distillates in the liquid product phase was also lower.
Clearly, different catalytic activity in the hydro-conversion process is associated with characteristics of the catalyst particles. In particular, higher activity of Cat (S) in the reactions of C-C bonds cracking and saturation may be due to lower particle size (~80 nm by TEM), the presence of single-layered MoS2 slabs, and a lower molybdenum sulfide level. In the case of the Cat (TC) catalyst, the number of MoS2 active sites involved in hydro-conversion reactions may be lower when compared to Cat (S), since the inner surface of hollow spheres is not accessible for these agents. In addition, single-layered particles (in Cat (S)) compared to packets with three to 12 layers (in Cat (TC)) provide higher quantity of accessible corner sites (rim sites), for which a higher activity in hydrogenation of sulfur-containing aromatic fragments followed by desulphurization is attributed [47]. The MoS2 centers located on the edges of the inner layers in multi-layered packets (edge sites) are usually more active in the desulfurization reactions compared to hydrogenation reactions.
The hydro-conversion process proceeds more efficiently, i.e., with higher per pass conversion of high-molecular components and lower coke yield, at a longer feed residence time in a hydro-conversion reactor in the presence of Cat (S) in which catalytic particles maintain higher activity.
In terms of this study, the change in feed residence time in the hydro-conversion reaction zone reflects the relationship between the S-containing agent and characteristics of the resulting ex-situ catalysts and their influence on catalyst performance during petroleum residue hydro-conversion.
4. Conclusions
Concentrated dispersions of nanosized and submicron MoS2 particles were prepared and stabilized in heavy oil residue in the absence of the solid carrier. The synthesis of MoS2 was performed by the reverse emulsion method [20], containing Mo-salt, S-containing reagent (S or TC), and heavy oil residue. The main characteristics of these ex-situ catalyst dispersions were investigated. Results showed that it is possible to prepare catalyst dispersions with Mo content of 6–10 wt %, which exceeds Mo content achieved in previous studies (<5 wt %) [18,19].
The S-containing reagent in this study had a significant effect on the structure and morphology of MoS2 clusters. Particle size in the catalyst dispersions was 40 to 920 nm (by DLS), 80 nm (by TEM), and 40 to 1140 nm (by DLS), 120 nm (by TEM), for S and TC, respectively. Use of TC resulted in a higher degree of Mo sulfide (S/Mo = 2.1 (mol.), O/Mo = 0.6 (mol.), while for the S − S/Mo = 1.9 (mol.), O/Mo = 3.2 (mol.) (Table 5)) and lead to the formation of solid and hollow nanostructured spheres coexisting with multilayered MoS2 packets. Use of sulfur as the S-containing agent in the synthesis resulted in the formation of spherical and elongated rounded particles coexisting with single-layered MoS2 slabs. Mo-containing particles with a layered structure and different morphology were stabilized particularly by amorphous C-containing unsaturated components of the dispersion medium (heavy oil residue) and not by coke-like solid particles, which support observations described in Reference [18].
Catalytic activity tests under hydro-conversion conditions in per pass mode (catalyst loading 0,05 wt % Mo, P = 70 atm, T = 425 °C, H2/feed = 1500 nL/L, feed space velocity 1.4 hr−1) were performed following the procedure applied in our previous studies [13,15,18]. The composition of heavy oil residue, i.e., the continuous phase of reverse emulsions, was similar to that of the feed used for hydro-conversion tests. Sulfur as S-containing agent resulted in the formation of the catalyst with enhanced activity under hydro-conversion tests (higher conversion per pass and lower coke yield) even at a longer feed residence time (feed space velocity 0.4 hr−1). This can be explained by a relatively lower size of catalyst particles and by the presence of single-layered MoS2 with rim sites being more active in hydrogenation reactions, according to the «rim-edge» model [47].
Conditions of ex-situ catalyst synthesis ensuring a minimal coke yield (0.2 wt %) and the highest conversion (55.5 wt %) during petroleum residue hydro-conversion in a single pass mode have been determined.
Author Contributions
Conceptualization, A.L.M. and K.M.K.; methodology, M.K.K.; investigation, M.K.K.; data curation, M.K.K.; writing—original draft preparation, M.K.K.; writing—review and editing, K.M.K.; supervision, A.L.M.; project administration, K.M.K.
Funding
This research received no external funding.
Acknowledgments
This research has been carried out within the TIPS RAS State Program.
Conflicts of Interest
The authors declare no conflict of interest.
References
- Khadzhiev, S.N.; Kadiev, K.M.; Kadieva, M.K. Synthesis and properties of nanosized systems as efficient catalysts for hydroconversion of heavy petroleum feedstock. Pet. Chem. 2014, 54, 323–346. [Google Scholar] [CrossRef]
- Rana, M.S.; Sámano, V.; Ancheyta, J.; Díaz, J. A review of recent advances on process technologies for upgrading of heavy oils and residua. Fuel 2007, 86, 1216–1231. [Google Scholar] [CrossRef]
- Bellussi, G.; Rispoli, G.; Landoni, A.; Millini, R.; Molinari, D.; Montanari, E.; Moscotti, D.; Pollesel, P. Hydroconversion of heavy residues in slurry reactors: Developments and perspectives. J. Catal. 2013, 308, 189–200. [Google Scholar] [CrossRef]
- Ortiz-Moreno, H.; Ramírez, J.; Sanchez-Minero, F.; Cuevas, R.; Ancheyta, J. Hydrocracking of Maya crude oil in a slurry-phase batch reactor. II. Effect of catalyst load. Fuel 2014, 130, 263–272. [Google Scholar] [CrossRef]
- Angeles, M.; Leyva, C.; Ancheyta, J.; Ramírez, S. A review of experimental procedures for heavy oil hydrocracking with dispersed catalyst. Catal. Today 2014, 220, 274–294. [Google Scholar] [CrossRef]
- AlKhaldi, S.; Husein, M.M. Hydrocracking of Heavy Oil by Means of In Situ Prepared Ultradispersed Nickel Nanocatalyst. Energy Fuels 2013, 28, 643–649. [Google Scholar] [CrossRef]
- Zhang, S.; Liu, D.; Deng, W.; Que, G. A Review of Slurry-Phase Hydrocracking Heavy Oil Technology. Energy Fuels 2007, 21, 3057–3062. [Google Scholar] [CrossRef]
- Kadiev, K.H.; Khadzhiev, S.; Wadsworth, D.M. An efficient solution to the conversion of heavy hydrocarbon residue. In Proceedings of the 21st World Petroleum Congress, Moscow, Russia, 15–19 June 2014; Curran Associates Inc.: Red Hook, NY, USA, 2014; p. 3190. [Google Scholar]
- Liu, Y.; Gao, L.; Wen, L.; Zong, B. Recent Patents. Chem. Eng. 2009, 2, 22. [Google Scholar]
- Ramirez-Corredores, M.M. The Science and Technology of Unconventional Oils: Finding Refining Opportunities; Academic Press: Cambridge, MA, USA, 2017. [Google Scholar]
- Panariti, N.; Del Bianco, A.; Del Piero, G.; Marchionna, M. Petroleum residue upgrading with dispersed catalysts. Appl. Catal. A Gen. 2000, 204, 203–213. [Google Scholar] [CrossRef]
- Panariti, N.; Del Bianco, A.; Del Piero, G.; Marchionna, M.; Carniti, P. Petroleum residue upgrading with dispersed catalysts. Appl. Catal. A Gen. 2000, 204, 215–222. [Google Scholar] [CrossRef]
- Kadiev, K.M.; Khadzhiev, S.N.; Kadieva, M.K. Synthesis and use of polyfunctional catalyst nanoparticles for hydroconversion of natural bitumen. Pet. Chem. 2013, 53, 298–308. [Google Scholar] [CrossRef]
- Rezaei, H.; Ardakani, S.J.; Smith, K.J. Comparison of MoS 2 Catalysts Prepared from Mo-Micelle and Mo-Octoate Precursors for Hydroconversion of Cold Lake Vacuum Residue: Catalyst Activity, Coke Properties and Catalyst Recycle. Energy Fuels 2012, 26, 2768–2778. [Google Scholar] [CrossRef]
- Kadiev, K.M.; Gyul’Maliev, A.M.; Zekel’, L.A.; Kadieva, M.K. Hydrofining of Oil Shale Pyrolysis Tar in the Presence of Ultradispersed Catalysts. Solid Fuel Chem. 2018, 52, 336–342. [Google Scholar] [CrossRef]
- Khadzhiev, S.; Kadiev, K.; Kadieva, M. Formation and properties of nanosized particles of heavy feedstock conversion. Catal. Ind. 2014, 6, 312–319. [Google Scholar] [CrossRef]
- Nassar, N.N.; Husein, M.M. Ultradispersed particles in heavy oil: Part I, preparation and stabilization of iron oxide/hydroxide. Fuel Process. Technol. 2010, 91, 164–168. [Google Scholar] [CrossRef]
- Kadiev, K.M.; Khadzhiev, S.N.; Kadieva, M.K.; Dogova, E.S. Ex situ synthesis of sulfided molybdenum-containing ultrafine hydroconversion catalysts. Pet. Chem. 2017, 57, 608–617. [Google Scholar] [CrossRef]
- Khadzhiev, S.N.; Kadiev, K.M.; Gul’Maliev, A.M.; Kadieva, M.K. Properties and Structure of Nanosized Catalyst Systems Based on Molybdenum Sulfides. Pet. Chem. 2017, 57, 1277–1286. [Google Scholar] [CrossRef]
- Khadzhiev, S.N.; Kadiev, K.M.; Yampolskaya, G.P.; Kadieva, M.K. Trends in the synthesis of metal oxide nanoparticles through reverse microemulsions in hydrocarbon media. Adv. Colloid Interface Sci. 2013, 197, 132–145. [Google Scholar] [CrossRef]
- Eckert, B.; Janssen, A.J.H.; de Keizer, A.; Kleinjan, W.E.; Krossing, I.; Steudel, R.; Steudel, Y.; Wong, M.W. Elemental Sulfur and Sulfur-Rich Compounds I; Steudel, R., Ed.; Springer: Heidelberg, Germany, 2003; Volume 230, p. 202. [Google Scholar]
- Liu, Y.; Wu, K.; Guo, X.-L.; Wang, W.-Y.; Yang, Y.-Q. A comparison of MoS 2 catalysts hydrothermally synthesized from different sulfur precursors in their morphology and hydrodeoxygenation activity. J. Fuel Chem. Technol. 2018, 46, 535–542. [Google Scholar] [CrossRef]
- Peng, Y.; Meng, Z.; Zhong, C.; Lu, J.; Yu, W.; Yang, Z.; Qian, Y. Hydrothermal Synthesis of MoS2 and Its Pressure-Related Crystallization. J. Solid State Chem. 2001, 159, 170–173. [Google Scholar] [CrossRef]
- Vattikuti, S.V.P.; Byon, C. Synthesis and Characterization of Molybdenum Disulfide Nanoflowers and Nanosheets: Nanotribology. J. Nanomater. 2015, 2015, 1–11. [Google Scholar] [CrossRef] [Green Version]
- Han, J.H.; Kwak, M.; Kim, Y.; Cheon, J. Recent Advances in the Solution-Based Preparation of Two-Dimensional Layered Transition Metal Chalcogenide Nanostructures. Chem. Rev. 2018, 118, 6151–6188. [Google Scholar] [CrossRef]
- Nasirov, R.K.; Dianova, S.A.; Koval’Chuk, N.A.; Nasirov, I.R. Presulfiding of hydrotreating catalyst by elemental sulfur outside of the reactor. Chem. Technol. Fuels Oils 1998, 34, 344–348. [Google Scholar] [CrossRef]
- US4943547A—Method of Presulfiding a Hydrotreating Catalyst. Available online: https://patents.google.com/patent/US4943547A/en (accessed on 3 December 2018).
- Timchenko, V.P.; Novozhilov, A.L.; Slepysheva, O.A. Kinetics of Thermal Decomposition of Thiourea. Russ. J. Gen. Chem. 2004, 74, 1046–1050. [Google Scholar] [CrossRef]
- Morozov, E.V.; Trukhan, S.N.; Martyanov, O.N.; Larichev, Y.V.; Kazarian, S.G. The stability and evolution of oil systems studied via advanced methods in situ. Russ. Chem. Rev. 2017, 86, 999–1023. [Google Scholar]
- Yi, M.; Zhang, C. The synthesis of MoS 2 particles with different morphologies for tribological applications. Tribol. Int. 2017, 116, 285–294. [Google Scholar] [CrossRef]
- Stevens, G.C.; Edmonds, T. Preparation and Properties of Thiomolybdate Graphite Catalysts. Stud. Surf. Sci. Catal. 1979, 3, 507–517. [Google Scholar]
- Frey, G.L.; Tenne, R.; Matthews, M.J.; Dresselhaus, M.S.; Dresselhaus, G. Raman and resonance Raman investigation of MoS2 nanoparticles. Phys. Rev. B 1999, 60, 2883–2892. [Google Scholar] [CrossRef]
- Ma, L.; Chen, W.-X.; Xu, Z.-D.; Xia, J.-B.; Li, X. Carbon nanotubes coated with tubular MoS2 layers prepared by hydrothermal reaction. Nanotechnology 2006, 17, 571. [Google Scholar] [CrossRef]
- Ferrari, A.C. Raman spectroscopy of graphene and graphite: Disorder, electron–phonon coupling, doping and nonadiabatic effects. Solid State Commun. 2007, 143, 47–57. [Google Scholar] [CrossRef]
- Dresselhaus, M.S.; Jorio, A.; Souza Filho, A.G.; Saito, R. Defect characterization in graphene and carbon nanotubes using Raman spectroscopy. Philos. Trans. R. Soc. A: Math. Phys. Eng. Sci. 2010, 368, 5355–5377. [Google Scholar] [CrossRef]
- Benoist, L.; Gonbeau, D.; Pfister-Guillouzo, G.; Schmidt, E.; Meunier, G.; Levasseur, A. X-ray photoelectron spectroscopy characterization of amorphous molybdenum oxysulfide thin films. Thin Solid Films 1995, 258, 110–114. [Google Scholar] [CrossRef]
- Moulder, J.F.; Stickle, W.F.; Sobol, P.E.; Bomben, K.D. Handbook of X-ray Photoelectron Spectroscopy, Physical Electronics; Chastain, J., Ed.; Perkin-Elmer Corporation: Eden Prairie, MN, USA, 1992. [Google Scholar]
- McIntyre, N.S.; Johnston, D.D.; Coatsworth, L.L.; Davidson, R.D.; Brown, J.R. X-ray photoelectron spectroscopic studies of thin film oxides of cobalt and molybdenum. Surf. Interface Anal. 1990, 15, 265–272. [Google Scholar] [CrossRef]
- Latha, G.; Rajendran, N.; Rajeswari, S. Influence of alloying elements on the corrosion performance of alloy 33 and alloy 24 in seawater. J. Mater. Eng. Perform. 1997, 6, 743–748. [Google Scholar] [CrossRef]
- Briggs, D.; Sikh, M. Surface Analysis by Auger and X-Ray Photoelectron Spectroscopy; Mir: Moscow, Russia, 1987. [Google Scholar]
- Barr, T.L. An ESCA study of the termination of the passivation of elemental metals. J. Phys. Chem. 1978, 82, 1801–1810. [Google Scholar] [CrossRef]
- Anwar, M.; Hogarth, C.A.; Bulpett, R. Effect of substrate temperature and film thickness on the surface structure of some thin amorphous films of MoO3 studied by X-ray photoelectron spectroscopy (ESCA). J. Mater. Sci. 1989, 24, 3087–3090. [Google Scholar] [CrossRef]
- Hopfengärtner, G.; Borgmann, D.; Rademacher, I.; Wedler, G.; Hums, E.; Spitznagel, G. XPS studies of oxidic model catalysts: Internal standards and oxidation numbers. J. Electron. Spectrosc. Relat. Phenom. 1993, 63, 91–116. [Google Scholar] [CrossRef]
- Wang, H.; Skeldon, P.; Thompson, G. XPS studies of MoS2 formation from ammonium tetrathiomolybdate solutions. Surf. Coatings Technol. 1997, 91, 200–207. [Google Scholar] [CrossRef]
- Pourabbas, B.; Jamshidi, B. Preparation of MoS2 nanoparticles by a modified hydrothermal method and the photo-catalytic activity of MoS2/TiO2 hybrids in photo-oxidation of phenol. Chem. Eng. J. 2008, 138, 55–62. [Google Scholar] [CrossRef]
- Yi, Y.; Zhang, B.; Jin, X.; Wang, L.; Williams, C.T.; Xiong, G.; Su, D.; Liang, C. Unsupported NiMoW sulfide catalysts for hydrodesulfurization of dibenzothiophene by thermal decomposition of thiosalts. J. Mol. Catal. A: Chem. 2011, 351, 120–127. [Google Scholar] [CrossRef]
- Daage, M.; Chianelli, R. Structure-Function Relations in Molybdenum Sulfide Catalysts: The “Rim-Edge” Model. J. Catal. 1994, 149, 414–427. [Google Scholar] [CrossRef]
- Kadiev, K.M.; Zekel’, L.A.; Kadieva, M.K.; Khadzhiev, S.N. Formation of Polycondensation Products in Heavy Oil Feedstock Hydroconversion in the Presence of Ultrafine Catalyst: Physicochemical Study. Pet. Chem. 2018, 58, 519–527. [Google Scholar] [CrossRef]
Figure 1.
Schematic diagram of the catalyst preparation procedure.

Figure 2.
Particle size distribution intensity in toluene dissolved catalyst dispersions (DLS method, N5 Beckman Coulter): (a) Cat (S), (b) Cat (TC).
Figure 2.
Particle size distribution intensity in toluene dissolved catalyst dispersions (DLS method, N5 Beckman Coulter): (a) Cat (S), (b) Cat (TC).

Figure 3.
TEM images of particles in the Cat (S) -TI sample: (a): dark-field image, (b): bright-field image, and (c,d): HRTEM images (FEI Tecnai G230 ST).
Figure 3.
TEM images of particles in the Cat (S) -TI sample: (a): dark-field image, (b): bright-field image, and (c,d): HRTEM images (FEI Tecnai G230 ST).

Figure 4.
TEM images of particles in the Cat (TC)-TI sample: (a): dark-field image, (b): bright-field image, and (c,d): HRTEM images (FEI Tecnai G230 ST).
Figure 4.
TEM images of particles in the Cat (TC)-TI sample: (a): dark-field image, (b): bright-field image, and (c,d): HRTEM images (FEI Tecnai G230 ST).

Figure 5.
HAADF STEM images and corresponding maps of elemental distribution in the Cat (S)-TI sample.
Figure 5.
HAADF STEM images and corresponding maps of elemental distribution in the Cat (S)-TI sample.

Figure 6.
НААDF STEM images and corresponding maps of elemental distribution in the Cat (TC)-TI sample.
Figure 6.
НААDF STEM images and corresponding maps of elemental distribution in the Cat (TC)-TI sample.

Figure 7.
Raman spectrum for the Cat (S)-TI, Cat (TC)-TI and commercial MoS2.

Figure 8.
Approximated Mo3d and S2p high-resolution spectra of Cat (S)-TI sample.

Figure 9.
Approximated Mo3d and S2p high-resolution spectra of Cat (TC)-TI sample.

Figure 10.
XRD spectra of Cat (S)-TI and Cat (TC)-TI samples.

Figure 11.
Particle size distributions for the hydro-conversion feed mixture with the ex-situ catalyst dispersions (DLS method, N5 Beckman Coulter): (a)—Cat (S), (b)—Cat (TC) (DLS, Beckman Coulter N5).
Figure 11.
Particle size distributions for the hydro-conversion feed mixture with the ex-situ catalyst dispersions (DLS method, N5 Beckman Coulter): (a)—Cat (S), (b)—Cat (TC) (DLS, Beckman Coulter N5).

Figure 12.
TEM images for TI samples with spent catalyst after hydro-conversion tests with the Cat (S) catalyst (test #1) (a,b) and the Cat (TC) (test #3) (c,d).
Figure 12.
TEM images for TI samples with spent catalyst after hydro-conversion tests with the Cat (S) catalyst (test #1) (a,b) and the Cat (TC) (test #3) (c,d).


Table 1.
Properties of the vacuum residue.
| Parameter | Value |
|---|---|
| Density (20 °C), kg/m3 | 1030.0 |
| Fraction boiling above 500 °C, wt % | 95.0 |
| V, ppm | 150 |
| Ni, ppm | 38 |
| S, wt % | 3.1 |
| Asphaltenes, wt % | 12.5 |
| Resins, wt % | 22.0 |
Table 2.
Characteristics of ex-situ prepared catalysts.
| Parameter | Cat (S) | Cat (TC) |
|---|---|---|
| VR-stabilized dispersion of Mo-particles | ||
| D (DLS), nm | 209 ± 10 | 223 ± 11 |
| PI (DLS) | 0.51 | 0.60 |
| Mo, wt % | 6.0 | 10.2 |
| V, wt % | 0.0186 | 0.0174 |
| Ni, wt % | 0.0061 | 0.0062 |
| Fe, wt % | 0.0102 | 0.0045 |
| Co, wt % | 0.0034 | 0.0027 |
| Toluene insoluble components | ||
| N, wt % | 0.3 | 1.0 |
| C, wt % | 18.7 | 14.6 |
| H, wt % | 1.4 | 1.2 |
| S, wt % | 25.9 | 31.4 |
| O, wt % | 15.0 | 5.2 |
| Mo, wt % | 38.6 | 46.6 |
| S/Mo, molar | 1.9 | 2.1 |
| O/Mo, molar | 3.2 | 0.6 |
Table 3.
Elemental composition of TI samples’ surface, according to XPS.
| Sample | Elemental Content, at. % | Ratio of Elemental Content | |||||
|---|---|---|---|---|---|---|---|
| C | O | S | Mo | S/Mo | O/Mo | C/Mo | |
| Cat (S)-TI | 37.6 | 43.7 | 9.7 | 9.1 | 1.1 | 4.8 | 4.2 |
| Cat (TC)-TI | 55.9 | 24.9 | 12.4 | 7.0 | 1.8 | 3.6 | 8.0 |
Table 4.
XPS-results on the binding energy (E, eV) and relative fraction of components (I, %).
| Sample | Parameter | Mo3d | S2p | O1s | C1s | ||||||
|---|---|---|---|---|---|---|---|---|---|---|---|
| 1-1′ MoS2 | 2-2′ MoOySz | 3-3′ Mo5+ | 4-4′ Mo6+ | 1-1′ MoS2 | 2-2′ S22-/ MoOySz | 3-3′ S0 | 4-4′ SO42- | ||||
| Cat (S)-TI | E, eV | 228.9 | 229.5 | 231.7 | 233.0 | 161.8 | 162.9 | 163.9 | 168.6 | 531.6 | 284.1 |
| I, % | 9 | 6 | 21 | 64 | 14 | 7 | 5 | 75 | 100 | 100 | |
| Cat (TC)-TI | E, eV | 228.9 | 229.5 | 231.8 | 233.0 | 161.8 | 163.0 | 164.5 | 168.5 | 531.6 | 284.1 |
| I, % | 52 | 14 | 16 | 18 | 50 | 13 | 1 | 36 | 100 | 100 | |
Table 5.
Results of hydro-conversion tests in the presence of ex-situ synthesized Mo-containing catalysts (catalyst loading 0.05 wt % Mo, P = 70 atm, T = 425 °C, H2/feed = 1500 nL/L, per pass mode).
Table 5.
Results of hydro-conversion tests in the presence of ex-situ synthesized Mo-containing catalysts (catalyst loading 0.05 wt % Mo, P = 70 atm, T = 425 °C, H2/feed = 1500 nL/L, per pass mode).
| Test # | 1 | 2 | 3 | 4 | 5 |
|---|---|---|---|---|---|
| Catalyst | Cat (S) | Cat (TC) | In-situ | ||
| Composition of the dispersed phase (XRD, elemental analysis) | MoS2, Mo3S4 and | MoS2, Mo3S4 and | Mo sulfide | ||
| C-containing amorphous matrix (XRD), | C-containing amorphous matrix (XRD), | ||||
| residual precursor (S/Mo = 1.9, O/Mo = 3.2 (mol.)) | residual precursor (S/Mo = 2.1, O/Mo = 0.6 (mol.)) | ||||
| Particle size | 40–920 nm (DLS) | 40–1140 nm (DLS) | 10–50 nm [1] | ||
| 80 nm (TEM) | 120 m (TEM) | ||||
| d = 3.8 nm, N = 6 (XRD) | d = 1.7 nm, N = 3 (XRD) | ||||
| Particle structure | Spherical and elongated rounded particles, mono-layered slabs (length 8 nm) | Solid and hollow nanostructured spheres, multilayered “packets” (number of layers 3–12, length 8–40 nm) | [1] | ||
| Feed space velocity, hr−1 | 0.4 | 1.4 | 0.4 | 1.4 | 0.4 |
| Yield of products, wt % | |||||
| Gaseous products (without H2) | 2.6 | 1.7 | 2.1 | 1.8 | 2.3 |
| Liquid hydrogenation product | 97.2 | 98.2 | 94.5 | 98.1 | 97.6 |
| Fractional composition of liquid product, wt % | |||||
| IBP-180 °C fraction | 7.9 | 9.3 | 13.7 | 4.0 | 8.6 |
| 180–350 °C fraction | 30.2 | 15.6 | 32.6 | 18.8 | 25.6 |
| 350–500 °C fraction | 18.6 | 11.0 | 21.0 | 10.0 | 16.7 |
| 500 °C + fraction | 40.5 | 62.3 | 27.2 | 65.3 | 46.7 |
| Coke yield, wt % | 0.2 | 0.1 | 3.4 | 0.1 | <0.1 |
| Conversion of 500 °C+ fraction, wt % | 55.5 | 31.4 | 70.0 | 28.0 | 48.6 |
| Product properties: | |||||
| Liquid hydrogenation product | |||||
| S, wt % | 1 | 1.18 | 0.87 | 1.2 | 1.03 |
| ρ(20 °C), kg/m3 | 928 | 961 | 908 | 965 | 930 |
| IBP-180 °C fraction | |||||
| S, wt % | 0.34 | 0.48 | 0.33 | 0.49 | 0.38 |
| Olefins, wt % | 22.1 | 21.5 | 27 | 29.2 | 23.3 |
| 180–350 °C fraction | |||||
| S, wt % | 0.68 | 0.75 | 0.55 | 0.7 | 0.73 |
| Olefins, wt % | 25.4 | 20.3 | 29.4 | 22.3 | 19.4 |
| 350–500 °C fraction | |||||
| S, wt % | 1.01 | 1.17 | 0.96 | 0.16 | 1 |
© 2019 by the authors. Licensee MDPI, Basel, Switzerland. This article is an open access article distributed under the terms and conditions of the Creative Commons Attribution (CC BY) license (http://creativecommons.org/licenses/by/4.0/).
Share and Cite
MDPI and ACS Style
Kadieva, M.K.; Maximov, A.L.; Kadiev, K.M. Ex-Situ Synthesis and Study of Nanosized Mo-Containing Catalyst for Petroleum Residue Hydro-Conversion. Catalysts 2019, 9, 649. https://doi.org/10.3390/catal9080649
AMA Style
Kadieva MK, Maximov AL, Kadiev KM. Ex-Situ Synthesis and Study of Nanosized Mo-Containing Catalyst for Petroleum Residue Hydro-Conversion. Catalysts. 2019; 9(8):649. https://doi.org/10.3390/catal9080649
Chicago/Turabian StyleKadieva, Malkan Kh., Anton L. Maximov, and Khusain M. Kadiev. 2019. "Ex-Situ Synthesis and Study of Nanosized Mo-Containing Catalyst for Petroleum Residue Hydro-Conversion" Catalysts 9, no. 8: 649. https://doi.org/10.3390/catal9080649
Note that from the first issue of 2016, this journal uses article numbers instead of page numbers. See further details here.