Article

Quantitative Visual Characterization of Contaminant Metals and Their Mobility in Fluid Catalytic Cracking Catalysts

1
BASF Refinery Catalysts, 11750 Katy Fwy. #120 and Houston, TX 77079, USA
2
BASF Refinery Catalysts, Can Rabia 3–5, 08017 Barcelona, Spain
3
BASF Corporation, 100 Park Ave., Florham Park, NJ 07932, USA
4
BASF Corporation, 26 Davis Dr., Research Triangle Park, NC 27709, USA
5
BASF Refinery Catalysts, 25 Middlesex-Essex Tpk., Iselin, NJ 08830, USA
*
Author to whom correspondence should be addressed.
Catalysts 2019, 9(10), 831; https://doi.org/10.3390/catal9100831
Submission received: 27 August 2019 / Revised: 27 September 2019 / Accepted: 30 September 2019 / Published: 3 October 2019
(This article belongs to the Special Issue Heavy Oil In Situ Upgrading and Catalysis)

Abstract

:
A new approach for characterization of fluid catalytic cracking (FCC) catalysts is proposed. This approach is based on computational visual analyses of images originating from field emission scanning electron microscopy (FE-SEM) studies coupled with elemental mapping via electron dispersive x-ray spectroscopy (EDX) analyses. The concept of contaminant metal mobility is defined and systematically studied through quantification of interparticle transfer and intraparticle penetration of the most common FCC contaminant metals (nickel, vanadium, iron, and calcium). This novel methodology was employed for practical quantification of intraparticle mobility via the Peripheral Deposition Index (PDI). For analyzing and quantifying interparticle mobility, a new index was developed and coined “Interparticle Mobility Index” or IMI. With the development and practical application of these two indices, this study offers the first standardized methodology for quantification of metals mobility in FCC. This novel systematic approach for analyzing metals mobility allows for improved troubleshooting of refinery-specific case studies and for more effective research and development in contaminant metals passivation in FCC catalysts.

1. Introduction

1.1. Fluid Catalytic Cracking

Fluid catalytic cracking (FCC) is a refining process that converts crude oil derived feeds (often pre-processed by distillation and/or hydrotreating units) into valuable products including liquified petroleum gases (LPG), gasoline, and diesel precursors. FCC is often the major conversion unit in the refinery and is touted for its flexibility, since it can process feeds from various crude oil sources and of various qualities. The FCC is responsible for the production of most of the world’s gasoline and is thought of as fueling the world’s transportation networks. Although the technology originated during the World War II era, many improvements have been made over the years to both the hardware and design of FCC equipment and to the catalysts used. The FCC catalyst is prone to deactivation, and unwanted side reactions due to contaminant metals, including nickel (Ni), vanadium (V) and iron (Fe), coming into the unit with residue containing feedstocks (i.e., resid feeds). Improvement in understanding how these deleterious metals interact with FCC catalyst has been crucial to advancing catalyst technologies to be better suited for processing these feedstocks [1,2]. Recent developments in imaging actual FCC equilibrium catalysts (Ecats) have significantly contributed to these essential improvements.

1.2. Imaging in FCC

The use of microscopic imaging techniques for studying FCC catalysts is well-documented in literature, including contributions on optical microscopy, scanning electron microscopy (SEM) and transmission electron microscopy (TEM) [3,4]. Even though many advancements have been made towards increasing the resolution and holographic representation of microscopic images and to the generation of elemental mapping, quantitative characterization of these results has been limited, mainly due to the lack of a standardized methodology for the generation of statistically relevant representations of the studied phenomena. These limitations have hindered the widespread application of imaging in troubleshooting, comparative analysis efforts for catalyst selection studies, and target-setting for R&D projects on catalyst development. Thus, the use of image processing algorithms and software (such as ImageJ), could be an effective and needed means of analyzing FCC catalyst images.
ImageJ is an open source Java-based software originally developed by the National Institutes of Health (NIH) and has been employed for image processing and analysis for over three decades in various fields [5]. The software was originally developed for image analysis in biological samples; however, it can be adapted to analyze any image or video. Its use often relies on user-written macros that allow for the automated solving of complex image analyses [6,7].
There have been few examples on the effective use of ImageJ to study catalyst mesopores and contaminant behavior by analyzing data from techniques such as electron tomography and 3-D rotation electron diffraction [8,9]. However, development of a standardized methodology for quantification of key catalyst attributes have not yet been attempted.
This work describes the use of ImageJ to quickly quantify key parameters of interest to those working both on FCC catalyst development and in FCC operations. These parameters include both intraparticle and interparticle mobilities of metals on FCC catalysts.

1.3. Metals Mobility

Within the FCC unit, the catalyst is continuously circulated through a riser, where cracking takes place, and a regenerator, which removes accumulated organic material (i.e., coke) through combustion. While circulating, a fraction of catalyst is continuously added and withdrawn. The continual addition and withdrawal of catalyst introduces an age-distribution of catalyst particles in periodically withdrawn samples that are tested and tracked to monitor performance. This age-distributed catalyst sample is commonly called equilibrium catalyst (Ecat). While in the unit, catalyst is exposed to numerous deleterious metals that enter with the crude oil and other sources (e.g., wet steam). The metals deposit onto FCC catalyst particles, usually with different, metal-specific deposition profiles. For example, based on examination of Ecat samples, nickel is known to deposit on the outer portion of the FCC catalyst [3,4,10,11]. Meanwhile, vanadium is known to deposit both within and on the outside of catalyst particles, thus giving a more homogeneous distribution on Ecat particles [1]. Because the type of metal deposition dictates the ultimate behavior and activity of the metal, deposition characteristics are important to study and quantify. For instance, the dispersion of vanadium throughout an Ecat particle means that vanadium can attack and destroy zeolite Y throughout the entire particle, and not just on the surface of the catalyst [12,13,14]. Similarly, the ability of metals to move from one particle to another is important since this has implications on contaminant metal mitigation strategies. For example, given that nickel is regarded as immobile, a mobile nickel passivator would be more effective.
This work examines two types of metal mobility: Interparticle and intraparticle mobility. Mobility from the outside of a catalyst particle to the inside of the particle is termed intraparticle mobility. This mechanism describes the ability of a contaminant element to diffuse within a single particle. The second mechanism involves multiple particles, in which mobility is defined as movement from the surface of one particle to the surface of the other particle. In this context, mobility is termed interparticle mobility. A depiction and juxtaposition of these two mechanisms is provided in Figure 1.
We previously reported the use of SEM imaging to quantify intraparticle metal mobility on FCC equilibrium catalysts (Ecats) and laboratory deactivated catalysts (Dcats) [15]. The Peripheral Deposition Index (PDI) was introduced as the metal concentration on the outside of the particle (termed “edge”) divided by the metal concentration on the inside of the particle (termed “core”), as measured by spot analysis in SEM. A PDI value of 1 means that the element has high intraparticle mobility since the concentration on the core and edge are equal. PDI values for contaminant nickel were found to be between 2 and 5, indicating high concentrations on the outer surface of the catalyst and thus low intraparticle mobility. This previously reported method called for the SEM operator to manually identify the interior and periphery areas of a particle. As a result, the method is extremely time intensive and more importantly, subject to operator judgement. Furthermore, the EDS spot analysis of the periphery can be subject to measurement artifacts based on spot size.
The contribution in this work seeks to build upon the previous work by reducing the variability and time required for the operator-based method of determining intraparticle mobility by introducing a more standardized and automated method. This method calculates PDI using a visual image analysis software (ImageJ) and eliminates the need for manual operation of spot readings.
In addition to developing an automated method of quantifying intraparticle mobility by using an index, this work also demonstrates an automated means of developing an index to describe a contaminant’s interparticle mobility. To our knowledge, a standardized and automated method for quantifying interparticle mobility has not been previously reported. The work described in this manuscript introduces such a method using ImageJ and defines for the first time the Interparticle Mobility Index or IMI.
By developing automated and standardized imaging methods to quantify metals mobility, we believe better communication and understanding of contaminant metal behaviors on different FCC catalysts and in different FCC units across the industry can be achieved. With this better understanding of metals deposition and metal profiles, new catalyst development efforts will lead to more effective metals passivation technologies and operating strategies for mitigating the deleterious effects of metal contaminants.

2. Results and Discussion

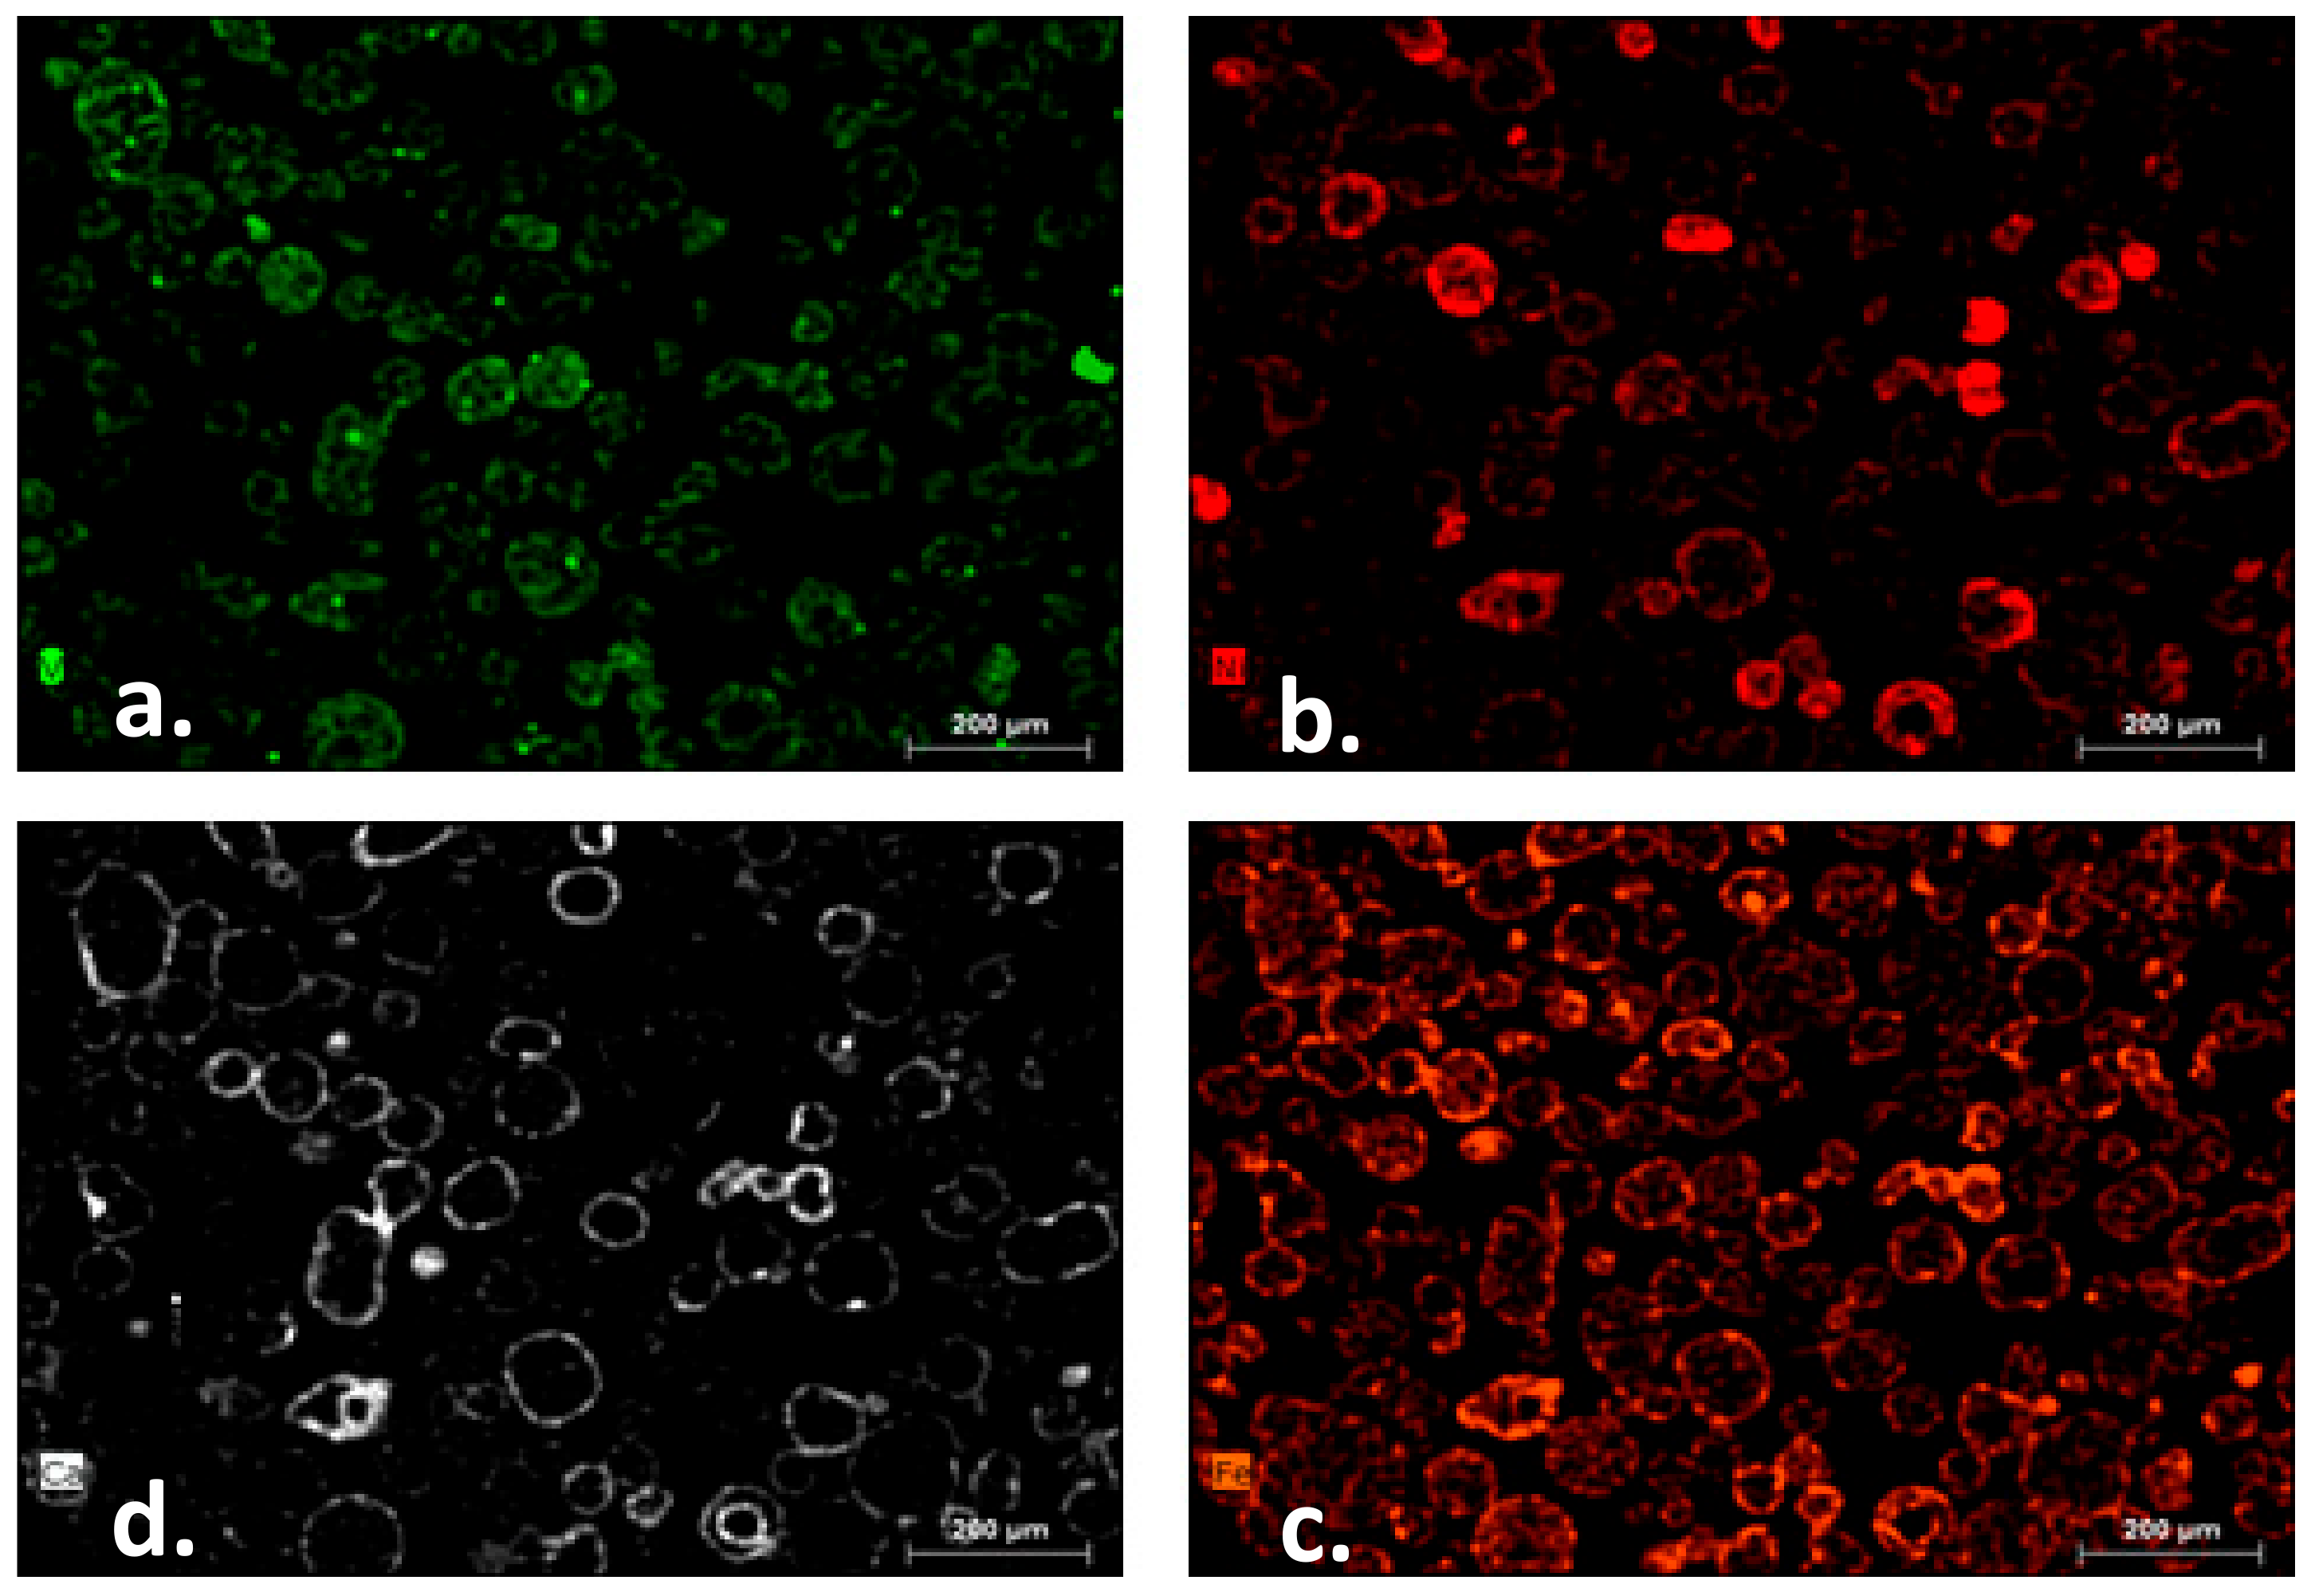
2.1. Qualitative Metals Mobility

Before exploring quantitative means of studying the mobility of contaminant metals, a qualitative examination of their mobility will be discussed. The differences in metals deposition can be discerned using SEM imaging.
An Ecat sample from a North American refinery was examined via FE-SEM. The FE-SEM images were coupled with elemental mapping through EDX analyses, and split into separate contaminant metal channels, as shown in Figure 2. From this, the mobility of each metal can be observed. Vanadium, in green, appears on almost all catalyst particles and is seen to traverse the surface of the catalyst particles resulting in an almost homogeneous distribution within a single particle. This is an indication of both high intra- and inter- particle mobilities for vanadium. Conversely, nickel and calcium, in red and white, respectively, are on a smaller fraction of the particles compared to vanadium, i.e., some particles have almost no nickel deposition, while many particles are heavily deposited. In addition, the majority of particles have both nickel and calcium relatively more concentrated on the outer stages, giving the impression that these metals have not fully penetrated deeply into the catalyst. This indicates poor inter- and intraparticle mobilities for both nickel and calcium.
A higher concentration of iron is found on the outer portion of the particles, also indicating poor intraparticle mobility; however, its interparticle mobility cannot be easily determined from a qualitative examination. Almost all particles appear to have Fe on the inner portion in varying concentrations. This difficulty arises from the fact that, in addition to being a contaminant, iron is an element of the fresh catalyst composition and originates from the clay-based raw materials used by catalyst manufacturers. Thus, determining the mobility of Fe relative to other metals using a qualitative examination of the SEM images is difficult.
It is in these types of instances that a quantitative means of evaluating metal mobility is especially beneficial, as the differences are too subtle to be determined via a qualitative examination. This work uses the same underlying raw data, namely SEM imaging, but applies advanced imaging techniques. The resulting quantitative intra- and interparticle mobility indices are described in the subsequent sections.

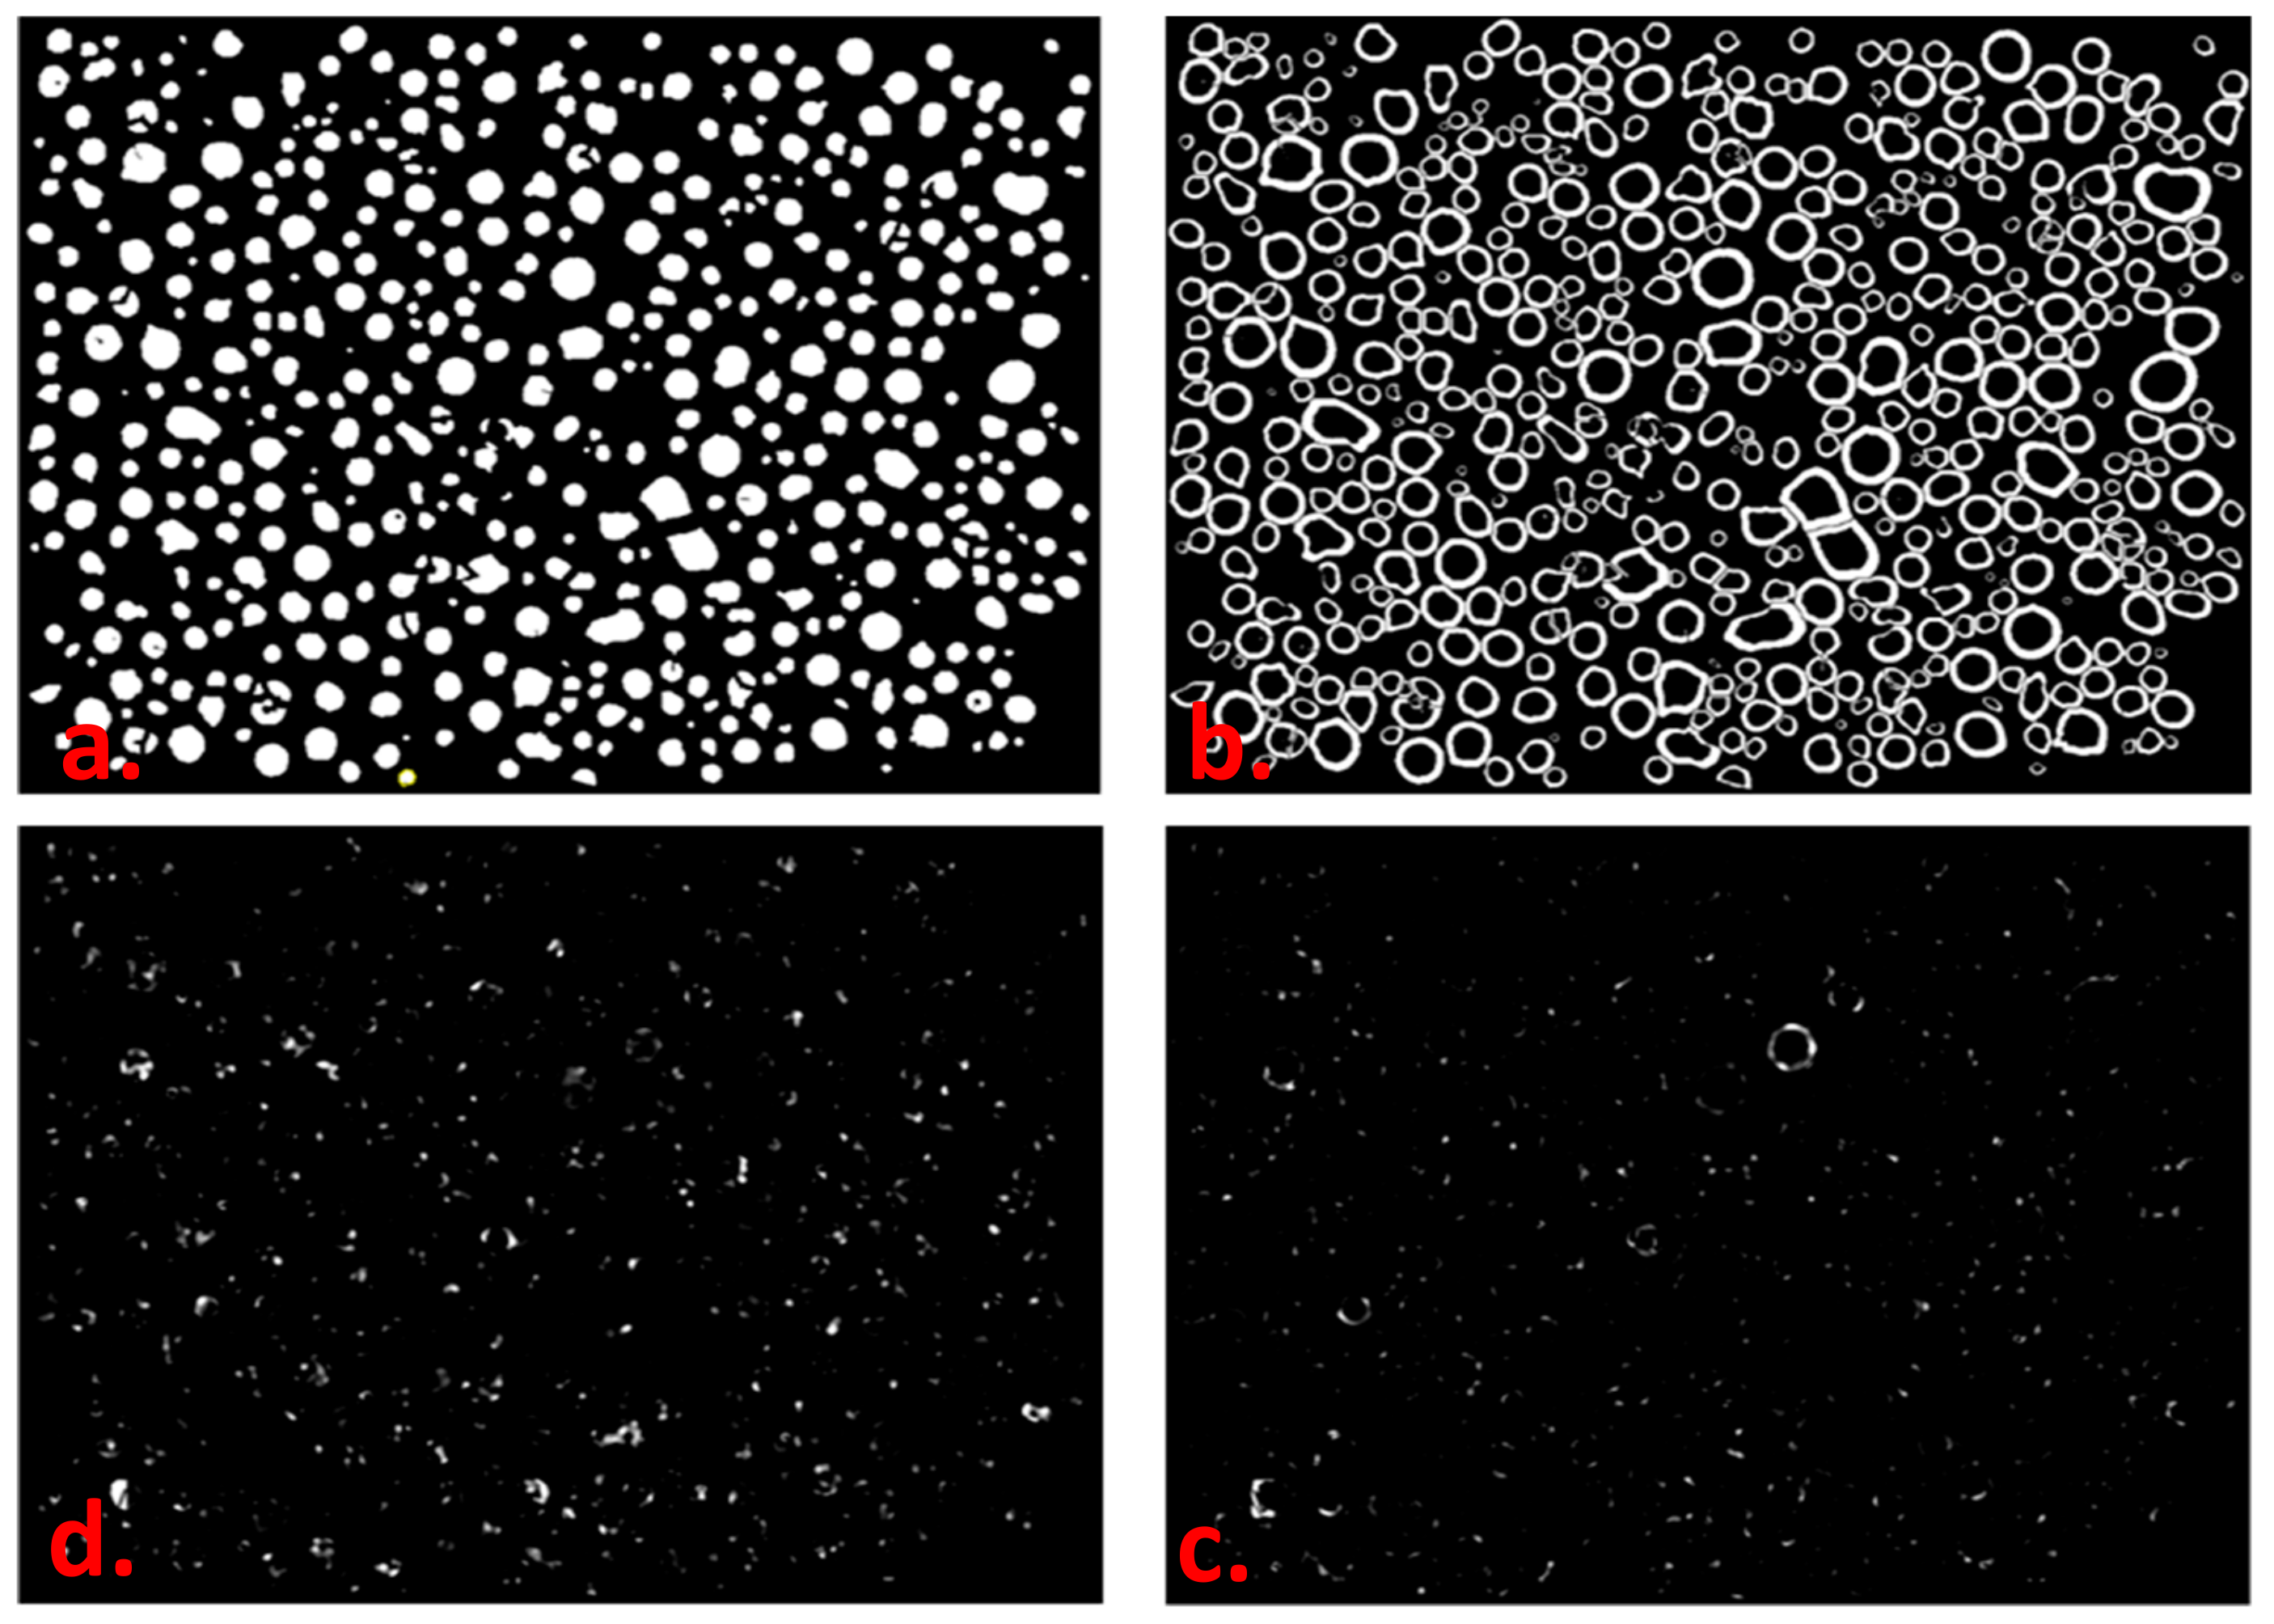
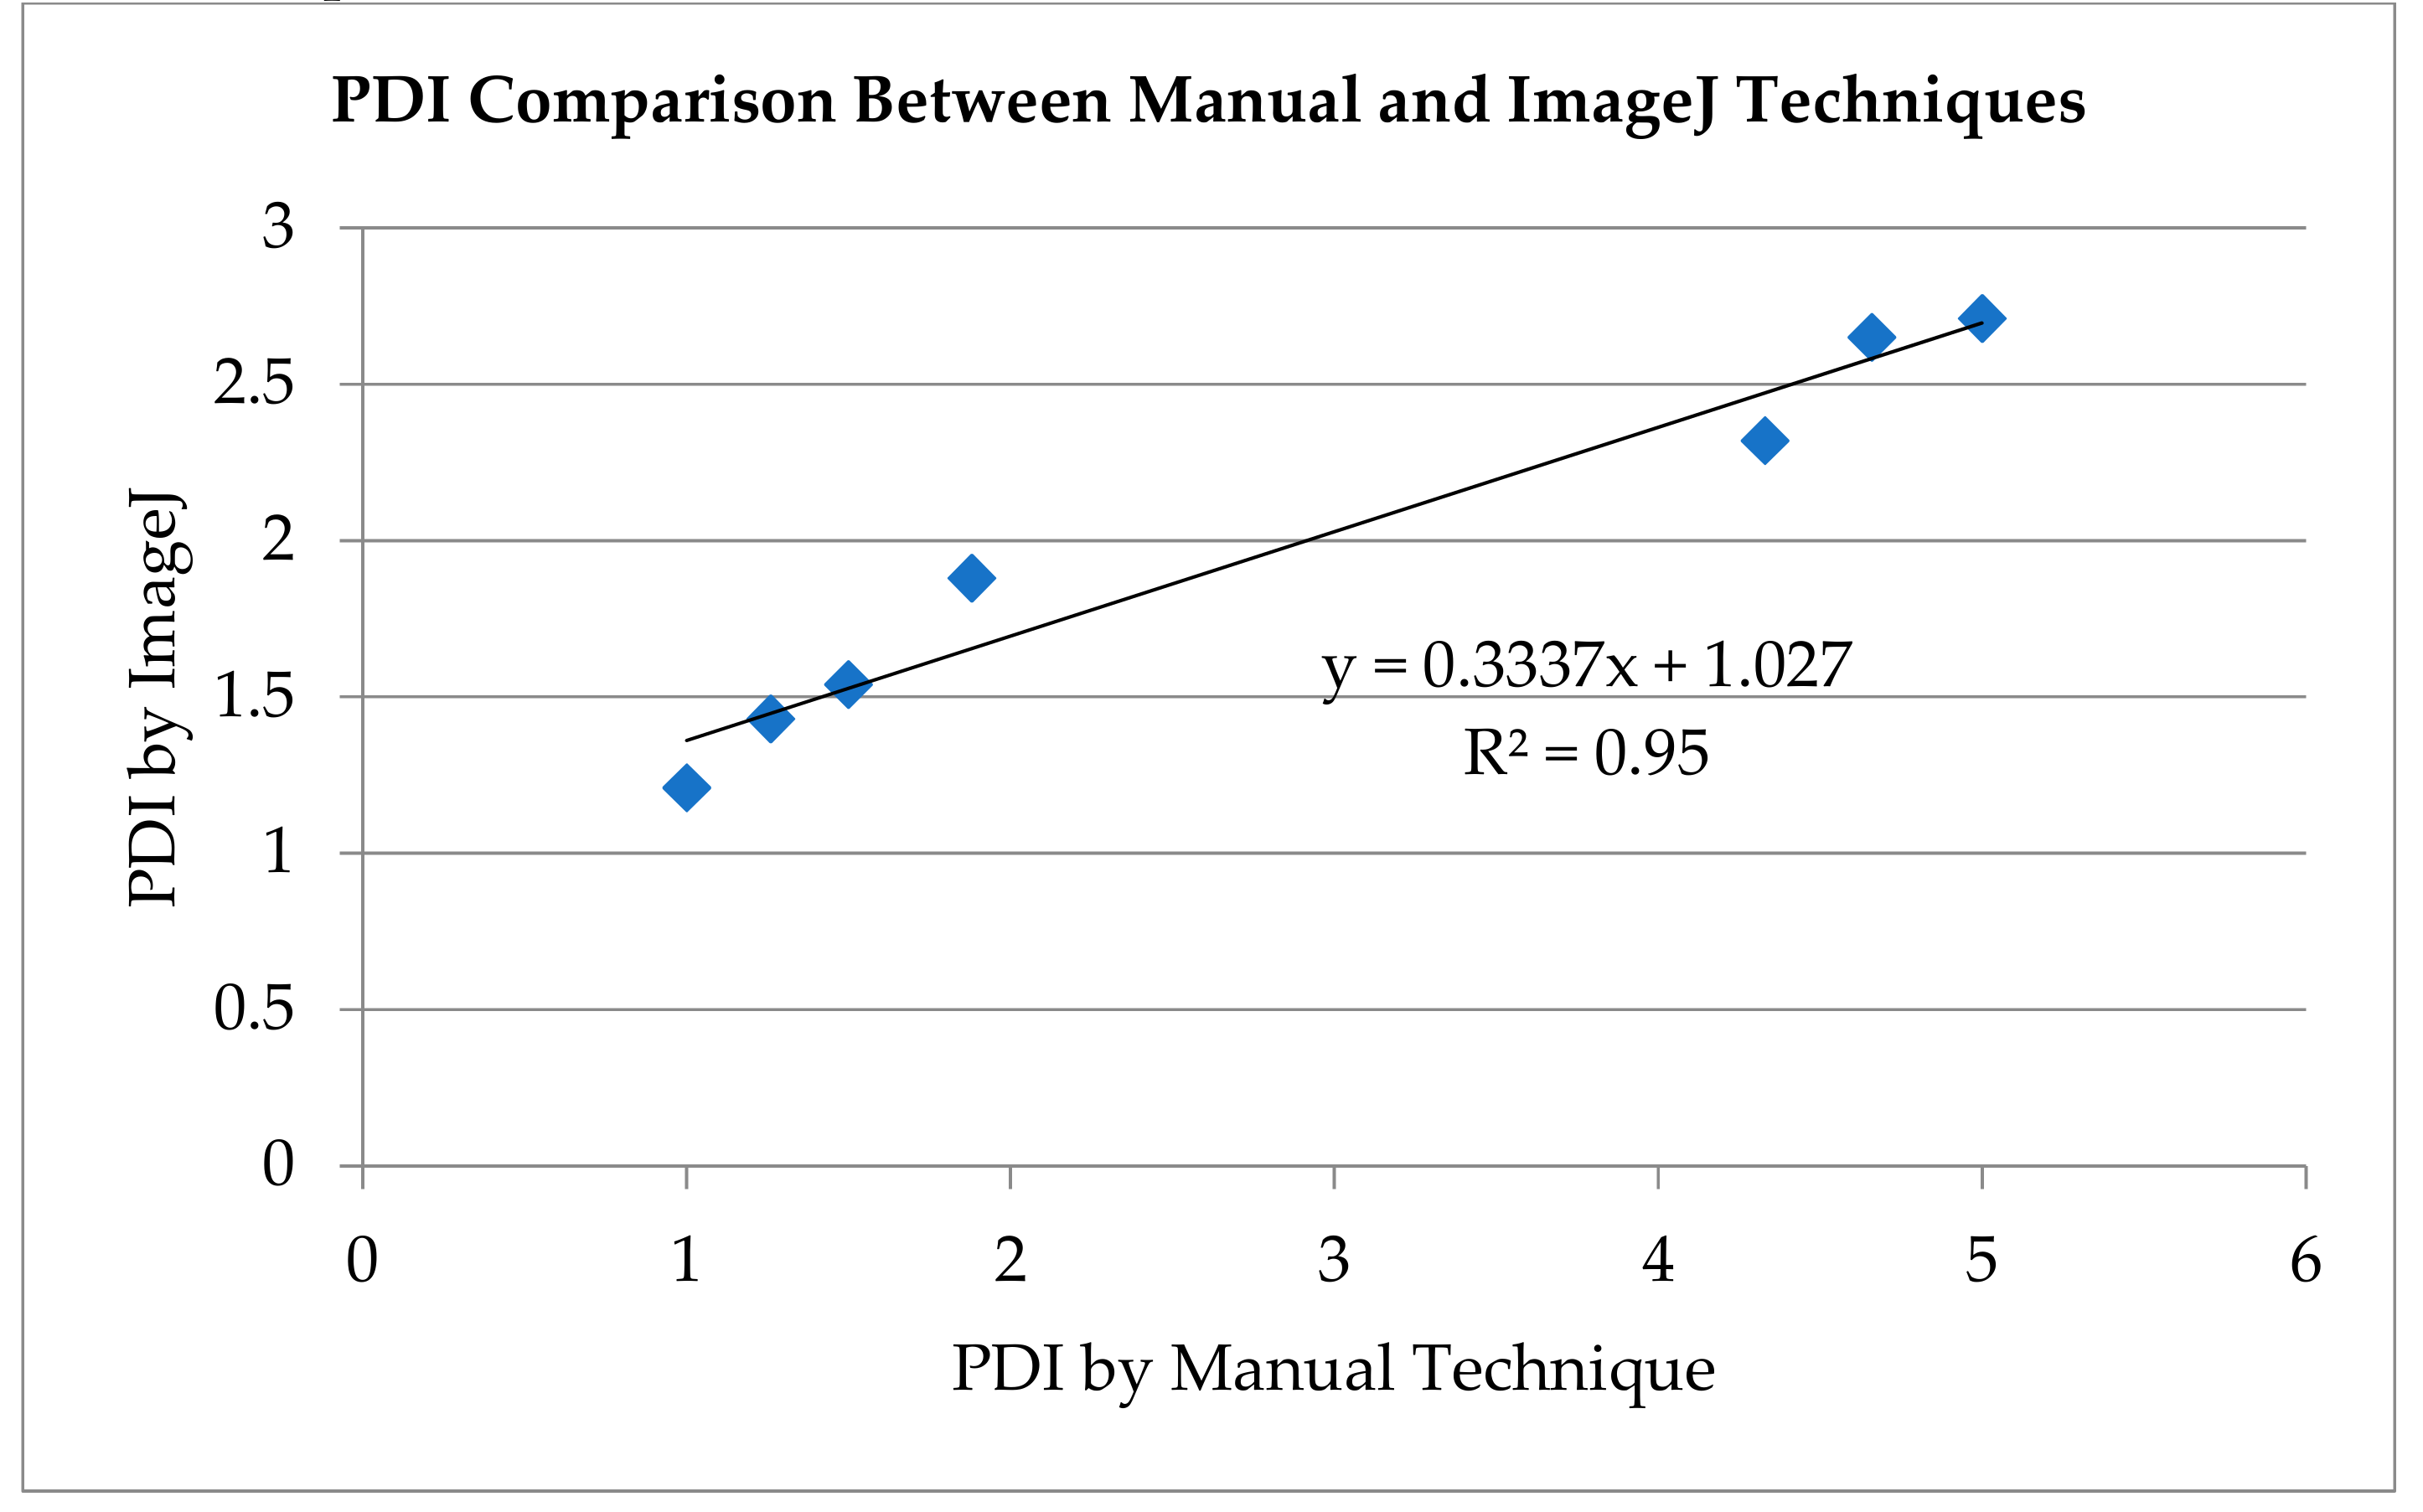
2.2. Intraparticle Mobility - Peripheral Deposition Index (PDI)

To study intraparticle mobility of different metals, SEM analyses of Ecat samples from multiple FCC units were performed. Metal deposition profiles were obtained, much like the example shown in Figure 2, for each of the samples. The new quantitative visual analysis methodology was used to define the core and edge sections of each particle. The concentrations of each contaminant in the core and edge were then measured in an automated fashion utilizing ImageJ software. PDI values were calculated as described above. The values for three different refineries are reported below.
Table 1 offers the PDI values for alumina, vanadium, nickel, iron, and calcium. Aluminum is offered as a baseline to demonstrate the method efficacy. Since alumina is inherent to FCC catalyst particles, a relatively homogeneous distribution is expected, resulting in a PDI value close to 1.0. The average observed value of 1.1 indicates the efficacy of the tool to accurately measure chemical markers and profiles. Utilization of aluminum for incorporated catalysts might lead to different numbers, due to potential surface enrichment from silica or alumina-based binders as part of the spray drying process.
For all three Ecats, V has the PDI value closest to 1 of all contaminants studied (0.9). This indicates that V is well distributed between the core and the edge, thus demonstrating the highest intraparticle mobility of the metals studied. In contrast, nickel, iron, and calcium all have PDI values greater than 1, which indicates that these metals exhibit poor intraparticle mobility and do not migrate to the interior of the particle. Calcium appears to show the highest heterogeneity within catalyst particles, giving the highest PDI values on average (3.2). This suggests that calcium has the lowest intraparticle mobility.
There is a caveat to this method. As with interparticle mobility, the amount of contaminant present must also be considered in calculating intraparticle mobility. Since a truly immobile metal will remain on the edge of a catalyst particle, increasing the amount of metal on Ecat will only increase the concentration of the metal on the edge of the catalyst, thus leading to an increase in PDI value. This phenomenon gives rise to a threshold concept, in which an element could be given a threshold PDI that defines it as immobile. The threshold PDI is likely different for each contaminant metal. PDI values above the threshold would simply indicate a higher absolute contaminant metal concentration. Exact “threshold” values for each contaminant have not been defined in this work but could be a subject for future study.
Analyzed together, these data illustrate the divergence in peripheral deposition behavior between the different contaminant metals. This further emphasizes the need for such analyses since the method for combatting the metal contaminant should differ depending on its deposition profile.

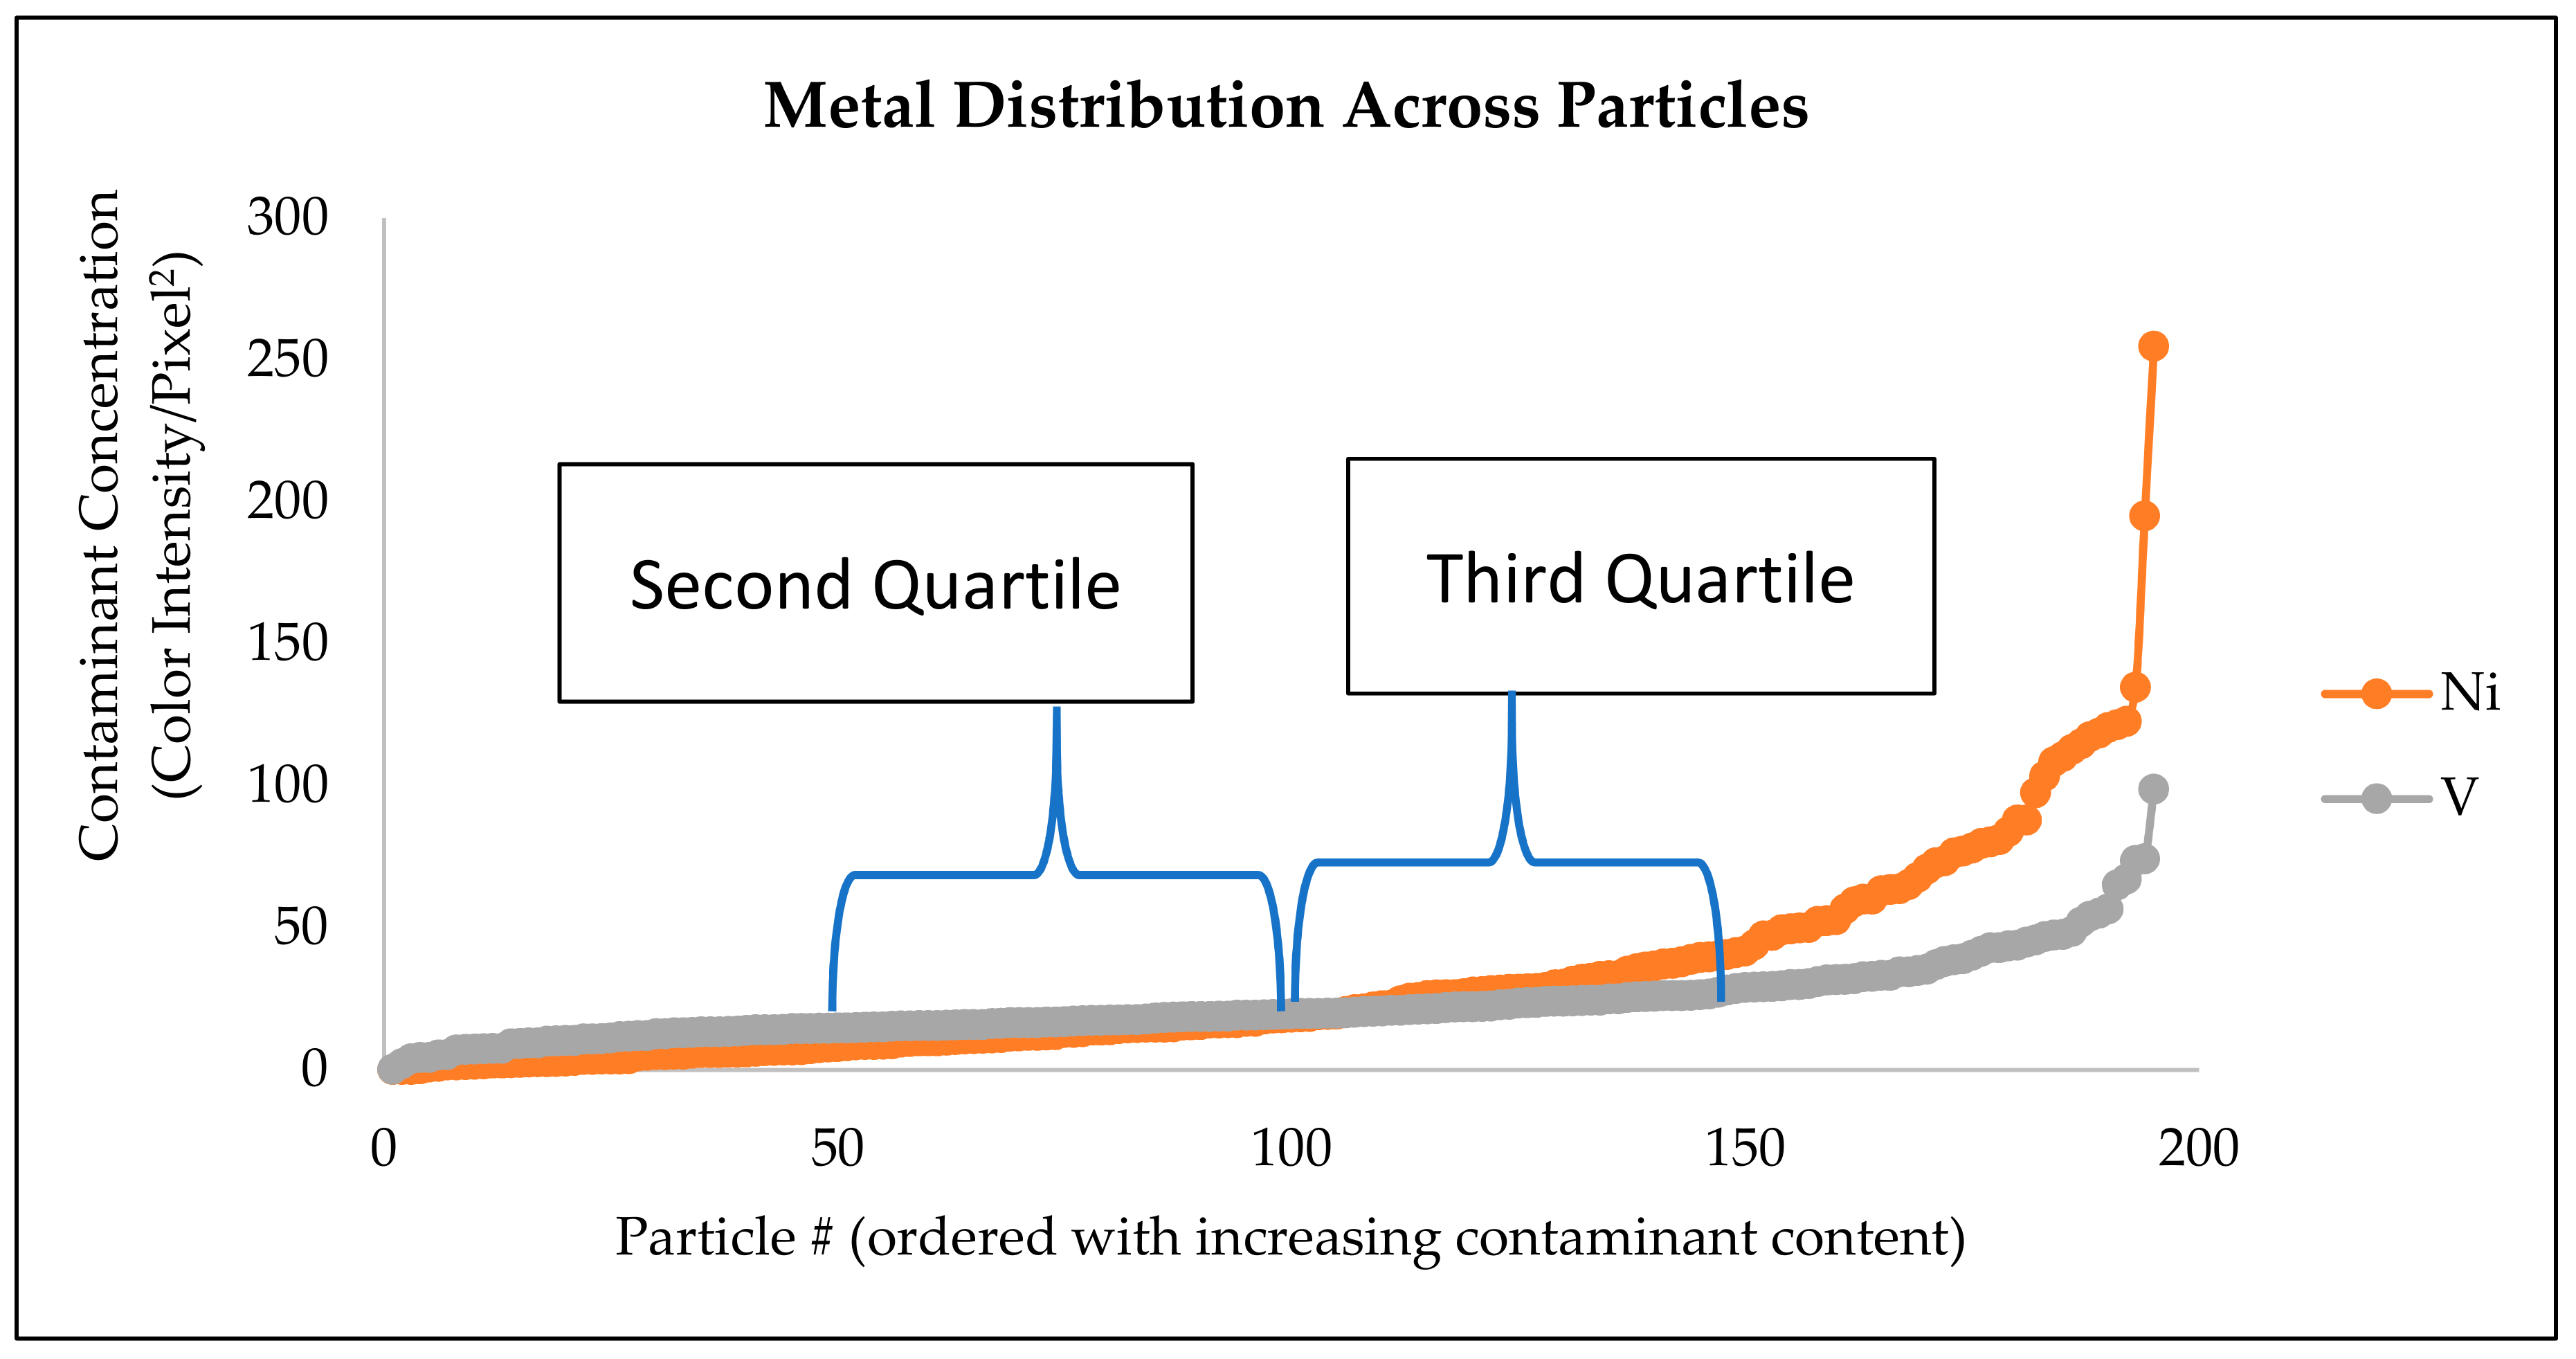
2.3. Interparticle Mobility Index (IMI)

The interparticle mobilities of different contaminant metals were also assessed using a similar quantitative characterization methodology (see Section 3.4.2). The concentration of V, Ni, Ca, and Fe on the edge of each particle was calculated in an algorithmic and automated fashion. Particles were then sorted in order of increasing contaminant concentration for each individual contaminant. We defined the Interparticle Mobility Index, or IMI, as the sum of concentrations of third quartile divided by the sum of concentrations of the second quartile. This gives an index value, which represents the relative interparticle mobility of each metal. Aluminum is shown as a reference since it is present in all catalyst particles as one of the key ingredients in FCC catalyst manufacturing. As with the PDI index, Al gives the IMI value closest to 1 (1.1), indicating that, of the metals studied, Al is most evenly distributed over all particles and confirming the IMI index as a means for evaluating interparticle mobility.
Table 2 summarizes the IMI values for elements on Ecat samples from three refineries. Vanadium has the lowest IMI values of all contaminants, with an average value of 1.5. Nickel shows an IMI value (2.2) significantly higher than that of V, indicating lower mobility and higher heterogeneity between catalyst particles in the samples studied. Interestingly, the 1.6 average IMI value of Fe is only slightly higher than V. This would indicate that Fe has similar mobility to V; however, the presence of Fe inherent to fresh catalyst cannot be discounted. It is possible that higher Fe contaminant levels are needed to show a significant difference in this index (fresh Fe levels can be as much as 7 times higher than contaminant Fe levels) or the contrast of the SEM must be adjusted. To this effect, an “added Fe” IMI is offered in the table below, in which fresh catalyst Fe was discounted before calculating the IMI value. The fresh Fe is discounted by assuming that no contaminant Fe migrates to the very core of the particle (as demonstrated by the high PDI value for Fe as discussed in Section 2.2). The resulting average IMI value for Fe is 2.3, slightly higher than the value for nickel. Thus, the relative interparticle mobility of Ni and Fe is similar to their relative intraparticle mobilities discussed previously. Finally, Ca appears to be the least mobile compound, with an average IMI of 3.2.
The method described in this section shows a consistent, clear, quantitative difference in the interparticle mobility of V, Ni, Fe, and Ca in multiple FCC units.

3. Materials and Methods

3.1. Catalyst Samples

Commercially produced catalyst samples that were taken from actual FCC units were used for this study, designated as equilibrium catalyst or Ecat as described above. As an FCC catalyst supplier, BASF maintains Ecat-testing laboratories that receive Ecat samples from hundreds of refineries across the world. Additionally, BASF R&D laboratories are equipped to perform all relevant techniques for characterization and performance monitoring of these Ecat samples, including contaminant metals and FE-SEM analyses. These samples, which span a variety of refiners, catalyst suppliers, and regions, were used for the basis of this study.
Catalyst samples for this study were chosen based on their contaminant metals concentration. For instance, Ecat samples with high contaminant metals levels were chosen to study contaminant metal mobilities. The Ecat samples were collected from refineries operating FCC units and were units that processed mild-resid to resid feeds for high contaminant metal loadings. Metals levels on Ecat samples studied ranged from 1600–3800 ppm Ni, 3400–5000 ppm V, 5600–8000 ppm Fe, and 380–740 ppm Ca.

3.2. FE-SEM and EDX Analyses

Prior to Field-Emission Scanning Electron Microscopy (FE-SEM) analyses, samples were mounted in epoxy and polished to an ultra-flat surface and carbon coated using a Denton DV-502A Vacuum Evaporation System. The BEI analysis was conducted on a Hitachi 3400S Environmental Microscope at 15–25kV. Energy Dispersive X-Ray Spectroscopy (EDX) results were collected at 25kV on a Bruker Quantax EDX system with Dual 30mm2 Silicon Drift Detectors (SDD).

3.3. Chemical Analysis

X-ray Fluorescence Spectroscopy (XRF) analyses were performed using a wavelength-dispersive PANalytical PW2400 spectrometer, calibrated by linear regression to data from standards. All samples were prepared by fusion, using a lithium metaborate/lithium tetraborate flux.

3.4. Metals Mobility Analyses

3.4.1. Intraparticle Mobility

The novel visual analysis methodology developed here can distinguish and define separate particles, define inner and outer regions, and then quantify the amount of each element in a given region. The tool uses a background image to define particles first. In this method, we propose the overall backscattering scan as the background. The program then splits an original image into red, green, and blue channels. Using one channel, the software defines the outline of catalyst particles. The ImageJ software used here then calculates a core with a radius that is approximately 70% of the radius of the total particle, the rest of the catalyst is designated as the “edge.” The resulting “core” and “edge” areas are equal. This relative core radius value was determined after multiple radius values less than 70% were considered. These smaller values resulted in “edge” particle areas which were large and whose inner border extended into what could be considered the “core” of the particle. Thus the 70% radius value chosen not only results in approximately equal areas for core and edge portions, but also allows for a balance of not considering too large of an “edge” fraction, while still leaving enough edge area for meaningful analysis. This comparison can be seen in Figure 3.
The ImageJ software then can calculate the amount of contaminant present on each portion of each particle. Thus, we defined an updated intraparticle mobility index (PDI) to the index previously published [15]. The PDI is defined by the ratio of an element’s concentration on the edge divided by the element’s concentration in the core:
PDI = Concentration on edge of particle Concentration of core of particle
A visual depiction of the procedure is provided in Figure 4 and Figure 5. All PDI analyses performed in this work were performed on images with approximately 200 particles.
To evaluate the efficacy of this method, a comparison was made between the new, ImageJ-based method and the previously described manual method [15]. In the previous report, PDI values for Ni from deactivated catalyst (Dcat) samples were obtained by the manual method and ranged between 1 and 5. Employing the new algorithm-run image processing and quantification methodology on those same analyses, we see that a similar trend is observed, while the absolute values differ. PDI calculated by the automated technique based on ImageJ results in very similar values to those of the manual method for PDI values <2 as seen in Figure 6. As the manually calculated PDI values increase, the PDI values calculated from ImageJ do not increase at the same rate (i.e., they are lower). The difference likely stems from the choice of the spot for analyses. The comparison between manual and algorithmic methods based on ImageJ is consistent, with over 95% accuracy by a linear correlation. This deviation highlights the need for a systematic automated technique since operators at different laboratories would be different in their spot selection, making comparison of absolute values highly problematic, resulting in the absence of a common basis for comparison and discussion on metals contamination and passivation.

3.4.2. Interparticle Mobility

As contaminant metal movement between particles takes place at/through the surfaces, interparticle mobility was determined by data collected from edge analyses only, disregarding core data. The concentration of four contaminant metals (V, Ni, Ca, and Fe) on each particle was calculated. Particles were then independently sorted in order of increasing concentration. For demonstration purposes, the Ni and V data are shown in Figure 7.
The Interparticle Mobility Index, or IMI, is defined as the sum of concentrations in the third quartile divided by the sum of concentrations in the second quartile:
IMI = ( Concentrations of 3 rd quartile ) ( Concentrations of 2 nd quartile ) ,
The second and third quartile data sets are chosen to avoid the use of skewed data found in the first and fourth quartiles, which can occur in any FCC Ecat sample. For example, the fourth quartile likely contains catalyst particles that have been in the unit since it first started up, giving it a semblance of being in the unit for an infinite amount of time (and thus very high metals). The same mathematical skew can be found in the first quartile, with catalyst particles that are only minutes old, for example. Additionally, only considering the middle two quartiles protects against data which is skewed by the image analysis technique. For example, sometimes software can identify very small fragments as particles which might give very high or low contaminant concentrations. These extreme concentrations are not truly representative of a catalyst particle and do not illustrate the mobility of the metal in question—they are a byproduct of imperfections in the image analysis method. Thus, in accounting for non-representative data found in particles with very high and low concentrations of metals, this work provides an index that can be calculated separately for each contaminant metal and used to represent the relative interparticle mobility of each metal. All IMI evaluations were performed on images containing approximately 200 particles.
It should be noted that there are several factors which could affect the interparticle distributions and the perceived mobility of the metal in question. First, additives (used for maximizing octane and small olefins, or for environmental purposes such as those against NOx, SOx, etc.) and metal traps can skew the distribution of contaminant metals and affect mobility results. For example, it is well documented that metals deposit to a much lesser extent, if at all, on some additives, than they do on the FCC catalyst. This is because the large asphaltenic or porhphyrinic molecules containing the contaminant metals crack on the FCC catalyst and not on most additives. For instance, in FCC units with propylene maximization targets, since the circulating inventory (or Ecat) contains a high portion (e.g., 10–25%) of ZSM-5 additive, the results from such an analysis when ZSM-5 additive is used in high amounts can be skewed. Our approach of taking the second and third quartiles for the IMI calculation helps minimize the negative effects of additive presence in circulating inventory. Second, FCC units with high rates of catalyst turnover will result in a similar distribution in metals on catalyst, as the average catalyst age in the unit will be very young (i.e., more uniform distribution within the circulating inventory). A third factor is the amount of contaminant metal combined with the sensitivity of the instrument used to measure contaminant concentration on each particle, as an Ecat metal level being too high or too low can give misleading results. When the amount of metal on Ecat is too high, the secondary electron signal used for the EDX in FE-SEM can have trouble distinguishing differences in concentration from particle-to-particle, and the metal will appear very well distributed (i.e., mobile). In this case, a modification to the automated program would be needed to adjust the sensitivity analysis of the imaging software. While not an issue for the work discussed in this paper, when the amount of metal on Ecat is very low, only a fraction of the metal will be above the instrument’s threshold of detection, which will result in the metal appearing highly immobile. Similarly, an adjustment to the imaging software’s sensitivity threshold would need to be adjusted. The cutoff for metal on Ecat being too high or low for this technique depends upon the SEM measurement techniques being used. The Ecat samples chosen for this study were selected because they contain no additives, traps, or very high/low amounts of contaminant metals.

4. Conclusions

Metal contaminants have clear pathways of imparting negative effects in an FCC unit. Since metals originating from the crude oils processed will continue to increase, their impacts on FCC catalyst selectivity and activity must be further understood so that more effective mitigation strategies can be developed. Understanding metals mobility is a key aspect in understanding metals effects and has been a topic of great interest. However, consistent and systematic quantitative methods for measuring mobility are limited. A clear and consistent method of analyzing FCC catalyst images is necessary to accurately quantify metals deposition behavior and phenomena. While we had previously developed and reported a method, PDI, for quantification of intraparticle mobility, it was quite time consuming, expensive, and subjective, due to the need for intense involvement of the operator.
In this contribution, we demonstrate a novel algorithmic methodology for automated quantitative visual characterization of Ecat samples. The Peripheral Deposition Index (PDI), which we had previously reported, has been standardized as a more practical method for measuring intraparticle mobility. The Interparticle Mobility Index (IMI) has been introduced for the first time to offer a method of measuring interparticle mobility. Accurately understanding the mobility and distribution of contaminant metals in a particular FCC unit can help clarify the source of contaminant metals (feed, catalyst, additive), evaluate the efficacy of metals-passivators, determine metal effects on different catalysts and additives, and serve as a source of direction for experimental studies in laboratory-scale. Hence, the development of quantitative visual characterization techniques will not only help advance understanding of catalysts and catalyst contaminants in fluid catalytic cracking, but also will guide the development of future catalyst technologies.

Author Contributions

Development of ImageJ techniques, C.S., M.C.M., A.M.M., R.M.J., and B.Y.; ImageJ application, D.H.; analysis of data, C.S., M.C.M., A.M.M., R.M.J. and B.Y.; experimental development, C.S., M.C.M., A.M.M. and B.Y.; writing of manuscript, C.S., M.C.M. and B.Y.

Funding

This research received no external funding.

Acknowledgments

The authors thank BASF Analytics and Materials Characterization Department for characterization, and BASF Technical Services Laboratories for the coordination of Ecat testing.

Conflicts of Interest

The authors declare no conflict of interest.

References

  1. Pan, S.S.; Lin, L.T.X.; Komvokis, V.; Spann, A.; Clough, M.; Yilmaz, B. Nanomaterials Fueling the World. In Nanomaterials for Sustainable Energy; American Chemical Society: Washington, DC, USA, 2015; Volume 1213, pp. 3–18. [Google Scholar]
  2. Clough, M.; Pope, J.C.; Lin, L.T.X.; Komvokis, V.; Pan, S.S.; Yilmaz, B. Nanoporous materials forge a path forward to enable sustainable growth: Technology advancements in fluid catalytic cracking. Microporous Mesoporous Mater. 2017, 254, 45–58. [Google Scholar] [CrossRef]
  3. Meirer, F.; Morris, D.T.; Kalirai, S.; Liu, Y.; Andrews, J.C.; Weckhuysen, B.M. Mapping Metals Incorporation of a Whole Single Catalyst Particle Using Element Specific X-ray Nanotomography. J. Am. Chem. Soc. 2015, 137, 102–105. [Google Scholar] [CrossRef] [PubMed]
  4. Kugler, E.; Leta, D. Nickel and vanadium on equilibrium cracking catalysts by imaging secondary ion mass spectrometry. J. Catal. 1988, 109, 387–395. [Google Scholar] [CrossRef]
  5. Schneider, C.A.; Rasband, W.S.; Eliceiri, K.W. NIH Image to ImageJ: 25 years of image analysis. Nat. Methods 2012, 9, 671–675. [Google Scholar] [CrossRef] [PubMed]
  6. Schindelin, J.; Rueden, C.T.; Hiner, M.C.; Eliceiri, K.W. The ImageJ ecosystem: An open platform for biomedical image analysis. Mol. Reprod. Dev. 2015, 82, 518–529. [Google Scholar] [CrossRef] [PubMed] [Green Version]
  7. Feige, J.N.; Sage, D.; Wahli, W.; Desvergne, B.; Gelman, L. PixFRET, an ImageJ plug-in for FRET calculation that can accommodate variations in spectral bleed-throughs. Microsc. Res. Tech. 2005, 68, 51–58. [Google Scholar] [CrossRef] [PubMed] [Green Version]
  8. Kalirai, S.; Boesenberg, U.; Falkenberg, G.; Meirer, F.; Weckhuysen, B.M. X-ray Fluorescence Tomography of Aged Fluid-Catalytic-Cracking Catalyst Particles Reveals Insight into Metal Deposition Processes. ChemCatChem 2015, 7, 3674–3682. [Google Scholar] [CrossRef] [PubMed] [Green Version]
  9. García-Martínez, J.; Xiao, C.; Cychosz, K.A.; Li, K.; Wan, W.; Zou, X.; Thommes, M.; García-Martínez, J. Evidence of Intracrystalline Mesostructured Porosity in Zeolites by Advanced Gas Sorption, Electron Tomography and Rotation Electron Diffraction. ChemCatChem 2014, 6, 3110–3115. [Google Scholar] [CrossRef]
  10. Lappas, A.; Tsagrasouli, Z.; Vasalos, I.; Humphries, A. Effect of catalyst properties and feedstock composition on the evaluation of cracking catalysts. Stud. Surf. Sci. Catal. 2001, 134, 71–86. [Google Scholar]
  11. Lappas, A.; Nalbandian, L.; Iatridis, D.; Voutetakis, S.; Vasalos, I. Effect of metals poisoning on FCC products yields: studies in an FCC short contact time pilot plant unit. Catal. Today 2001, 65, 233–240. [Google Scholar] [CrossRef]
  12. Xu, M.; Liu, X.; Madon, R.J. Pathways for Y Zeolite Destruction: The Role of Sodium and Vanadium. J. Catal. 2002, 207, 237–246. [Google Scholar] [CrossRef]
  13. Etim, U.; Bai, P.; Liu, X.; Subhan, F.; Ullah, R.; Yan, Z. Vanadium and nickel deposition on FCC catalyst: Influence of residual catalyst acidity on catalytic products. Microporous Mesoporous Mater. 2019, 273, 276–285. [Google Scholar] [CrossRef]
  14. Fe´ron, B.; Gallezot, P.; Bourgogne, M. Hydrothermal aging of cracking catalysts V. Vanadium passivation by rare-earth compounds soluble in the feedstock. J. Catal. 1992, 134, 469–478. [Google Scholar] [CrossRef]
  15. Vincz, C.; Rath, R.; Smith, G.M.; Yilmaz, B.; McGuire, R., Jr. Dendritic nickel porphyrin for mimicking deposition of contaminant nickel on FCC catalysts. Appl. Catal. A 2015, 495, 39–44. [Google Scholar] [CrossRef]
Figure 1. Interparticle mobility, the tendency to transfer from particle to particle (a); and intraparticle mobility, the tendency to transfer within a particle (b).
Catalysts 09 00831 g001
Figure 2. SEM Images of fluid catalytic cracking (FCC) equilibrium catalysts (Ecats) from a North American Refinery. Clockwise from top left: V (a), Ni (b), Fe (c), and Ca (d).
Catalysts 09 00831 g002
Figure 3. Comparison of “core” and “edge” fraction of particles using core radius value that is 50% of total particle radius (a); and that is 70% of total particle radius (b).
Catalysts 09 00831 g003
Figure 4. From top left, clockwise: Back scattering image (a); particle definition (b); green channel of contaminant (c); and original contaminant image (d).
Catalysts 09 00831 g004
Figure 5. Clockwise, from top left: Inner particle (a); outer particle (b); outer contaminant (c); and inner contaminant (d).
Catalysts 09 00831 g005
Figure 6. Comparison of Manual and ImageJ PDI values.
Catalysts 09 00831 g006
Figure 7. Distribution of edge measurements of Ni and V used to determine interparticle mobility.
Catalysts 09 00831 g007
Table 1. Peripheral Deposition Index (PDI) values corresponding to Ecat samples from three refineries.
RefineryAlVNiFeCa
A1.00.71.72.32.9
B1.20.91.51.93.5
C1.11.03.52.3n/a
Average1.10.92.22.23.2
Table 2. Interparticle Mobility Index (IMI) values of corresponding to Ecat samples from three refineries.
RefineryAlVNiFeAdded FeCa
D1.11.42.21.62.2n/a
E1.21.61.91.92.13.0
F1.01.62.51.42.73.3
Average1.11.52.21.62.33.2

