The Use of Power Ultrasound for the Production of PEMFC and PEMWE Catalysts and Low-Pt Loading and High-Performing Electrodes


Hydrogen Energy and Sonochemistry Research Group, Department of Energy and Process Engineering, Faculty of Engineering, Norwegian University of Science and Technology (NTNU), NO-7491 Trondheim, Norway
Catalysts 2019, 9(3), 246; https://doi.org/10.3390/catal9030246
Submission received: 30 January 2019
/
Revised: 23 February 2019
/
Accepted: 5 March 2019
/
Published: 7 March 2019
(This article belongs to the Special Issue Catalysts for Polymer Membrane Fuel Cells)
Abstract
:This short review paper highlights some of the research works undertaken over the years by Pollet’s research groups in Birmingham, Cape Town, and Trondheim, in the use of power ultrasound for the fabrication of low temperature fuel cell and electrolyzer catalysts and electrodes. Since the publication of ‘The use of ultrasound for the fabrication of fuel cell materials’ in 2010, there has been an upsurge of international interest in the use of power ultrasound, sonochemistry, and sonoelectrochemistry for the production of low temperature fuel cell and electrolyzer materials. This is because power ultrasound offers many advantages over traditional synthetic methods. The attraction of power ultrasound is the ability to create localized transient high temperatures and pressures, as a result of cavitation, in solutions at room temperature.
1. Introduction
The world is unanimous in the attempt at reducing carbon emissions by 30–40% by 2030 and completely by 2050 whilst increasing energy efficiency. Hydrogen energy is one of the many solutions for reducing greenhouse gases (GHG) and particulate emissions as long as it is produced from renewable energy via, for example, the use of cost-effective and efficient electrolyzers [1].
Fuel cells and electrolyzers, and particularly Proton Exchange Membrane Fuel Cells (PEMFCs) and Proton Exchange Membrane Water Electrolyzers (PEMWEs), are currently evolving to be one answer to consumer demand for energy and fuel replacement, increased power, and current environmental issues [1]. A PEMFC is an electrochemical device that transforms the chemical energy of a fuel (hydrogen) into electrical energy, when reacting with an oxidant (air or oxygen) in the presence of a catalyst (usually a Platinum Group Metal—PGM); whilst a PEMWE breaks down water into hydrogen (cathode) and oxygen (anode) in the presence of PGMs. The heart of a PEMFC and a PEMWE—the Membrane Electrode Assembly (MEA)—is an essential component for the functioning of the electrochemical devices as it is where reactions occur at the two electrodes (anode and cathode).
It is currently accepted in the hydrogen and fuel cell technology (HFCT) market that PEMFCs and PEMWEs will play an important role in the sustainable growth of the global industries through transportation (passenger vehicles: cars, buses, trains, and airplanes), stationary (combined heat and power—CHP and uninterrupted power system—UPS) and portable (mobile phones, tablets, laptops, etc.) applications. Although PEMFCs and PEMWEs have been widely and extensively researched and developed throughout the last decade, there are many existing issues required to be overcome. For example, high costs of components, sub-components, and systems need to be reduced (ca. 30%) to achieve competitive price levels, increased reliability, and durability before they can be successfully commercially deployed and publicly accepted. One of the major issues is due to the MEA being made of costly precious-metal catalysts (e.g., Ir, Pt, Rh, Ru, Pt-Ru, Pt-Rh, IrO2) and the relatively high cost of producing and processing MEAs. The use of precious or noble metal PGM as a catalyst in PEMFC and PEMWE systems leads to a significant increase in the overall cost of the system. Furthermore, there is possibility of PGM deposits becoming scarce in the years to come [1]. For clarification, in the PEMWE industry, Pt is no longer the critical PGM catalyst for the hydrogen evolution reaction (HER) and carbon is no longer a preferential catalyst support material, however in some industrial cases and for R&D purposes, Pt/Vulcan XC72 carbon is still employed [2,3,4,5,6].
In the PGM-based catalyst layer of a conventional PEMFC and PEMWE, the simultaneous access of the PGM nanoparticle by the electron conducting medium and the proton-conducting medium is achieved via a skillful blending of the PGM-supporting carbon or metal oxide particles and proton-conducting polymer [4,5,6]. However, even with the most advanced traditional electrode preparation, a significant portion of the PGM is isolated from the external circuit and/or the PEMFC and the PEMWE, resulting in the low PGM utilization. For example, PGM utilization in current commercially offered prototype low-temperature PEMFC remains very low (20–40%), although higher performance has been achieved in laboratory devices [2,3].
In the case of PEMFC, one of the many challenges is to overcome the kinetic limitations of the oxidation reduction reaction (ORR) in the cathode, which has led to three fundamental problems. Firstly, the substantial overpotential for the ORR at practical operating current densities reduces the theoretical thermal efficiency from ~80% down to ~40%. Secondly, an approximately 5- to 10-fold reduction of the amount of Pt in current PEMFC stacks (0.4–0.5 mgPt cm−2MEA) is needed to meet the cost requirements for demanding applications. For example, the US Department of Energy (DoE) target for the Pt loading in the cathode of MEAs for automotive applications is 0.1 mgPt.cm−2MEA. Finally, the dissolution and/or loss of Pt surface area in the cathode must be greatly reduced [2].
In the automotive sector, the major issue still remains the high intrinsic cost of Pt. Current state-of-the-art technology MEAs have a total Pt loading of about 0.40 mg Pt cm−2, i.e., to ∼0.05 and ∼0.35 mg Pt cm−2 of Pt catalyst is used on the anode (hydrogen oxidation reaction—HOR) and on the cathode (ORR) respectively. A typical Pt loading for an automotive 100 kW PEMFC stack is ∼30 g Pt per kW. In the case of MEAs for PEMWEs, the PGM loadings are typically 0.1–1 mg cm−2 at the cathode and 0.3–3 mg cm−2 at the anode [2,7,8,9]. It is therefore required to drastically reduce the amount of Pt to meet the Pt loadings in current automotive catalytic converters, i.e., 3–10 g, in other words, up to a 10-fold reduction.
Thus, from a PGM point of view, it is therefore important to research and develop (i) Non-Precious Metal Catalysts (NPMC) for PEMFC and PEMWE or (ii) novel and cost-effective deposition processes for the fabrication of (ultra-)low PGM loading, low-cost, highly efficient, and durable Proton Exchange Membrane (PEM) fuel cell and PEM water electrolyzer MEAs, in turn lowering manufacturing costs [2,3,4,5,6,7,8,9,10,11,12,13,14].
There are many well-described methods detailing the catalyst ink (Pt/C mixed with a solubilized polymer electrolyte and a solvent) deposition onto the gas diffusion layer (GDL) and the polymer electrolyte membrane (PEM) yielding GDEs (gas diffusion electrodes) and CCMs (catalyst coated membranes), respectively. The most common methods used for the production of PEMFC and PEMWE electrodes are by either the decal, blade process, screen-printing, painting, spraying, electro-spraying, or electrophoretic methods [3]. However, the main disadvantages of these methods are as follows: (i) most of the time an oxidative treatment (e.g., heating) is required to ‘clean’ the PGM nanoparticles caused by chemical contamination, (ii) PGM nanoparticles’ surface structure and surface morphology are affected by the treatments, and (iii) Triple-Phase Boundary (TPB) often possesses inactive PGM sites for electrocatalysis [2,8,9,13]. For further information on the deposition techniques, the reader may be invited to consult the excellent overviews of fuel cell electrode fabrication methods by Litster and McLean [3] and Wee et al. [14].
One of the many routes to maximize PGM utilization in the catalyst layer is to employ highly efficient stirring or forced convection in the form of power ultrasound. Fairly recently, Pollet showed [11] that ultrasound can be employed for producing precious metal catalysts as low-temperature PEMFC and PEMWE materials. In his comprehensive review [15], Pollet clearly demonstrated that the ultrasonication, sonochemical, and sonoelectrochemical methods can be employed for the production of efficient catalyst nanoparticles, carbon-supported electrocatalysts, and fuel cell and electrolyzer electrodes due to the ‘extraordinary’ experimental conditions due to the enhanced mass transport phenomenon, cavitation, and water sonolysis [15,16,17].
2. Power Ultrasound, Sonochemistry, and Sonoelectrochemistry
2.1. Power Ultrasound
In biochemistry, ultrasound is commonly employed for the disruption of living tissues (including cells) and natural plants in order to extract effectively important constituents. Ultrasound is usually defined as a sonic wave with a frequency above 16 kHz with the upper limit usually taken to be 5 MHz for gases and 500 MHz for liquids and solids, as shown in Figure 1 [16,17]. Power ultrasound can be regarded as the effect of the sonic wave on the medium, i.e., the application of low-frequency high-energy ultrasound in the range 20 kHz–2 MHz. When power ultrasound is used in liquid systems, it causes (i) an area of extreme ‘mixing’ close to the ultrasonic transducer (source); (ii) degassing; (iii) surface cleaning, pitting, and erosion; and (iv) a substantial increase in bulk temperature, as shown in Figure 2 [16,17].
2.2. Sonochemistry
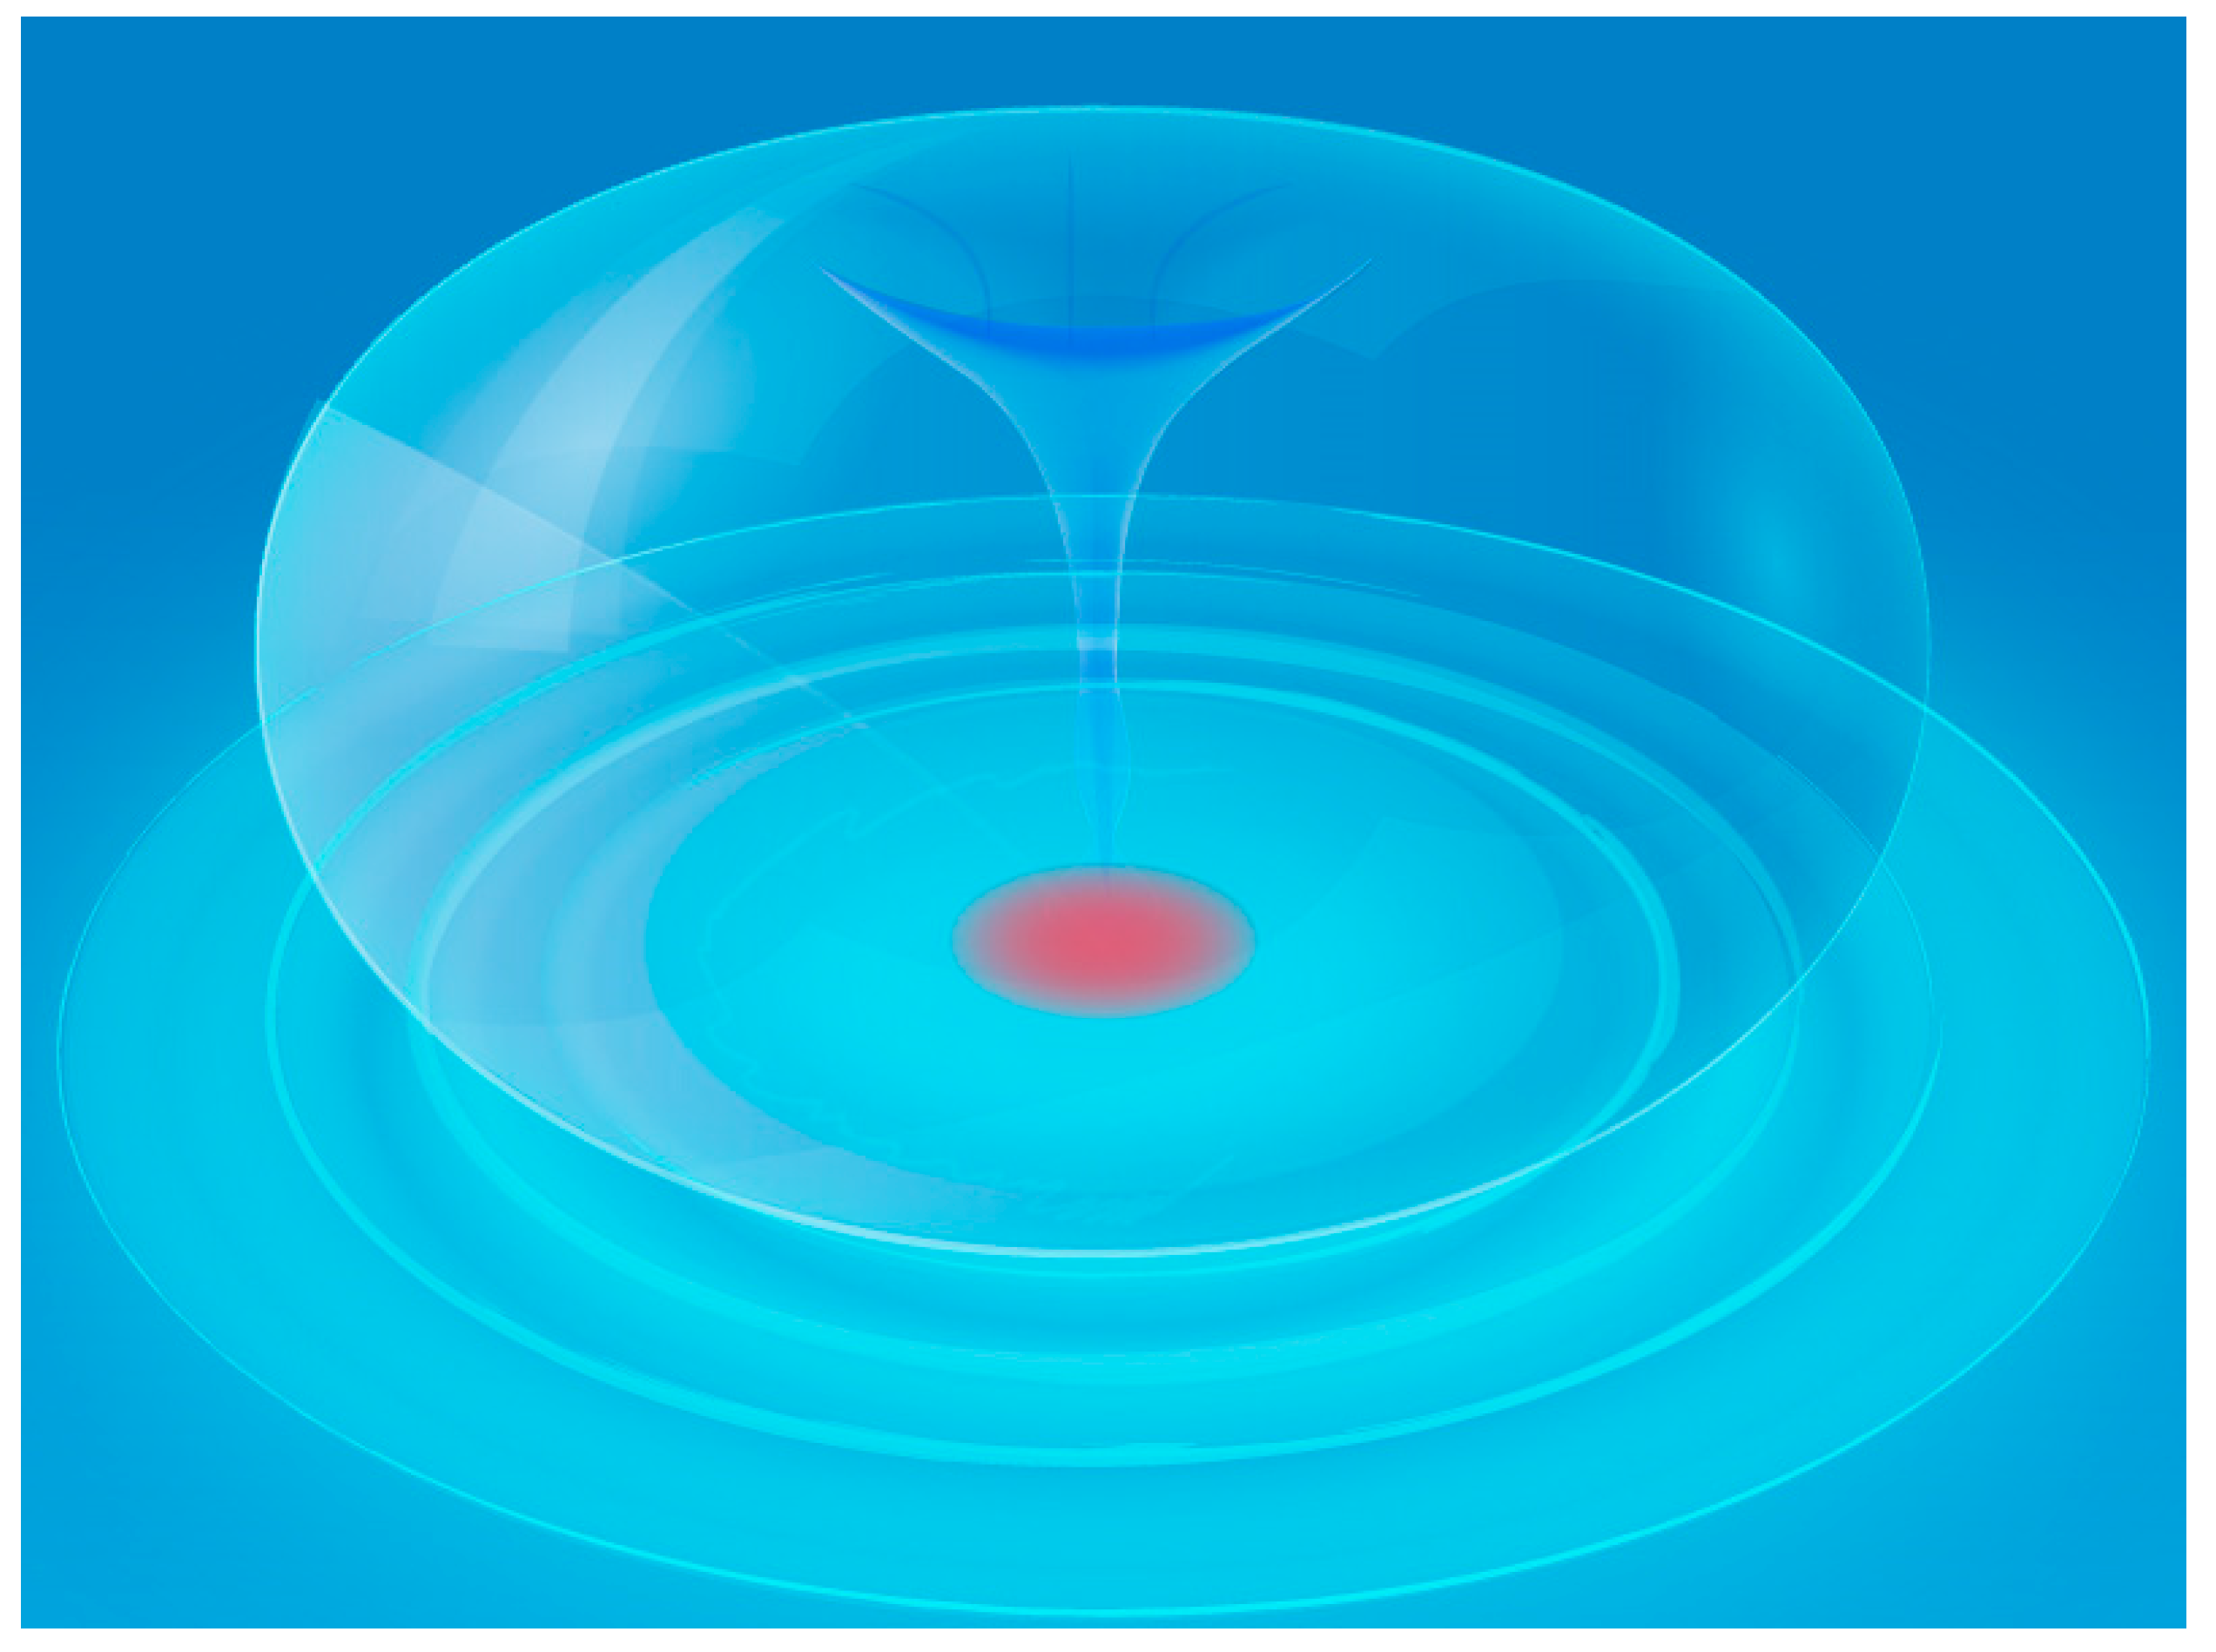
Power ultrasound has been used in many applications such as the chemical and processing industries where it is employed to improve both catalytic and synthetic processes and to produce new chemicals. This technology area has been termed sonochemistry, which mainly focusses on chemical reactions in solutions yielding an increase in erosion of catalytic surfaces, reaction kinetics, and product yields [12,13]. Moreover, the most observed effects of power ultrasound on solid surfaces and chemical reactions is known to being due to the ‘cavitation’ effect occurring as a secondary effect when an ultrasonic wave passes through a liquid medium. This process of tearing the liquid apart (i.e., during the continuous compression and rarefaction cycles) is known as ‘cavitation’ and the microbubbles are called ‘cavitation bubbles’, as shown in Figure 3 [16,17]. Most of the time, the cavitation threshold is taken as the limit of sonic intensity below which cavitation does not occur in a liquid.
During the continuous compression and rarefaction cycles, these cavitation bubbles grow, become unstable, and then implode by forming jets of liquid reaching velocities up to 200 m·s−1 leading to mass-transport enhancement, surface cleaning, and surface erosion. Moreover, it has been shown that the cavitation bubble collapse also leads to sonolysis, i.e., the homolytic cleavage of water yielding radical formation HO•, HO2•, and O•, as shown in Figure 4 [15,16,17,18].
2.3. Sonoelectrochemistry
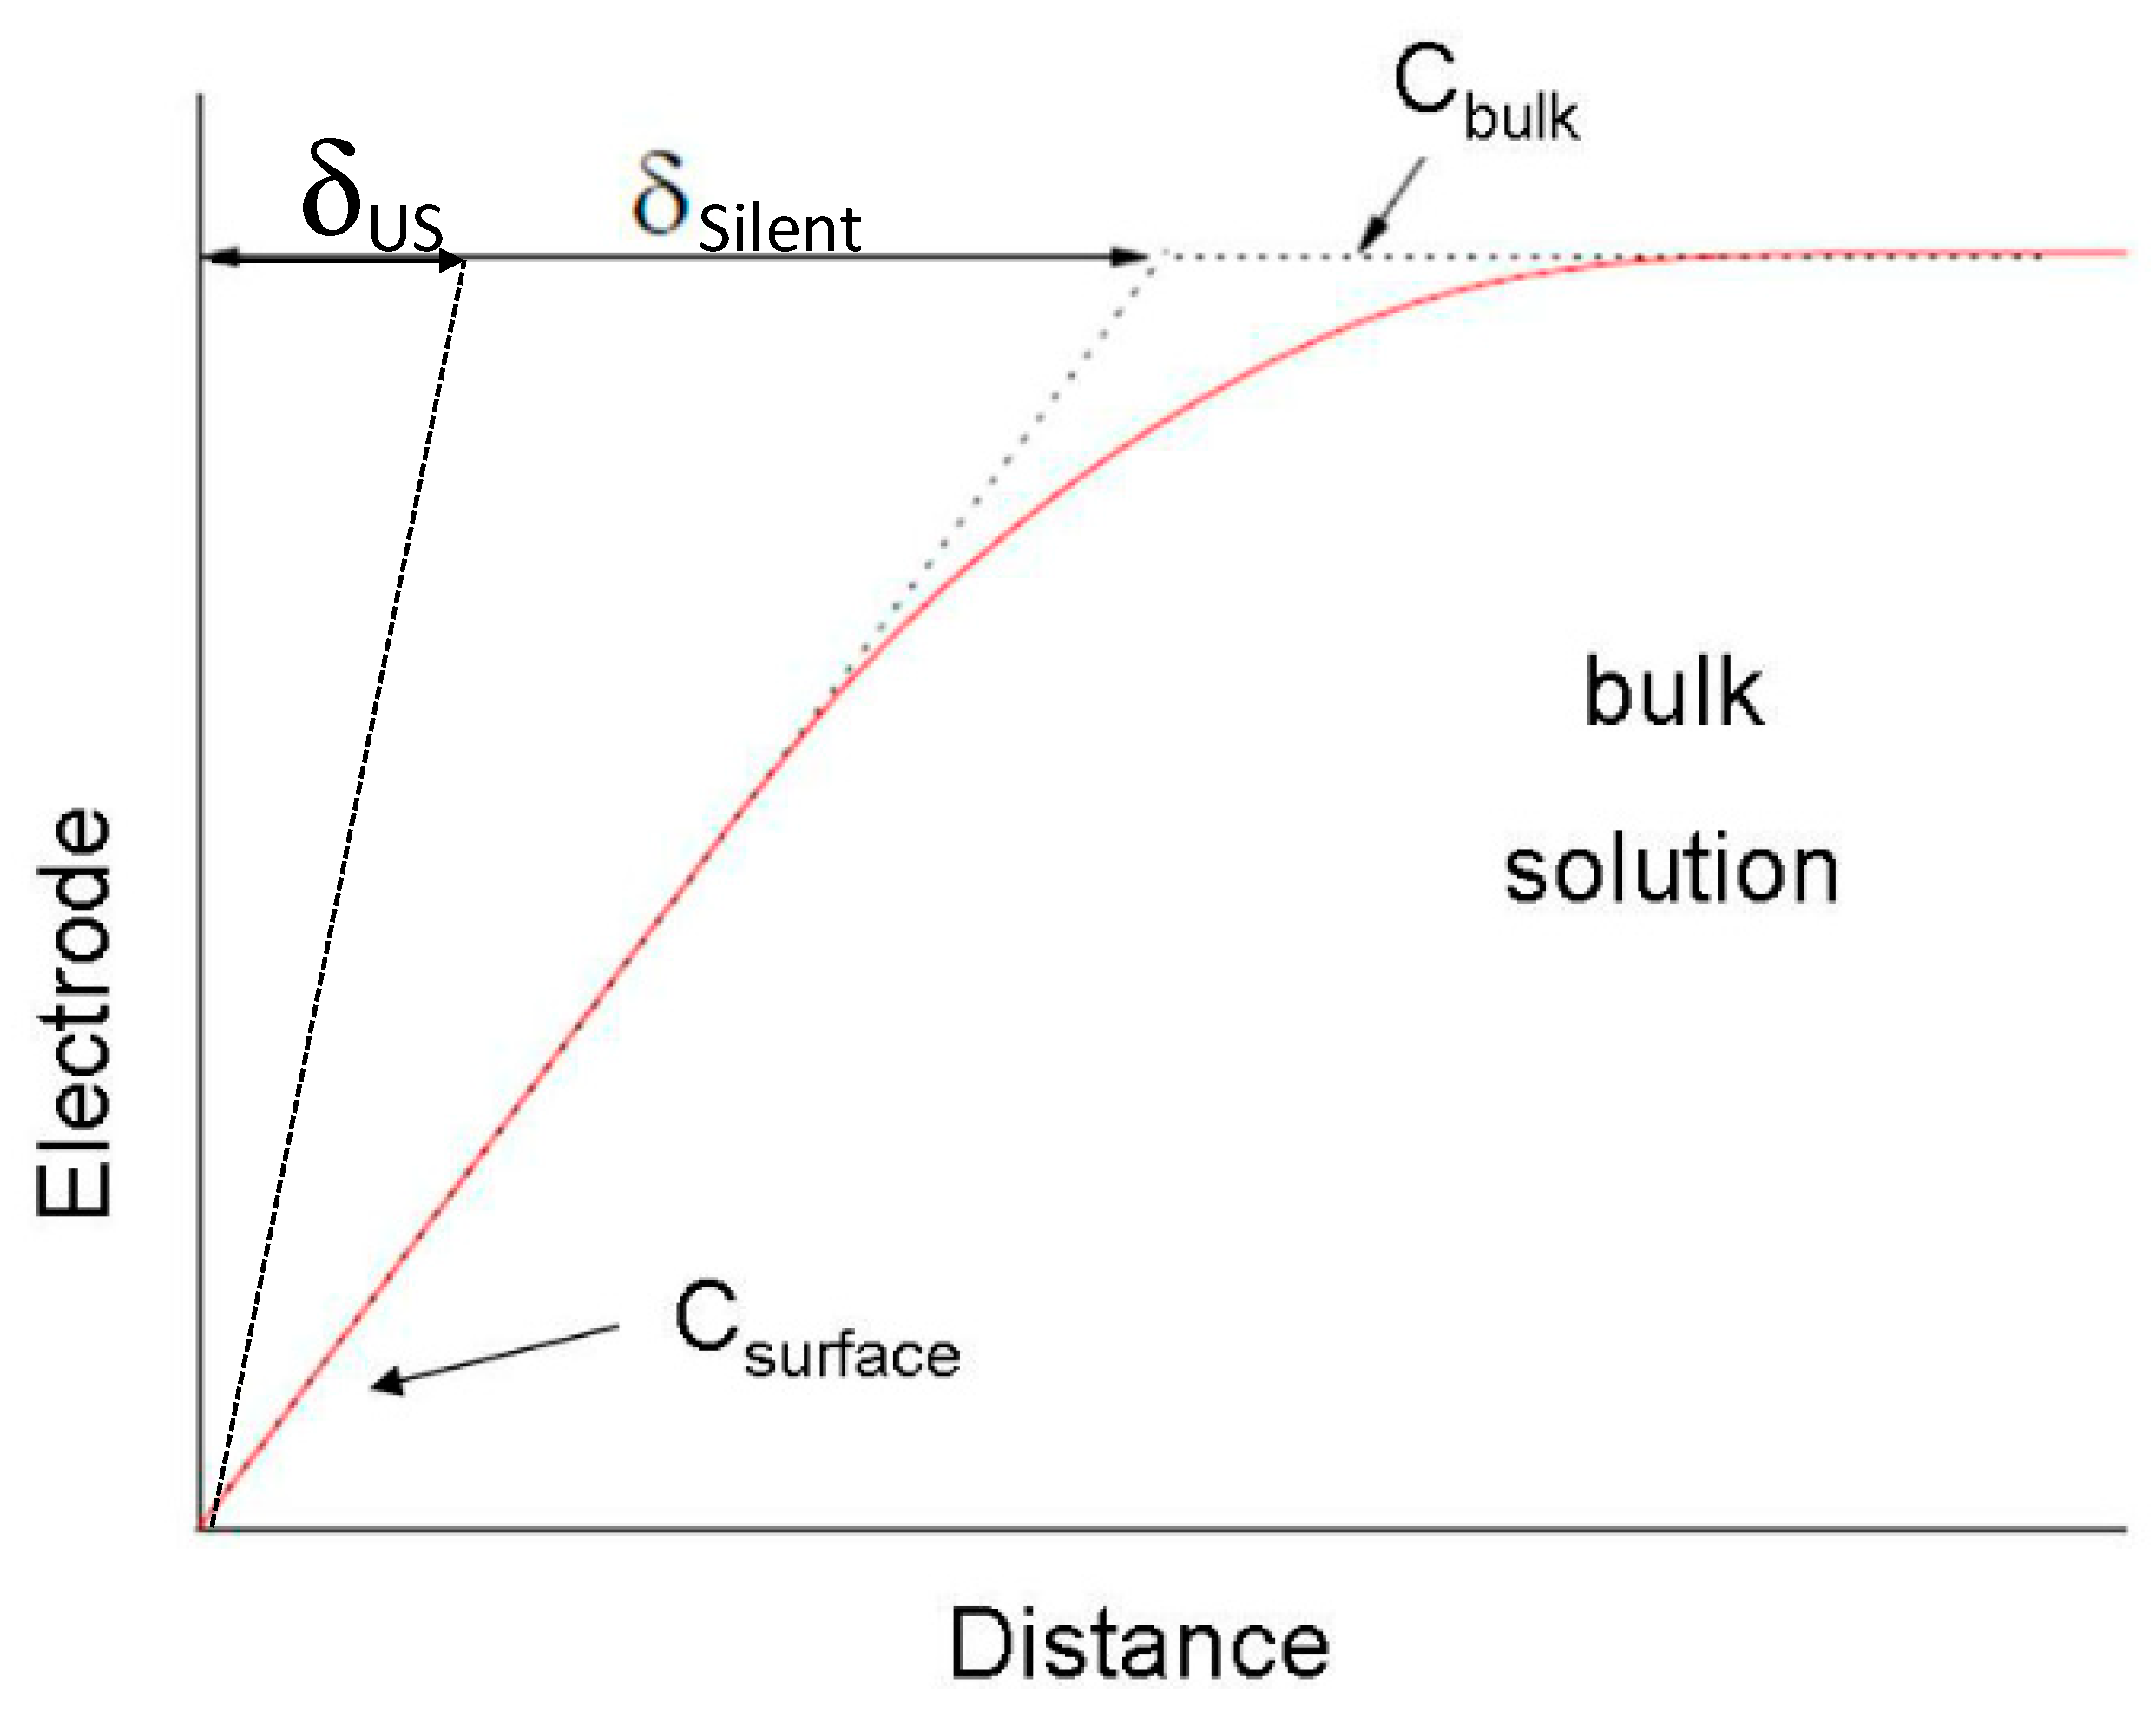
Sonoelectrochemistry is the study of the combination of ultrasound and electrochemical processes and its applications [19]. This area of research covers various studies from organic syntheses, polymeric materials syntheses, production of nanomaterials, environmental (soil and water) treatments, water disinfection, corrosion of metals, analytical procedures, film and membrane preparations to the elucidation of electrochemical mechanisms in various ‘exotic’ solvents (e.g., room temperature ionic liquids and deep eutectic solvents). It is well-known in the area that the main effects of ultrasound in electrochemistry are the increase in mass transfer and heat transfer induced by extreme solution ‘mixing’, a substantial thinning of the diffusion layer thickness (δ) at the electrode surface, as shown in Figure 5, a noticeable decrease in overall cell voltage (Vcell) and electrode overpotential (η), and an observable surface modification due to erosion and pitting. These observations are mainly caused by the implosion of high-energy cavitation bubbles in turn generating high velocity microjets of liquid (up to 200 m·s−1) hitting the electrode surface, as shown in Figure 2, and by acoustic streaming together with microstreaming at or near the electrode surface [17]. Figure 6 shows a short summary of the benefits of ultrasound in electrochemistry [17].
3. Sonochemical and Sonoelectrochemical Fabrication of PEMFC and PEMWE Catalysts
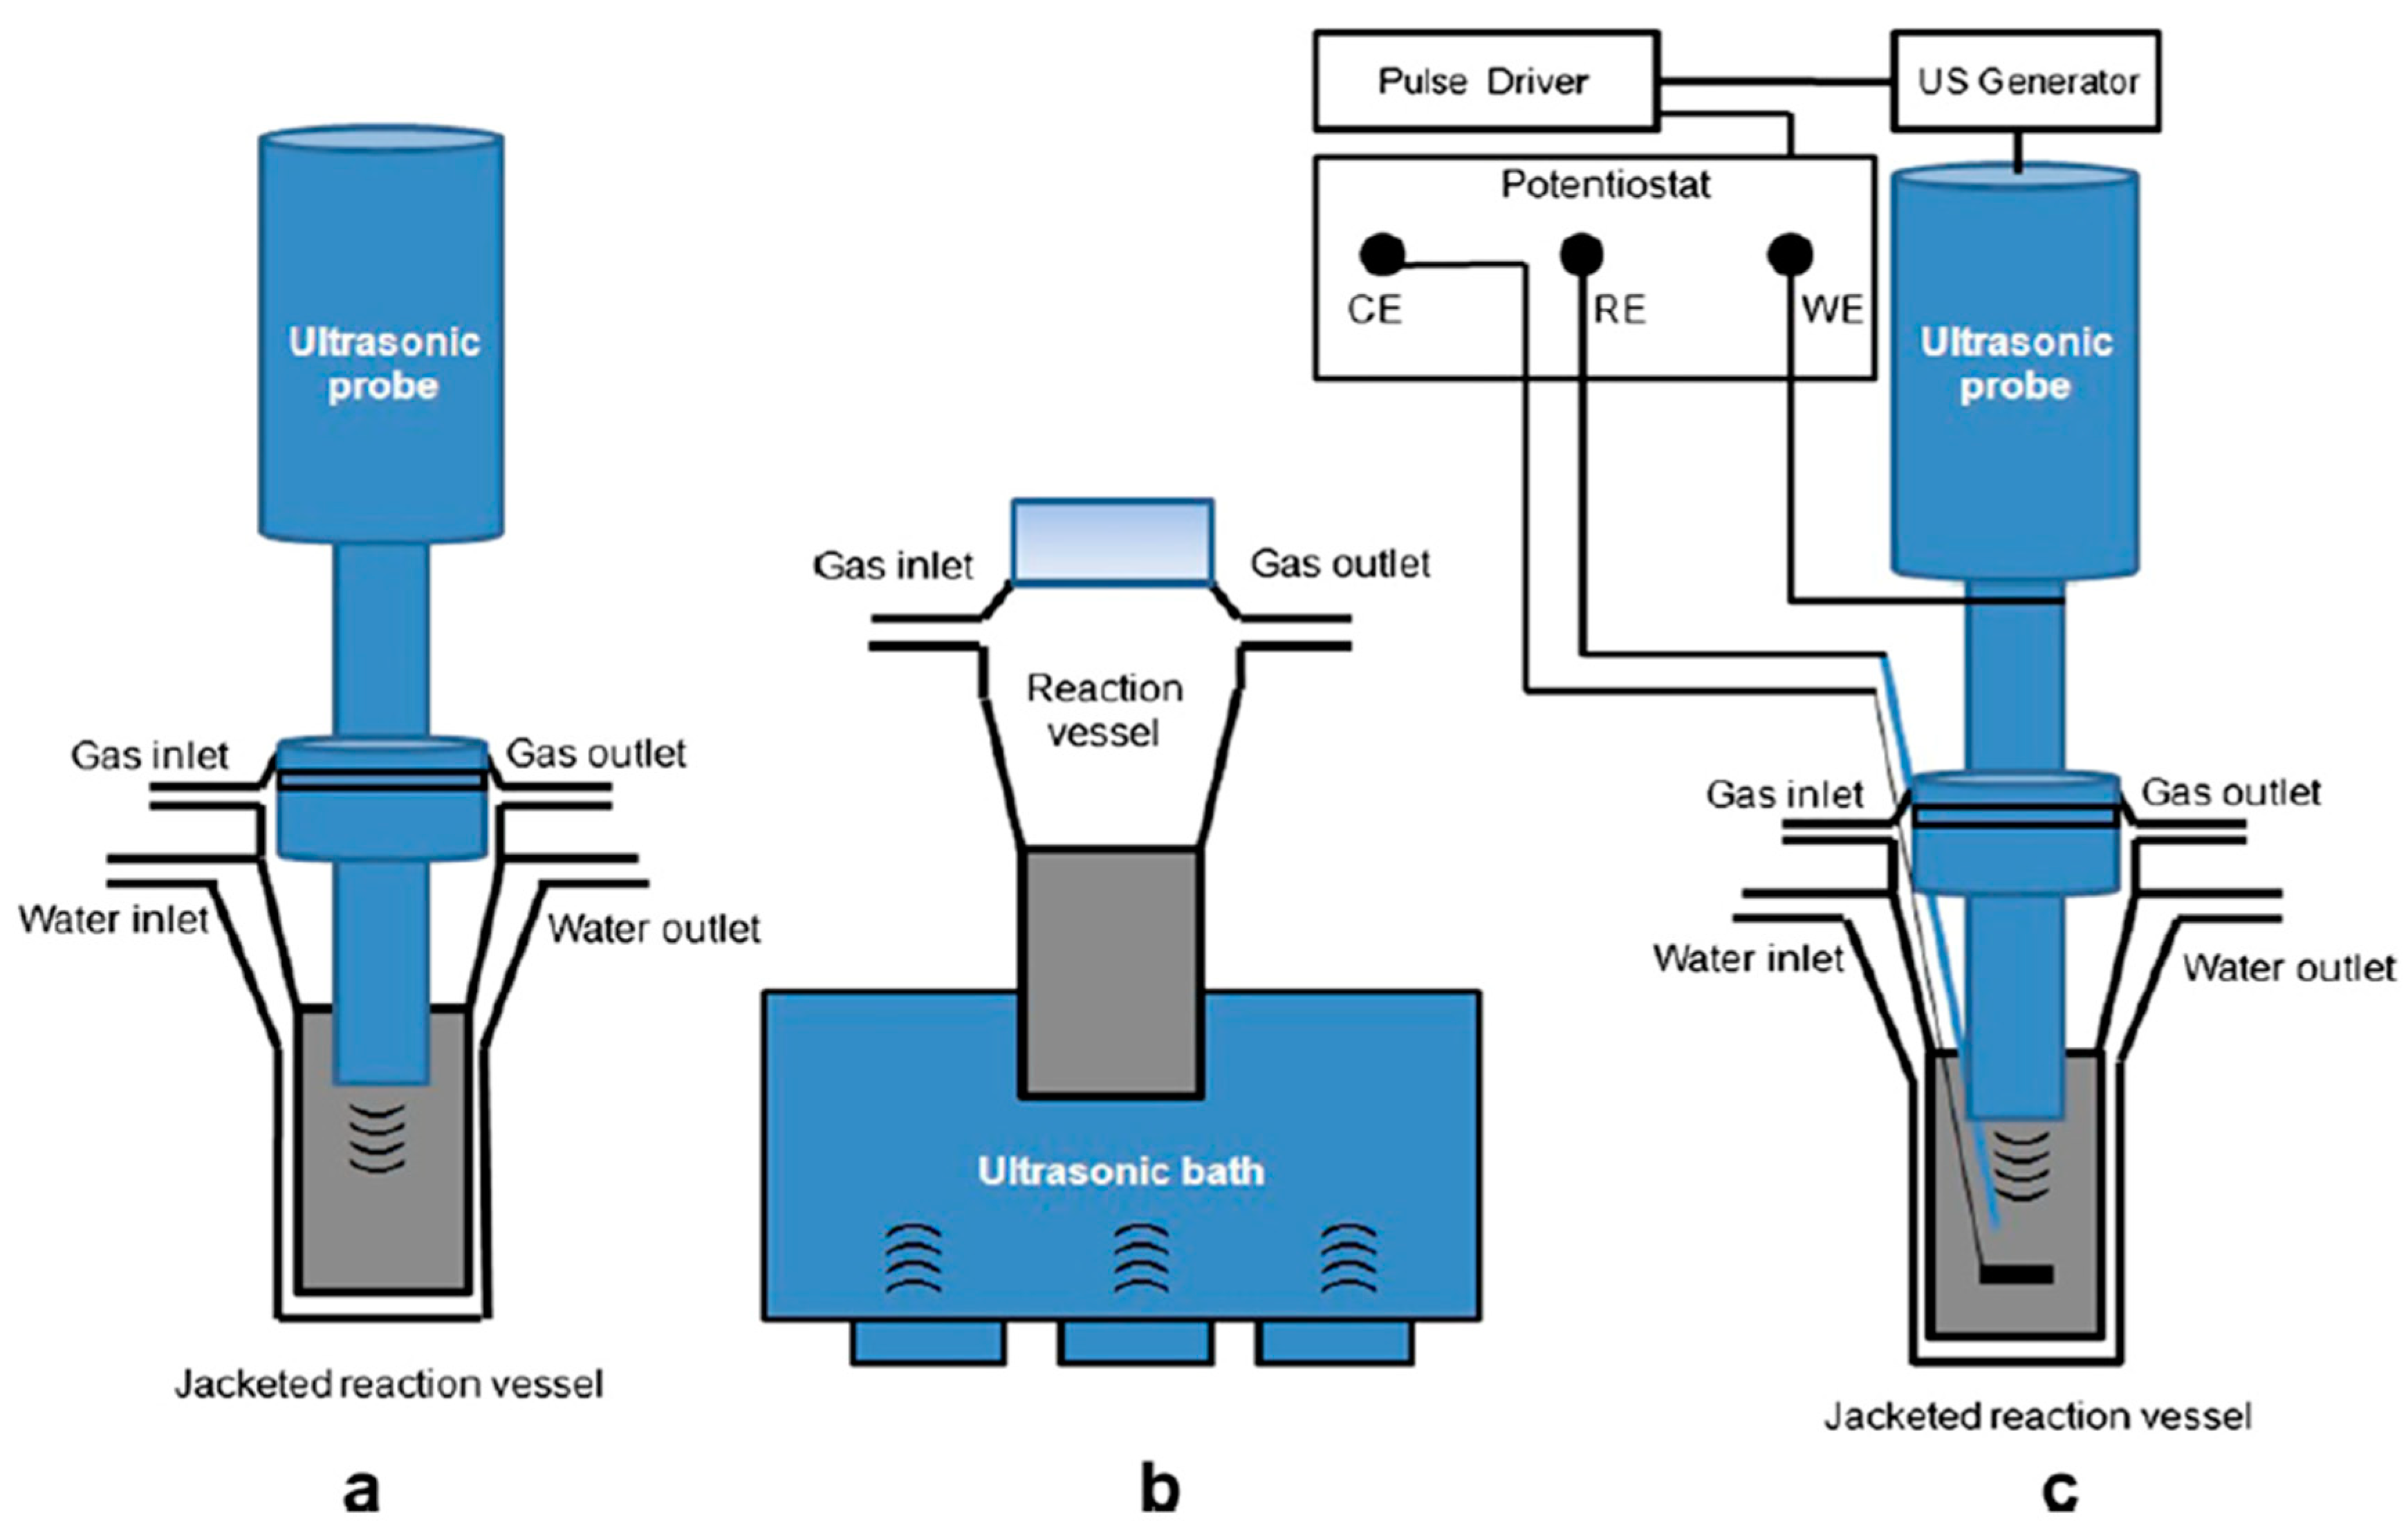
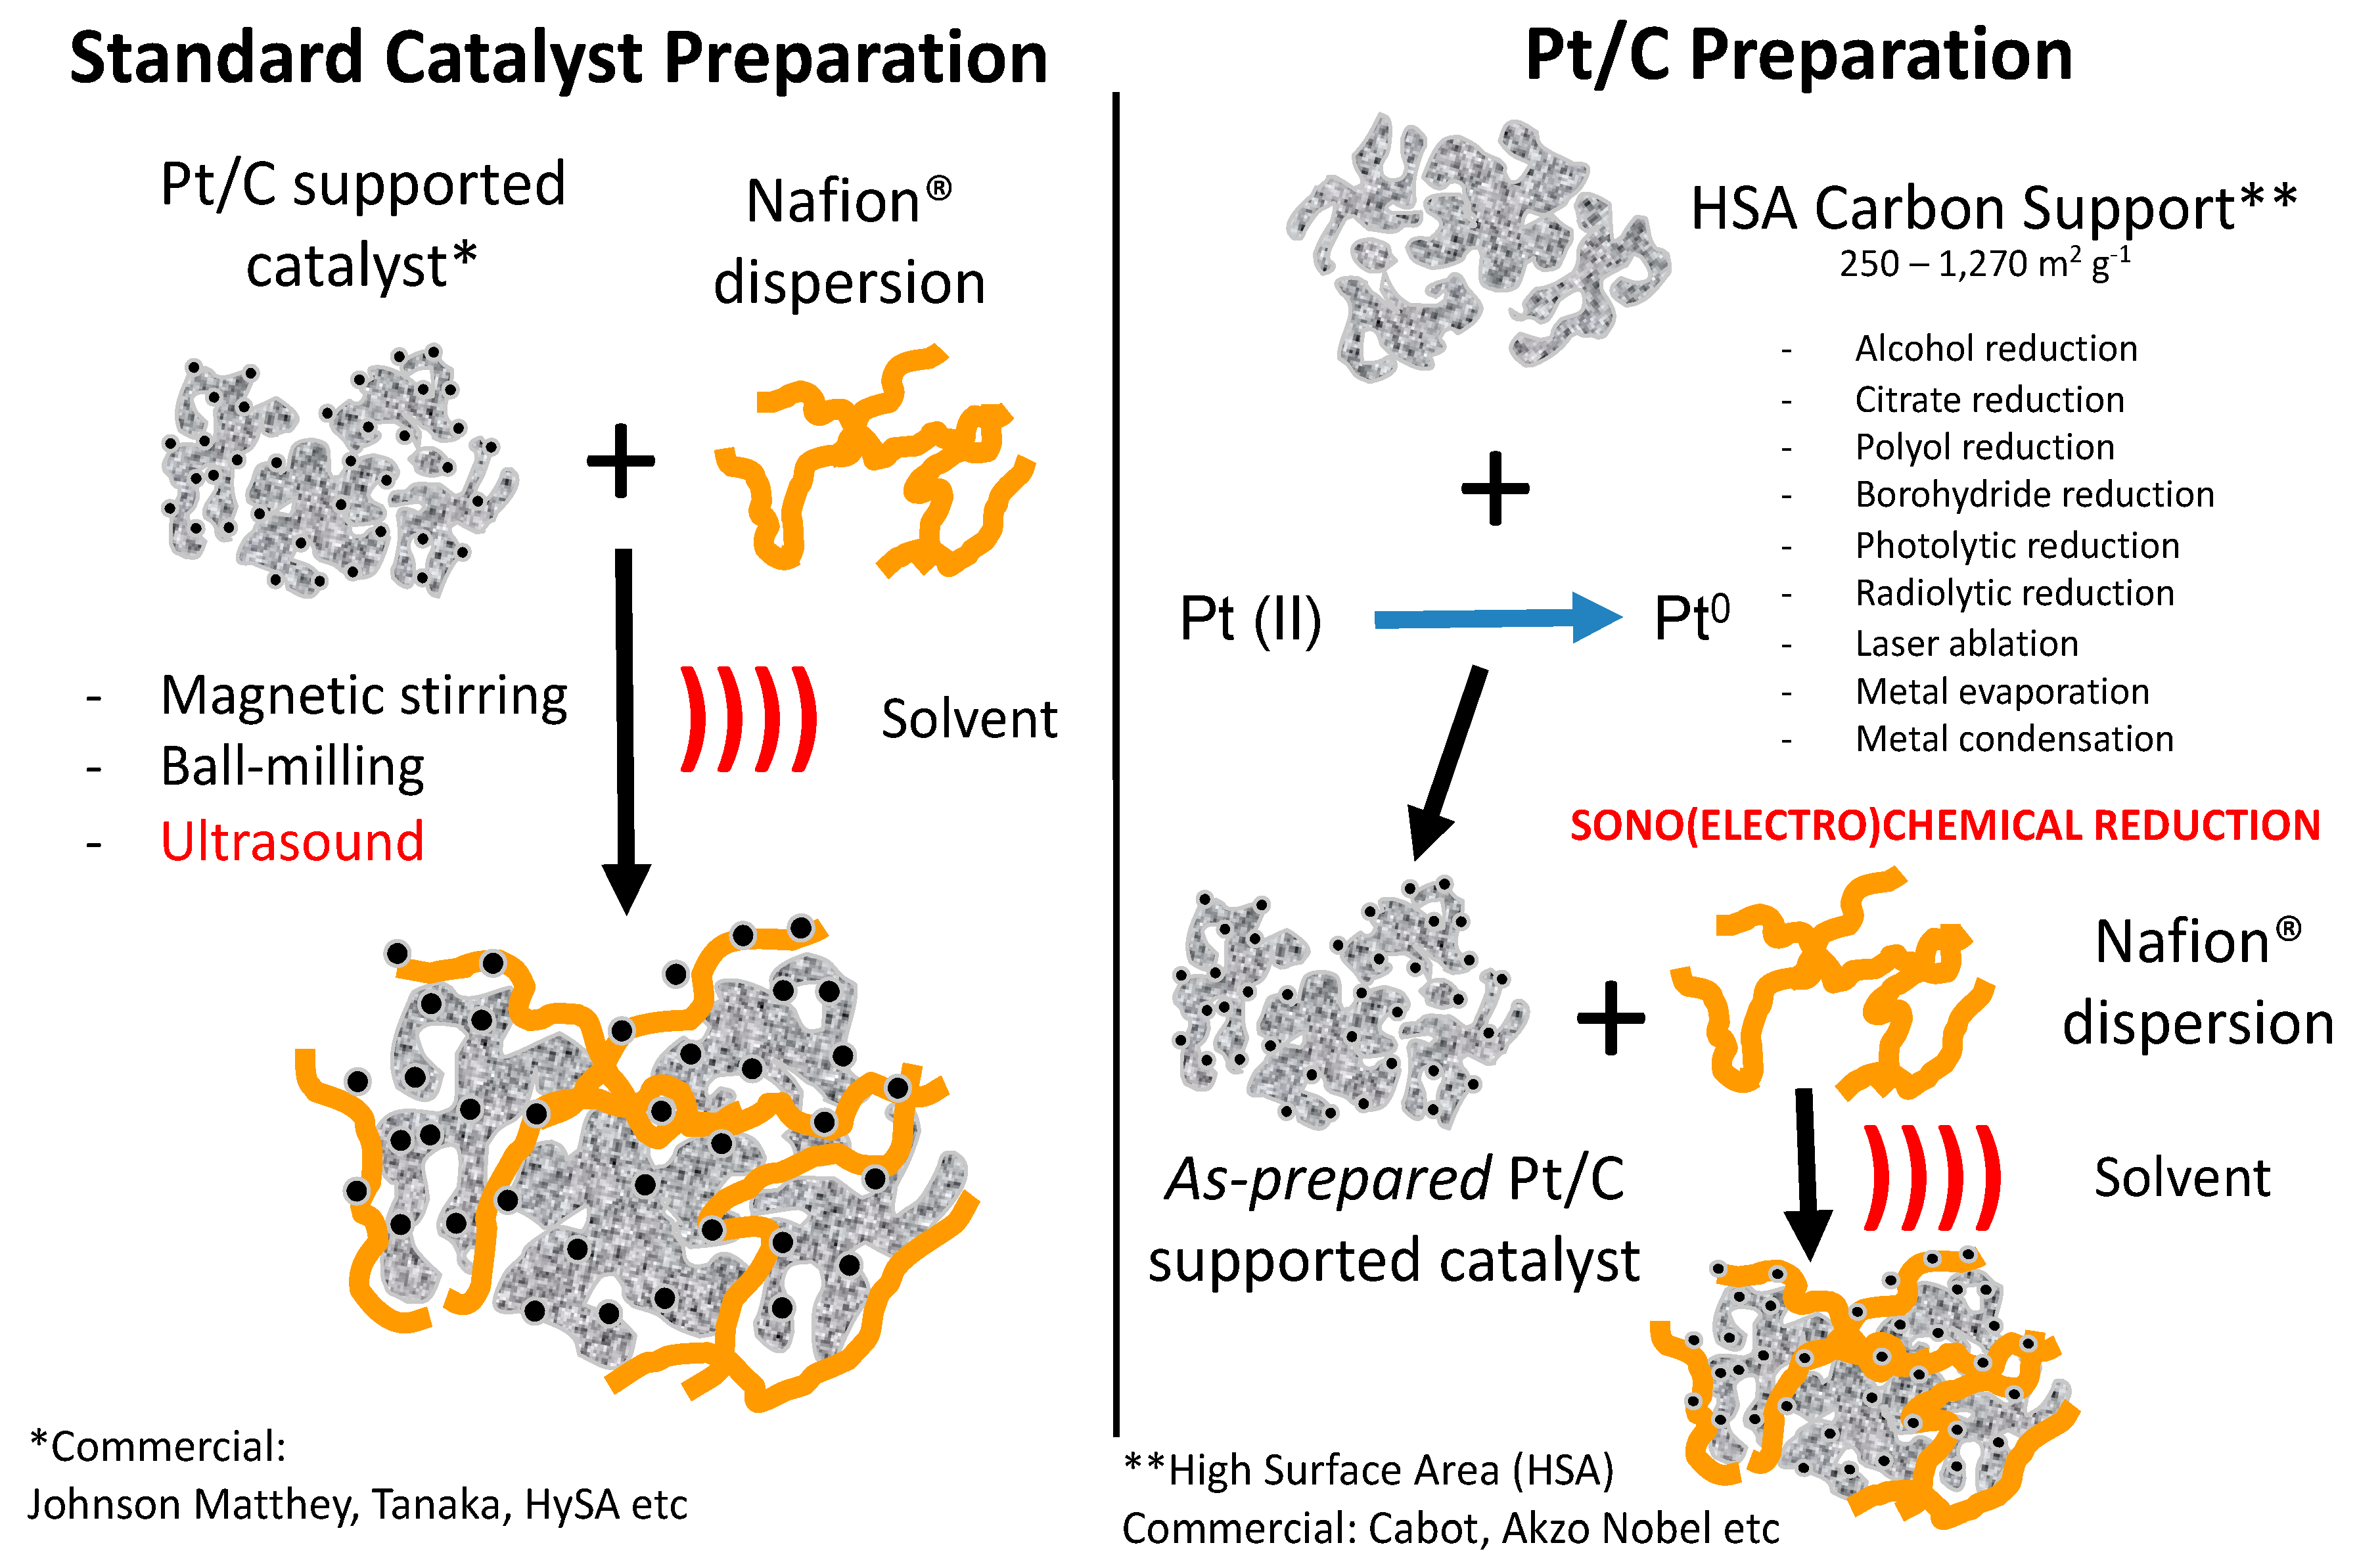
PEMFC and PEMWE strongly depend upon the electrocatalyst material efficiency especially for the ORR, the OER (oxygen evolution reaction), the HOR, and the HER [4,7]. The important mechanism controlling the metallic catalyst is nucleation and growth, depending strongly upon the synthetic routes. Many methods exist for the preparation of catalyst nanoparticles, including alcohol reduction, citrate reduction, polyol reduction, borohydride reduction, photolytic reduction, radiolytic reduction, laser ablation, and metal evaporation condensation [20]. Fairly recently, Pollet showed that it is possible to fabricate catalyst nanomaterials sonochemically by simply using power ultrasound in the form of ultrasonic probes and baths to reduce metallic ions in aqueous solutions in a specially designed experimental setup as shown in Figure 7a,b [15].
3.1. Sonochemical Production of PEMFC and PEMWE Catalysts
In 2010, in his extensive review, Pollet showed that it is possible to employ power ultrasound for the preparation of PEMFC and PEMWE catalysts [15]. The review detailed the ultrasonic, sonochemical, and sonoelectrochemical generation of noble metal electrocatalysts with nanosizes of <10 nm with and without the addition of surfactants and alcohols, as shown in Table 1, carbon supported electrocatalysts, fuel cell electrodes, and membranes. The paper showed that (i) the production of these nanomaterials is mainly attributed to the presence of radical species induced by water sonolysis (caused by cavitation), (ii) the catalyst nanoparticle size depends strongly upon the ultrasonic frequency and irradiation time, surfactant, alcohol, and atmospheric gas types, and (iii) the as-prepared catalyst on carbon nanomaterials leads to excellent electrocatalytic activity due to carbon support surface functionalization and effective dispersion caused by sonication.
In the same review, Pollet proposed a possible general pathway for the sonochemical reduction of PGM salts (e.g., chloroplatinic acid) and proposed a mechanism under ultrasonication [)))] using a specially designed sonoreactor, as shown in Figure 8, as follows [15]:
where RH denotes the radical’s scavenger, acting as protective agent (surfactant or alcohol), R• is the secondary radical, and R’ is the deprotonated form. During sonolysis, water molecules dissociate into hydrogen radicals (H•) and hydroxyl radicals (OH•) according to Equation (1). R’ species are formed by hydrogen abstraction from RH with OH• and H• (Equation (2)) and react with M cations (Mn+) to form metal particles (M°) according to Equations (3) and (4).
3.2. Sonoelectrochemical Production of PEMFC and PEMWE Catalysts
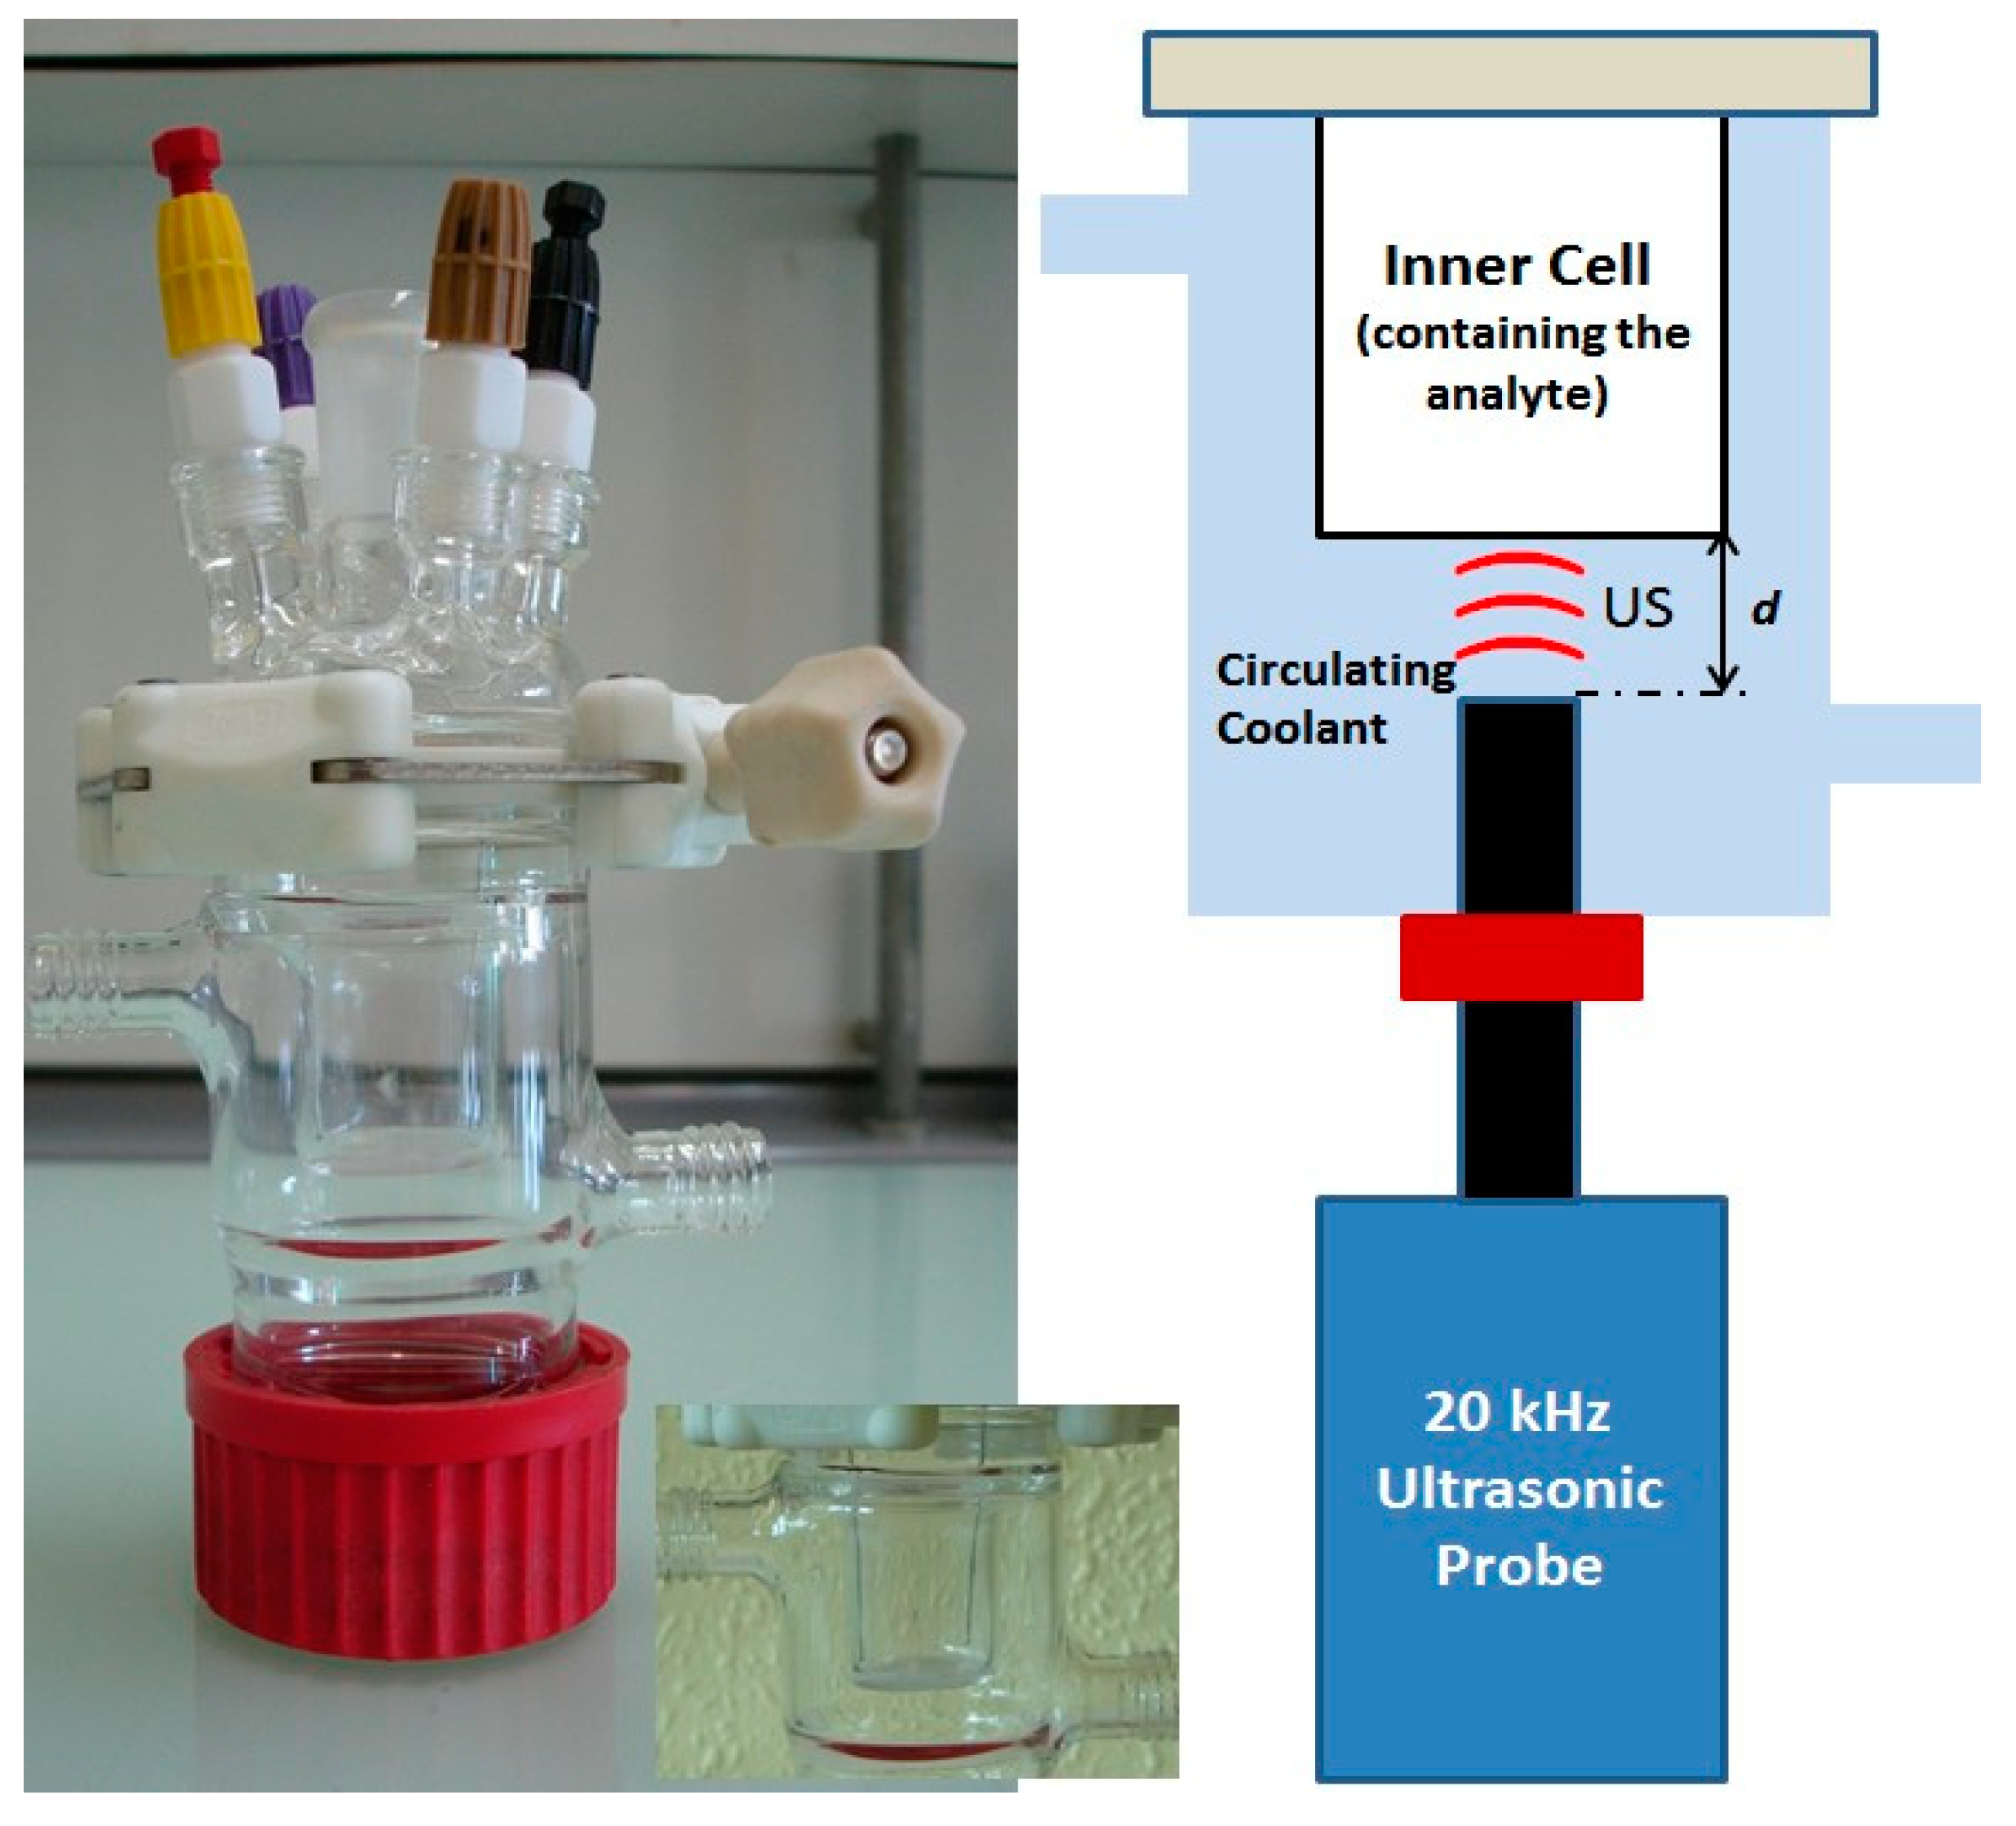
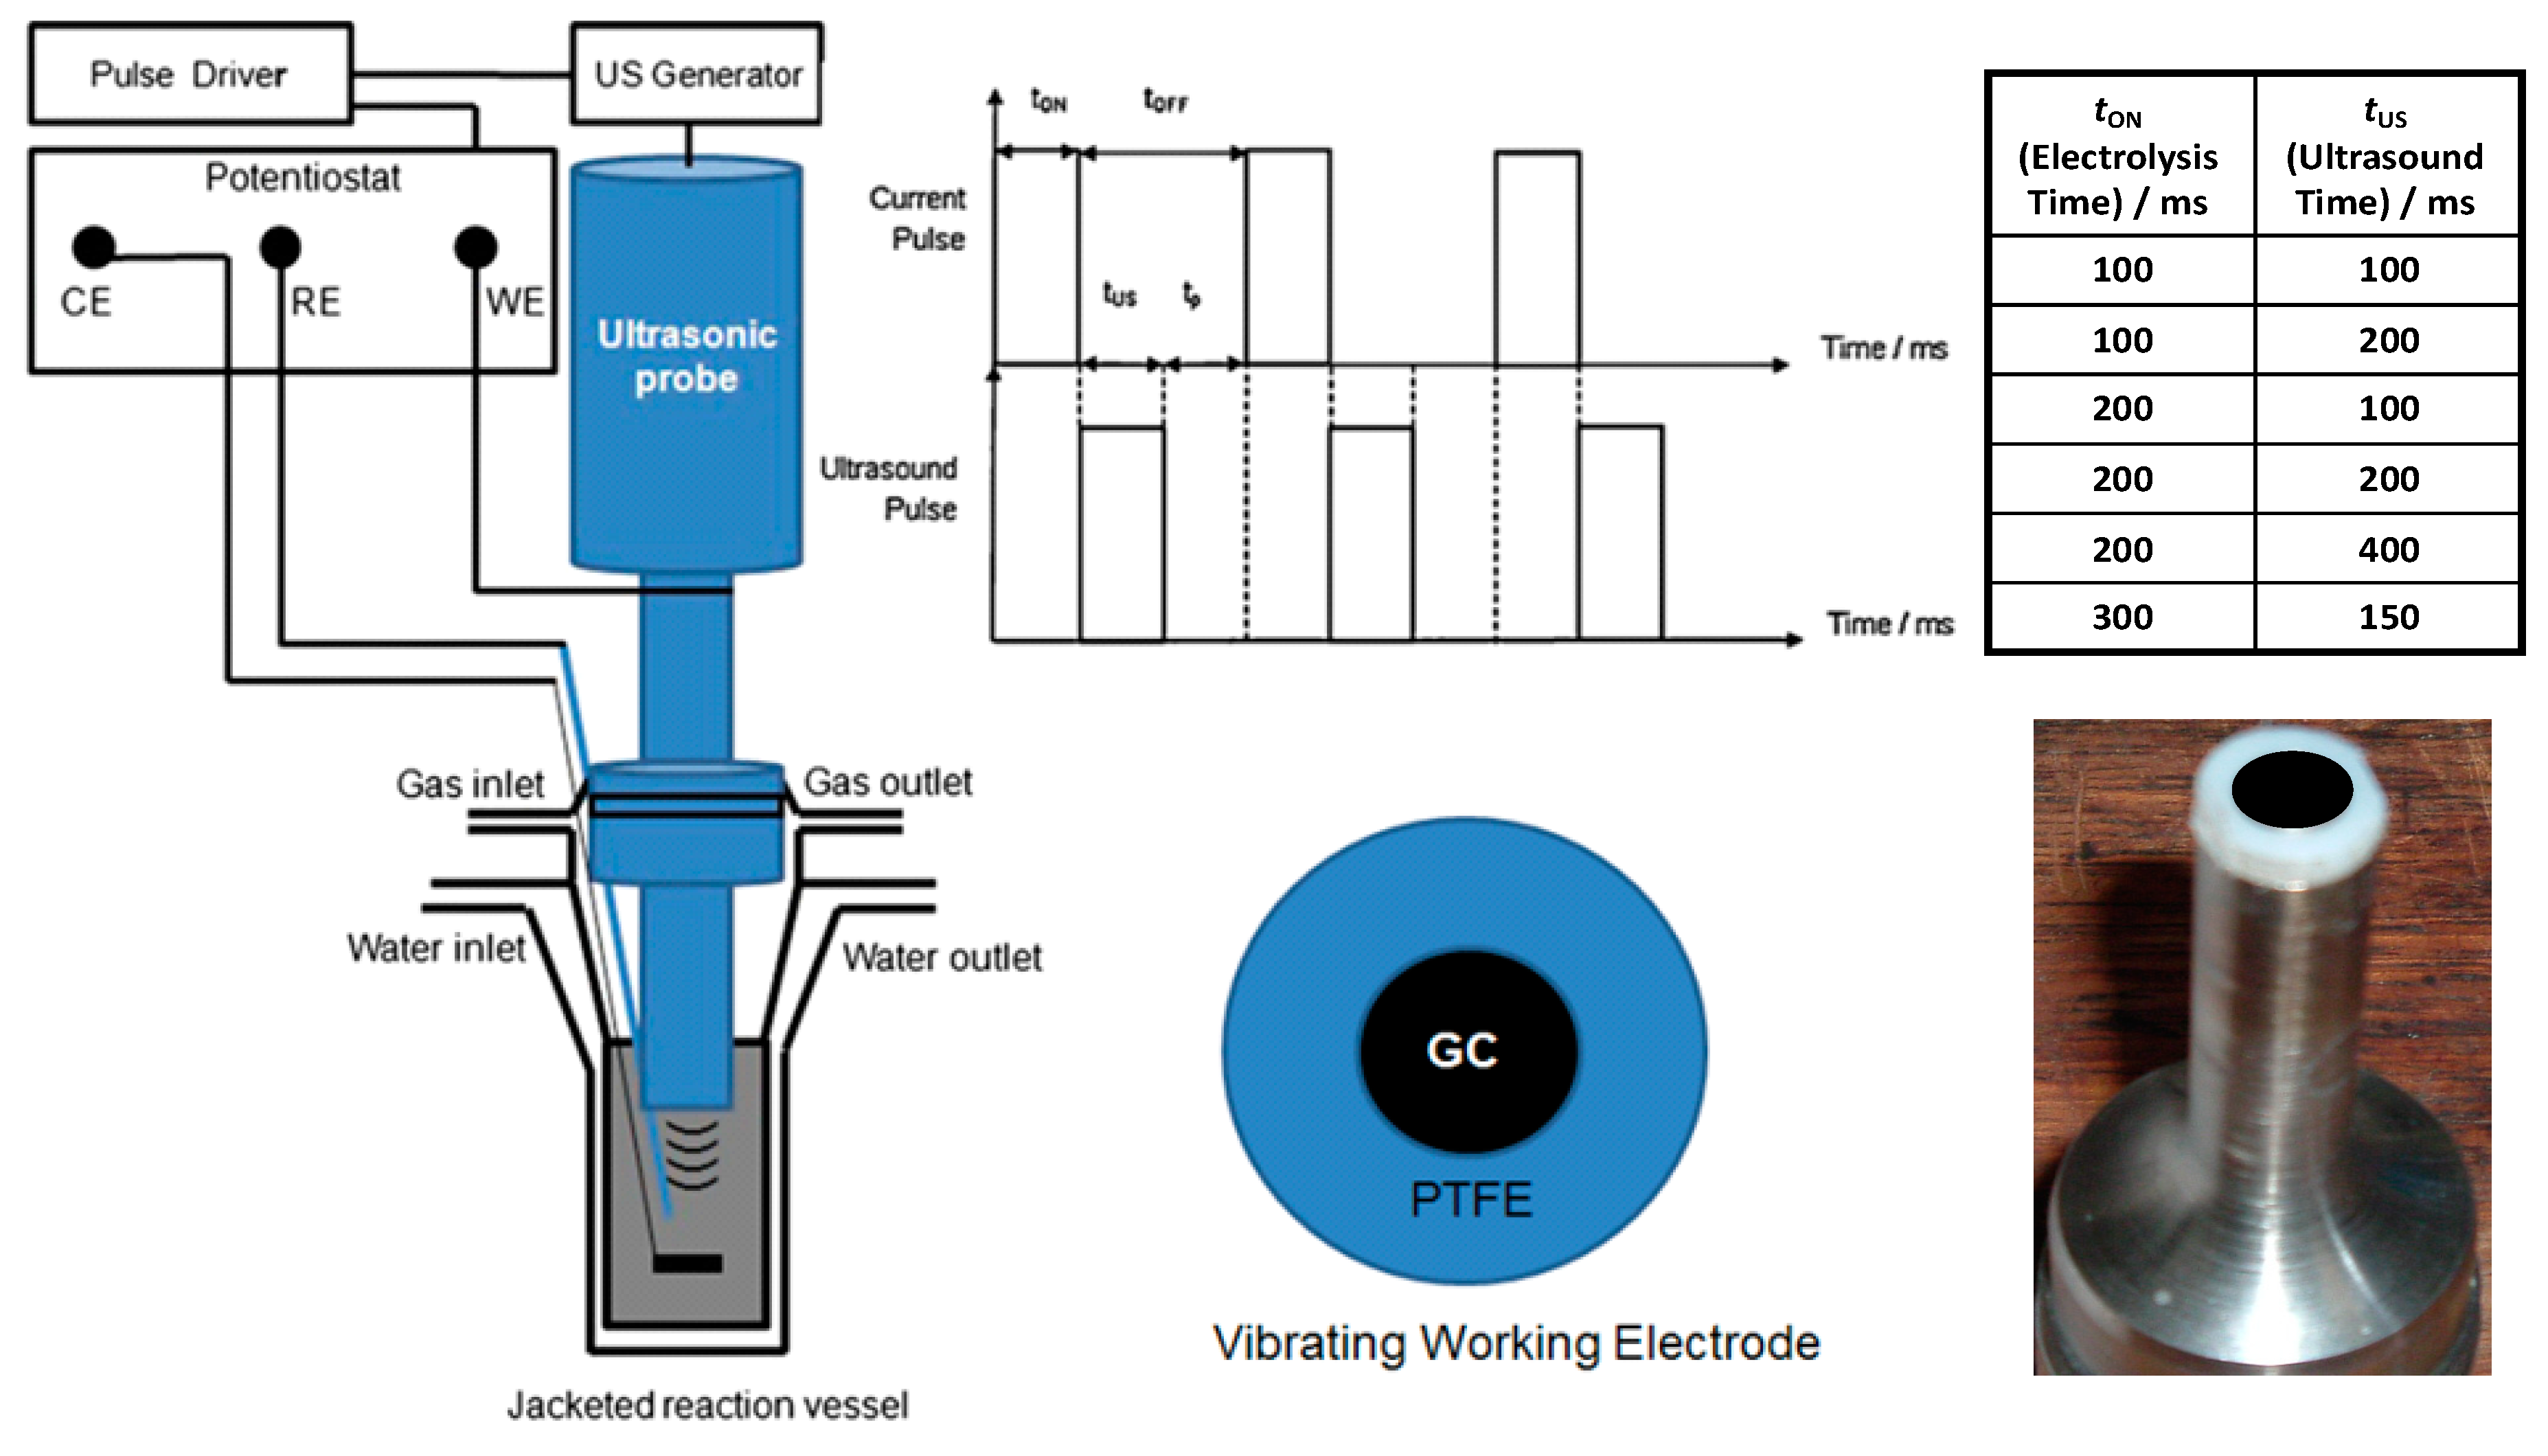
Dabalà et al. [21] demonstrated the production of nanoparticles by sonoelectrochemistry as the technique offers many advantages: (i) great enhancement in mass-transport near the electrode, thereby altering the rate, and sometimes the mechanism, of the electrochemical reactions; (ii) modification of surface morphology through cavitation jets at the electrode–electrolyte interface, usually causing an increase of the surface area; and (iii) reduction of the electrode diffusion layer thickness and therefore ion depletion. Zin, Pollet, and Dabalà [22] modified Reisse’s original setup by only using the vibrating tip of the ultrasonic probe as the cathode—‘sonoelectrode’, as shown in Figure 9. The setup exposes only the flat circular area at the end of the ultrasonic vibrating tip to the electrodeposition electroanalyte solution. The tip acts as both the cathode and the ultrasonic vibrating emitter. A short pulse of galvanostatic (electrolysis) current reduces many metallic ions (Mn+ e.g., Pt2+ or Pt4+) at the cathode, forming a high density of fine metallic nuclei and nanoparticles. This short electrodeposition current pulse is immediately followed by a very short burst of power ultrasound (e.g., 20 kHz) that removes the metallic nanoparticles from the vibrating cathode, cleans the cathode surface, and replenishes the double layer with fresh metallic ions by highly efficient stirring of the electroanalyte solution (see earlier).
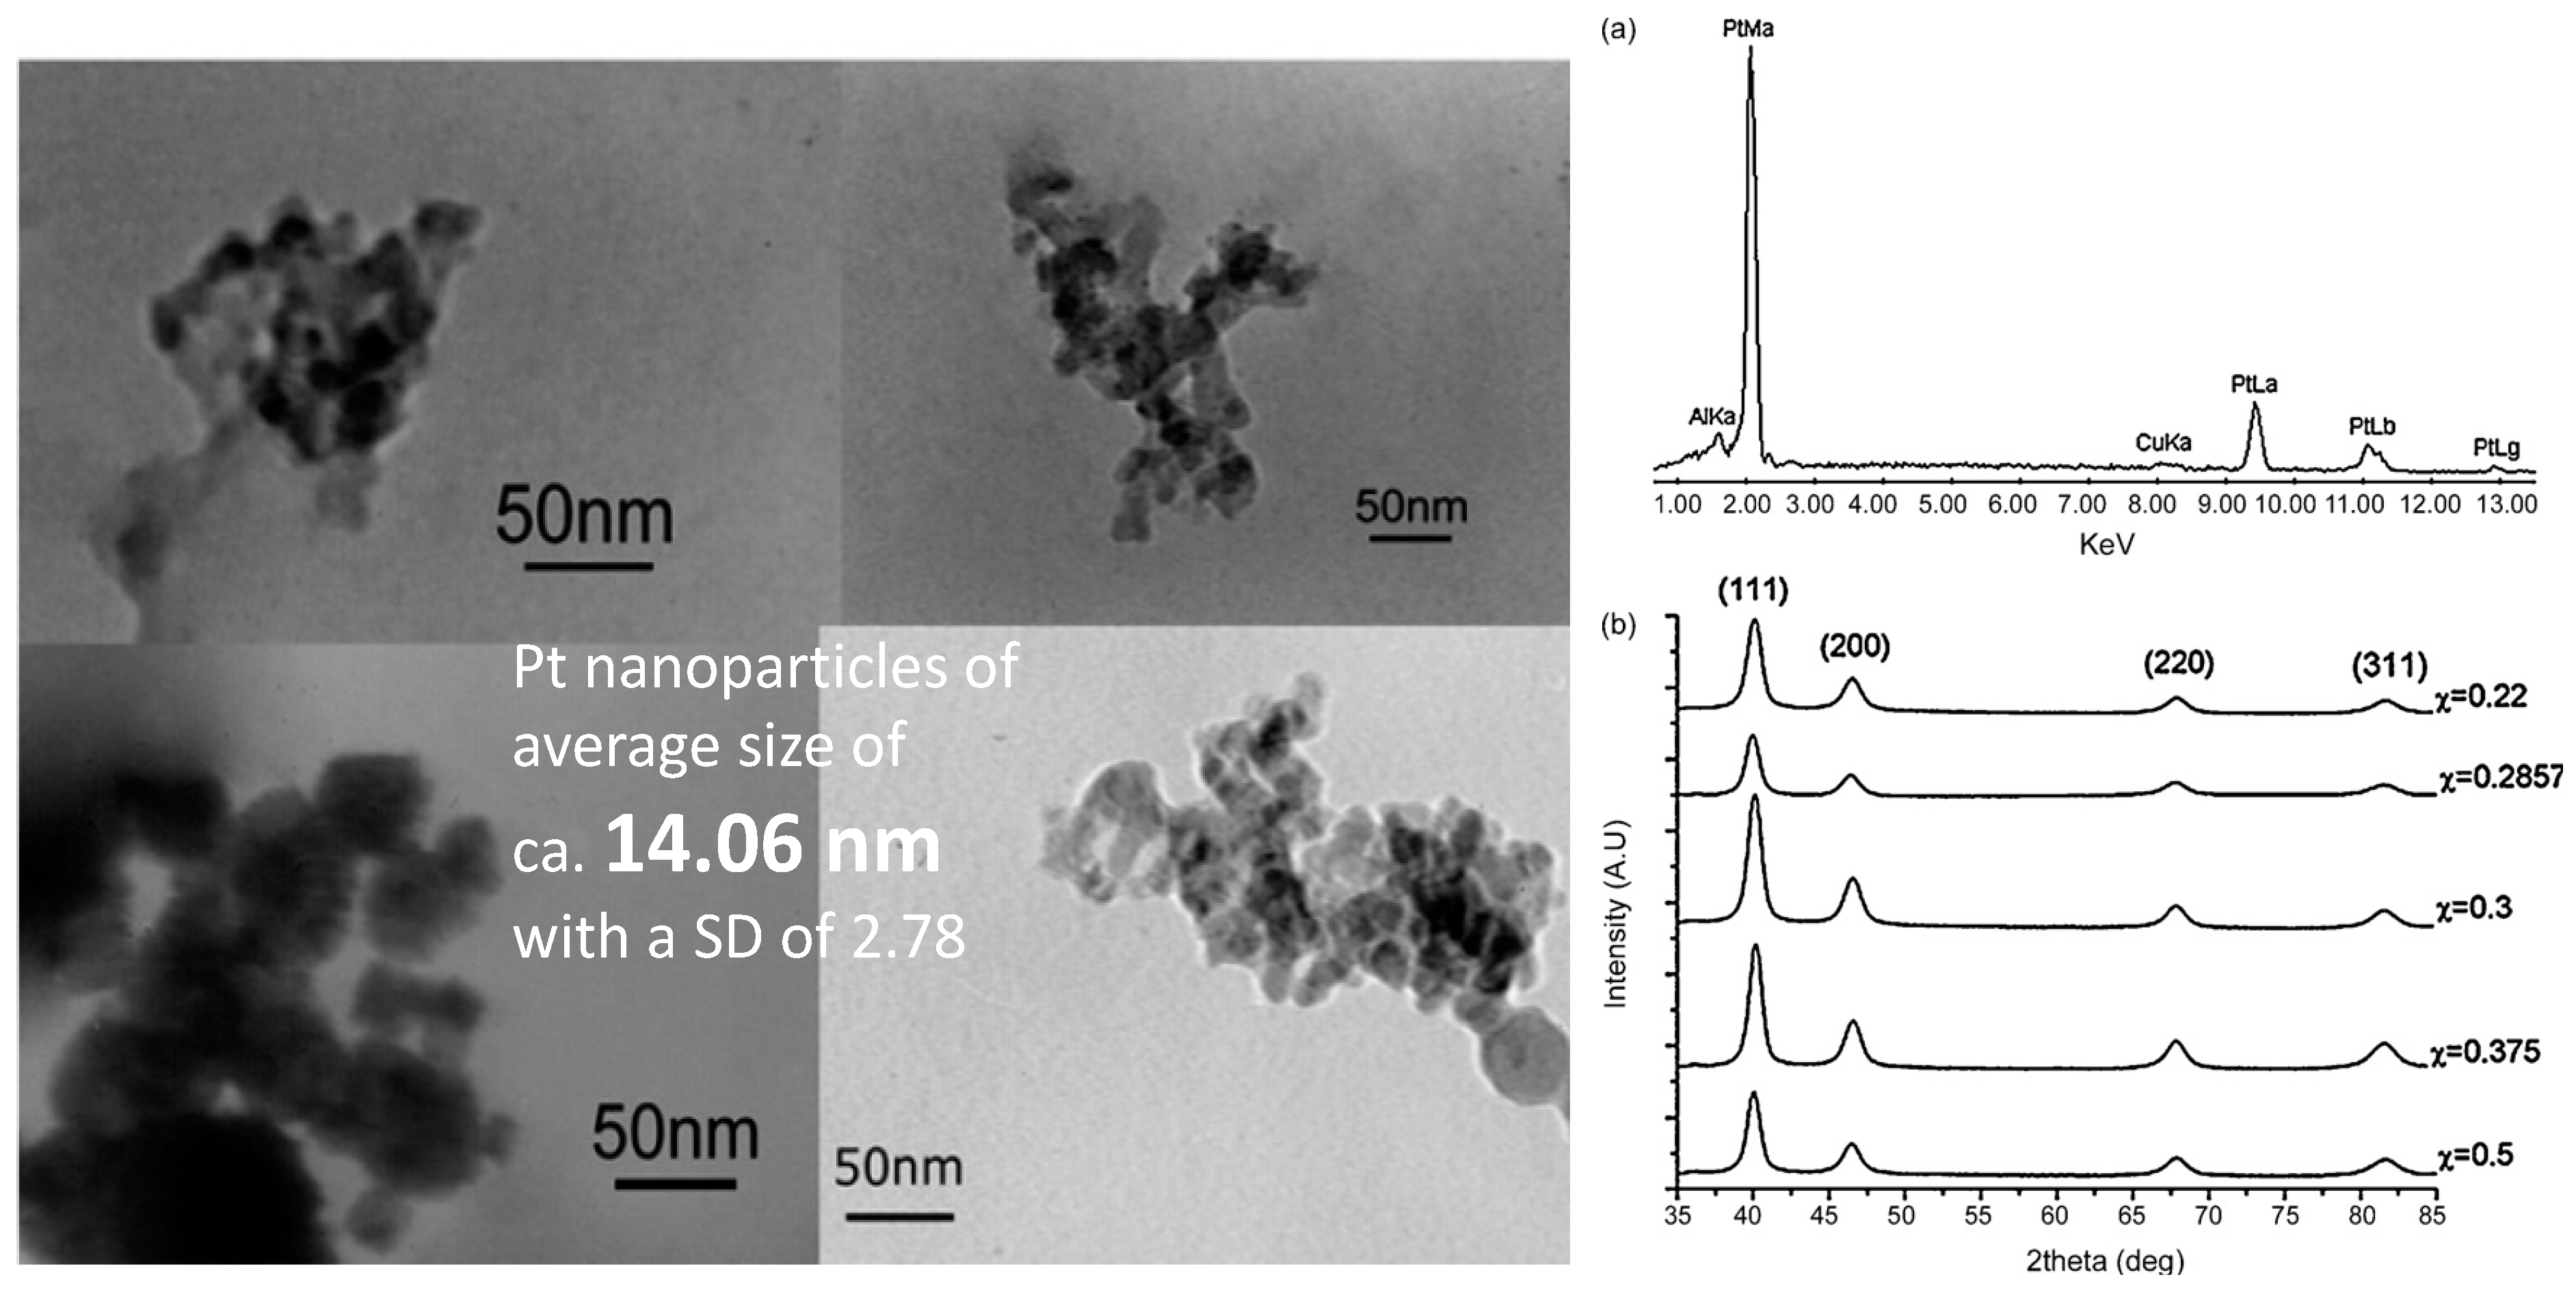
The workers found that (i) ultrasound had the principal role in causing cavitation in the electrolytic solution and in ablating the metallic nuclei and nanoparticles from the vibrating cathodic surface, (ii) the nuclei and nanoparticles formed on the vibrating GC (glassy carbon) electrode surface during the tON time were ejected into the electrolyte during tUS, (iii) all metallic nanoparticles (Pt) showed single phase Pt with a face centered cubic (fcc) structure, and (iv) the metallic nanoparticles had a mean average size of 14.06 nm with a standard deviation of 2.78, in excellent agreement with values obtained from XRD analyses, as shown in Figure 10 [22].
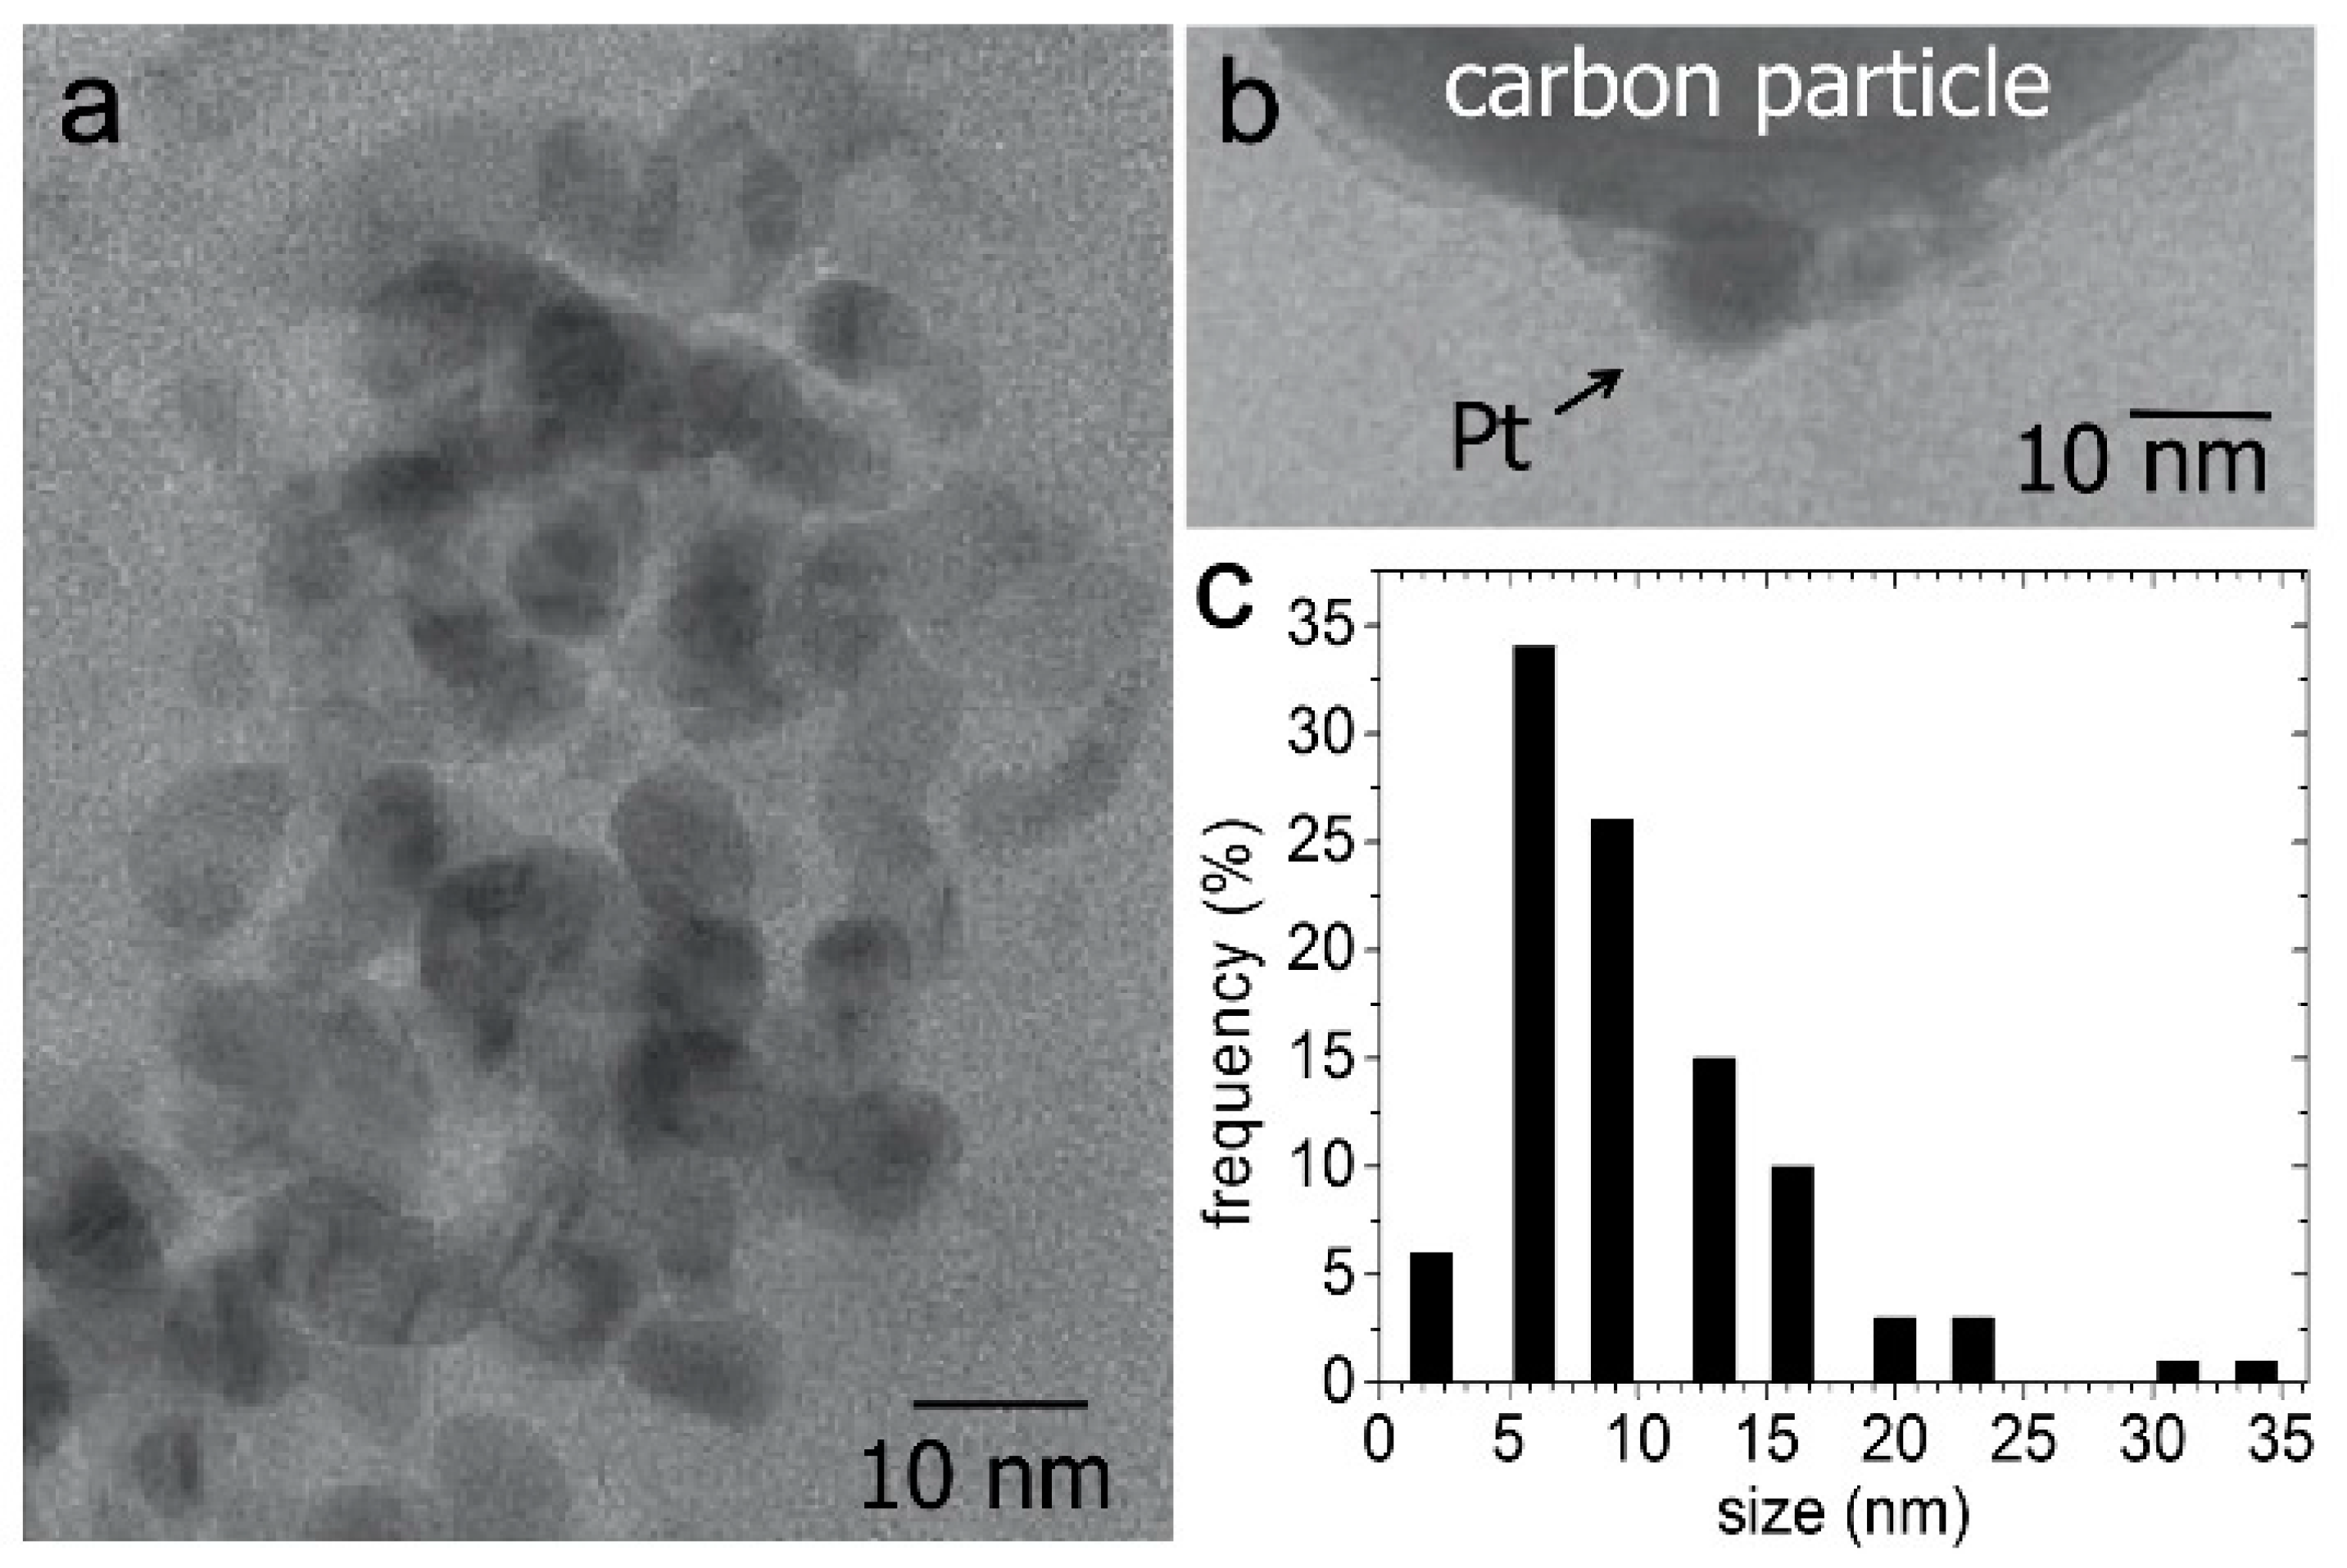
There are various preparation methods for carbon (and other conductive support materials [16]) supported PGM nanoparticles, e.g., impregnation, sputtering and electrodeposition, the colloidal method, and the ion-exchange method [20]. In most cases, decoration of support substrates has usually been achieved through impregnation via wet chemistry. Recently, Karousos et al. [23] showed that Pt/C can be produced by simultaneous Pt nanoparticle synthesis and decoration of Vulcan XC72 carbon black substrate, as shown in Figure 11, in a one-step-process combining galvanostatic pulsed electrodeposition and pulsed ultrasound (20 kHz). This was achieved by using carbon black suspensions in an aqueous solution containing chloroplatinic acid precursor baths and PVP (polyvinylpyrrolidone) as surfactant (or stabilizer against free nanoparticle aggregation). The workers found that PVP-capped octahedral Pt nanoparticles with (111) facets and an average diameter of ~5 nm (obtained at 1 mA cm-2 current pulses, followed by 20 kHz ultrasonic pulses) were ‘strongly’ attached onto the Vulcan XC72 carbon black substrate. They also observed that partial formation of larger Pt nanoparticles (NPs) in the range 20–100 nm were formed. In order to effectively cap the Pt NPs, high PVP concentrations were used, however this strategy had a deteriorating effect on the establishment of a sufficiently strong metal-substrate binding, leaving part of the formed NPs unbound to the Vulcan XC72 carbon black substrate [23].
4. Ultrasonic, Sonochemical, and Sonoelectrochemical Production of PEMWE and PEMWE Electrodes
4.1. Ultrasonic Inclusion of Nano-Electrocatalytic Materials on Substrates
A few researchers successfully demonstrated that ultrasound can be employed for the ‘doping’ of nanoparticles in various polymeric and ceramics materials [20]. For example, Gedanken et al. [24] showed that ultrasound can be used for the insertion of amorphous catalyst nanomaterials into the ceramic mesopores and polymerics, and the deposition of various nanomaterials (metals, metal oxides, semi-conductors, etc.) on the surfaces of ceramic and polymeric materials [20]. They concluded that when compared to other methods, such as thermal spreading or impregnation, ultrasound yielded better material properties. Early investigations by Pollet et al. [25] demonstrated that the insertion of catalyst nanoparticles in PEM materials increased the performance of PEMFCs. For the first time, Pollet et al. [25] showed that the incorporation of nano-electrocatalysts in polymeric membranes, e.g., Nafion® for fuel cells using power ultrasound, improved PEMFC performance, however, the system was not optimized.
Only a few studies in the literature focus on the use of ultrasonic, sonochemical, and sonoelectrochemical methods to fabricate PEMFC and PEMWE electrodes. At present, there are various techniques for producing PEMFC, DMFC (Direct Methanol Fuel Cell), and PEMWE catalyst ‘inks’, i.e., for the mixing and milling the carbon support with the carbon-support electrocatalyst and the ionomer either by forced magnetic stirring, ultrasonic stirring, or ball-milling, as shown in Figure 12.
The catalyst ink may be either deposited to the gas diffusion layer (GDL) to yield a gas diffusion electrode (GDE) (or also known as catalyst coated substrate (CCS)) or the polymeric proton exchange membrane to form a catalyst coated membrane (CCM). The GDEs are usually prepared by screen printing, hand painting, ink-jetting, spreading, spraying (air and ultrasonic), (electro)deposition, ionomer impregnation, and sputtering. In the case of CCMs, they are produced by decaling, screen printing, hand painting, spraying (air and ultrasonic), impregnation reduction, evaporation deposition, sputtering, and dry spraying, as shown in Figure 13. For further details on PEMFC manufacturing, the reader is invited to consult the reviews detailed by Mehta and Cooper [26] and Litster and McLean [3].
4.2. Sonochemical Production of PEMFC and PEMWE Electrodes
In 2011, Pollet et al. [27] showed that GDEs for PEMFCs may be produced by ultrasonic-spray for using the commercially available Sono-Tek system, as shown in Figure 14.
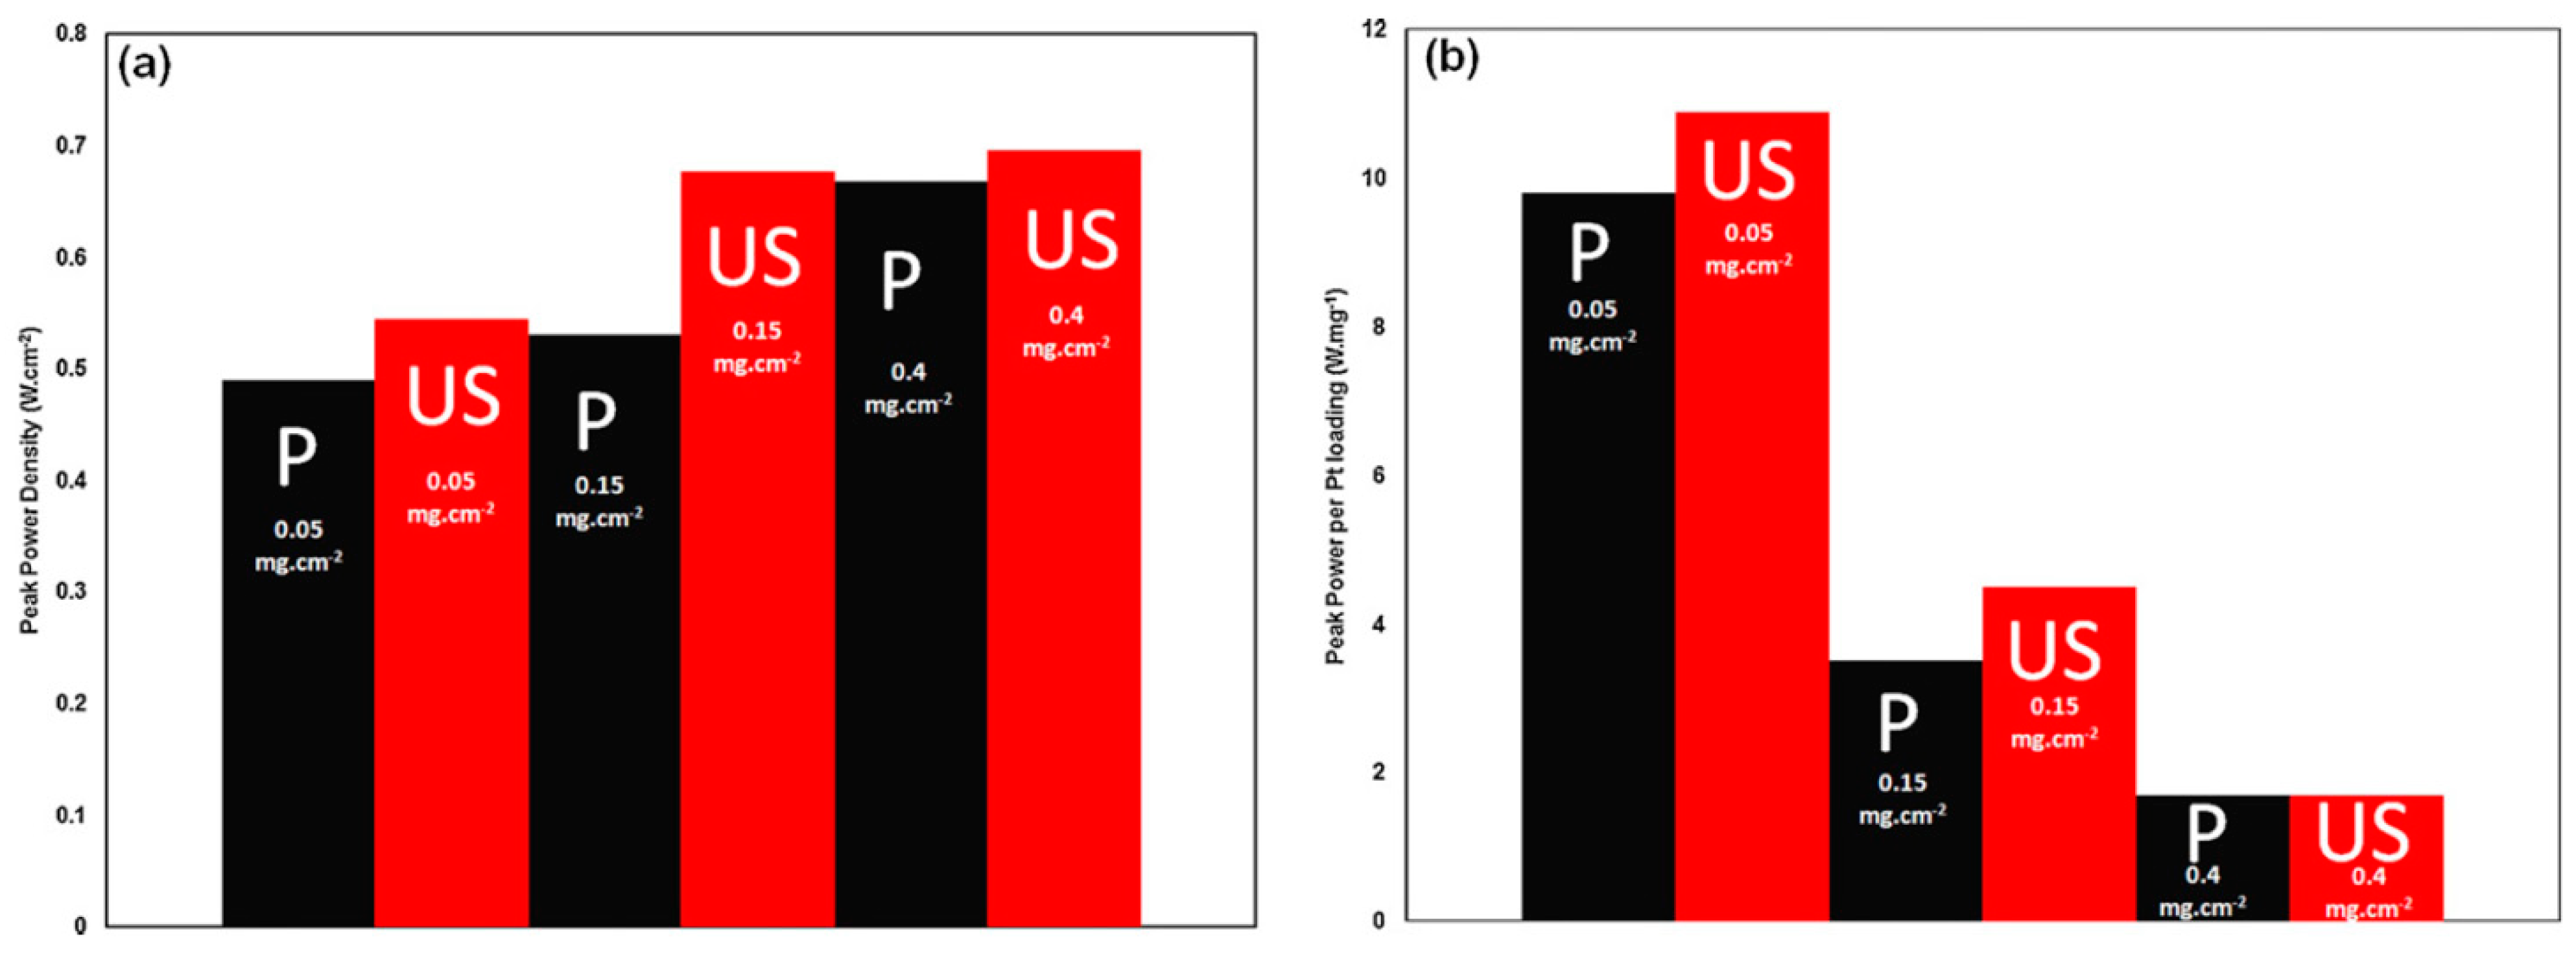
In this study, various types (five) of GDL were deposited with catalyst ink of known PGM loading by the ultrasonic-spray technique and their performances (and durability) were compared. It was observed that (i) SGL 10BC exhibited the best performance in an MEA when the GDL was ultrasonically spray coated and, (ii) SGL 34BC exhibited mass-transport issues. The workers showed that the ultrasonic-spray technique led to better MEA performances compared to the hand-painted method especially at low PGM loadings, as shown in Figure 15. Moreover, a 50% increase in peak power ratings was found at ultra-low PGM loadings for the ultrasonically sprayed GDEs when compared to the hand-painted ones, as shown in Figure 15. It was also found that the ultrasonic-spray method distributed the catalyst ink more evenly onto the GDL, as shown in Figure 16, yielding better PGM utilization compared to the hand-painted method. This was also further evident at lower platinum loadings, as shown in Figure 17 [27].
4.3. Sonoelectrochemical Production of PEMFC and PEMWE Electrodes
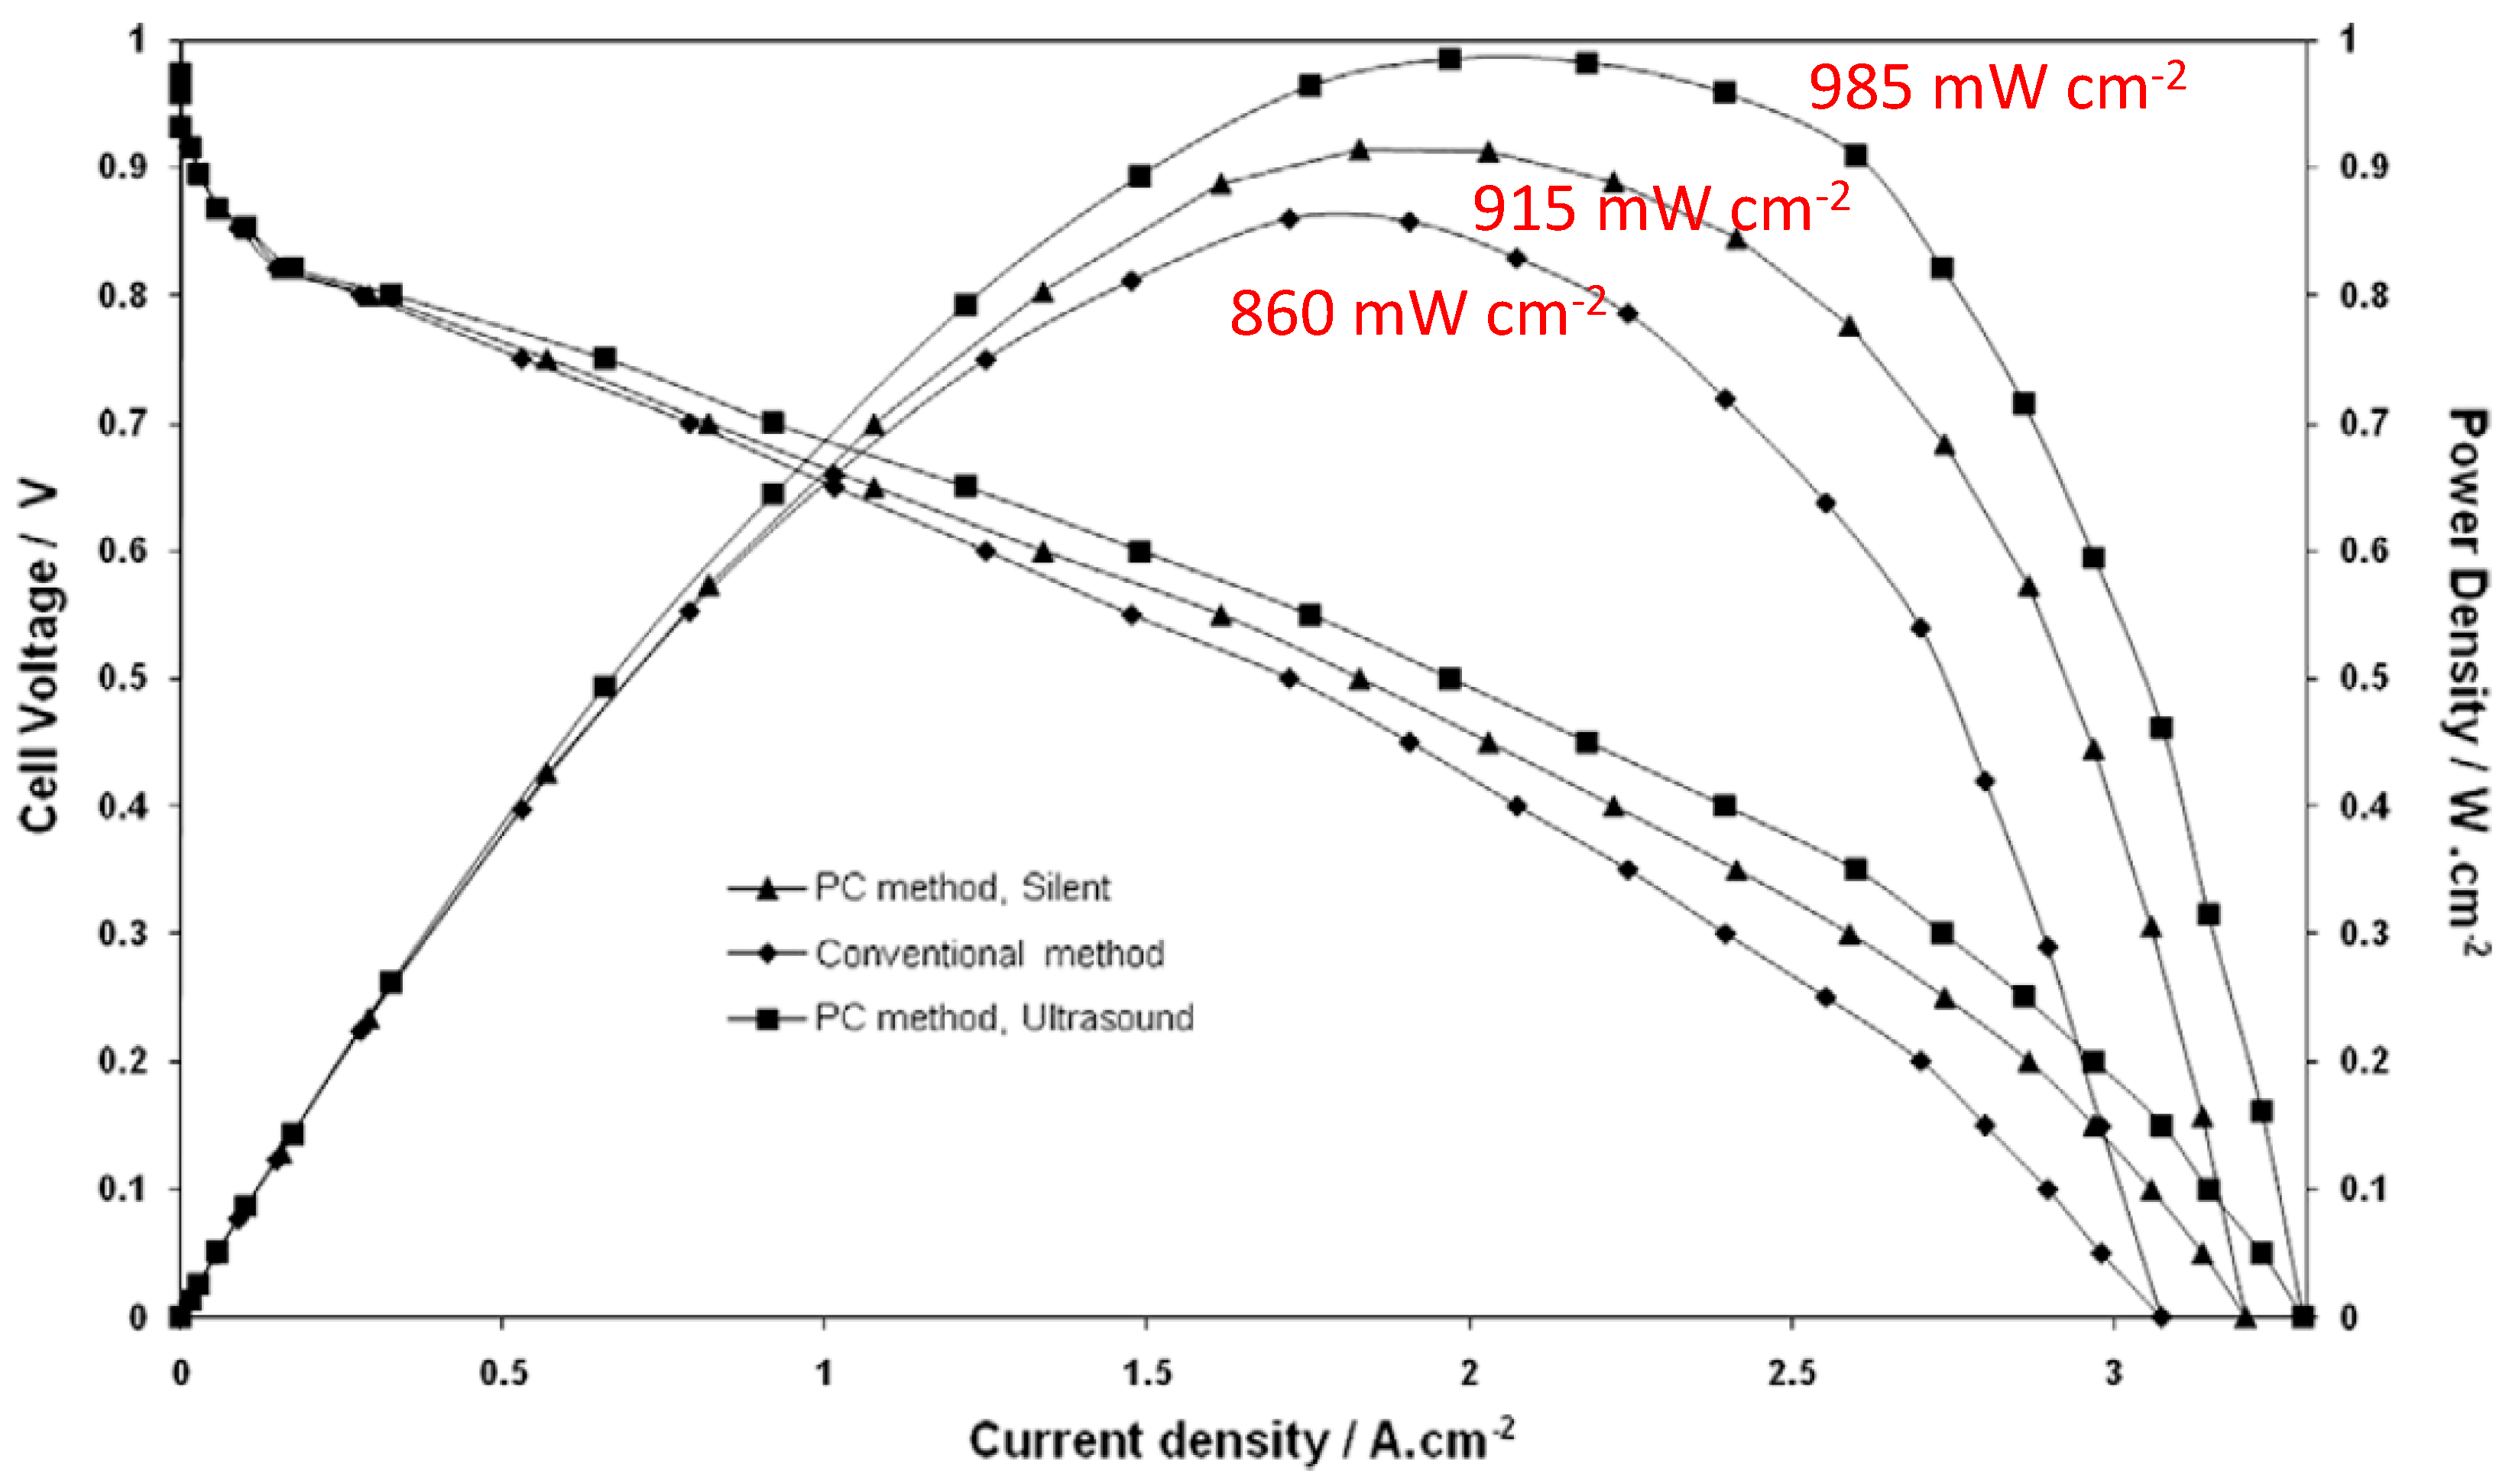
Pollet [25] showed for the first time that the sonoelectrochemical technique can be employed for fabricating PEMFC electrodes whereby Pt loaded on Nafion®-bonded carbon anodes were produced in the presence K2PtCl4 in solutions by galvanostatic pulse electrodeposition under silent and ultrasonic conditions (20 kHz). He found that the PEMFC electrodes generated sonoelectrochemically exhibited superior performance compared to those produced by the galvanostatic pulse method only under silent conditions and the conventional method as shown in Figure 18. He found that (i) a significant increase in Pt active surface area at a given Pt loading was observed, which was possibly due to a decrease in Pt size, (ii) from SEM studies, ultrasound yields compact electrodeposit in turn decreasing the porosity and improving access of reactants to Pt sites leading to better Pt utilization and better fuel cell performance (a significant increase in power density was observed) [28].
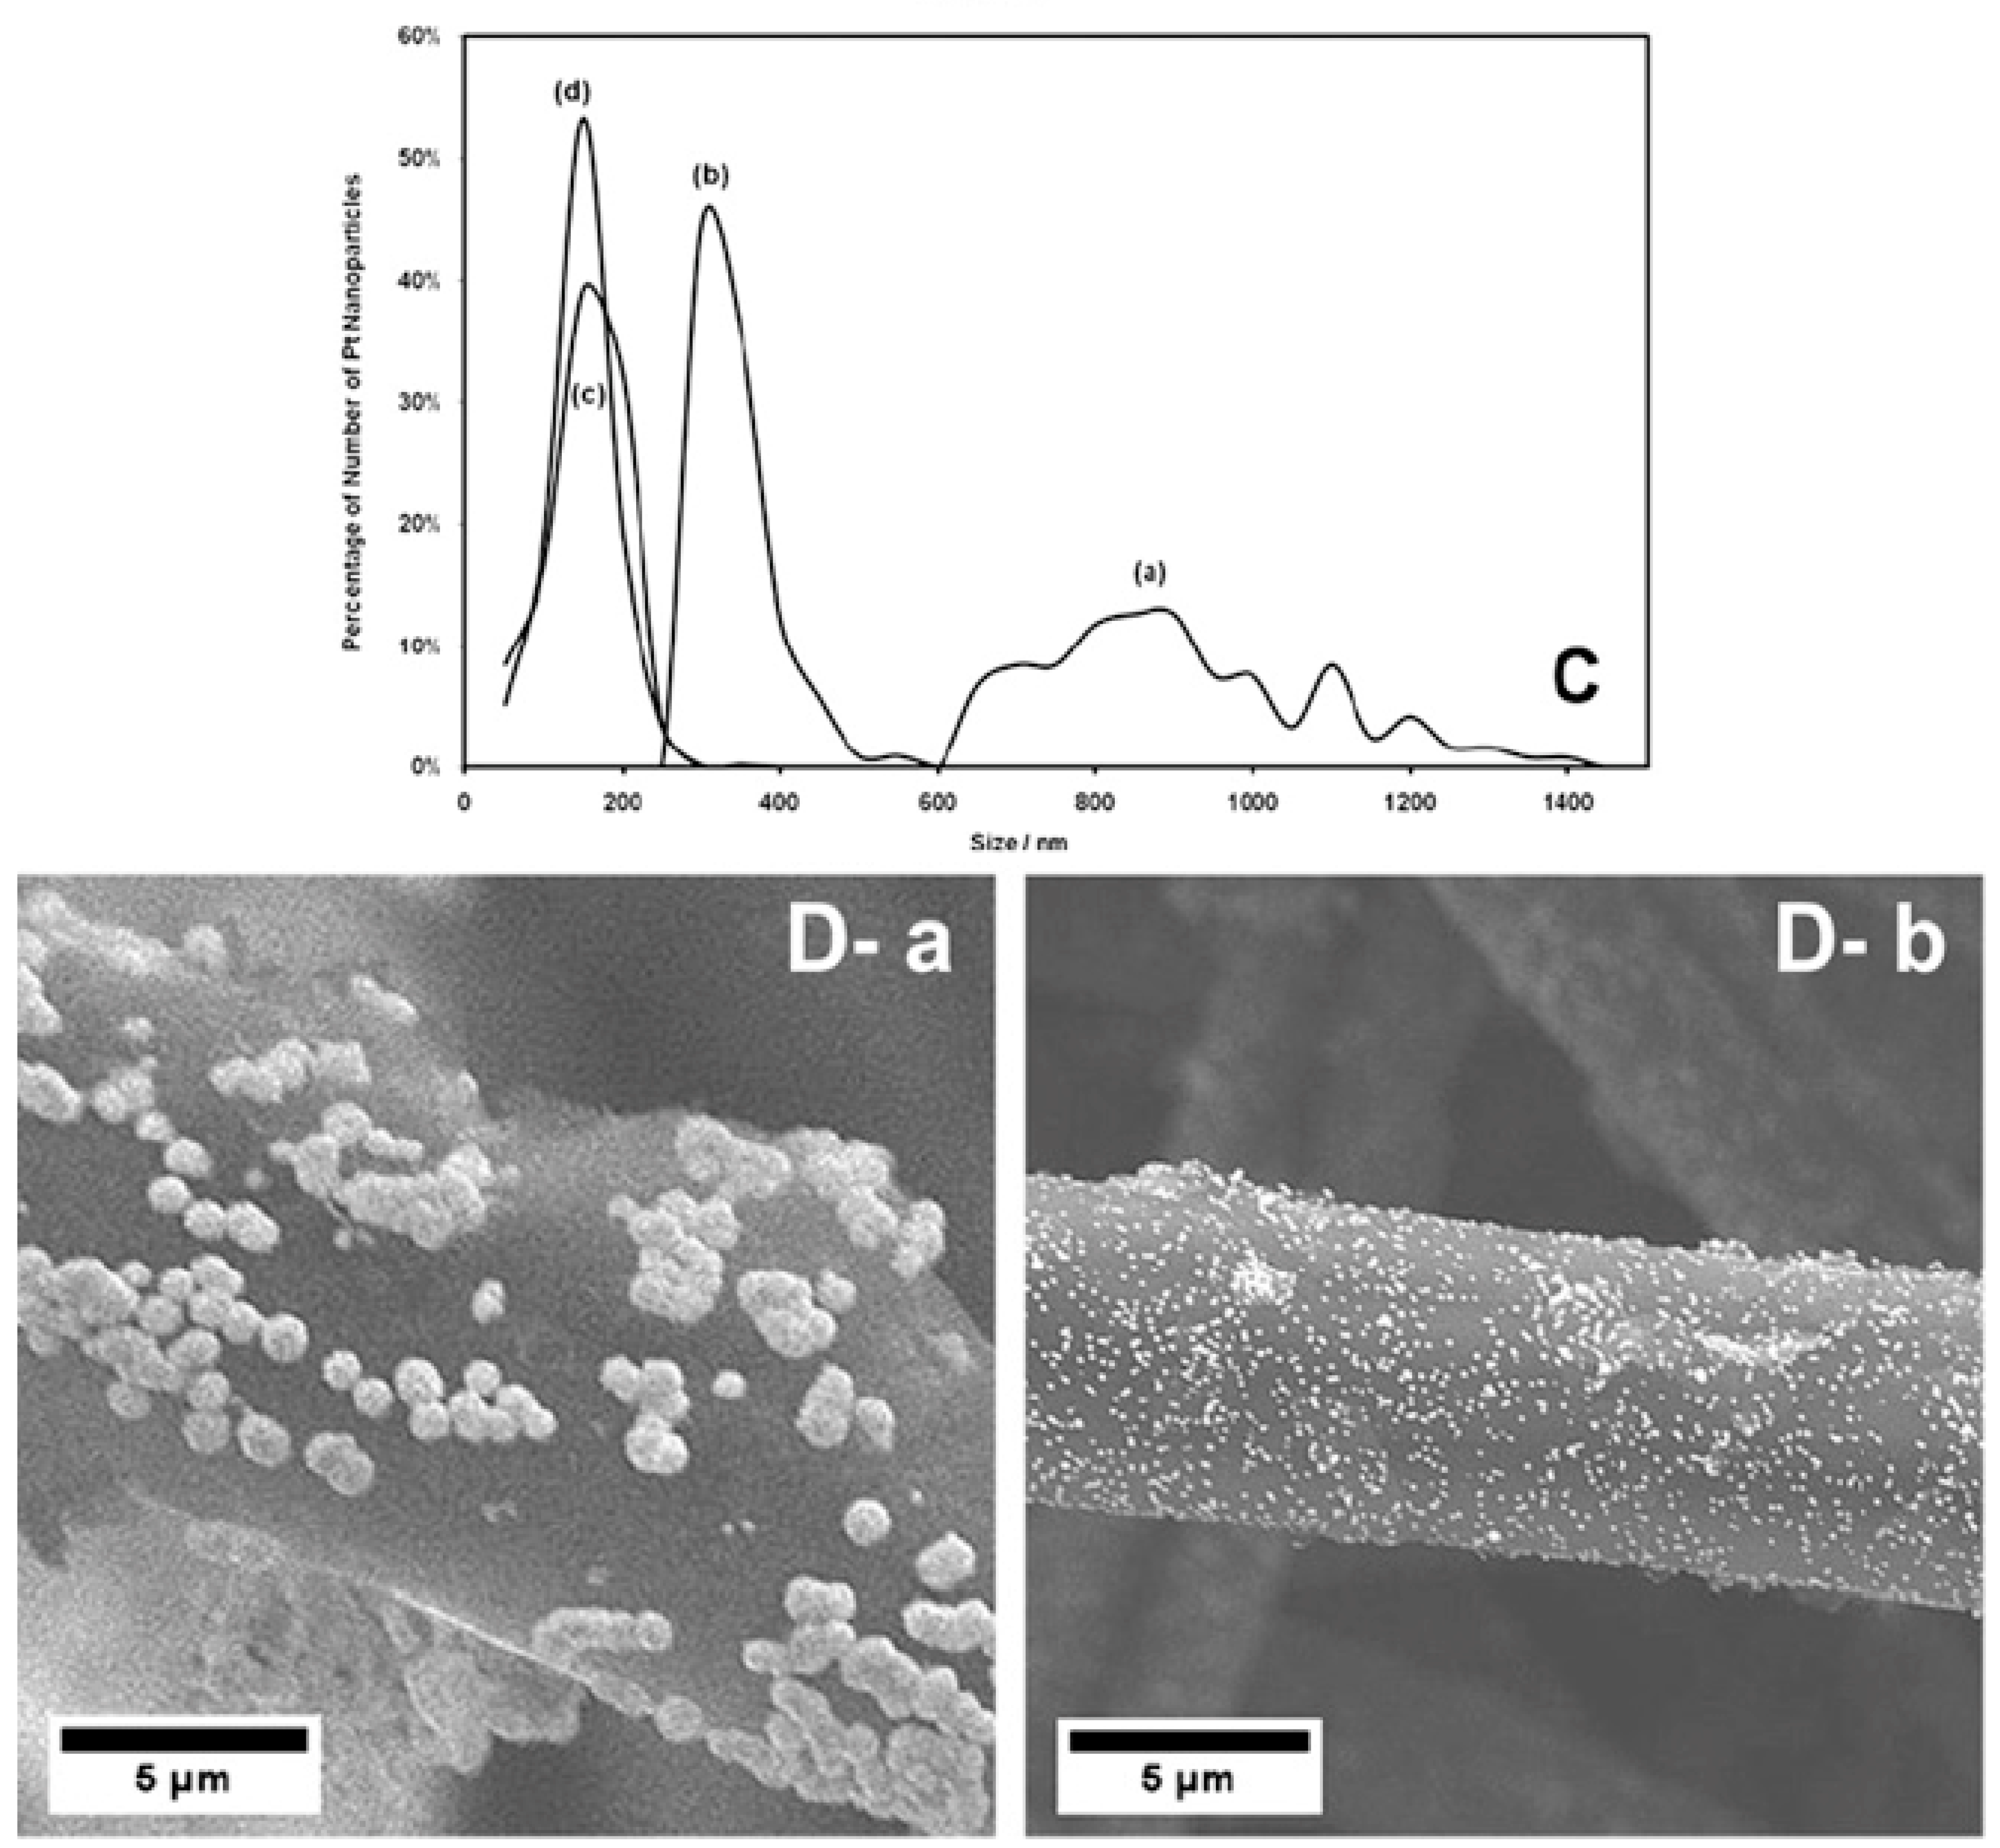
In order to shed light on the observed increase in fuel cell performance for MEAs prepared sonochemically and sonoelectrochemically, in 2011, Pollet et al. [28] studied the electrodeposition of Pt on glassy carbon (GC) and gas diffusion layer (GDL) surfaces in dilute chloroplatinic acid solutions (10 mM PtCl42− in 0.5 M NaCl). The experiments were performed potentiodynamically in the absence and presence of ultrasound (20 kHz) at various ultrasonic powers (up to 6 W). In the workers’ conditions, it was found that platinum electrodeposition was an irreversible process which required a substantial overpotential to drive the formation of Pt nuclei on the GC and GDL surfaces. However, under ultrasonication Pt electrodeposition became easier due to lower concentration and nucleation overpotentials and overall currents significantly increased compared to silent conditions. Moreover, the specific Electrochemical Surface Area (ECSA) was significantly affected for Pt/GC and Pt/GDL electrodes prepared in the presence of rotation (i.e., GC only) and in the presence of ultrasound compared to those prepared under silent conditions. This observation was explained to be due to both larger and agglomerated Pt nanoparticles formed on the GC and GDL surface caused by intense convection. It was also observed that ultrasound generated larger Pt nanoparticles on GC electrodes than those on GDL electrodes. It was found that the electrodeposited Pt on GDL samples under ultrasound led to smaller Pt particle sizes (<200 nm) compared to silent conditions (ca. 0.9–1 µm), as shown in Figure 19. These observations were attributed to the implosion of cavitation bubbles at the GC and GDL surfaces enabling the ‘deagglomeration’ of Pt nanoparticles or/and activating nucleation sites for Pt.
5. Conclusions
The first paper describing the generation of Platinum Group Metal (PGM) nanoparticles from aqueous solutions (chloroplatinic acid) and in the absence of surfactants using sonoelectrochemistry was in 2009. In these experiments, the fabrication of Pt nanoparticles (NPs ≈ 15 nm) was performed galvanostatically at room temperature using a vibrating working electrode (sonoelectrode) producing short applied current pulses triggered and followed immediately by short ultrasonic pulses (20 kHz). More recently, it was successfully shown that simultaneous electrocatalytic Pt-NP synthesis and decoration of Vulcan XC-72 carbon black substrate was achieved in a novel one-step-process, combining galvanostatic pulsed electrodeposition and pulsed ultrasonication (20 kHz). Pollet et al. also showed that power ultrasound (20 kHz) can be used effectively for the in-situ fabrication of PEMFC electrodes leading to highly performing electrodes containing (ultra)-low loading Pt. In 2011, a research collaboration with Sono-Tek Corporation (USA) showed that the novel ultrasonic-spray (US) method can be used for preparing GDEs on various commercial woven and non-woven GDLs containing (ultra)-low Pt loadings in the range 0.40–0.05 mg cm−2. It was found that the GDEs prepared by this US method exhibited better performances compared to those prepared commercially, especially at low Pt loadings.
Funding
This research received no external funding.
Acknowledgements
The author would like to thank E.F. Valzer, O.J. Curnick, B. Millington, J.T.E. Goh, S. Du, V. Whipple, V. Zin, M. Dabalà, C. Argirusis, P.M. Sakkas and M.T.Y. Paul.
Conflicts of Interest
The authors declare no conflicts of interest.
References
- Pollet, B.G.; Staffell, I.; Shang, J.L. Current status of hybrid, battery and fuel cell electric vehicles: From electrochemistry to market prospects. Electrochim. Acta 2016, 84, 235–249. [Google Scholar] [CrossRef]
- Pollet, B.G. Polymer Electrolyte Membrane and Direct Methanol Fuel Cell Technology—A review. Platinum Metals Rev. 2013, 57, 137–142. [Google Scholar] [CrossRef]
- Litster, S.; McLean, G. Review: PEM fuel cell electrode. J. Power Sour. 2004, 130, 61–76. [Google Scholar] [CrossRef]
- Carmo, M.; Fritz, D.L.; Mergel, J.; Stolten, D. A comprehensive review on PEM water electrolysis. Int. J. Hydrog. Energy 2013, 38, 4901–4934. [Google Scholar] [CrossRef]
- Jorge, A.B.; Dedigama, I.; Miller, T.S.; Shearing, P.; Brett, D.J.L.; McMillan, P.F. Carbon Nitride Materials as Efficient Catalyst Supports for Proton Exchange Membrane Water Electrolyzers. Nanomaterials 2018, 8, 432. [Google Scholar] [CrossRef] [PubMed]
- Felix, C.; Bladergroen, B.; Linkov, V.; Pollet, B.G.; Pasupathi, S. Ex-situ electrochemical characterization of IrO2 synthesized by a modified Adams fusion method for the oxygen evolution reaction. Catalysts 2019. under review. [Google Scholar]
- Sharma, S.; Pollet, B.G. Support materials for PEMFC and DMFC electrocatalysts—A review. J. Power Sour. 2012, 208, 96–119. [Google Scholar] [CrossRef]
- Du, S.; Pollet, B.G. Catalyst loading for Pt-nanowire thin film electrodes in PEFCs. Int. J. Hydrog. Energy 2012, 37, 17892–17898. [Google Scholar] [CrossRef]
- Du, S.; Koenigsmann, C.; Sun, S. One-dimensional Nanostructures for PEM Fuel Cell Applications. In Hydrogen and Fuel Cells Primers Series; Pollet, B.G., Ed.; Academic Press: Cambridge, MA, USA, 2017. [Google Scholar]
- Bessarabov, D.; Millet, P. PEM Water Electrolysis, 1st ed. In Hydrogen and Fuel Cells Primers Series; Pollet, B.G., Ed.; Academic Press: Cambridge, MA, USA, 2018; Volume 1. [Google Scholar]
- Bessarabov, D.; Millet, P. PEM Water Electrolysis, 2nd ed. In Hydrogen and Fuel Cells Primers Series; Pollet, B.G., Ed.; Academic Press: Cambridge, MA, USA, 2018; Volume 2. [Google Scholar]
- Felix, C.; Jao, T.-C.; Pasupathi, S.; Linkov, V.; Pollet, B.G. Fabrication of gas diffusion electrodes via electrophoretic deposition for high temperature polymer electrolyte membrane fuel cells. J. Power Sour. 2014, 258, 238–245. [Google Scholar] [CrossRef]
- Curnick, O.J.; Mendes, P.M.; Pollet, B.G. Enhanced durability of a Pt/C electrocatalyst derived from Nafion®-stabilised colloidal platinum nanoparticles. Electrochem. Comm. 2010, 12, 1017–1020. [Google Scholar] [CrossRef]
- Wee, J.-H.; Lee, K.-Y.; Kim, S.H. Review: Fabrication methods for low-Pt-loading electrocatalysts in proton exchange membrane fuel cell systems. J. Power Sour. 2007, 165, 667–677. [Google Scholar] [CrossRef]
- Pollet, B.G. The use of ultrasound for the fabrication of fuel cell materials. Int. J. Hydrog. Energy 2010, 22, 1039–1059. [Google Scholar] [CrossRef]
- Pollet, B.G.; Ashokkumar, M. Introduction to Ultrasound, Sonochemistry and Sonoelectrochemistry; Pollet, B.G., Ashokkumar, M., Eds.; SpringerBriefs: Berlin, Germany, 2019; in press. [Google Scholar]
- Pollet, B.G. (Ed.) Power Ultrasound in Electrochemistry: From Versatile Laboratory Tool to Engineering Solution; John Wiley & Sons: Hoboken, NJ, USA, 2012. [Google Scholar]
- Islam, Md.H.; Burheim, O.S.; Pollet, B.G. Review: Sonochemical and sonoelectrochemical production of hydrogen. Ultrason. Sonochem. 2019, 51, 533–555. [Google Scholar] [CrossRef] [PubMed]
- Pollet, B.G. A short introduction to Sonoelectrochemistry. Electrochem. Soc. Interface 2018, 27, 41–42. [Google Scholar] [CrossRef]
- Bock, C.; Halvorsen, H.; MacDougall, B. Catalyst synthesis techniques. In PEM Fuel Cell Electrocatalysts and Catalyst Layers: Fundamentals and Applications; Zhang, J., Ed.; Springer: London, UK; Guildford, UK, 2008; 1137p. [Google Scholar]
- Dabalá, M.; Pollet, B.G.; Zin, V.; Campadello, E.; Mason, T.J. Sonoelectrochemical (20 kHz) production of Co65Fe35 alloy nanoparticles from Aotani solutions. J. Appl. Electrochem. 2008, 38, 395–402. [Google Scholar] [CrossRef]
- Zin, V.; Pollet, B.G.; Dabalà, M. Sonoelectrochemical (20 kHz) production of platinum nanoparticles from aqueous solutions. Electrochim. Acta 2009, 54, 7201–7206. [Google Scholar] [CrossRef]
- Karousos, D.S.; Desdenakis, K.I.; Sakkas, P.M.; Sourkouni, G.; Pollet, B.G. Argirusis. Sonoelectrochemical one-pot synthesis of Pt–Carbon black nanocomposite PEMFC electrocatalyst. Ultrason. Sonochem. 2017, 35, 591–597. [Google Scholar] [CrossRef] [PubMed]
- Gedanken, A. Doping nanoparticles into polymers and ceramics using ultrasound radiation. Ultrason. Sonochem. 2007, 14, 418–430. [Google Scholar] [CrossRef] [PubMed]
- Pollet, B.G. A novel method for preparing PEMFC electrodes by the ultrasonic and sonoelectrochemical techniques. Electrochem. Comm. 2009, 11, 1445–1448. [Google Scholar] [CrossRef]
- Mehta, V.; Cooper, J.S. Review and analysis of PEM fuel cell design and manufacturing. J. Power Sour. 2003, 114, 32–53. [Google Scholar] [CrossRef]
- Millington, B.; Whipple, V.; Pollet, B.G. A novel method for preparing proton exchange membrane fuel cell electrodes by the ultrasonic-spray technique. J. Power Sour. 2011, 196, 8500–8508. [Google Scholar] [CrossRef]
- Pollet, B.G.; Valzer, E.F.; Curnick, O.J. Platinum sonoelectrodeposition on glassy carbon and gas diffusion layer electrodes. Int. J. Hydrog. Energy 2011, 36, 6248–6258. [Google Scholar] [CrossRef]
Figure 1.
(Ultra)sonic frequency range.
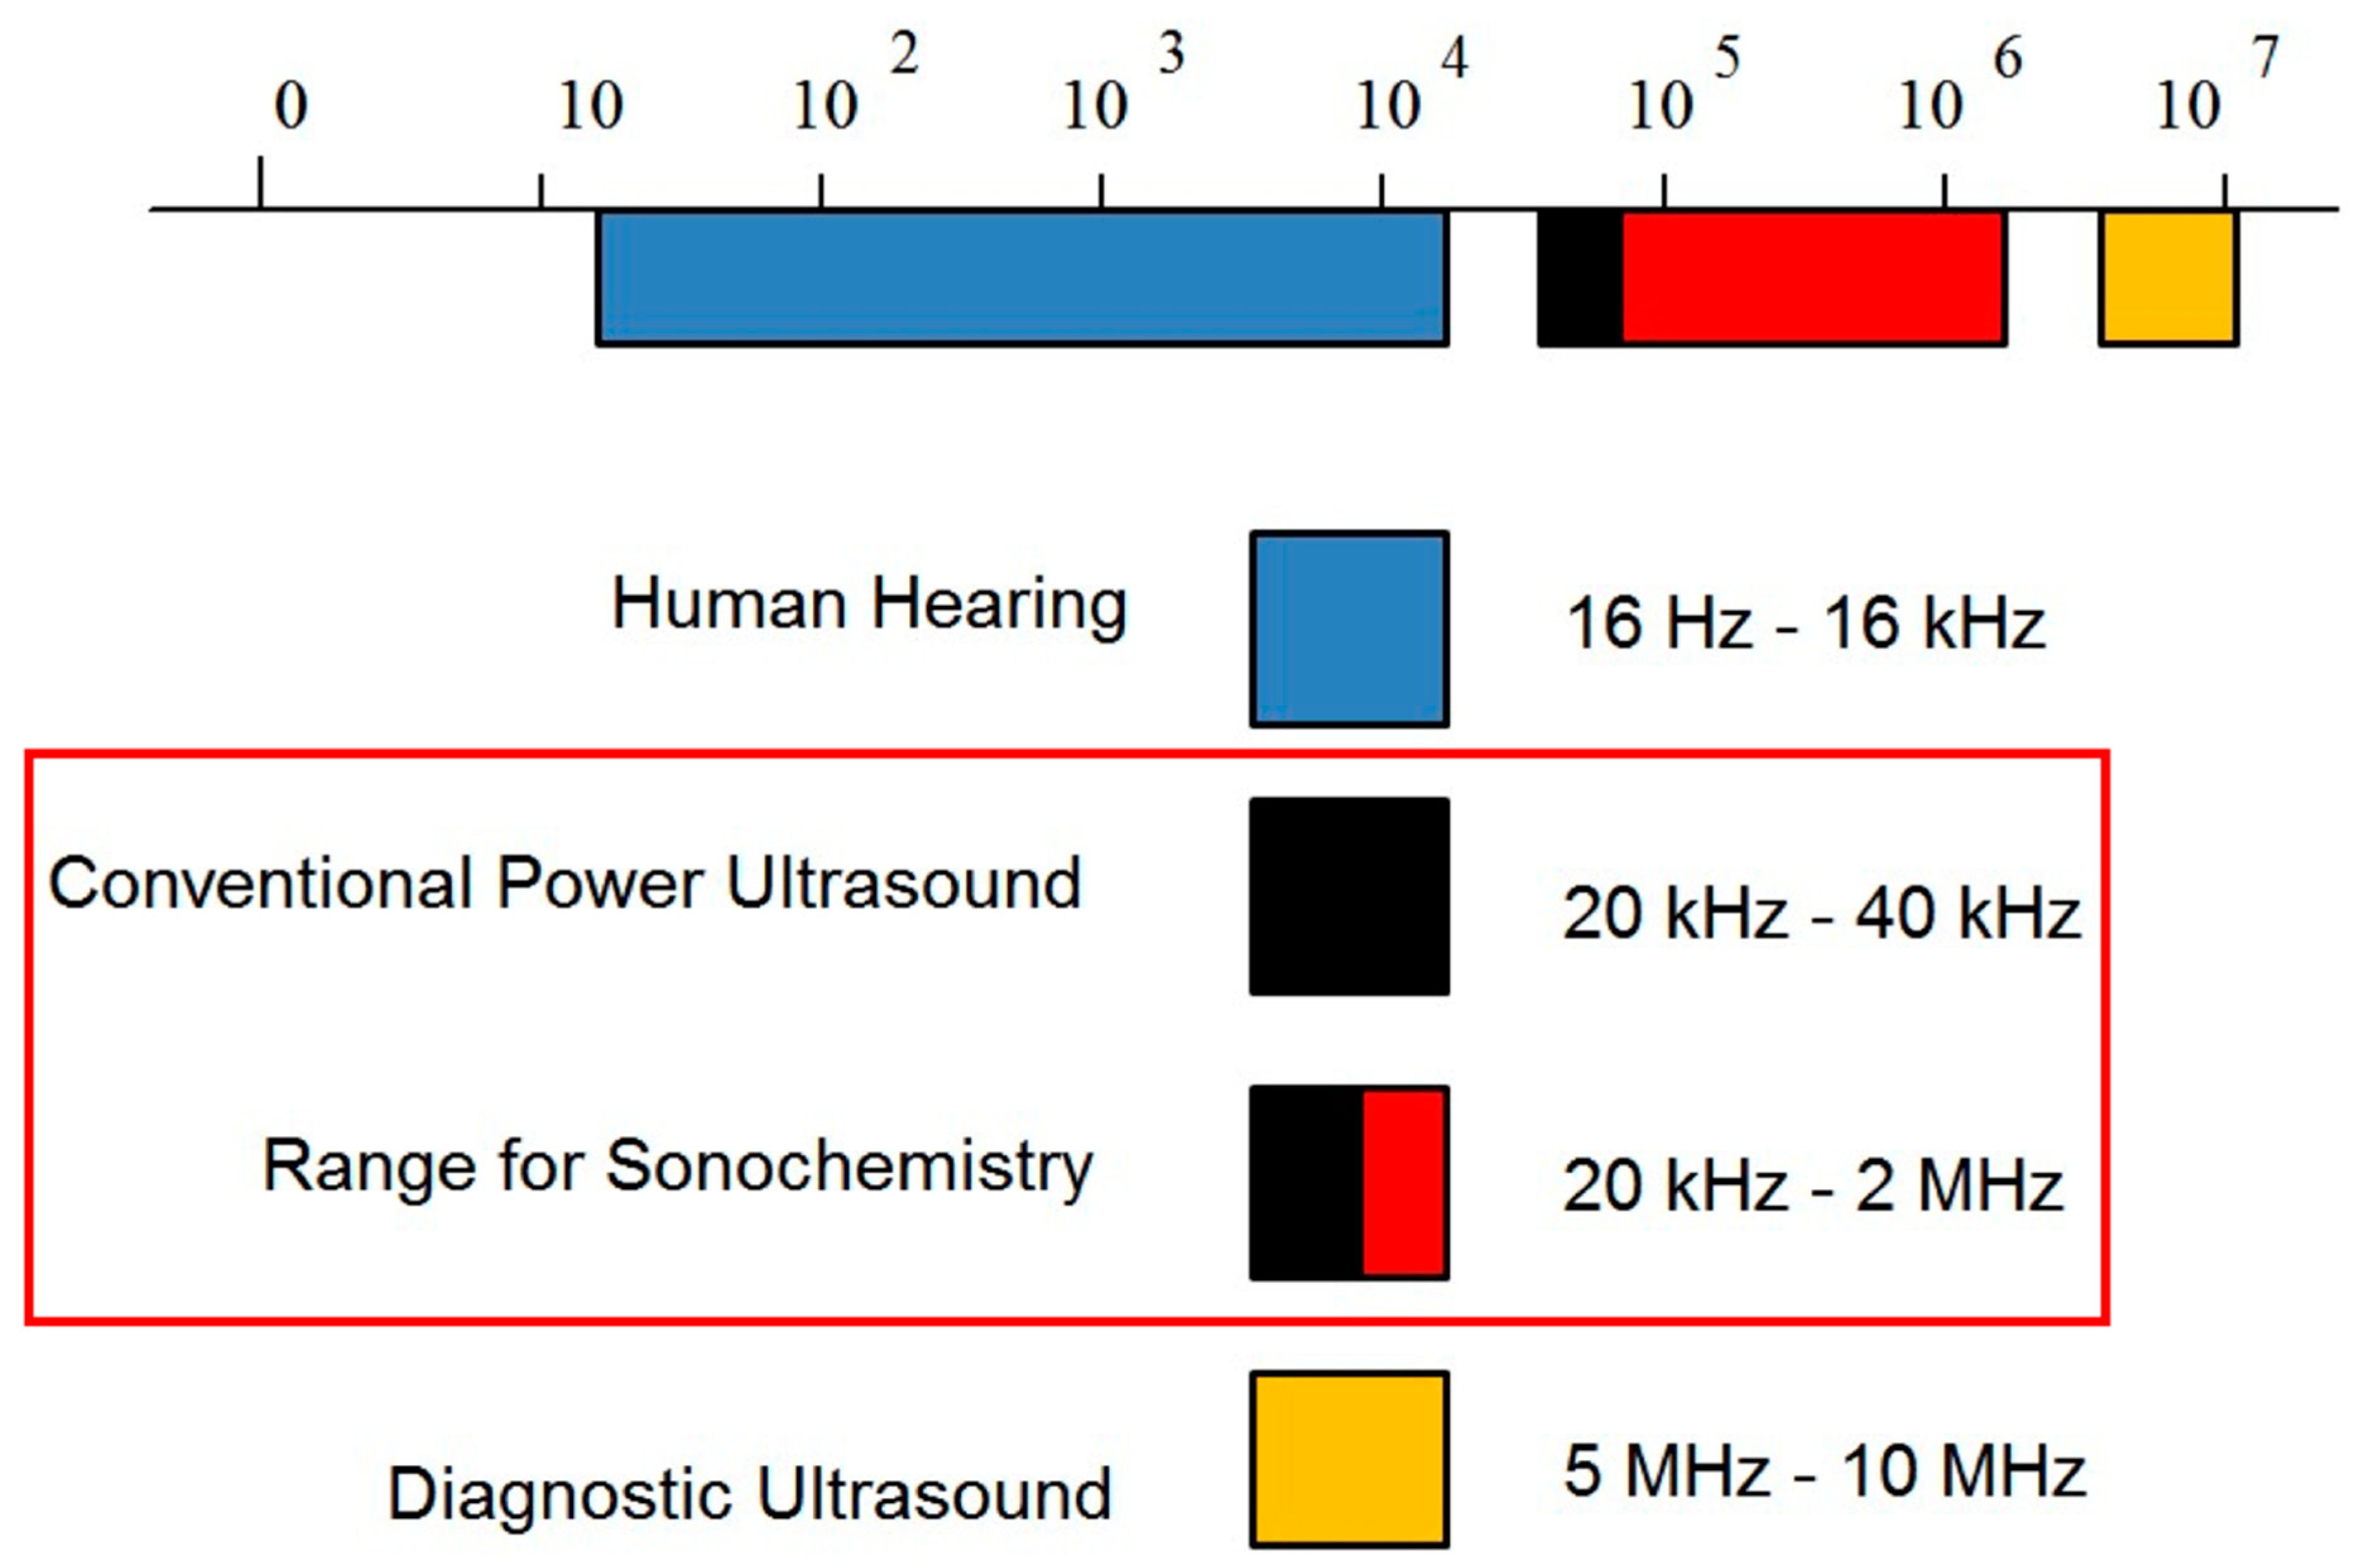
Figure 2.
Ultrasonic effects in a liquid and near a solid surface [15].
Figure 2.
Ultrasonic effects in a liquid and near a solid surface [15].
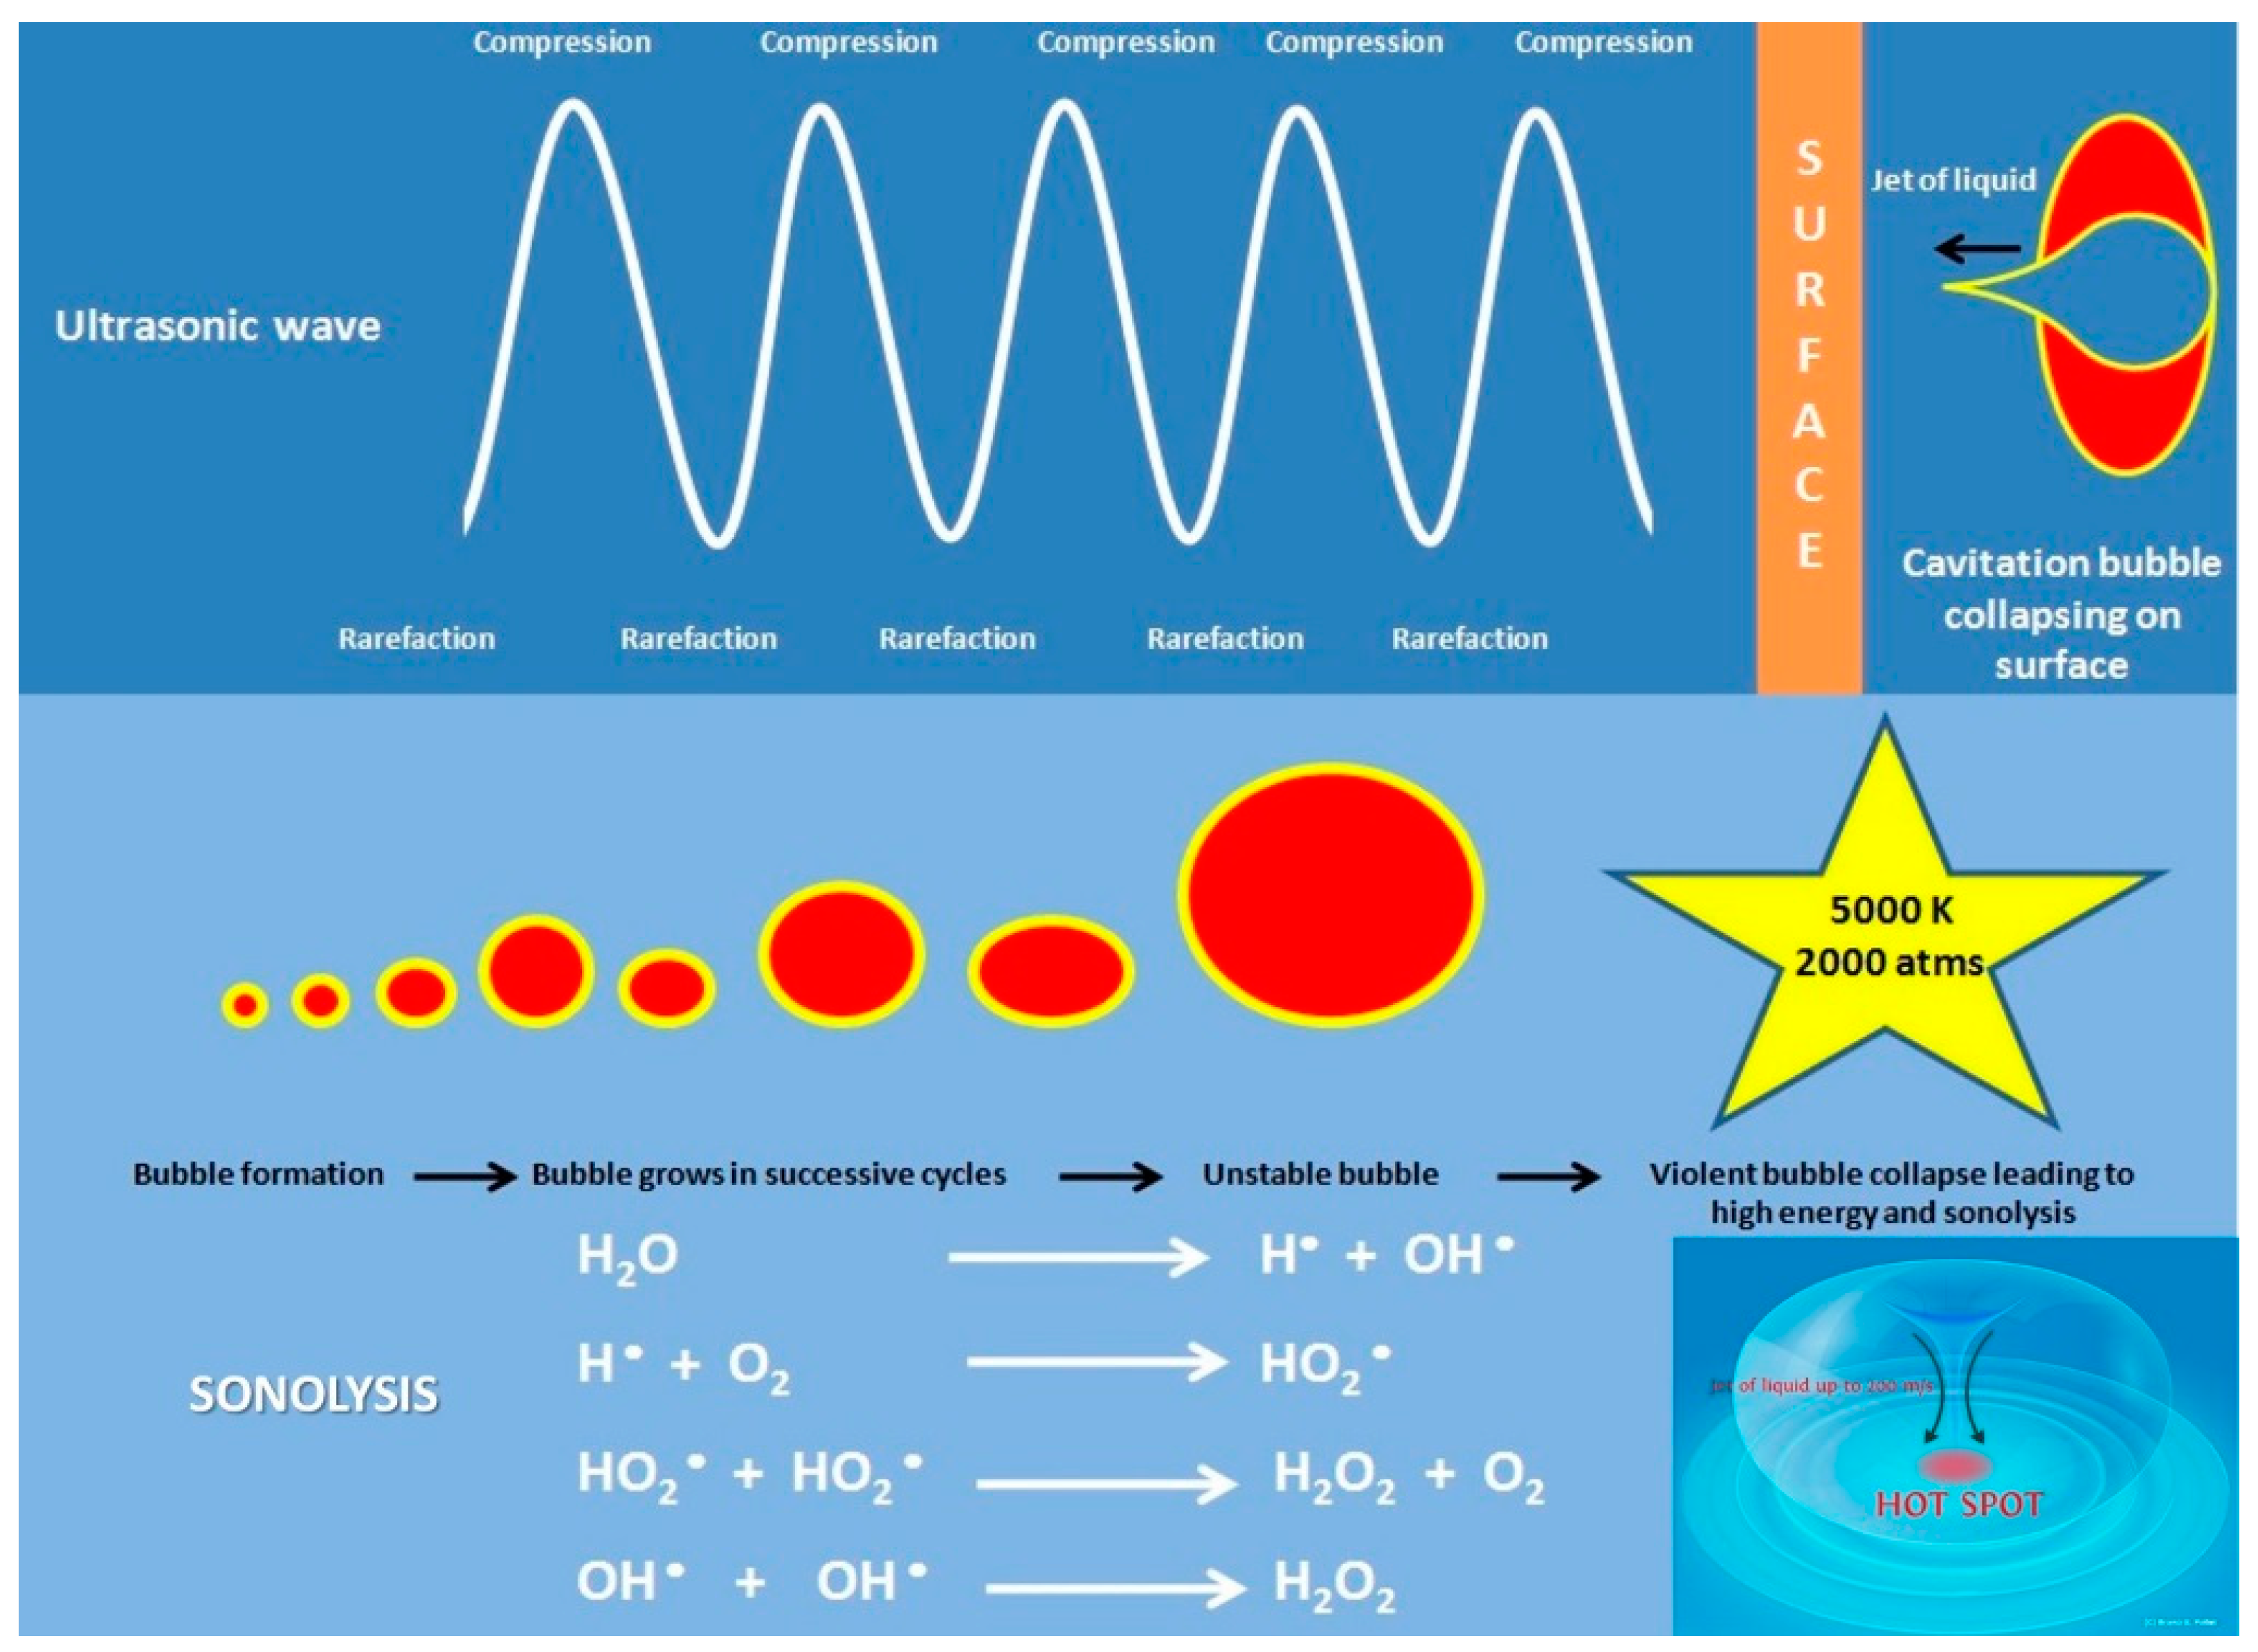
Figure 3.
A cavitation bubble imploding onto a surface [16].
Figure 3.
A cavitation bubble imploding onto a surface [16].

Figure 4.
Schematic of water sonolysis [15].
Figure 4.
Schematic of water sonolysis [15].
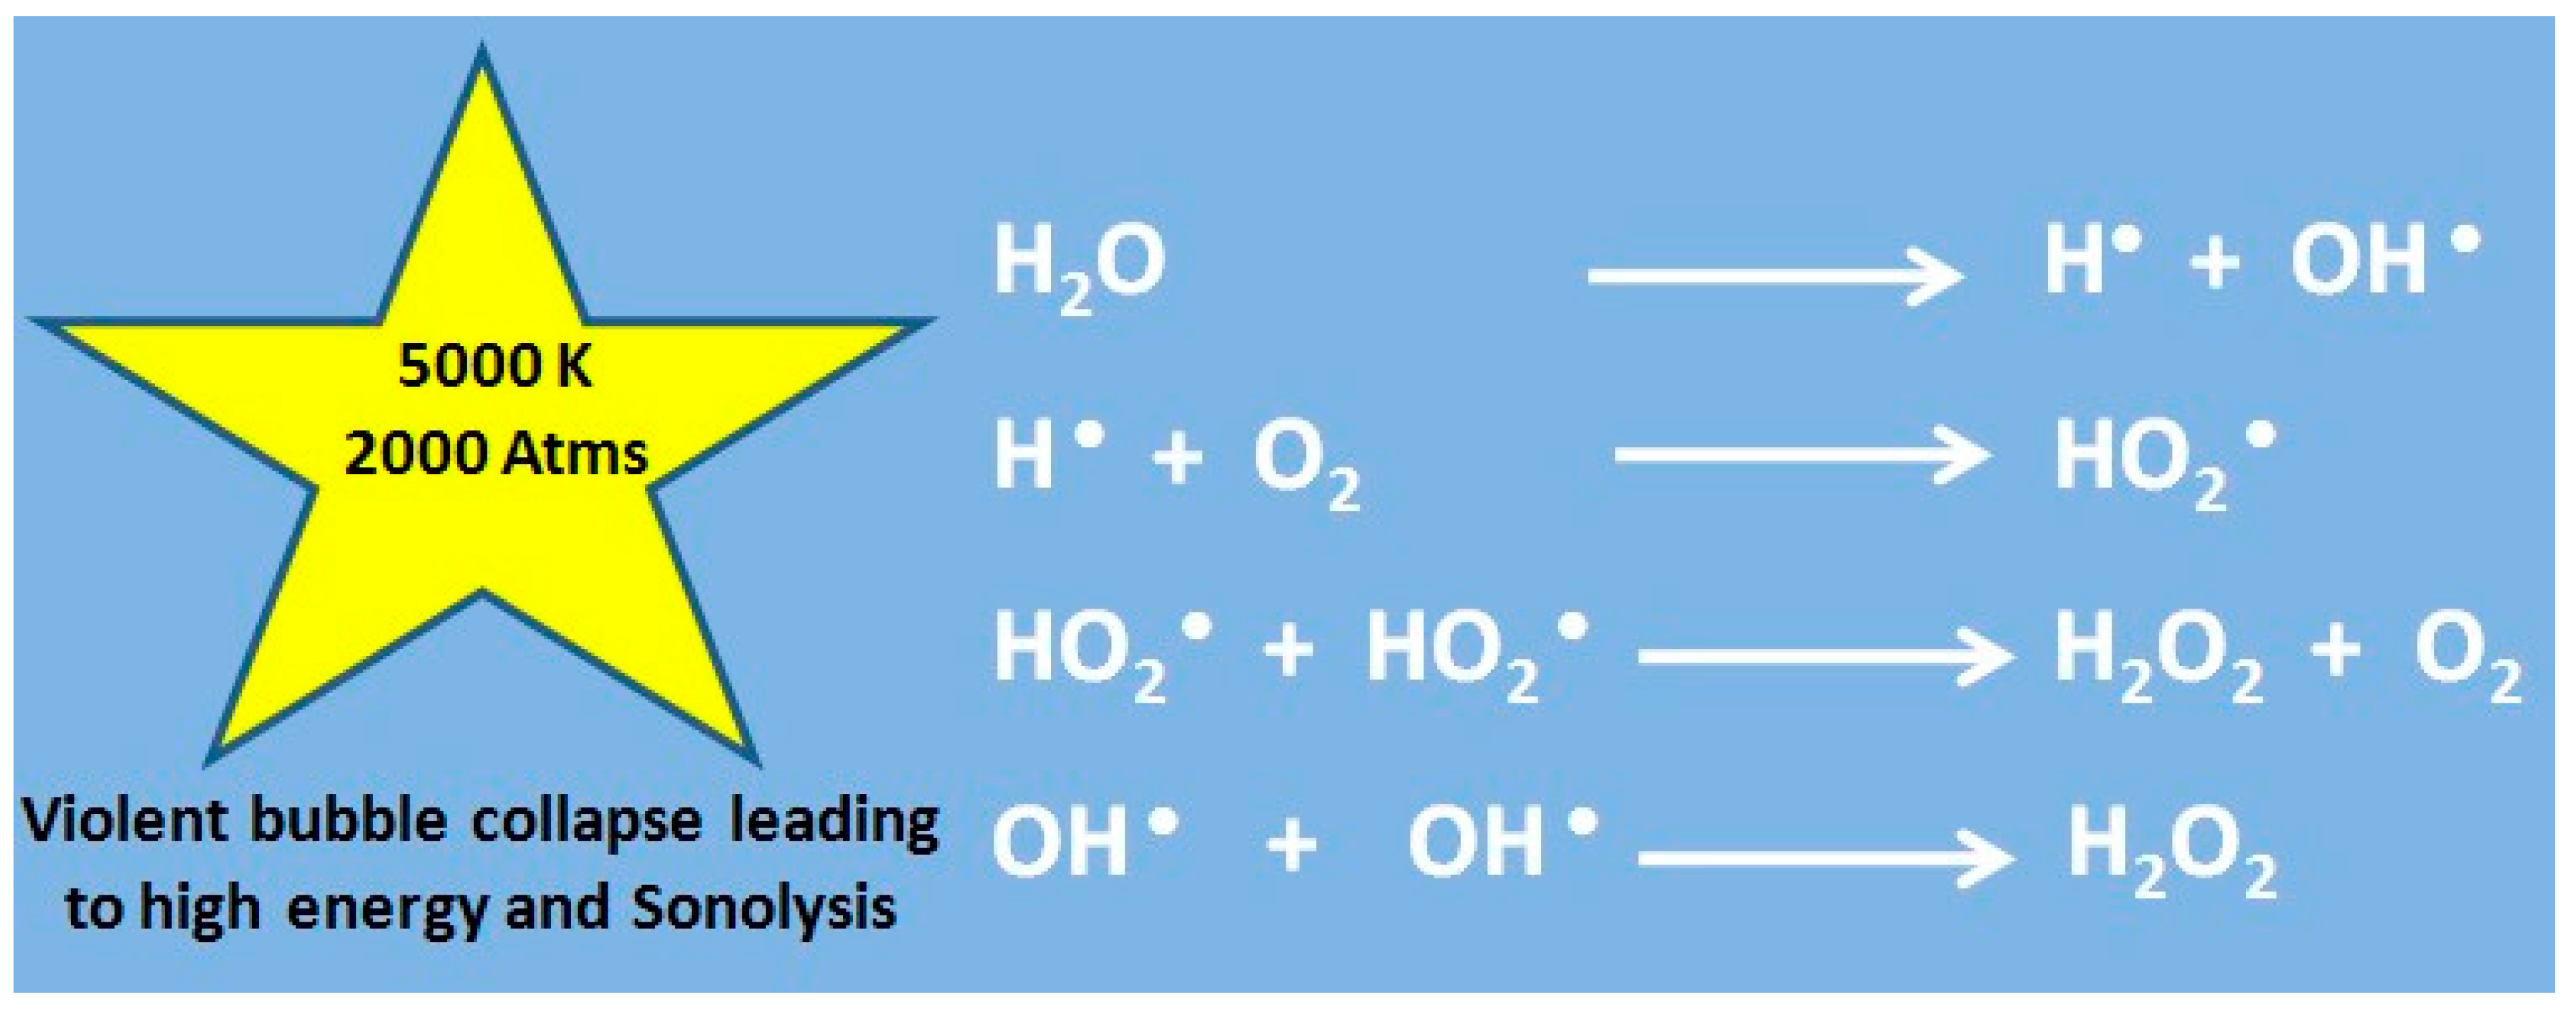
Figure 5.
Concentration profiles and the diffusion layer thickness (δ) in the presence of ultrasound (US) and in the absence (silent).
Figure 5.
Concentration profiles and the diffusion layer thickness (δ) in the presence of ultrasound (US) and in the absence (silent).

Figure 6.
Short summary of the benefits of ultrasound in electrochemistry [19].
Figure 6.
Short summary of the benefits of ultrasound in electrochemistry [19].
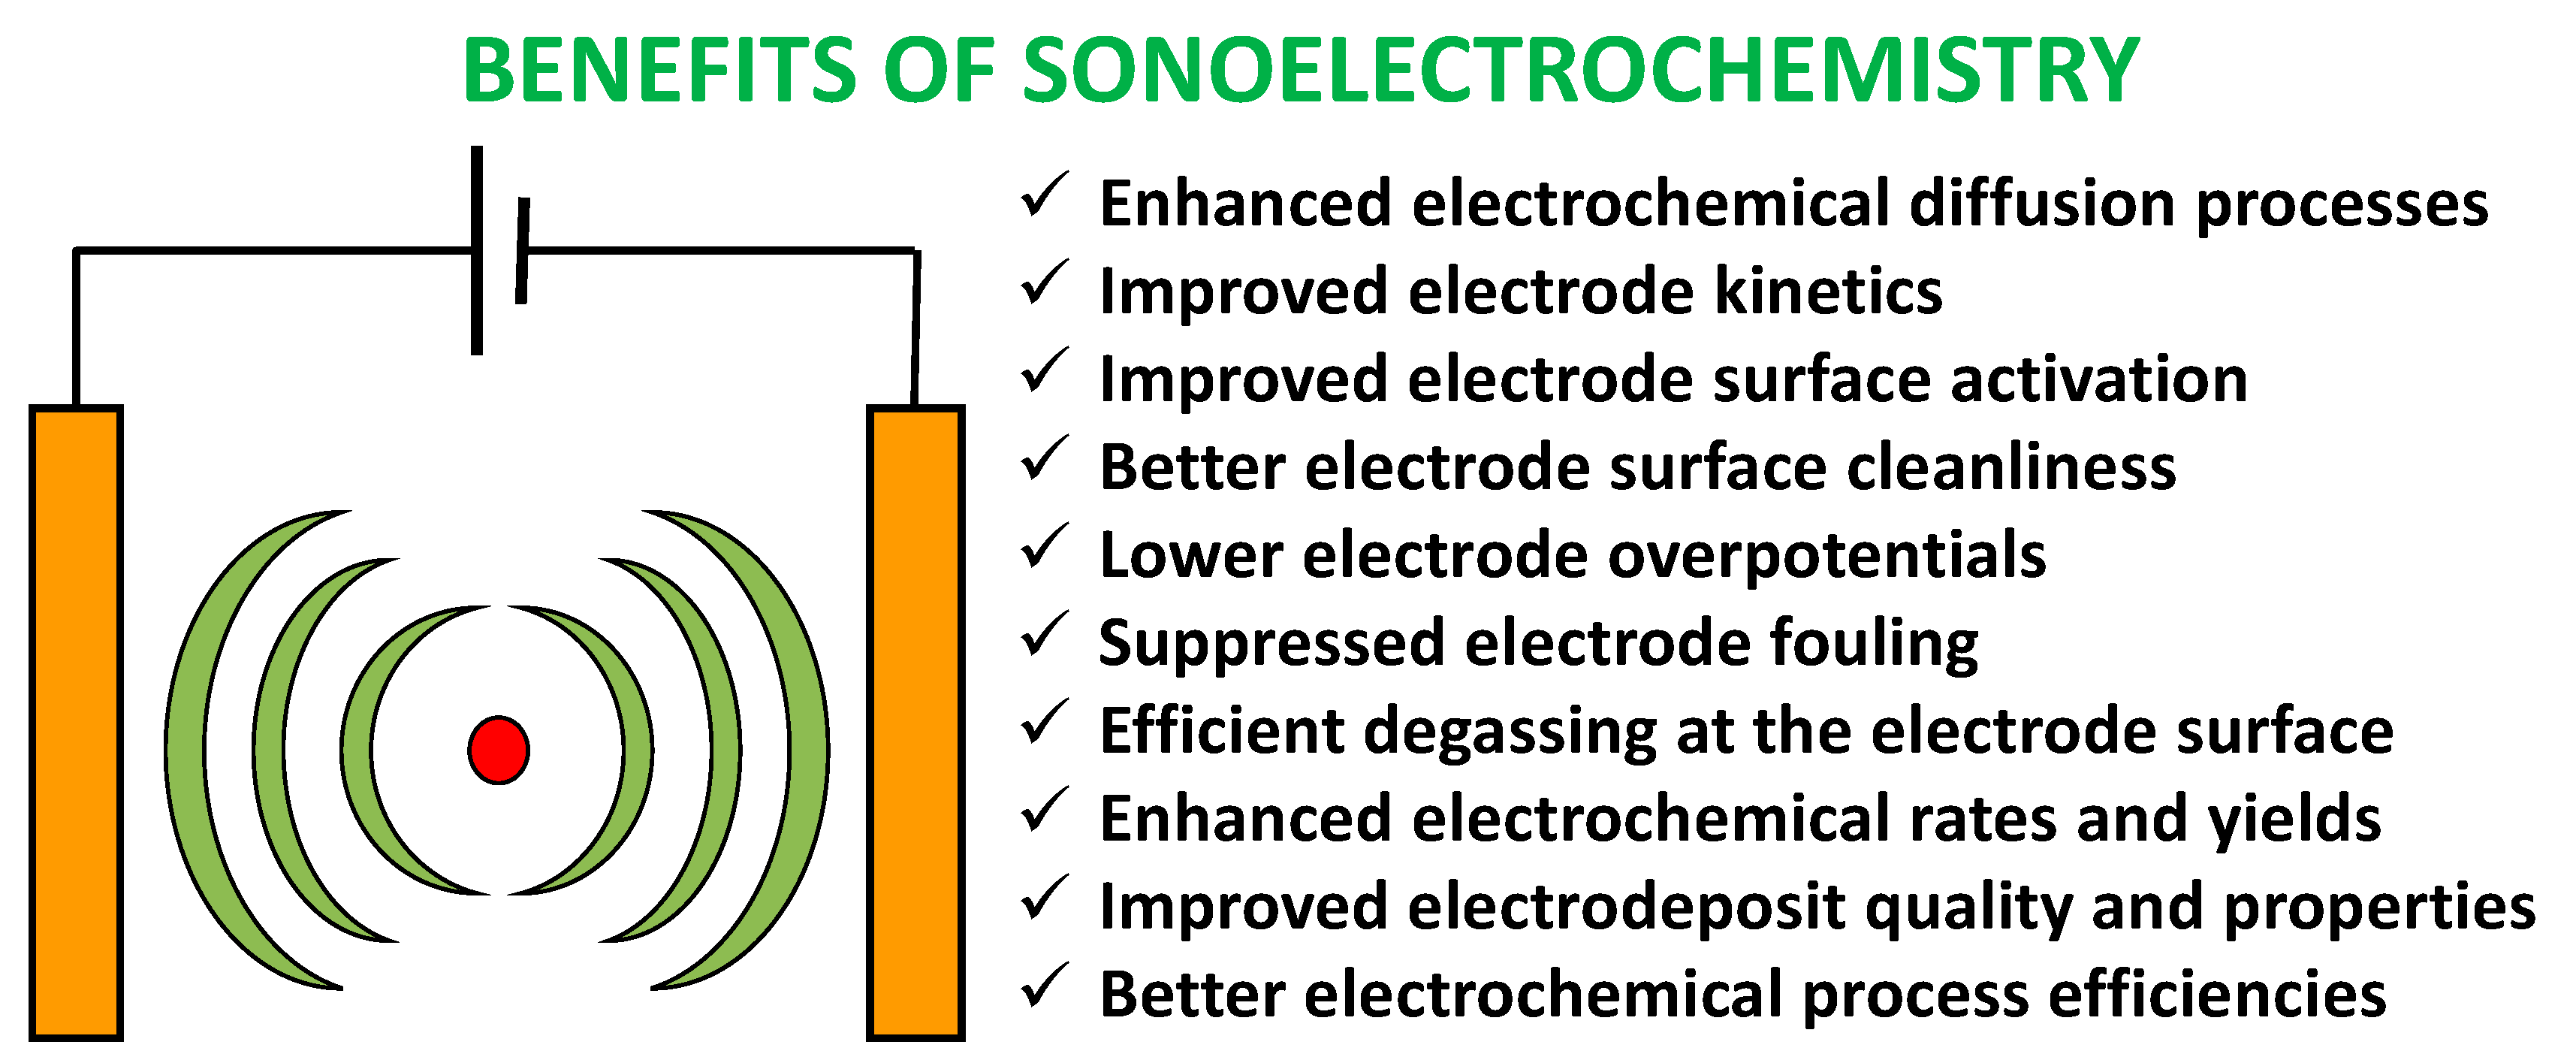
Figure 7.
Sonochemical ((a) ultrasonic probe setup; (b) ultrasonic bath setup) and sonoelectrochemical ((c) ultrasonic probe used as the vibrating cathode) to prepare Proton Exchange Membrane Fuel Cell (PEMFC), Direct Methanol Fuel Cell (DMFC), and Proton Exchange Membrane Water Electrolyzer (PEMWE) electrocatalyst nanoparticles [15]. CE: Counter Electrode, RE: Reference Electrode, WE: Working Electrode.

Figure 8.
Sonochemical reactor or ‘Sonoreactor’ (Besançon cell—Professor Jean-Yves Hihn’s Group, Université de Franche-Comté) to produce PEMFC and PEMWE catalysts.
Figure 8.
Sonochemical reactor or ‘Sonoreactor’ (Besançon cell—Professor Jean-Yves Hihn’s Group, Université de Franche-Comté) to produce PEMFC and PEMWE catalysts.

Figure 9.
Sonoelectrochemical setup for the production of PEMFC and PEMWE catalysts [17,21,22]. GC: Glassy carbon. PTFE: Polytetrafluoroethylene.

Figure 10.
(Clockwise) TEM image, X-ray energy dispersive spectrometry, and XRD patterns of Pt nanoparticles [22].
Figure 10.
(Clockwise) TEM image, X-ray energy dispersive spectrometry, and XRD patterns of Pt nanoparticles [22].

Figure 11.
Representative TEM images of (a) Pt nanoparticles, and (b) Pt nanoparticles formed directly sonoelectrochemically onto the carbon particles. The particle size distribution of the carbon supported Pt nanoparticles is also shown in (c). Modified from [23].
Figure 11.
Representative TEM images of (a) Pt nanoparticles, and (b) Pt nanoparticles formed directly sonoelectrochemically onto the carbon particles. The particle size distribution of the carbon supported Pt nanoparticles is also shown in (c). Modified from [23].

Figure 12.
Various routes for preparing PEMFC, DMFC, and PEMWE catalyst ‘inks’.

Figure 13.
Various preparation methods for gas diffusion electrodes (GDE) and catalyst coated membranes (CCM).
Figure 13.
Various preparation methods for gas diffusion electrodes (GDE) and catalyst coated membranes (CCM).
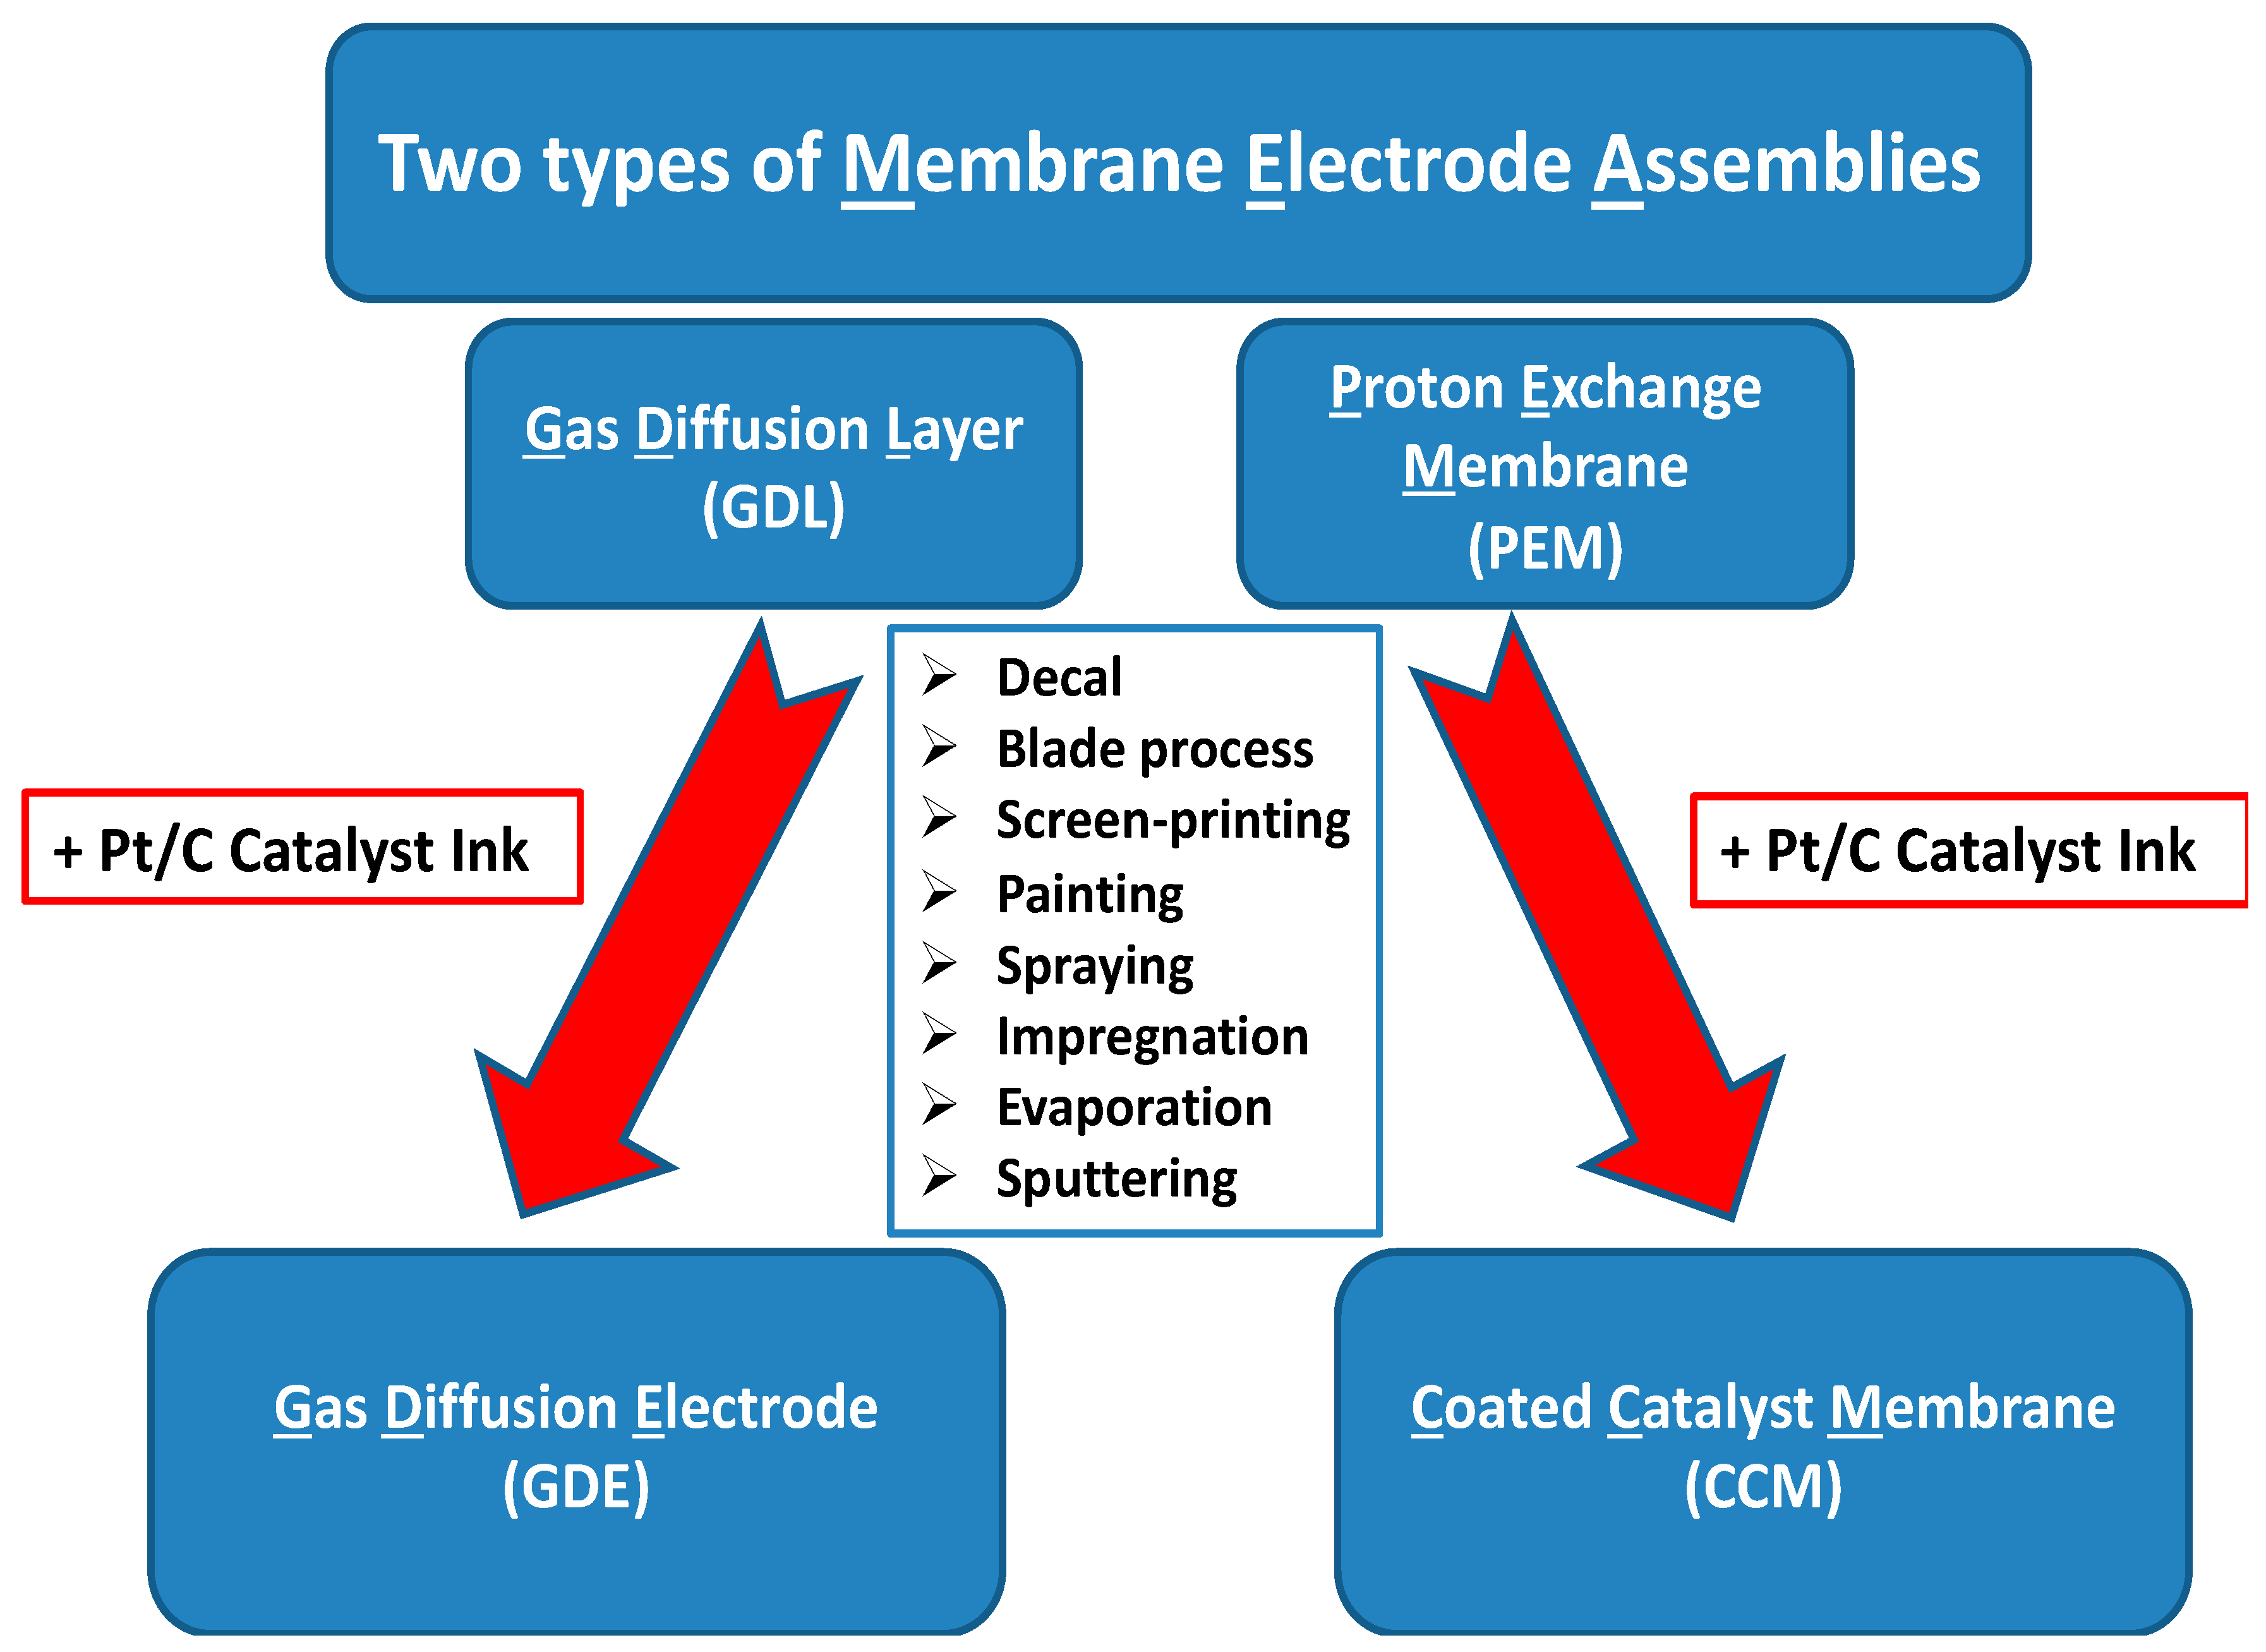
Figure 14.
(a) Sono-Tek Ultrasonic Spray system—‘ExactaCoat’; (b) representation of the vibrating nozzle cross-section; (c) mist formation of the liquid schematic; (d) CCMs for PEMFC, DMFC, and PEMWE manufactured by the Sono-Tek system; (e) representation of nanoparticle de-agglomeration via the ultrasonic-spray method vs. the air spray method [27].
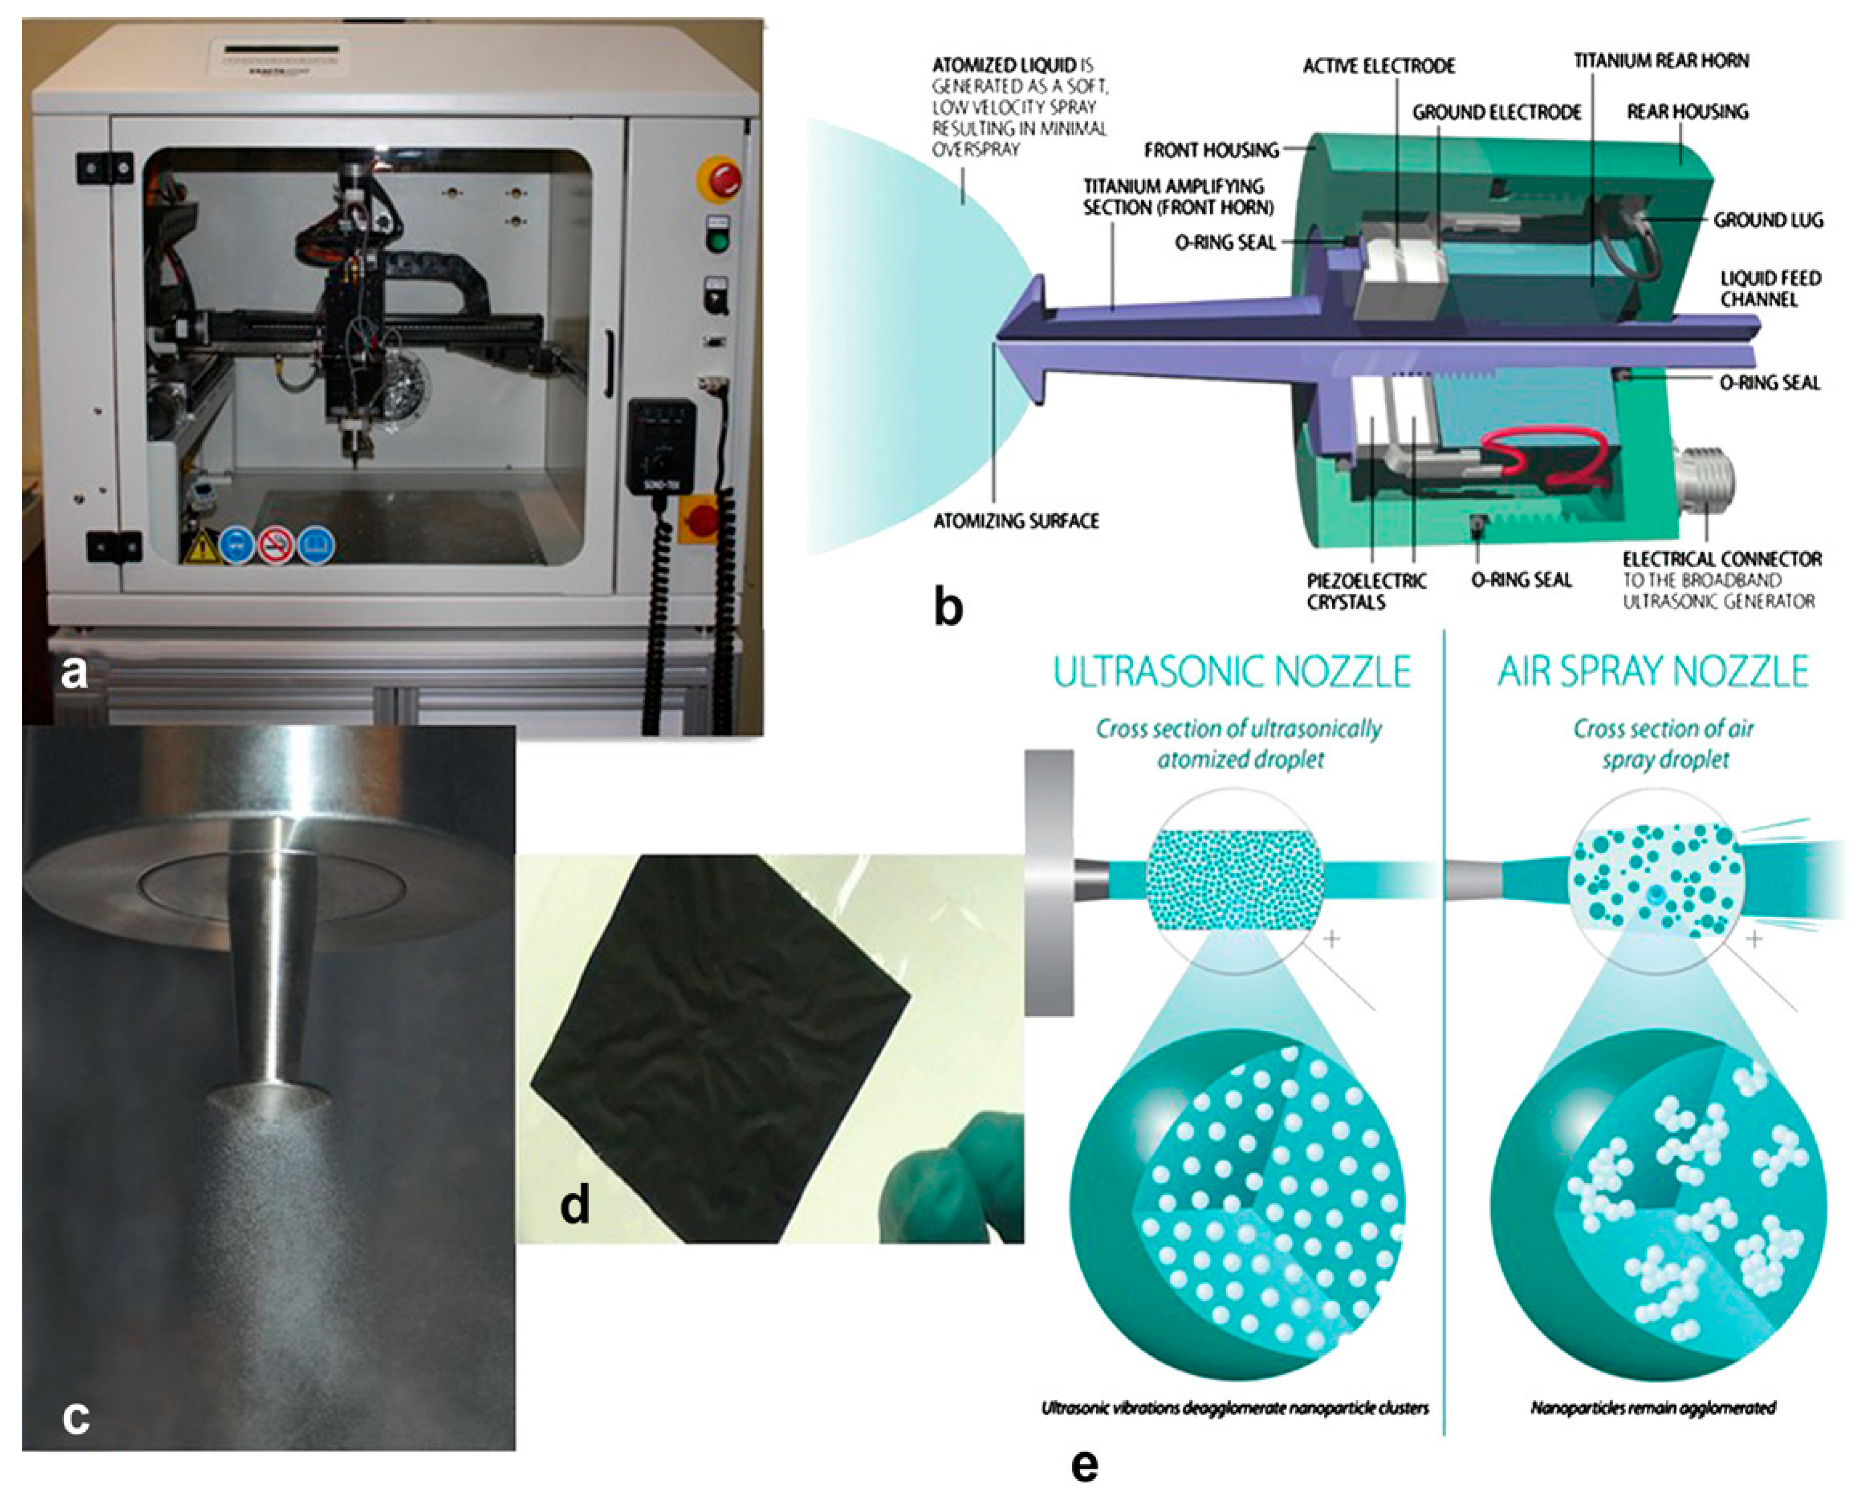
Figure 15.
Polarization and power density curves comparing ultrasonic-sprayed and hand-painted SGL 10BC GDLs. Anode (A) = 50%; cathode (C) = 50%. The loadings for the MEAs were; ultrasonic sprayed: A = 0.05 mg cm−2, C = 0.15 mg cm−2 and hand-painted: A = 0.09 mg cm−2, C = 0.18 mg cm−2 [27].
Figure 15.
Polarization and power density curves comparing ultrasonic-sprayed and hand-painted SGL 10BC GDLs. Anode (A) = 50%; cathode (C) = 50%. The loadings for the MEAs were; ultrasonic sprayed: A = 0.05 mg cm−2, C = 0.15 mg cm−2 and hand-painted: A = 0.09 mg cm−2, C = 0.18 mg cm−2 [27].
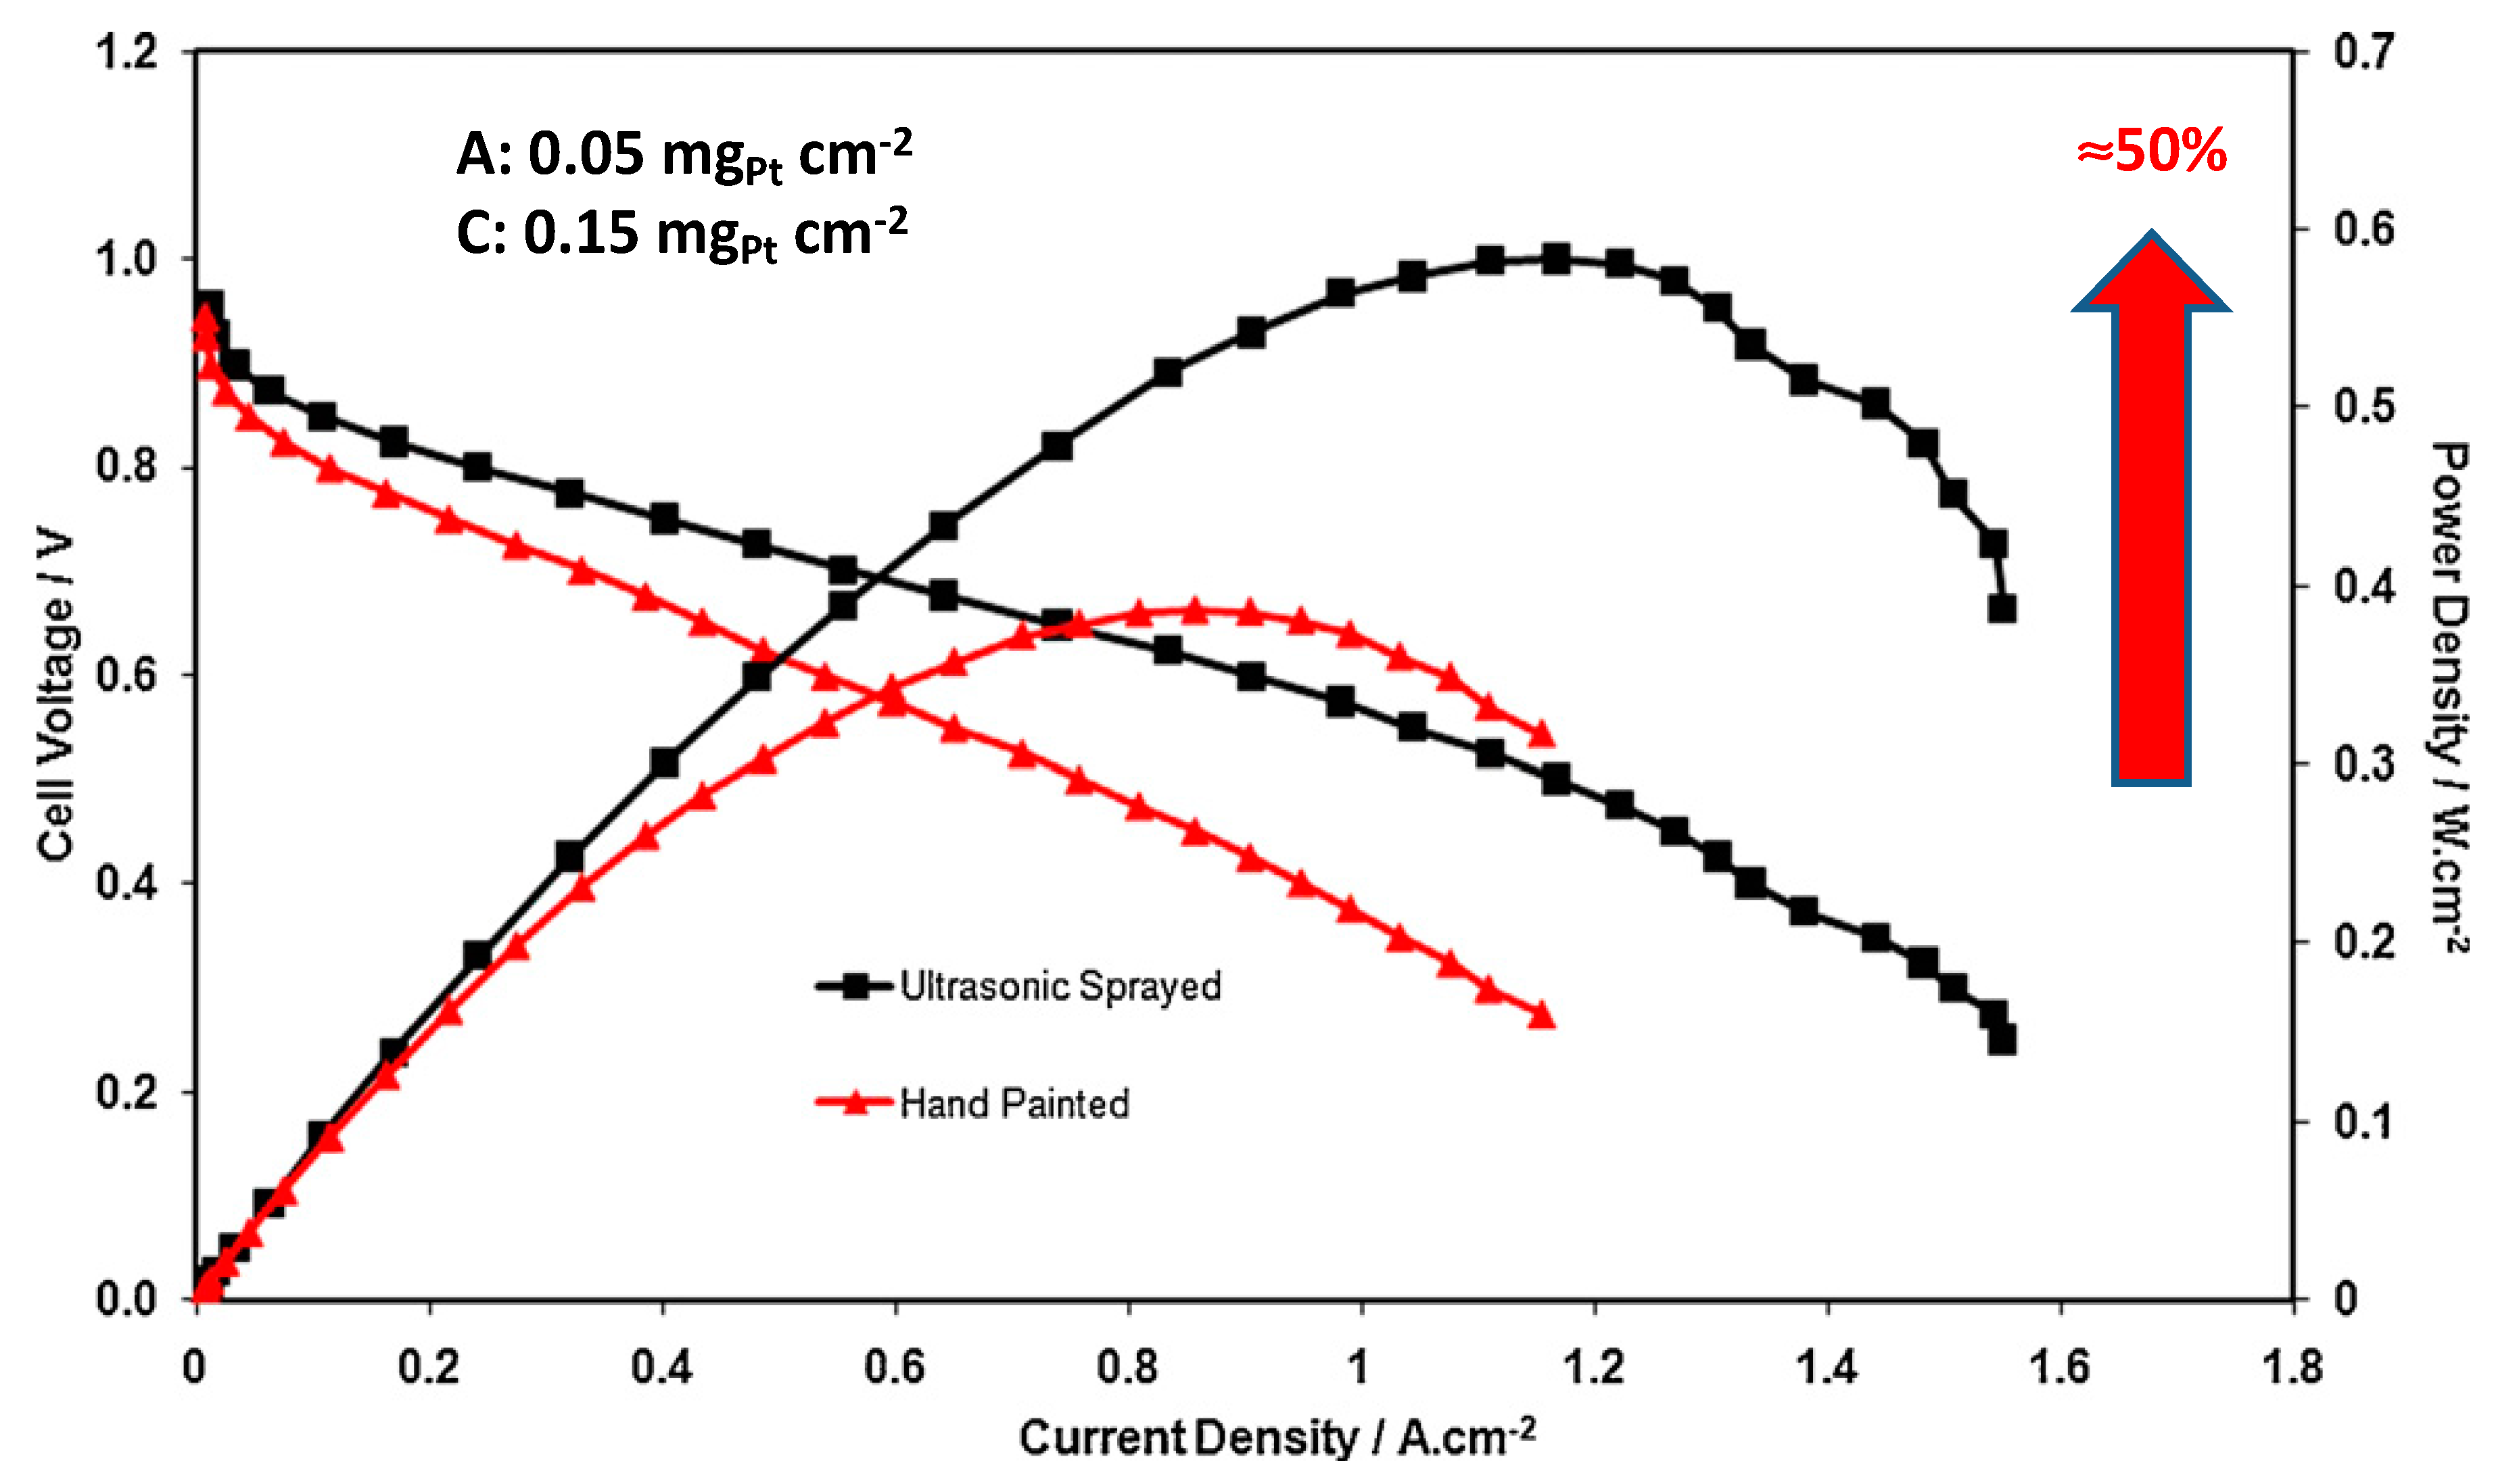
Figure 16.
SEM images: (a) top view and (b) cross-section of the catalyst layer prepared by the ultrasonic-spray method. Pt loading: 0.40 mg cm−2 on Sigracet 10BC GDL, (c) top view and (d) cross-section of catalyst layer (CL) prepared by the US technique. Pt loading: 0.15 mg cm−2 on Sigracet 10BC GDL, (e) top view and (f) cross-section of CL prepared by US. Pt loading is 0.05 mg cm−2 on Sigracet 10BC GDL, (g) top view and (h) cross-section of catalyst layer prepared by hand-painting. Pt loading: 0.40 mg cm−2 on Sigracet 34BC GDL [27].
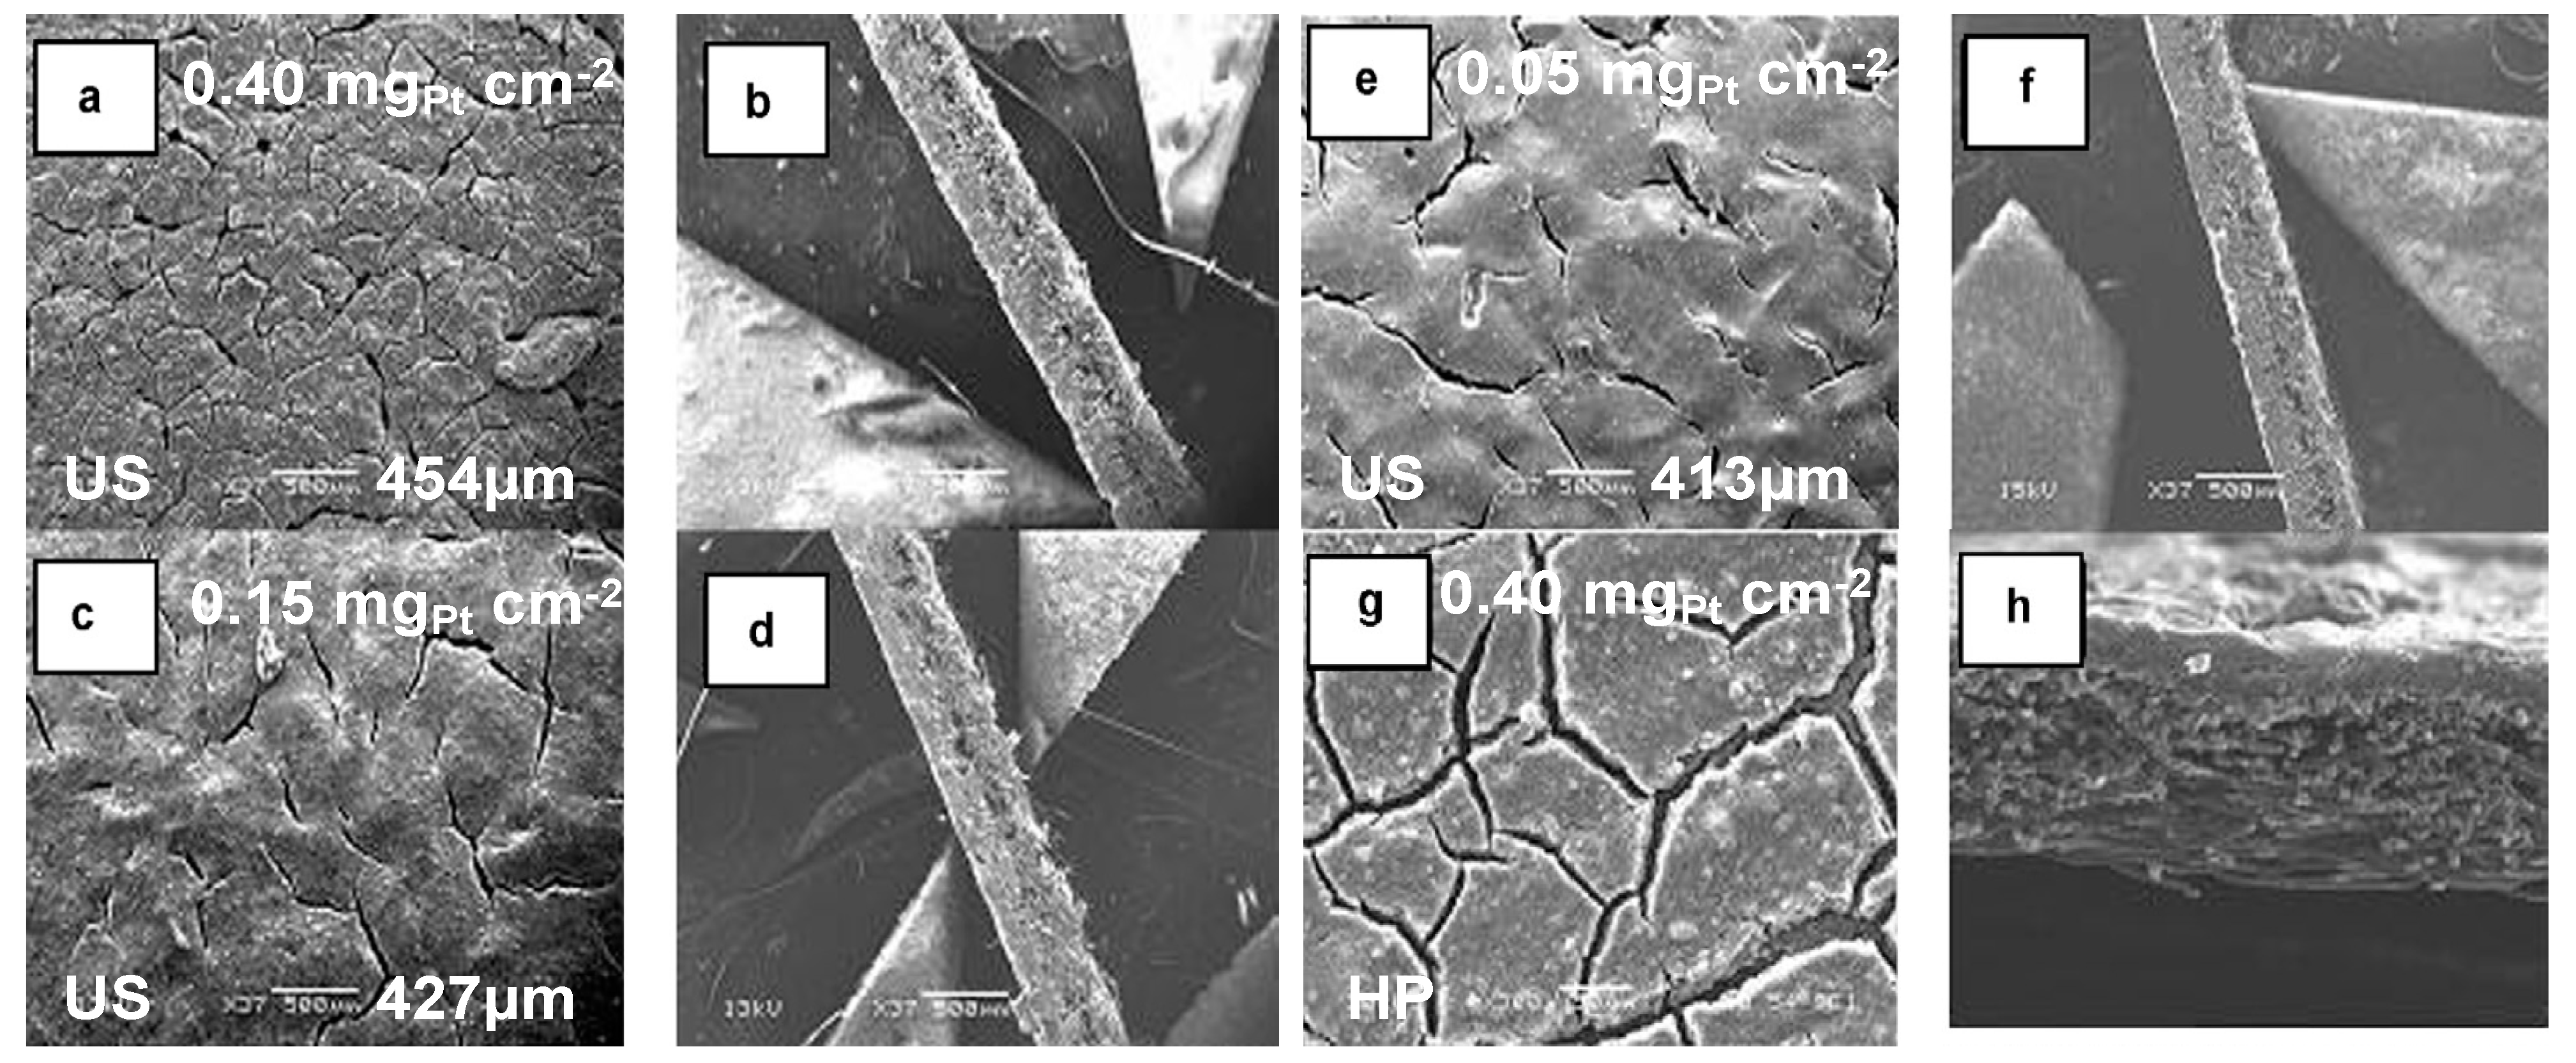
Figure 17.
Column histograms comparing (a) peak power densities and (b) peak power per Pt loading for both hand-painted (P) and ultrasonic-sprayed (US) SGL 10BC GDLs: 0.40 mg cm−2, 0.15 mg cm−2, 0.05 mg cm−2 [27].
Figure 17.
Column histograms comparing (a) peak power densities and (b) peak power per Pt loading for both hand-painted (P) and ultrasonic-sprayed (US) SGL 10BC GDLs: 0.40 mg cm−2, 0.15 mg cm−2, 0.05 mg cm−2 [27].

Figure 18.
I–V and power curves for PEMFC electrodes prepared by (ii) the sonoelectrochemically, (ii) galvanostatic or Pulsed Current (PC) method only (i.e., silent conditions) and (ii) conventional method. Modified from [25].
Figure 18.
I–V and power curves for PEMFC electrodes prepared by (ii) the sonoelectrochemically, (ii) galvanostatic or Pulsed Current (PC) method only (i.e., silent conditions) and (ii) conventional method. Modified from [25].

Figure 19.
(C) Particle size distribution curves: (a) no ultrasound, (b) 2.3 W, (c) 3.2 W, and (d) 4.4 W. (D) SEM pictures of Pt electrodeposited on GDL (a) under silent and (b) ultrasonic (4.4 W) conditions [28].
Figure 19.
(C) Particle size distribution curves: (a) no ultrasound, (b) 2.3 W, (c) 3.2 W, and (d) 4.4 W. (D) SEM pictures of Pt electrodeposited on GDL (a) under silent and (b) ultrasonic (4.4 W) conditions [28].

Table 1.
Sonochemical production of nanosize electrocatalyst materials at several ultrasonic frequencies and powers in the presence of several alcohols and surfactants (adapted from [15]).
Table 1.
Sonochemical production of nanosize electrocatalyst materials at several ultrasonic frequencies and powers in the presence of several alcohols and surfactants (adapted from [15]).
| Noble Metals | Ultrasonic Frequency/kHz | Ultrasonic Power | Surfactant | Solvent | Particle Size/nm |
|---|---|---|---|---|---|
| Ag | 200 | 200 W | SDS, PEG40-MS, Tween20 | Propan-2-ol | 13 ± 3 |
| Pd | 200 | 6.0 W cm−2 | SDS, Tween20, PEG40-MS, PVP | - | 6–110 |
| Pd | 50 | - | PVP, EG | - | 3–6 |
| Ag, Au, Pt, Rh | 200 | 6.0 W cm−2 | Tween20, PEG-MS, SDS, PVP | - | 5 |
| Pt | 200 | 6.0 W cm−2 | SDS | - | 2.6 ± 0.9 |
| Pt | 200 | 200 W | SDS, DBS, PEG-MS, DTAC, DTAB | - | 1 (PEG-MS) 3 (SDS) 3 (DBS) |
| Pt | 20 | 10.0 W cm−2 | - | Ethanol, Propan-1-ol, Pentan-1-ol | 2.6 |
| Pt, Pd | 20 | 100 W | PVP | Propan-2-ol | 2 (N2)–Pd 3.6 (Ar)–Pd 3.2 (N2)–Pt 2.9 (Ar)–Pt 1.5(Xe)–Pt |
| Ag | 20 | 100 W cm−2 | - | Ethanol | 20 (Ar–H2) |
| Pt | 20 | 22 & 27 W cm−2 | PVP, EG | Citrate | < 1 |
| Pt, Au | 42 | - | PVP | - | 6 (Pt) 10 (Au) |
| Au | 20 | 23–47 W cm−3 | - | Methanol, Propan-2-ol, n-pentanol | 7 ± 2 (methanol) 6 ± 4 (propan-2-ol) 5 ± 3 (n-pentanol) |
| Au | 20 | 9 W cm−2 | - | Methanol, 1-Propanol, Butanol | 9–25 (depending on alcohol concentrations) |
| Au | 20,213,358,647&1062 | 0.1 ± 0.01 W cm−3 | - | 1-Propanol | 15–30 |
| Ru | 20,213,355,647&1056 | - | SDS | 1-Propanol | 10–20 |
| Pt–Ru | 20 | 17 W cm−2 | - | Methanol, THF | 2.0 ± 0.1 |
| Pt–Ru | 213 | 110–125 W cm−3 | SDS, PVP | - | 5–10 |
| Pd–Sn | 20 | 42 W cm−2 | - | Citric acid, ethanol | 3–5 |
| Au–Ru | 355 | - | PEG | - | 15 |
| Au (core)–Pd (shell) | 200 | 200 W | SDS | - | 8 [6 nm Au core & 1 nm Pd shell] |
| Au (core)–Pd (shell) | 40 | 100 W | PVP, EG | - | 8 [4 nm Au core & 4 nm Pd shell] |
| Au (core)–Pt (shell) | 200 | 4.2 W cm−2 | SDS, PFG | - | 6.5 ± 1.5 to 10.1 ± 3.6 |
| Au (core)–Ag (shell) | 20 | 23–47 W cm−2 | PEG, EG | - | 20 |
© 2019 by the author. Licensee MDPI, Basel, Switzerland. This article is an open access article distributed under the terms and conditions of the Creative Commons Attribution (CC BY) license (http://creativecommons.org/licenses/by/4.0/).
Share and Cite
MDPI and ACS Style
Pollet, B.G. The Use of Power Ultrasound for the Production of PEMFC and PEMWE Catalysts and Low-Pt Loading and High-Performing Electrodes. Catalysts 2019, 9, 246. https://doi.org/10.3390/catal9030246
AMA Style
Pollet BG. The Use of Power Ultrasound for the Production of PEMFC and PEMWE Catalysts and Low-Pt Loading and High-Performing Electrodes. Catalysts. 2019; 9(3):246. https://doi.org/10.3390/catal9030246
Chicago/Turabian StylePollet, Bruno G. 2019. "The Use of Power Ultrasound for the Production of PEMFC and PEMWE Catalysts and Low-Pt Loading and High-Performing Electrodes" Catalysts 9, no. 3: 246. https://doi.org/10.3390/catal9030246
Note that from the first issue of 2016, this journal uses article numbers instead of page numbers. See further details here.